Fracture Toughness of Polycrystalline Tungsten Alloys
Fracture Toughness of Polycrystalline Tungsten Alloys
Fracture Toughness of Polycrystalline Tungsten Alloys

You also want an ePaper? Increase the reach of your titles
YUMPU automatically turns print PDFs into web optimized ePapers that Google loves.
Gludovatz, Wurster et al. 17th Plansee Seminar 2009, Vol. 1 RM 21/1<br />
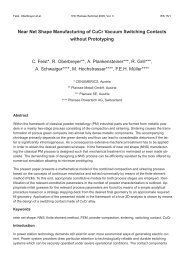
<strong>Fracture</strong> <strong>Toughness</strong> <strong>of</strong> <strong>Polycrystalline</strong> <strong>Tungsten</strong> <strong>Alloys</strong><br />
B. Gludovatz ∗,∗∗ , S. Wurster ∗∗ , A. H<strong>of</strong>fmann ∗∗∗ , R. Pippan ∗,∗∗<br />
∗ CD Laboratory for Local Analysis <strong>of</strong> Deformation and <strong>Fracture</strong>; Leoben, Styria, Austria<br />
∗∗ Erich Schmid Institute <strong>of</strong> Materials Science, Austrian Academy <strong>of</strong> Sciences; Leoben, Styria, Austria<br />
Abstract<br />
∗∗∗ Plansee Metall GmbH; Reutte, Tyrol, Austria<br />
<strong>Tungsten</strong> and tungsten alloys show the typical change in fracture behavior from brittle at low temperatures<br />
to ductile at high temperatures. In order to improve the understanding <strong>of</strong> the effect <strong>of</strong> microstructure the<br />
fracture toughness <strong>of</strong> pure tungsten, potassium doped tungsten, tungsten with 1wt% La2O3 and tungsten<br />
rhenium alloys were investigated by means <strong>of</strong> 3-point bending -, double cantilever beam - and compact<br />
tension specimens. All these materials show the expected increase in fracture toughness with increasing<br />
temperature. The experiments demonstrate that the grain size, texture, chemical composition, grain boundary<br />
segregation and dislocation density seem to have a large effect on fracture toughness below the DBTT.<br />
These influences can be seen in the fracture behavior and morphology, where two kinds <strong>of</strong> fracture occur:<br />
on one hand the transgranular and on the other hand the intergranular fracture. Therefor techniques like<br />
electron backscatter diffraction, auger electron spectroscopy and x-ray line pr<strong>of</strong>ile analysis were used to<br />
improve the understanding <strong>of</strong> the parameters influencing fracture toughness.<br />
Keywords<br />
tungsten, tungsten alloys, fracture toughness, electron backscatter diffraction, ductile to brittle transition,<br />
plastically deformed areas, double cantilever beam specimen<br />
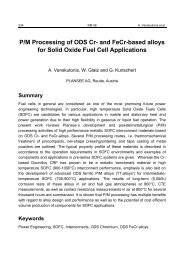
(a) 3PB-specimen (b) DCB-specimen (c) CT-specimen<br />
Figure 1: Different specimen types manufactured out <strong>of</strong> tungsten rods. 3PB-specimen with crack direction in rolling<br />
direction (a). DCB-specimen with crack direction in rolling direction (b). CT-specimen with crack direction in tangential<br />
direction (c).
RM 21/2 17th Plansee Seminar, Vol. 1 Gludovatz, Wurster et al.<br />
Introduction<br />
Most studies related to the ductility <strong>of</strong> tungsten and tungsten alloys were performed in the sixties and seventies<br />
by e.g. Raffo et al. [1]. Since fracture mechanics was not well established at that time the studies on<br />
fracture toughness were scarce. Riedle and Gumbsch [2, 3] extensively studied the fracture toughness <strong>of</strong><br />
tungsten single crystals in the nineties. The effects <strong>of</strong> crystallographic orientation, crack growing direction,<br />
loading rate and temperature were investigated. Compared to the single crystal, the fracture toughness <strong>of</strong><br />
polycrystalline tungsten is not well examined yet.<br />
We started an extensive investigation <strong>of</strong> the fracture toughness <strong>of</strong> pure tungsten (W), potassium doped<br />
tungsten (AKS-W), tungsten with 1wt% La2O3 (WL10) and tungsten-26wt%-rhenium (W26Re). The results<br />
<strong>of</strong> few selected microstructures are presented in this paper. A very large effect <strong>of</strong> the microstructure especially<br />
below the ductile to brittle transition temperature was observed. The investigations indicate that<br />
the change from transgranular to intergranular cleavage fracture plays an important role. Especially crystallographic<br />
analysis are presented to improve the understanding <strong>of</strong> interaction <strong>of</strong> these fracture processes.<br />
This paper is also submitted to the 12 th International Conference on <strong>Fracture</strong> - July 12-17, 2009.<br />
Experimental<br />
The fracture toughness <strong>of</strong> W, AKS-W, WL10 and WRe were investigated by means <strong>of</strong> 3-point bending -<br />
(3PB - fig.1-a), double-cantilever beam - (DCB - fig.1-b) and compact tension specimens (CT - fig.1-c).<br />
All specimens were manufactured out <strong>of</strong> rods during different stages <strong>of</strong> the processing route. Figure 1<br />
shows specimens for tests in rolling- (RD) and tangential direction (TD), additional ones were prepared to<br />
investigate the materials in normal direction (ND). The experiments were performed in the range <strong>of</strong> -196 ◦ C<br />
to more than 1000 ◦ C.<br />
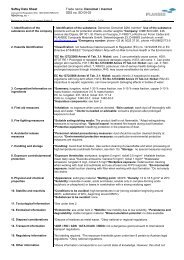
In order to examine the local variation <strong>of</strong> the fracture resistance DCB-specimen (fig. 2-a) with a length <strong>of</strong><br />
30mm, a height <strong>of</strong> 3.5mm and width <strong>of</strong> 7.5mm respectively CT-specimen with a length <strong>of</strong> 7.5mm, a height<br />
<strong>of</strong> 3mm and a width <strong>of</strong> 6mm were manufactured out <strong>of</strong> W-, AKS-W-, and WRe-rods. The notches were<br />
prepared with a diamond-saw, refined with a razor blade and fatigue-precracked under cyclic compression.<br />
The areas in front <strong>of</strong> the crack-tips were scanned by electron backscatter diffraction (EBSD) after a heat<br />
treatment <strong>of</strong> about 2000 ◦ C for an hour in hydrogen atmosphere (fig. 2-b). Some specimens were then<br />
loaded under tension within the range <strong>of</strong> stable crack growth (fig. 2-c). After that the previously scanned<br />
areas were scanned again by EBSD (fig. 2-d) to quantify changes <strong>of</strong> the grain orientation in the obtained<br />
orientation imaging maps (OIM).<br />
The tests performed at room temperature were done with a microtensile-testing machine <strong>of</strong> the company<br />
Kammrath & W eiss while the tests at elevated temperatures were done by use <strong>of</strong> a ZW ICK universaltesting<br />
machine. The analyses were made by use <strong>of</strong> a Zeiss 1525 scanning electron microscope equipped<br />
with an EDAX EBSD system.<br />
Figure 2: Experimental setup to investigate the local variation <strong>of</strong> the fracture resistance: Position <strong>of</strong> a DCB-specimen<br />
in a AKS-W rod (a). Scanning the area in front <strong>of</strong> the crack-tip by EBSD (b). Apply a tensile load on the specimen<br />
(c). Scanning the previously scanned area again (d).
Gludovatz, Wurster et al. 17th Plansee Seminar 2009, Vol. 1 RM 21/3<br />
Figure 3: <strong>Fracture</strong> toughness KIC <strong>of</strong> W, AKS-W, WL10 (sintered) and W26Re (rolled) as a function <strong>of</strong> temperature T .<br />
Results and Discussion<br />
<strong>Fracture</strong> <strong>Toughness</strong> Investigations<br />
All tested specimens showed the expected increase in fracture toughness with increasing temperature,<br />
examples are shown in figure 3. At low temperatures the fracture toughness was determined by use<br />
<strong>of</strong> linear elastic fracture mechanics whereas at temperatures above 600 ◦ C the critical crack tip opening<br />
displacement CT OD [4] was used to determine the critical stress intensity factor. The fracture toughness<br />
determined by stereophotogrammetric techniques is then calculated by<br />
KIC = m · σy · E · CODC<br />
where σy represents the yield strength, E the Young’s modulus and m a coefficient which depends on the<br />
work hardening factor m <strong>of</strong> the material. For low hardening m is about 0.5 [5].<br />
Table 1 shows fracture toughness values <strong>of</strong> CT and 3PB specimens tested at room temperature. The two<br />
letter code in the brackets describes the crack plane orientation <strong>of</strong> different specimens with respect to the<br />
geometry <strong>of</strong> the manufactured material. The first letter designates the direction normal to the crack plane,<br />
and the second letter the expected direction <strong>of</strong> crack propagation [6]. Due to the extreme differences <strong>of</strong> the<br />
determined KIC values, the processing route seems to have a great influence on the results as well as the<br />
direction the specimens have been manufactured out <strong>of</strong> the rods. Additionally it has to be mentioned that<br />
different specimens from the same wires show sometimes large differences. This is probably an effect <strong>of</strong><br />
the location <strong>of</strong> the tested volume in the wire <strong>of</strong> the material as the texture changes from the center to the<br />
edge <strong>of</strong> the wire and also becomes more pronounced the thinner the wires are.<br />
(1)
RM 21/4 17th Plansee Seminar, Vol. 1 Gludovatz, Wurster et al.<br />
Table 1: KIC values <strong>of</strong> W and W-alloy specimens tested at room temperature<br />
Material Condition Rod ∅ Tests performed KIC<br />
mm MPa √ m<br />
W as sintered 23 CT 5.1<br />
rolled 9 CT (C-R) 4.69<br />
forged 25 3PB (L-R) 8.01<br />
rolled 9 3PB (L-R) 9.08<br />
rolled 4 3PB (L-R) 5.43<br />
rolled and drawn 1 3PB (L-R) 35.09<br />
WL as sintered 23 CT 4.72<br />
rolled 9 CT (C-R) 5.99<br />
forged 25 3PB (L-R) 16.56<br />
rolled 9 3PB (L-R) 9.77<br />
rolled 4 3PB (L-R) 9.74<br />
AKS-W as sintered 23 CT 6.45<br />
rolled 9 CT (C-R) 4.50<br />
rolled 9 3PB (L-R) 32.07<br />
rolled 4 3PB (L-R) 13.48<br />
rolled and drawn 1 3PB (L-R) 32.06<br />
WRe (26%) forged 25 3PB (L-R) 54.24<br />
Examination <strong>of</strong> the local variation <strong>of</strong> fracture resistance<br />
For a better understanding <strong>of</strong> the local variation <strong>of</strong> the fracture resistance the DCB-specimens were tested<br />
with a microtensile-testing - or a universal-testing machine as mentioned earlier. The crack path was<br />
recorded by EBSD. In the case <strong>of</strong> the potassium doped tungsten tested at RT the inverse polfigures (IPF)<br />
and fracture surfaces show two types <strong>of</strong> fracture behavior (fig. 4), on one hand the crack propagates intergranular<br />
(ig) and on the other hand also transgranular (tg) though the fraction <strong>of</strong> transgranular crack<br />
(a) intergranular (b) transgranular<br />
Figure 4: Intergranular (a) and transgranular (b) propagated crack <strong>of</strong> a DCB-specimen manufactured <strong>of</strong> AKS-W and<br />
tested at RT .
Gludovatz, Wurster et al. 17th Plansee Seminar 2009, Vol. 1 RM 21/5<br />
Figure 5: Small angle tilt boundary <strong>of</strong> geometrically necessary dislocations generated by the crack tip. The tilting <strong>of</strong><br />
the crystal in the crack-wake can be associated with a shear in the crack propagation direction.<br />
propagation prevails. Orientation changes within single grains in the interior <strong>of</strong> an intergranular propagated<br />
crack (fig. 4-a) as well as changes within grains in the case <strong>of</strong> a transgranular propagated crack (fig. 4-b)<br />
were observed and are clearly viewable through the gradual change in color in both pictures <strong>of</strong> figure 4.<br />
Such deformations are not frequently observable and are just very localized along the crack path <strong>of</strong> a RT -<br />
tested specimen.<br />
Figure 5 shows how to correlate the change in orientation with plastic deformation. A narrow band <strong>of</strong> geometrically<br />
necessary dislocations (GND)- generated by the crack tip - is arranged one after the next in a<br />
small angle tilt boundary. The volume elements below the boundary are rotated with respect to the elements<br />
above. This rotation can be associated with a tilt <strong>of</strong> crystals which leads to a shear in the direction<br />
<strong>of</strong> the crack propagation [7].<br />
Measurements <strong>of</strong> the misorientation in the case <strong>of</strong> the intergranular propagated crack show a maximum<br />
value <strong>of</strong> about 4 degrees whereas the transgranular propagated crack leads to a maximum orientation<br />
change <strong>of</strong> about 5 degrees.<br />
The DCB-specimens tested at elevated temperatures are shown in figure 6-b/6-c and compared with the<br />
specimen tested at RT (fig. 6-a). It can be seen that the amount <strong>of</strong> plastically deformed areas within<br />
single grains does not significantly increase from a RT -tested specimen to a 300 ◦ C-tested specimen or<br />
a 600 ◦ C-tested specimen. Misorientation measurements within the grains also show that the values are<br />
(a) RT (b) 300 ◦ C (c) 600 ◦ C<br />
Figure 6: Plastically deformed areas along the crack paths <strong>of</strong> potassium doped tungsten DCB-specimens tested at<br />
RT (a), 300 ◦ C (b) and 600 ◦ C (c).
RM 21/6 17th Plansee Seminar, Vol. 1 Gludovatz, Wurster et al.<br />
(a) RT (b) 300 ◦ C (c) 600 ◦ C<br />
Figure 7: Plastically deformed areas along the crack paths <strong>of</strong> tungsten rhenium CT-specimens tested at RT (a),<br />
300 ◦ C (b) and 600 ◦ C (c).<br />
always in the range between 4 and 6 degrees. However the frequency <strong>of</strong> deformed grains is increasing<br />
with increasing temperature. In the case <strong>of</strong> RT - and 300 ◦ C-tested specimens the deformation was just<br />
observed directly along the crack path whereas the 600 ◦ C-tested specimen showed plastically deformed<br />
areas also in a wider vicinity <strong>of</strong> the propagated crack.<br />
The compact tension specimens manufactured <strong>of</strong> a W26Re alloy were fractured at room temperature and<br />
at elevated temperatures. Figure 7 shows scans <strong>of</strong> all specimens after fracture. Compared to the AKS-<br />
W-specimens these IPF show much more plastically deformed areas. Plastically deformed grains in the<br />
direct vicinity <strong>of</strong> the propagated crack were just observed at the RT -tested specimen (fig. 7-a). The 300 ◦ Cand<br />
600 ◦ C-tested samples (fig. 7-b and fig. 7-c) show also plastification in the wider vicinity <strong>of</strong> the crack.<br />
Measured misorientations <strong>of</strong> about 10 degrees at the 300 ◦ C- and about 14 degrees at the 600 ◦ C-tested<br />
specimens are much higher than the values <strong>of</strong> the AKS-W-specimens.<br />
In order to quantify the effect <strong>of</strong> local varying fracture resistances further investigations on different microstructures<br />
will be performed and described in a forthcoming paper.<br />
Acknowledgements<br />
The financial support by the “Christian Doppler Forschungsgesellschaft” is gratefully acknowledged.<br />
A part <strong>of</strong> this work, supported by the European Communities under the Contract <strong>of</strong> Association between<br />
EURATOM and the Austrian Academy <strong>of</strong> Sciences, was carried out within the framework <strong>of</strong> the European<br />
Fusion Development Agreement. The views and opinions expressed herein do not necessarily reflect those<br />
<strong>of</strong> the European Commission.<br />
The interesting discussions with Pr<strong>of</strong>. R. Stickler and provided documents is thankfully acknowledged.
Gludovatz, Wurster et al. 17th Plansee Seminar 2009, Vol. 1 RM 21/7<br />
References<br />
[1] P.L. Raffo. Yielding and fracture in tungsten and tungsten-rhenium alloys. Journal <strong>of</strong> the Less Common<br />
Metals, 17:133–149, 1969.<br />
[2] J. Riedle. Bruchwiderstand in Wolfram-Einkristallen: Einfluss der kristallographischen Orientierung, der<br />
Temperatur und der Lastrate, volume 18: Mechanik/Bruchmechanik. VDI Verlag, 1990.<br />
[3] P. Gumbsch. Modeling and simulation in materials science. Summer School <strong>of</strong> <strong>Fracture</strong>, Udine (lecture<br />
notes), 2005.<br />
[4] O. Kolednik and H.P. Stüwe. The stereophotogrammetric determination <strong>of</strong> the critical crack tip opening<br />
displacement. Engineering <strong>Fracture</strong> Mechanics, 21:145–155, 1985.<br />
[5] O. Kolednik and H.P. Stüwe. A proposal for estimating the slope <strong>of</strong> the blunting line. International<br />
Journal <strong>of</strong> <strong>Fracture</strong>, 33:R63–R66, 1987.<br />
[6] ASTM E 399-90. Standard Test Method for Plane-Strain <strong>Fracture</strong> <strong>Toughness</strong> <strong>of</strong> Metallic Materials, Annual<br />
Book <strong>of</strong> ASTM Standards, volume 03.01. American Society for Testing and Materials, 1991.<br />
[7] R. Pippan, G. Strobl, H. Kreuzer, and C. Motz. Asymmetric crack wake plasticity - a reason for roughness<br />
induced crack closure. Acta Materialia, 52:4493–4502, 2004.