A Template-Based Multi-Player Action Recognition of the Basketball ...
A Template-Based Multi-Player Action Recognition of the Basketball ...
A Template-Based Multi-Player Action Recognition of the Basketball ...

Create successful ePaper yourself
Turn your PDF publications into a flip-book with our unique Google optimized e-Paper software.
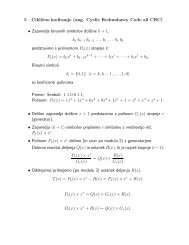
<strong>the</strong> playbook database and <strong>the</strong>n calculate <strong>the</strong> average template penalty. Finally<br />
<strong>the</strong> unknown action is assigned <strong>the</strong> label <strong>of</strong> template or templates that have <strong>the</strong><br />
smallest penalty but only if <strong>the</strong>ir penalty is 10 % smaller <strong>the</strong>n <strong>the</strong> average one.<br />
This way we prevent <strong>the</strong> wrong recognition <strong>of</strong> action in cases when <strong>the</strong> observed<br />
action is not in <strong>the</strong> database. Figure 5 shows <strong>the</strong> results <strong>of</strong> matching 17 different<br />
templates to a ”Flex” <strong>of</strong>fense action.<br />
5<br />
4.5<br />
4<br />
3.5<br />
3<br />
2.5<br />
2<br />
1.5<br />
1<br />
0.5<br />
0<br />
0 2 4 6 8 10 12 14 16 18<br />
a)<br />
<strong>Player</strong>1 <strong>Player</strong>2<br />
Bb)<br />
<strong>Player</strong>3 <strong>Player</strong>4 <strong>Player</strong>5<br />
Ac)<br />
ad) ae)<br />
af)<br />
Fig. 5. (a) Results <strong>of</strong> matching ”Flex” action to 17 different templates. Green (upper)<br />
straight line shows <strong>the</strong> average penalty and red (lower) line shows <strong>the</strong> 10% boundary. (bf)<br />
Figures show <strong>the</strong> ideal player paths as defined in <strong>the</strong> ”Flex” template (black straight<br />
line) and successfully matched player trajectories <strong>of</strong> four different ”Flex” actions.<br />
4 Experimental results<br />
To test <strong>the</strong> recognition accuracy on large and small scales <strong>of</strong> <strong>the</strong> game wedesigned<br />
two separate sets <strong>of</strong> experiments. For <strong>the</strong> evaluation <strong>of</strong> large-scale recognition,<br />
we acquired about 40 minutes <strong>of</strong> real game trajectories (60700 trajectory<br />
samples). Our goal was to determine how <strong>the</strong> amount <strong>of</strong> training data and <strong>the</strong><br />
number <strong>of</strong> Gaussian models used to represent <strong>the</strong> game phases influence <strong>the</strong> final<br />
recognition result. As it can be observed in Table 3, <strong>the</strong> best classification results<br />
were obtained when <strong>the</strong> mixture <strong>of</strong> two Gaussian models was used to model<br />
each game phase (Fig. 3 b). The explanation for this is that when using more<br />
components <strong>the</strong> model tends to over-fit <strong>the</strong> training data. The two components<br />
mixture could also be explained as a model <strong>of</strong> <strong>the</strong> transition from one phase to<br />
ano<strong>the</strong>r and <strong>the</strong> model <strong>of</strong> <strong>the</strong> main behavior during that phase. We can also<br />
80