On the Utility of E-Learning in Statistics - Sfb649 Wiwi Hu Berlin ...
On the Utility of E-Learning in Statistics - Sfb649 Wiwi Hu Berlin ...
On the Utility of E-Learning in Statistics - Sfb649 Wiwi Hu Berlin ...

Create successful ePaper yourself
Turn your PDF publications into a flip-book with our unique Google optimized e-Paper software.
SFB 649 Discussion Paper 2007-050<br />
<strong>On</strong> <strong>the</strong> <strong>Utility</strong> <strong>of</strong><br />
E-<strong>Learn<strong>in</strong>g</strong> <strong>in</strong> <strong>Statistics</strong><br />
Wolfgang Härdle*<br />
Sigbert Kl<strong>in</strong>ke*<br />
Uwe Ziegenhagen*<br />
* <strong>Hu</strong>mboldt-Universität zu Berl<strong>in</strong>, Germany<br />
This research was supported by <strong>the</strong> Deutsche<br />
Forschungsgeme<strong>in</strong>schaft through <strong>the</strong> SFB 649 "Economic Risk".<br />
http://sfb649.wiwi.hu-berl<strong>in</strong>.de<br />
ISSN 1860-5664<br />
SFB 649, <strong>Hu</strong>mboldt-Universität zu Berl<strong>in</strong><br />
Spandauer Straße 1, D-10178 Berl<strong>in</strong><br />
SFB 6 4 9 E C O N O M I C R I S K B E R L I N
<strong>On</strong> <strong>the</strong> <strong>Utility</strong> <strong>of</strong> E-<strong>Learn<strong>in</strong>g</strong> <strong>in</strong> <strong>Statistics</strong> ∗<br />
Wolfgang Härdle 1,2 , Sigbert Kl<strong>in</strong>ke 1 and Uwe Ziegenhagen 1,2<br />
1) Institute <strong>of</strong> <strong>Statistics</strong> and Econometrics (ISE)<br />
2) Center for Applied <strong>Statistics</strong> and Economics<br />
School <strong>of</strong> Bus<strong>in</strong>ess and Economics<br />
<strong>Hu</strong>mboldt-Universität zu Berl<strong>in</strong><br />
Students <strong>of</strong> <strong>in</strong>troductory courses consider statistics as particularly difficult,<br />
as <strong>the</strong> understand<strong>in</strong>g <strong>of</strong> <strong>the</strong> underly<strong>in</strong>g concepts may require more time and<br />
energy than for o<strong>the</strong>r discipl<strong>in</strong>es. For decades statisticians have tried to enhance<br />
understand<strong>in</strong>g with <strong>the</strong> help <strong>of</strong> technical solutions such as animation,<br />
video or <strong>in</strong>teractive tools. However it is not clear if <strong>the</strong> added value generated<br />
by <strong>the</strong>se e-learn<strong>in</strong>g tools justifies <strong>the</strong> work <strong>in</strong>vested. In this paper<br />
<strong>the</strong> experience with various e-learn<strong>in</strong>g solutions <strong>in</strong> terms <strong>of</strong> utility and <strong>the</strong><br />
impact on teach<strong>in</strong>g is discussed.<br />
AMS Classification: 97U50<br />
JEL Classification I21, C19<br />
1 Introduction<br />
Before technical details are discussed it is necessary to clarify <strong>the</strong> vocabulary. E-learn<strong>in</strong>g<br />
describes all k<strong>in</strong>ds <strong>of</strong> learn<strong>in</strong>g, where digital media are used for <strong>the</strong> presentation and<br />
transmission <strong>of</strong> learn<strong>in</strong>g materials and/or to support <strong>in</strong>ter-human communication. In<br />
general e-learn<strong>in</strong>g tools can be grouped <strong>in</strong>to:<br />
• video conferenc<strong>in</strong>g and tele teach<strong>in</strong>g systems<br />
• simulations with or without user <strong>in</strong>teraction<br />
• learn<strong>in</strong>g (content) management tools<br />
• content catalogues and podcast<strong>in</strong>g<br />
∗ This research was supported by <strong>the</strong> Deutsche Forschungsgeme<strong>in</strong>schaft through <strong>the</strong> SFB 649 “Economic<br />
Risk”.<br />
1
• web and computerbased tra<strong>in</strong><strong>in</strong>g applications<br />
In <strong>the</strong> context <strong>of</strong> this paper <strong>the</strong> term e-learn<strong>in</strong>g refers ma<strong>in</strong>ly to <strong>the</strong> last category <strong>of</strong> this<br />
list, to web and computerbased tra<strong>in</strong><strong>in</strong>g applications.<br />
The projects proposed by Nolan and Lang (2008) and Darius et al. (2008) also fall <strong>in</strong>to<br />
this category as <strong>the</strong>y <strong>of</strong>fer two different technical solutions to improve <strong>the</strong> understand<strong>in</strong>g<br />
<strong>of</strong> statistics by students. Nolan and Lang (2008) propose a system for <strong>in</strong>teractive and<br />
dynamic documents which allows students to follow <strong>the</strong> complex decision mak<strong>in</strong>g process<br />
<strong>of</strong> a statistical analyst. As an example <strong>the</strong>y take <strong>the</strong> classification <strong>of</strong> emails <strong>in</strong>to spam<br />
and ham us<strong>in</strong>g different dialogues for, e.g. data load<strong>in</strong>g, derivation <strong>of</strong> classification<br />
variables and statistical classification & prediction.<br />
Darius et al. (2008) present a set <strong>of</strong> Java applets to assist student understand<strong>in</strong>g <strong>of</strong><br />
experimental design. For two common situations <strong>in</strong> experimental design, <strong>the</strong> optimisation<br />
<strong>of</strong> an <strong>in</strong>dustrial process and a greenhouse experiment to f<strong>in</strong>d <strong>the</strong> optimal dose<br />
<strong>of</strong> fertilizer, <strong>the</strong>y have developed <strong>in</strong>teractive applets to provide <strong>the</strong>ir students with a<br />
test-bed for experimental design studies.<br />
In <strong>the</strong> last few decades a plethora <strong>of</strong> <strong>in</strong>teractive tools have been developed that aimed<br />
at help<strong>in</strong>g students to receive a better understand<strong>in</strong>g <strong>of</strong> statistics and to develop “statistical<br />
th<strong>in</strong>k<strong>in</strong>g”. Some prom<strong>in</strong>ent commercial examples are Fathom (Keypress, 2007)<br />
or Visual <strong>Statistics</strong> (McGraw-Hill, 2001). Common <strong>in</strong>ternet search eng<strong>in</strong>es deliver more<br />
than one million hits for <strong>the</strong> search term “statistics applet”.<br />
The availability <strong>of</strong> web based content and pro-active statistics teach<strong>in</strong>g tools however<br />
prompts, at least, <strong>the</strong> follow<strong>in</strong>g two important questions:<br />
1. Have students improved <strong>the</strong>ir statistics knowledge by us<strong>in</strong>g e-learn<strong>in</strong>g tools?<br />
2. What impact do e-learn<strong>in</strong>g tools have on our teach<strong>in</strong>g?<br />
S<strong>in</strong>ce <strong>the</strong> results atta<strong>in</strong>ed by students <strong>of</strong> statistics have not improved significantly, despite<br />
massive <strong>in</strong>creases <strong>in</strong> <strong>the</strong> use <strong>of</strong> e-learn<strong>in</strong>g tool (at least <strong>in</strong> our experience), we are entitled<br />
to question <strong>the</strong> effectiveness <strong>of</strong> e-learn<strong>in</strong>g <strong>in</strong> statistics.<br />
1.1 Students vs. <strong>Statistics</strong><br />
The reason that students encounter difficulties <strong>in</strong> statistics are complex and can, to a<br />
large part, be assigned to <strong>the</strong> students <strong>the</strong>mselves and <strong>the</strong>ir lecturers. The PISA study<br />
revealed that <strong>the</strong> ma<strong>the</strong>matical ability <strong>of</strong> German school students is significantly lower<br />
than <strong>the</strong> average <strong>of</strong> all OECD countries; <strong>in</strong> ma<strong>the</strong>matics and natural sciences Germany<br />
was ranked 20th out <strong>of</strong> 32, <strong>in</strong> read<strong>in</strong>g it was ranked even lower at place 21.<br />
These results, which reflect <strong>the</strong> high school performance, consequently also affect<br />
2
<strong>the</strong> ability <strong>of</strong> university students. An even more dramatic scenario has recently been<br />
discovered at <strong>the</strong> Johannes Kepler University L<strong>in</strong>z, Austria: Some <strong>of</strong> <strong>the</strong> orig<strong>in</strong>al PISA<br />
exercises were given to students on <strong>the</strong> statistics course to check <strong>the</strong>ir basic ma<strong>the</strong>matical<br />
knowledge, with questions such as “How much is 30% <strong>of</strong> 70% percent?”. As Duller (2004,<br />
2007a,b) reported, <strong>the</strong> results were highly unsatisfactory and have even deteriorated<br />
s<strong>in</strong>ce. The authors have <strong>the</strong> same impression. In fact exam grades have not improved<br />
although <strong>the</strong> standard <strong>of</strong> exams has been lowered over <strong>the</strong> last ten years.<br />
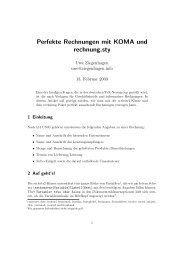
Voluntarily/Lecture<br />
Obligatory/Tutorial<br />
Obligatory/Lecture<br />
-2 -1 0 1<br />
Difference<br />
Figure 1: Difference <strong>of</strong> mean answers for statistics courses and mean <strong>of</strong> all courses<br />
(centred to 0) to <strong>the</strong> question “General impression <strong>of</strong> <strong>the</strong> course/course expectation<br />
fulfilled” (1=fully to 5=not at all) from w<strong>in</strong>ter term 1999/2000 until<br />
summer term 2006 by course attributes (obligatory/voluntarily visit and lecture/tutorial).<br />
The small black dots represent one particular teacher.<br />
The comparatively low competence <strong>in</strong> ma<strong>the</strong>matics may also provide h<strong>in</strong>ts for <strong>the</strong> evaluation<br />
<strong>of</strong> <strong>the</strong> statistics courses at <strong>the</strong> School <strong>of</strong> Bus<strong>in</strong>ess and Economics at <strong>Hu</strong>mboldt-<br />
Universität, Berl<strong>in</strong>. For more than ten years now students have evaluated courses and<br />
lecturers. Figure 1 shows (at <strong>the</strong> bottom) <strong>the</strong> difference between <strong>the</strong> average answer to<br />
<strong>the</strong> questions “General impression <strong>of</strong> course/course expectation fulfilled” for <strong>the</strong> compulsory<br />
course <strong>in</strong> statistics (comparable to STAT101 courses <strong>in</strong> <strong>the</strong> United States), <strong>the</strong><br />
voluntary exercises (middle) and all o<strong>the</strong>r voluntary courses from <strong>the</strong> authors <strong>in</strong>stitute<br />
for <strong>the</strong> W<strong>in</strong>ter Term 1999/2000 until <strong>the</strong> Summer Term 2006. As <strong>the</strong> average <strong>of</strong> all<br />
courses from <strong>the</strong> faculty was centred to 0, <strong>the</strong> graphs <strong>in</strong>dicate that even a specifically<br />
good teacher (evaluated above average from <strong>the</strong> advanced students) does not fulfill all<br />
expectations for <strong>the</strong> <strong>in</strong>troductory courses.<br />
The overall average <strong>of</strong> <strong>the</strong> statistics courses is around -0.12, verbal comments from <strong>the</strong><br />
students name three problems <strong>in</strong> <strong>the</strong> compulsory basic courses as well as <strong>in</strong> <strong>the</strong> voluntary<br />
advanced courses <strong>in</strong> statistics, <strong>the</strong>se are:<br />
3
1. too formal, too much ma<strong>the</strong>matics<br />
2. too fast, too much content <strong>in</strong> <strong>the</strong> curriculum<br />
3. not enough examples<br />
The first po<strong>in</strong>t <strong>of</strong> criticism adresses <strong>the</strong> difficult problem <strong>of</strong> balanc<strong>in</strong>g between ma<strong>the</strong>matical<br />
formalism and looseness. In <strong>the</strong> authors´ op<strong>in</strong>ion <strong>the</strong>re will always be students<br />
who compla<strong>in</strong> about <strong>the</strong> level <strong>of</strong> formalism. A significant part <strong>of</strong> statistics requires<br />
solid and basic ma<strong>the</strong>matics, <strong>the</strong>refore <strong>the</strong>re must be a m<strong>in</strong>imum level <strong>of</strong> formalism and<br />
ma<strong>the</strong>matical rigour. However we agree with Nolan and Lang (2008), that visualisation,<br />
simulation and comput<strong>in</strong>g provide alternative lenses through which to view statistical<br />
problems.<br />
The covered topics <strong>in</strong> <strong>the</strong> curriculum are associated with <strong>the</strong> way courses are taught.<br />
In most universities <strong>the</strong>re is little need to write on a board as <strong>the</strong>re is a prepared set <strong>of</strong><br />
digital slides ei<strong>the</strong>r <strong>in</strong> Powerpo<strong>in</strong>t or Adobe PDF format. The slide set for <strong>the</strong> two-term<br />
<strong>in</strong>troductory course <strong>in</strong> statistics at <strong>the</strong> School <strong>of</strong> Bus<strong>in</strong>ess and Economics conta<strong>in</strong>s, for<br />
example, nearly 700 slides cover<strong>in</strong>g ten topics. The advantage <strong>of</strong> slides is obvious. <strong>On</strong>e<br />
can easily add l<strong>in</strong>ks to data sources or <strong>in</strong>clude low level dynamic content.<br />
Experience and feedback from students toge<strong>the</strong>r with <strong>the</strong> aim <strong>of</strong> proliferat<strong>in</strong>g exist<strong>in</strong>g<br />
content drove <strong>the</strong> development <strong>of</strong> electronic teach<strong>in</strong>g material. By distribut<strong>in</strong>g course<br />
material <strong>in</strong> a convenient (electronic) form students have a chance to concentrate on<br />
lectures ra<strong>the</strong>r than copy<strong>in</strong>g <strong>the</strong> content <strong>of</strong> slides. By provid<strong>in</strong>g examples that would<br />
be too time-consum<strong>in</strong>g or complex for <strong>the</strong> lecture it has been tried to support <strong>the</strong><br />
students’ understand<strong>in</strong>g. And f<strong>in</strong>ally various web based learn<strong>in</strong>g environments have<br />
been developed that will be described <strong>in</strong> <strong>the</strong> next section.<br />
The last po<strong>in</strong>t <strong>of</strong> criticism by students is <strong>the</strong> lack <strong>of</strong> examples, a po<strong>in</strong>t we partly agree<br />
with as it can be very difficult to develop excellent examples especially for <strong>in</strong>troductory<br />
courses. Our experience is that if one global example is used throughout <strong>the</strong> lecture to<br />
expla<strong>in</strong> various concepts some students compla<strong>in</strong> about <strong>the</strong> “s<strong>in</strong>gle bor<strong>in</strong>g” example, if<br />
on <strong>the</strong> o<strong>the</strong>r hand, we use several examples <strong>the</strong> students may fail to see <strong>the</strong> associations<br />
between <strong>the</strong> different topics <strong>in</strong> <strong>the</strong> course.<br />
1.2 <strong>On</strong>l<strong>in</strong>e <strong>Learn<strong>in</strong>g</strong> Tools<br />
Like Nolan and Lang (2008) and Darius et al. (2008) we have tried to supplement our<br />
class notes with various e-learn<strong>in</strong>g tools. These <strong>in</strong> detail:<br />
• MM*Stat, an <strong>in</strong>teractive browser-based tool for statistics<br />
• Electronic books, result <strong>of</strong> a cooperation with Spr<strong>in</strong>ger<br />
• Questions & Answers, a web based exam preparation tool<br />
• Micros<strong>of</strong>t Excel, to provide spread-sheet based examples<br />
4
• TeachWiki, a collaborative environment on Wiki basis<br />
MM*Stat (Müller et al., 2000) is aimed at supplement<strong>in</strong>g <strong>the</strong> traditional lectures by<br />
creat<strong>in</strong>g a framework to repeat and practise <strong>the</strong> content <strong>of</strong> lectures. The system is<br />
available <strong>in</strong> various languages such as English, German, French, Spanish and many<br />
more. Us<strong>in</strong>g a HTML-based tab structure which was generated from L ATEX us<strong>in</strong>g <strong>the</strong><br />
MD*Book system (Kl<strong>in</strong>ke and Lehmann, 2003) with “lecture” tabs provid<strong>in</strong>g def<strong>in</strong>itions,<br />
formulas and graphics and various example tabs <strong>the</strong> student can follow <strong>the</strong> lecture step<br />
by step. S<strong>in</strong>ce <strong>the</strong> different tabs are connected with l<strong>in</strong>ks <strong>the</strong> student may jump between<br />
<strong>the</strong> different lectures and <strong>the</strong> glossary, which provides brief def<strong>in</strong>itions for each term<br />
used.<br />
To provide <strong>in</strong>teractivity two different approaches have been used. There are not only<br />
multiple choice questions at <strong>the</strong> end <strong>of</strong> each chapter which are evaluated via Javascript,<br />
but also <strong>in</strong>teractive examples based on a client/server solution featur<strong>in</strong>g <strong>the</strong> XploRe<br />
Quantlet Server (XQS) and <strong>the</strong> XploRe Quantlet Client (Lehmann et al., 2005) which<br />
visualise, for example, parameter changes for statistical distributions and tests. The<br />
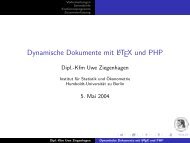
system is available for various languages, Figure 2 depicts a lecture tab <strong>in</strong> Arabic and<br />
English, with l<strong>in</strong>ks to <strong>the</strong> examples <strong>in</strong> <strong>the</strong> bottom right-hand corner.<br />
In order to generate additional value for pr<strong>in</strong>ted media, <strong>in</strong> terms <strong>of</strong> allow<strong>in</strong>g <strong>the</strong> reader<br />
to <strong>in</strong>teractively modify and run <strong>the</strong> examples from a textbook, <strong>the</strong> XQS technology used<br />
for MM*Stat has been applied to books, which have been designed for 2nd year and<br />
above students. Each book (see http://www.xplore-stat.de/ebooks/ebooks.html),<br />
its HTML version and <strong>the</strong> correspond<strong>in</strong>g set <strong>of</strong> slides conta<strong>in</strong> references to web pages on<br />
a webserver. These HTML pages show <strong>the</strong> XploRe source code and allow <strong>the</strong> examples to<br />
be run <strong>in</strong> <strong>the</strong> Java Quantlet Client applet; experienced users may also modify <strong>the</strong> source<br />
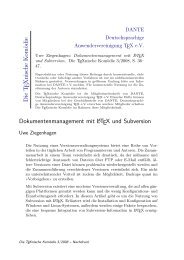
code. Figure 3 shows an example taken from <strong>the</strong> book Applied Multivariate Analysis<br />
Härdle and Simar (2007).<br />
The Questions & Answers (Q&A) system, Kl<strong>in</strong>ke (2004), was designed specifically for<br />
students who want to practice multiple choice question that had played a significant<br />
role <strong>in</strong> <strong>the</strong> undergraduate exams. Despite <strong>the</strong> different books <strong>the</strong> students can use for<br />
exam preparation certa<strong>in</strong>, very common errors can be seen. With<strong>in</strong> <strong>the</strong> Q & A project<br />
<strong>the</strong> errors are specified on <strong>the</strong> basis <strong>of</strong> evaluated exams, for each exercise <strong>the</strong> different<br />
results are computed if a student makes a particular error. When <strong>the</strong> student <strong>the</strong>n clicks<br />
one <strong>of</strong> <strong>the</strong> wrong answers <strong>the</strong> lecturer can see exactly where <strong>the</strong> source <strong>of</strong> <strong>the</strong> error is<br />
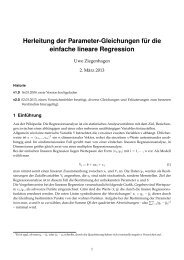
and expla<strong>in</strong> <strong>the</strong> topic aga<strong>in</strong> <strong>in</strong> <strong>the</strong> next lecture. Figure 4 shows an example questions<br />
5
Figure 2: Screenshot <strong>of</strong> MM*Stat, English and Arab version<br />
from Q & A: Given some <strong>in</strong>formation about <strong>the</strong> situation <strong>the</strong> student has to click one or<br />
more boxes; <strong>the</strong>se are evaluated immediately. However, we have found that <strong>in</strong>stead <strong>of</strong><br />
th<strong>in</strong>k<strong>in</strong>g carefully about a solution, a significant proportion <strong>of</strong> students just click until<br />
<strong>the</strong>y receive a correct answer.<br />
The TeachWiki project is ano<strong>the</strong>r web based project but with a strong focus on collaborative<br />
work. Usually sem<strong>in</strong>ar <strong>the</strong>ses rema<strong>in</strong> <strong>in</strong> <strong>the</strong> basement, with TeachWiki we<br />
allow <strong>the</strong> students <strong>the</strong>ses to be published to a broader audience. The system is based<br />
on <strong>the</strong> MediaWiki technology <strong>of</strong> Wikipedia and enhanced to <strong>in</strong>tegrate LaTeX syntax for<br />
formulas and a plug-<strong>in</strong> to <strong>in</strong>tegrate R code. The idea is also to provide <strong>the</strong> students with<br />
a platform where <strong>the</strong>y can easily work jo<strong>in</strong>tly on a sem<strong>in</strong>ar <strong>the</strong>sis.<br />
Besides <strong>the</strong>se proprietary tools standard spreadsheet s<strong>of</strong>tware (Micros<strong>of</strong>t Excel) is used<br />
<strong>in</strong> our courses. Excel has <strong>the</strong> advantage <strong>of</strong> be<strong>in</strong>g available on nearly every computer and<br />
<strong>the</strong> majority <strong>of</strong> students knows at least <strong>the</strong> basic commands to work with <strong>the</strong> s<strong>of</strong>tware.<br />
In our <strong>in</strong>stitute Excel spreadsheets are ma<strong>in</strong>ly used for <strong>the</strong> education <strong>of</strong> undergraduate<br />
6
Figure 3: Screenshot <strong>of</strong> an <strong>in</strong>teractive example from <strong>the</strong> ’Applied Multivariate <strong>Statistics</strong>’<br />
book<br />
students, e.g. to visualise <strong>the</strong> Central Limit Theorem or <strong>the</strong> parameter changes <strong>of</strong><br />
distribution functions. The built-<strong>in</strong> functions are easily accessible, without hav<strong>in</strong>g to<br />
know a high-level programm<strong>in</strong>g language such as Java or C++ formulas may be edited<br />
or graphical user <strong>in</strong>terface components such as sliders, radiobuttons and pull-down menus<br />
can be used. Even real-time sound generation can be visualised with Excel (Neuwirth,<br />
2007).<br />
Figure 5 displays a screenshot <strong>of</strong> a spreadsheet to visualize eight different probability<br />
density functions where <strong>the</strong> parameters can be modified via sliders, Figure 6 shows a<br />
visualisation <strong>of</strong> <strong>the</strong> basic algorithm for kernel density estimation.<br />
1.3 Impact on Teach<strong>in</strong>g<br />
As mentioned above <strong>the</strong> style and methods <strong>of</strong> teach<strong>in</strong>g have changed from a board<br />
centred approach to electronic slides and beamer presentations. This solution may have<br />
7
Figure 4: An exercise from Q&A: “Given you throw two fair dices what is <strong>the</strong> probability<br />
<strong>of</strong> throw<strong>in</strong>g a 2 and a 3 given <strong>the</strong> sum <strong>of</strong> boths throws was 5?”<br />
disadvantages not only for <strong>the</strong> student (<strong>the</strong> curriculum is much larger), but also for <strong>the</strong><br />
lecturer. In <strong>the</strong> same way as that it is generally not possible to do parallel beamer<br />
presentations and use a board – due to for example light conditions or <strong>the</strong> available<br />
projection space, <strong>the</strong> lecturer cannot leave <strong>the</strong> media and, for example, quickly add a<br />
draw<strong>in</strong>g.<br />
In general different problems present <strong>the</strong>mselves, which may prevent or <strong>in</strong>terfere <strong>the</strong><br />
successful use <strong>of</strong> e-<strong>Learn<strong>in</strong>g</strong> tools:<br />
Technical problems: e-<strong>Learn<strong>in</strong>g</strong> projects usually have to commit <strong>the</strong>mselves to a certa<strong>in</strong><br />
platform. For many – especially smaller – opensource projects <strong>the</strong>re is no guarantee<br />
that <strong>the</strong> s<strong>of</strong>tware platform will be supported <strong>in</strong> a few years or that future versions<br />
will be compatible. Even commercial s<strong>of</strong>tware products frequently disappear from<br />
<strong>the</strong> market, so <strong>the</strong> decision to use a certa<strong>in</strong> platform must be well thought through.<br />
As <strong>the</strong> fund<strong>in</strong>g for a bigger project is <strong>of</strong>ten limited to a certa<strong>in</strong> time w<strong>in</strong>dow, one<br />
has to ask about <strong>the</strong> project ma<strong>in</strong>tenance after <strong>the</strong> fund<strong>in</strong>g has ceased.<br />
Adm<strong>in</strong>istrative overhead: The truth is simple: Excellent projects require excellent ideas<br />
and fund<strong>in</strong>g and usually provide more work than a s<strong>in</strong>gle person can handle. The<br />
adm<strong>in</strong>istrative work (security, access control) which has noth<strong>in</strong>g to do with <strong>the</strong><br />
orig<strong>in</strong>al goal <strong>of</strong> teach<strong>in</strong>g statistics <strong>of</strong>ten exceeds <strong>the</strong> usefulness <strong>of</strong> a support<strong>in</strong>g tool<br />
and ra<strong>the</strong>r becomes a burden.<br />
Specialisation: E-learn<strong>in</strong>g tools are <strong>of</strong>ten developed by small teams for a special concept<br />
only. S<strong>in</strong>ce <strong>the</strong> documentation and publication <strong>of</strong> <strong>the</strong> source codes usually receives<br />
a comparatively low weight, it may be easier for o<strong>the</strong>r projects to implement <strong>the</strong>ir<br />
8
Figure 5: Visualisation <strong>of</strong> parameter changes with Excel<br />
own solutions. A Google search for “Java Applet Histogram” returns nearly 200 000<br />
hits. Even if this number overestimates <strong>the</strong> true number <strong>of</strong> histogram applets <strong>the</strong>re<br />
are still thousands <strong>of</strong> applets with more or less <strong>the</strong> same functionality.<br />
Availability: The setup and handl<strong>in</strong>g <strong>of</strong> e-learn<strong>in</strong>g tools can be difficult especially if <strong>the</strong>y<br />
require <strong>the</strong> <strong>in</strong>stallation <strong>of</strong> server s<strong>of</strong>tware such as Apache, PHP or Java. Micros<strong>of</strong>t<br />
Excel on <strong>the</strong> contrary can be considered as one <strong>of</strong> <strong>the</strong> s<strong>of</strong>tware packages that every<br />
student has access to; and although it may not provide enough precision or speed to<br />
do deep data analysis, its features are sufficient for <strong>in</strong>teractive visualisation <strong>of</strong> e.g.<br />
parameter changes <strong>of</strong> distributions. This platform suits students that belong to <strong>the</strong><br />
<strong>in</strong>creas<strong>in</strong>g number <strong>of</strong> “button-pushers”. <strong>On</strong>ly a very small fraction prefers to use<br />
command-driven <strong>in</strong>terfaces. In our experience “just click<strong>in</strong>g a button” also lowers<br />
<strong>the</strong> students will<strong>in</strong>gness to question <strong>the</strong> appropriateness <strong>of</strong> an algorithm or method<br />
<strong>in</strong> certa<strong>in</strong> situations. In this sense we must complement <strong>the</strong> recommendation <strong>of</strong><br />
Nolan and Lang (2008) <strong>of</strong> “simplify<strong>in</strong>g how we do do what we do, not what we<br />
do” by “and expla<strong>in</strong> why we do”.<br />
Evaluation: We are not aware <strong>of</strong> any resonable study <strong>in</strong> <strong>the</strong> area <strong>of</strong> statistics where it<br />
is proven that <strong>the</strong> use <strong>of</strong> <strong>in</strong>teractive tools improves student understand<strong>in</strong>g. Most<br />
9
Figure 6: Visualisation <strong>of</strong> Kernel Density Estimation with Excel<br />
projects, for example, report <strong>the</strong> number <strong>of</strong> accesses on project web pages etc., but<br />
no hard pro<strong>of</strong> <strong>in</strong> terms <strong>of</strong> <strong>in</strong>creased student grades <strong>in</strong> an experiment is given.<br />
Darius et al. (2008) present a questionnaire <strong>the</strong>y had asked <strong>the</strong>ir students to complete<br />
but cannot now generate a numerical analysis s<strong>in</strong>ce <strong>the</strong> experimental design<br />
s<strong>of</strong>tware has changed over time.<br />
In <strong>the</strong> <strong>in</strong>troductory statistics course at <strong>the</strong> School <strong>of</strong> Bus<strong>in</strong>ess and Economics<br />
students receive a MM*Stat CD-ROM and although <strong>the</strong> students’ comments are<br />
very positive an evaluation (Brandes, 2004) showed no significant improvement <strong>in</strong><br />
<strong>the</strong> grades. Personal feedback from students has shown that <strong>the</strong> CD-ROM was<br />
used more as a replacement for textbooks than as an <strong>in</strong>teractive e-learn<strong>in</strong>g tool.<br />
Didactic concept: Didactic concepts are <strong>of</strong>ter not discussed or questions concern<strong>in</strong>g<br />
technical implementations receive a much heavier importance <strong>in</strong> <strong>the</strong> development<br />
process. Most developers <strong>of</strong> e-learn<strong>in</strong>g projects are not educated <strong>in</strong> didactics but<br />
are ma<strong>the</strong>maticians, statisticians or programmers.<br />
All <strong>the</strong> above po<strong>in</strong>ts boil down to one question: Is <strong>the</strong> possible positive effect an elearn<strong>in</strong>g<br />
tool may have on students understand<strong>in</strong>g worth <strong>the</strong> effort <strong>the</strong> teacher needs to<br />
<strong>in</strong>vest <strong>in</strong> it?<br />
10
We have considered <strong>the</strong> utility <strong>of</strong> e-teach<strong>in</strong>g statistics for <strong>the</strong> particular field <strong>of</strong> web<br />
and computerbased tra<strong>in</strong><strong>in</strong>g applications and reviewed ten years worth <strong>of</strong> large-scale<br />
<strong>in</strong>tegrated electronic media elements <strong>in</strong> different areas <strong>of</strong> statistics education. The electronic<br />
media ranged from relatively simple Excel spreadsheets to <strong>in</strong>tegrated learn<strong>in</strong>g<br />
enviroments on <strong>the</strong> basis <strong>of</strong> HTML and Java. The aim <strong>of</strong> <strong>the</strong>se implementations was<br />
to achieve improvements <strong>in</strong> <strong>the</strong> understand<strong>in</strong>g <strong>of</strong> statistical concepts with <strong>the</strong> ultimate<br />
goal <strong>of</strong> better exam grades. We have found that <strong>the</strong> utility is marg<strong>in</strong>al <strong>in</strong> comparison<br />
with <strong>the</strong> effort <strong>in</strong>vested.<br />
We believe that e-learn<strong>in</strong>g is required <strong>in</strong> modern statistics education but we do not<br />
share a too optimistic view that it will also deepen <strong>the</strong> knowledge <strong>of</strong> students <strong>in</strong> statistics.<br />
We ra<strong>the</strong>r believe that e-learn<strong>in</strong>g can be a valuable for a certa<strong>in</strong> proportion <strong>of</strong> students.<br />
References<br />
Ulrike Brandes. Statistische Bewertung und Analyse der Klausurergebnisse Statistik<br />
(Grundstudium). Diploma <strong>the</strong>sis, 2004. URL http://edoc.hu-berl<strong>in</strong>.de/<br />
docviews/abstract.php?lang=ger&id=26854.<br />
Paul L. Darius, Kenneth M. Portier, and Eddie Schrevens. Data collection skills: Challenges<br />
for teach<strong>in</strong>g and tra<strong>in</strong><strong>in</strong>g. International Statistical Review, 2008.<br />
Christ<strong>in</strong>e Duller. A k<strong>in</strong>d <strong>of</strong> PISA-survey at university. In J. Antoch, editor, Proceed<strong>in</strong>gs<br />
<strong>in</strong> Computational <strong>Statistics</strong> - 16th Symposium held <strong>in</strong> Prague, Physika Verlag,<br />
Heidelberg, pages 975–980, 2004.<br />
Christ<strong>in</strong>e Duller. Do<strong>in</strong>g statistics versus understand<strong>in</strong>g statistics. In DAGStat - <strong>Statistics</strong><br />
under one Umbrella, page 88, 2007a.<br />
Christ<strong>in</strong>e Duller. Do you speak statistics? In Proceed<strong>in</strong>gs <strong>of</strong> <strong>the</strong> ISE, 2007b.<br />
Wolfgang Härdle and Leopold Simar. Applied Multivariate <strong>Statistics</strong>. Spr<strong>in</strong>ger, Heidelberg,<br />
2 edition, 2007.<br />
Keypress. Fathom 2. S<strong>of</strong>tware, 2007. URL http://www.keypress.com/x5656.xml.<br />
Sigbert Kl<strong>in</strong>ke. Q&A - variable multiple choice exercises with commented answers. In<br />
J. Antoch, editor, Proceed<strong>in</strong>gs <strong>in</strong> Computational <strong>Statistics</strong> - 16th Symposium held <strong>in</strong><br />
Prague, Physika Verlag, Heidelberg, pages 1299–1304, 2004.<br />
Sigbert Kl<strong>in</strong>ke and Heiko Lehmann. MD*Book and XQC/XQS – an architecture for<br />
reproducible research. SFB 373 Discussion Paper, 2003.<br />
Heiko Lehmann, Szymon Borak, and Wolfgang Härdle. Statistical Tools for F<strong>in</strong>ance and<br />
Insurance, chapter Work<strong>in</strong>g with <strong>the</strong> XQC. 2005.<br />
11
McGraw-Hill. Visual <strong>Statistics</strong>. S<strong>of</strong>tware, 2001. URL http://www.mhhe.com/bus<strong>in</strong>ess/<br />
opsci/doane/home.htm.<br />
Marlene Müller, Bernd Rönz, and Uwe Ziegenhagen. The multimedia project MM*STAT<br />
for teach<strong>in</strong>g statistics. In Jelke Bethlehem and Peter van der Heijden, editors, Proceed<strong>in</strong>gs<br />
<strong>in</strong> Computational <strong>Statistics</strong> - 14th Symposium held <strong>in</strong> Utrecht, pages 409–415,<br />
2000. URL http://www.quantlet.com/mdstat/mmstat.html.<br />
E. Neuwirth. Spreadsheets <strong>in</strong> education, 2007. URL http://sunsite.univie.ac.at/<br />
Spreadsite/.<br />
Deborah Nolan and Duncan Temple Lang. Dynamic, <strong>in</strong>teractive documents for teach<strong>in</strong>g<br />
statistical practise. International Statistical Review, 2008.<br />
12
SFB 649 Discussion Paper Series 2007<br />
For a complete list <strong>of</strong> Discussion Papers published by <strong>the</strong> SFB 649,<br />
please visit http://sfb649.wiwi.hu-berl<strong>in</strong>.de.<br />
001 "Trade Liberalisation, Process and Product Innovation, and Relative Skill<br />
Demand" by Sebastian Braun, January 2007.<br />
002 "Robust Risk Management. Account<strong>in</strong>g for Nonstationarity and Heavy<br />
Tails" by Y<strong>in</strong>g Chen and Vladimir Spoko<strong>in</strong>y, January 2007.<br />
003 "Expla<strong>in</strong><strong>in</strong>g Asset Prices with External Habits and Wage Rigidities <strong>in</strong> a<br />
DSGE Model." by Harald Uhlig, January 2007.<br />
004 "Volatility and Causality <strong>in</strong> Asia Pacific F<strong>in</strong>ancial Markets" by Enzo Weber,<br />
January 2007.<br />
005 "Quantile Sieve Estimates For Time Series" by Jürgen Franke, Jean-<br />
Pierre Stockis and Joseph Tadjuidje, February 2007.<br />
006 "Real Orig<strong>in</strong>s <strong>of</strong> <strong>the</strong> Great Depression: Monopolistic Competition, Union<br />
Power, and <strong>the</strong> American Bus<strong>in</strong>ess Cycle <strong>in</strong> <strong>the</strong> 1920s" by Monique Ebell<br />
and Albrecht Ritschl, February 2007.<br />
007 "Rules, Discretion or Reputation? Monetary Policies and <strong>the</strong> Efficiency <strong>of</strong><br />
F<strong>in</strong>ancial Markets <strong>in</strong> Germany, 14th to 16th Centuries" by Oliver<br />
Volckart, February 2007.<br />
008 "Sectoral Transformation, Turbulence, and Labour Market Dynamics <strong>in</strong><br />
Germany" by Ronald Bachmann and Michael C. Burda, February 2007.<br />
009 "Union Wage Compression <strong>in</strong> a Right-to-Manage Model" by Thorsten<br />
Vogel, February 2007.<br />
010 "<strong>On</strong> σ−additive robust representation <strong>of</strong> convex risk measures for<br />
unbounded f<strong>in</strong>ancial positions <strong>in</strong> <strong>the</strong> presence <strong>of</strong> uncerta<strong>in</strong>ty about <strong>the</strong><br />
market model" by Volker Krätschmer, March 2007.<br />
011 "Media Coverage and Macroeconomic Information Process<strong>in</strong>g" by<br />
Alexandra Niessen, March 2007.<br />
012 "Are Correlations Constant Over Time? Application <strong>of</strong> <strong>the</strong> CC-TRIGt-test<br />
to Return Series from Different Asset Classes." by Matthias Fischer,<br />
March 2007.<br />
013 "Uncerta<strong>in</strong> Paternity, Mat<strong>in</strong>g Market Failure, and <strong>the</strong> Institution <strong>of</strong><br />
Marriage" by Dirk Bethmann and Michael Kvasnicka, March 2007.<br />
014 "What Happened to <strong>the</strong> Transatlantic Capital Market Relations?" by Enzo<br />
Weber, March 2007.<br />
015 "Who Leads F<strong>in</strong>ancial Markets?" by Enzo Weber, April 2007.<br />
016 "Fiscal Policy Rules <strong>in</strong> Practice" by Andreas Thams, April 2007.<br />
017 "Empirical Pric<strong>in</strong>g Kernels and Investor Preferences" by Kai Detlefsen,<br />
Wolfgang Härdle and Rouslan Moro, April 2007.<br />
018 "Simultaneous Causality <strong>in</strong> International Trade" by Enzo Weber, April<br />
2007.<br />
019 "Regional and Outward Economic Integration <strong>in</strong> South-East Asia" by<br />
Enzo Weber, April 2007.<br />
020 "Computational <strong>Statistics</strong> and Data Visualization" by Antony Unw<strong>in</strong>,<br />
Chun-houh Chen and Wolfgang Härdle, April 2007.<br />
021 "Ideology Without Ideologists" by Lydia Mechtenberg, April 2007.<br />
022 "A Generalized ARFIMA Process with Markov-Switch<strong>in</strong>g Fractional<br />
Differenc<strong>in</strong>g Parameter" by Wen-Jen Tsay and Wolfgang Härdle, April<br />
2007.<br />
SFB 649, Spandauer Straße 1, D-10178 Berl<strong>in</strong><br />
http://sfb649.wiwi.hu-berl<strong>in</strong>.de<br />
This research was supported by <strong>the</strong> Deutsche<br />
Forschungsgeme<strong>in</strong>schaft through <strong>the</strong> SFB 649 "Economic Risk".
023 "Time Series Modell<strong>in</strong>g with Semiparametric Factor Dynamics" by<br />
Szymon Borak, Wolfgang Härdle, Enno Mammen and Byeong U. Park,<br />
April 2007.<br />
024 "From Animal Baits to Investors’ Preference: Estimat<strong>in</strong>g and Demix<strong>in</strong>g <strong>of</strong><br />
<strong>the</strong> Weight Function <strong>in</strong> Semiparametric Models for Biased Samples" by<br />
Ya’acov Ritov and Wolfgang Härdle, May 2007.<br />
025 "<strong>Statistics</strong> <strong>of</strong> Risk Aversion" by Enzo Giacom<strong>in</strong>i and Wolfgang Härdle,<br />
May 2007.<br />
026 "Robust Optimal Control for a Consumption-Investment Problem" by<br />
Alexander Schied, May 2007.<br />
027 "Long Memory Persistence <strong>in</strong> <strong>the</strong> Factor <strong>of</strong> Implied Volatility Dynamics"<br />
by Wolfgang Härdle and Julius Mungo, May 2007.<br />
028 "Macroeconomic Policy <strong>in</strong> a Heterogeneous Monetary Union" by Oliver<br />
Grimm and Stefan Ried, May 2007.<br />
029 "Comparison <strong>of</strong> Panel Co<strong>in</strong>tegration Tests" by Deniz Dilan Karaman<br />
Örsal, May 2007.<br />
030 "Robust Maximization <strong>of</strong> Consumption with Logarithmic <strong>Utility</strong>" by Daniel<br />
Hernández-Hernández and Alexander Schied, May 2007.<br />
031 "Us<strong>in</strong>g Wiki to Build an E-learn<strong>in</strong>g System <strong>in</strong> <strong>Statistics</strong> <strong>in</strong> Arabic<br />
Language" by Taleb Ahmad, Wolfgang Härdle and Sigbert Kl<strong>in</strong>ke, May<br />
2007.<br />
032 "Visualization <strong>of</strong> Competitive Market Structure by Means <strong>of</strong> Choice Data"<br />
by Werner Kunz, May 2007.<br />
033 "Does International Outsourc<strong>in</strong>g Depress Union Wages? by Sebastian<br />
Braun and Juliane Scheffel, May 2007.<br />
034 "A Note on <strong>the</strong> Effect <strong>of</strong> Outsourc<strong>in</strong>g on Union Wages" by Sebastian<br />
Braun and Juliane Scheffel, May 2007.<br />
035 "Estimat<strong>in</strong>g Probabilities <strong>of</strong> Default With Support Vector Mach<strong>in</strong>es" by<br />
Wolfgang Härdle, Rouslan Moro and Doro<strong>the</strong>a Schäfer, June 2007.<br />
036 "Yxilon – A Client/Server Based Statistical Environment" by Wolfgang<br />
Härdle, Sigbert Kl<strong>in</strong>ke and Uwe Ziegenhagen, June 2007.<br />
037 "Calibrat<strong>in</strong>g CAT Bonds for Mexican Earthquakes" by Wolfgang Härdle<br />
and Brenda López Cabrera, June 2007.<br />
038 "Economic Integration and <strong>the</strong> Foreign Exchange" by Enzo Weber, June<br />
2007.<br />
039 "Track<strong>in</strong>g Down <strong>the</strong> Bus<strong>in</strong>ess Cycle: A Dynamic Factor Model For<br />
Germany 1820-1913" by Samad Sarferaz and Mart<strong>in</strong> Uebele, June 2007.<br />
040 "Optimal Policy Under Model Uncerta<strong>in</strong>ty: A Structural-Bayesian<br />
Estimation Approach" by Alexander Kriwoluzky and Christian<br />
Stoltenberg, July 2007.<br />
041 "QuantNet – A Database-Driven <strong>On</strong>l<strong>in</strong>e Repository <strong>of</strong> Scientific<br />
Information" by Anton Andriyash<strong>in</strong> and Wolfgang Härdle, July 2007.<br />
042 "Exchange Rate Uncerta<strong>in</strong>ty and Trade Growth - A Comparison <strong>of</strong> L<strong>in</strong>ear<br />
and Nonl<strong>in</strong>ear (Forecast<strong>in</strong>g) Models" by Helmut Herwartz and Henn<strong>in</strong>g<br />
Weber, July 2007.<br />
043 "How do Rat<strong>in</strong>g Agencies Score <strong>in</strong> Predict<strong>in</strong>g Firm Performance" by<br />
Gunter Löffler and Peter N. Posch, August 2007.<br />
SFB 649, Spandauer Straße 1, D-10178 Berl<strong>in</strong><br />
http://sfb649.wiwi.hu-berl<strong>in</strong>.de<br />
This research was supported by <strong>the</strong> Deutsche<br />
Forschungsgeme<strong>in</strong>schaft through <strong>the</strong> SFB 649 "Economic Risk".
044 "E<strong>in</strong> Vergleich des b<strong>in</strong>ären Logit-Modells mit künstlichen neuronalen<br />
Netzen zur Insolvenzprognose anhand relativer Bilanzkennzahlen" by<br />
Ronald Franken, August 2007.<br />
045 "Promotion Tournaments and Individual Performance Pay" by Anja<br />
Schöttner and Veikko Thiele, August 2007.<br />
046 "Estimation with <strong>the</strong> Nested Logit Model: Specifications and S<strong>of</strong>tware<br />
Particularities" by Nadja Silberhorn, Yasem<strong>in</strong> Boztuğ and Lutz<br />
Hildebrandt, August 2007.<br />
047 "Risiken <strong>in</strong>folge von Technologie-Outsourc<strong>in</strong>g?" by Michael Stephan,<br />
August 2007.<br />
048 "Sensitivities for Bermudan Options by Regression Methods" by Denis<br />
Belomestny, Grigori Milste<strong>in</strong> and John Schoenmakers, August 2007.<br />
049 "Occupational Choice and <strong>the</strong> Spirit <strong>of</strong> Capitalism" by Matthias Doepke<br />
and Fabrizio Zilibotti, August 2007.<br />
050 "<strong>On</strong> <strong>the</strong> <strong>Utility</strong> <strong>of</strong> E-<strong>Learn<strong>in</strong>g</strong> <strong>in</strong> <strong>Statistics</strong>" by Wolfgang Härdle, Sigbert<br />
Kl<strong>in</strong>ke and Uwe Ziegenhagen, August 2007.<br />
SFB 649, Spandauer Straße 1, D-10178 Berl<strong>in</strong><br />
http://sfb649.wiwi.hu-berl<strong>in</strong>.de<br />
This research was supported by <strong>the</strong> Deutsche<br />
Forschungsgeme<strong>in</strong>schaft through <strong>the</strong> SFB 649 "Economic Risk".