3D beam prestack depth migration - PGS
3D beam prestack depth migration - PGS
3D beam prestack depth migration - PGS

You also want an ePaper? Increase the reach of your titles
YUMPU automatically turns print PDFs into web optimized ePapers that Google loves.
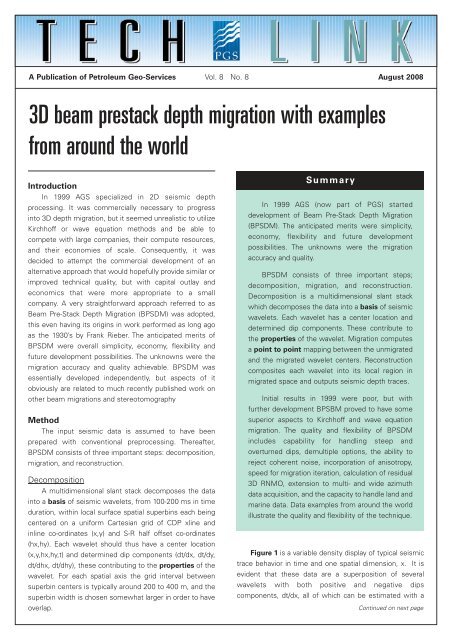
A Publication of Petroleum Geo-Services Vol. 8 No. 8<br />
August 2008<br />
<strong>3D</strong> <strong>beam</strong> <strong>prestack</strong> <strong>depth</strong> <strong>migration</strong> with examples<br />
from around the world<br />
Introduction<br />
In 1999 AGS specialized in 2D seismic <strong>depth</strong><br />
processing. It was commercially necessary to progress<br />
into <strong>3D</strong> <strong>depth</strong> <strong>migration</strong>, but it seemed unrealistic to utilize<br />
Kirchhoff or wave equation methods and be able to<br />
compete with large companies, their compute resources,<br />
and their economies of scale. Consequently, it was<br />
decided to attempt the commercial development of an<br />
alternative approach that would hopefully provide similar or<br />
improved technical quality, but with capital outlay and<br />
economics that were more appropriate to a small<br />
company. A very straightforward approach referred to as<br />
Beam Pre-Stack Depth Migration (BPSDM) was adopted,<br />
this even having its origins in work performed as long ago<br />
as the 1930’s by Frank Rieber. The anticipated merits of<br />
BPSDM were overall simplicity, economy, flexibility and<br />
future development possibilities. The unknowns were the<br />
<strong>migration</strong> accuracy and quality achievable. BPSDM was<br />
essentially developed independently, but aspects of it<br />
obviously are related to much recently published work on<br />
other <strong>beam</strong> <strong>migration</strong>s and stereotomography<br />
Method<br />
The input seismic data is assumed to have been<br />
prepared with conventional preprocessing. Thereafter,<br />
BPSDM consists of three important steps: decomposition,<br />
<strong>migration</strong>, and reconstruction.<br />
Decomposition<br />
A multidimensional slant stack decomposes the data<br />
into a basis of seismic wavelets, from 100-200 ms in time<br />
duration, within local surface spatial superbins each being<br />
centered on a uniform Cartesian grid of CDP xline and<br />
inline co-ordinates (x,y) and S-R half offset co-ordinates<br />
(hx,hy). Each wavelet should thus have a center location<br />
(x,y,hx,hy,t) and determined dip components (dt/dx, dt/dy,<br />
dt/dhx, dt/dhy), these contributing to the properties of the<br />
wavelet. For each spatial axis the grid interval between<br />
superbin centers is typically around 200 to 400 m, and the<br />
superbin width is chosen somewhat larger in order to have<br />
overlap.<br />
Summary<br />
In 1999 AGS (now part of <strong>PGS</strong>) started<br />
development of Beam Pre-Stack Depth Migration<br />
(BPSDM). The anticipated merits were simplicity,<br />
economy, flexibility and future development<br />
possibilities. The unknowns were the <strong>migration</strong><br />
accuracy and quality.<br />
BPSDM consists of three important steps;<br />
decomposition, <strong>migration</strong>, and reconstruction.<br />
Decomposition is a multidimensional slant stack<br />
which decomposes the data into a basis of seismic<br />
wavelets. Each wavelet has a center location and<br />
determined dip components. These contribute to<br />
the properties of the wavelet. Migration computes<br />
a point to point mapping between the unmigrated<br />
and the migrated wavelet centers. Reconstruction<br />
composites each wavelet into its local region in<br />
migrated space and outputs seismic <strong>depth</strong> traces.<br />
Initial results in 1999 were poor, but with<br />
further development BPSBM proved to have some<br />
superior aspects to Kirchhoff and wave equation<br />
<strong>migration</strong>. The quality and flexibility of BPSDM<br />
includes capability for handling steep and<br />
overturned dips, demultiple options, the ability to<br />
reject coherent noise, incorporation of anisotropy,<br />
speed for <strong>migration</strong> iteration, calculation of residual<br />
<strong>3D</strong> RNMO, extension to multi- and wide azimuth<br />
data acquisition, and the capacity to handle land and<br />
marine data. Data examples from around the world<br />
illustrate the quality and flexibility of the technique.<br />
Figure 1 is a variable density display of typical seismic<br />
trace behavior in time and one spatial dimension, x. It is<br />
evident that these data are a superposition of several<br />
wavelets with both positive and negative dips<br />
components, dt/dx, all of which can be estimated with a<br />
Continued on next page
TechLink August 2008 Page 2<br />
Method<br />
Continued from Page 1<br />
slant stack method. A schematic representation of one<br />
such wavelet with time dip, px=dt/dx, is displayed in<br />
Figure 2.<br />
It is significant to note that this decomposition<br />
performs a desirable uniform spatial gridding or binning of<br />
the data, the result being essentially independent of minor<br />
variations in the data acquisition geometry (minimized<br />
acquisition footprint). Also, the individual wavelets should<br />
not exhibit any aliasing effects, even for very steep time<br />
dips. Thus, the BPSDM procedure bypasses the aliasing<br />
issues that are a very significant problem in both Kirchhoff<br />
and downward continuation, wave equation <strong>migration</strong>.<br />
Note also that the wavelet amplitude is preserved, a vital<br />
issue for any future AVO or inversion operations, and that<br />
some random noise suppression is achieved at this early<br />
stage.<br />
Figure 1: Variable density display of<br />
typical data in time and a single<br />
spatial dimension, x..<br />
Figure 2: Schematic<br />
representation of a single<br />
wavelet in time and a single<br />
spatial dimension, x.<br />
Migration<br />
Given a wavelet’s center (x,y,hx,hy,t) and dip<br />
components (dt/dx, dt/dy, dt/dhx, dt/dhy), plus a current<br />
earth velocity model, it is possible to <strong>3D</strong> ray trace from<br />
source and receiver locations and determine some<br />
corresponding “best” reflector <strong>migration</strong> location<br />
(xmig,ymig,zmig), together with ancillary properties such<br />
as reflector dip, reflector azimuth, angle of incidence at<br />
reflector, shot and receiver wave front curvatures, local<br />
interval velocity, etc. It is of paramount significance that a<br />
point to point mapping exists between the unmigrated<br />
and the migrated center of each seismic wavelet. This<br />
means that the seismic wavelet decomposition forms a<br />
basis in the migrated domain as well as the unmigrated<br />
domain, the mapping function being the earth velocity<br />
model.<br />
Note that <strong>migration</strong> is applied directly to each coherent<br />
wavelet without creating a travel time table in Cartesian<br />
coordinates. This bypasses the need to select a single<br />
raypath when gridding raypaths; the source of the multipath<br />
traveltime problem encountered in Kirchhoff<br />
<strong>migration</strong>. Also, note that BPSDM does not suffer from the<br />
severe steep dip and turning wave limitations of typical<br />
wave equation <strong>migration</strong>s. Economics often force aperture<br />
limits in Kirchhoff <strong>migration</strong> and can result in not imaging<br />
steep dips and turning waves. The BPSDM independent<br />
point to point mapping of each wavelet clearly has no<br />
<strong>migration</strong> aperture issue.<br />
Figure 3: Schematic representation of the point to point mapping<br />
between a wavelet’s recording parameters (surface location, dip<br />
components, and time) and its migrated reflector location and dip.<br />
Figure 3 is a schematic for an ideal primary turning<br />
wave reflection, where the ray paths with estimated dips<br />
at the shot and receiver intersect at the associated<br />
reflector at the correct two way traveltime. However, since<br />
shot and receiver rays corresponding to a wavelet’s<br />
properties normally will not intersect to give a model two<br />
way traveltime exactly equal to the wavelet center time, t,<br />
it is also sensible to estimate a focusing quality factor, q.<br />
This is an additional valuable wavelet property. If the<br />
wavelet is truly a primary reflection then q is representative<br />
of traveltime discrepancy along the computed ray path, and<br />
can be included in a tomography method. Alternatively, a<br />
poor focus value can be used to recognize a multiple<br />
reflection wavelet, or a converted wave event with its<br />
NMO offset dip (dt/dhx, dt/dhy) significantly different from<br />
that of a corresponding primary reflection.<br />
In summary, for a current earth velocity model the<br />
<strong>migration</strong> operation determines and stores reflector<br />
location and associated properties along with each wavelet<br />
and its surface location and dip parameters. This stored<br />
point to point mapping between unmigrated and<br />
migrated space is very valuable, and is not directly available<br />
with the Kirchhoff and wave equation methods.<br />
Reconstruction<br />
A seismic wavelet can easily contributed to its local<br />
region in either unmigrated space or migrated space. In<br />
particular, the local nature of a wavelet and its associated<br />
<strong>migration</strong> properties enables a very limited wavefront<br />
Kirchhoff <strong>migration</strong> contribution to a <strong>3D</strong> migrated <strong>depth</strong><br />
volume (x,y,z) for the common offset (hx,hy). This yields<br />
certain improved signal-to-noise characteristics over<br />
normal full wavefront Kirchhoff <strong>migration</strong>, where data from
Page 3 A Publication of Petroleum Geo-Services<br />
millions of seismic traces do not necessarily cancel in an<br />
output quiet reflector area, such as salt.<br />
Figure 4 illustrates the contribution to the migrated<br />
reflector space of the wavelet depicted in the point to<br />
point mapping in Figure 3.<br />
Figure 4: A single wavelet contributes to a local region of the output<br />
migrated <strong>depth</strong> volume.<br />
Relevant ray path spreading properties enable<br />
amplitude correction of each primary reflection for its<br />
actual propagation path through the interval velocity<br />
model. This facilitates later AVO or inversion operations.<br />
Note that any wavelet can be excluded or weighted<br />
down based upon a variety of individual or joint criteria for<br />
the wavelet properties, for example the quality of focus,<br />
thereby providing a powerful flexibility for coherent noise<br />
reduction in the unmigrated or the <strong>depth</strong> migrated data.<br />
Inline, xline or full volumes are output on appropriate grids,<br />
both for quality control and for residual moveout analysis<br />
on common reflection point <strong>depth</strong> gathers.<br />
The residual moveout field is interpreted either<br />
manually or automatically, depending on the complexity of<br />
the data. This information is supplied to a tomography<br />
routine and enables the updating of the earth interval<br />
velocity model. The <strong>migration</strong>, reconstruction, and<br />
tomography steps are then iterated until a satisfactory<br />
velocity model is developed for which the common<br />
reflection point <strong>depth</strong> gathers are adequately flat. The final<br />
common offset volumes are reconstructed on an<br />
appropriately fine (x,y,z) grid. Since this operation is<br />
reasonably economic, it is normal to output volumes over<br />
the entire (x,y) common mid-point range of the input data.<br />
Results<br />
Initial results within 1999 were poor, but after one or<br />
two years of further development proved to be superior to<br />
Kirchhoff and wave equation results in several respects.<br />
The quality and flexibility of BPSDM has been illustrated in<br />
many ways, such as its unique capability for handling steep<br />
and overturned dip, its demultiple options, the ability to<br />
handle extraneous coherent noise, the adaptability to<br />
anisotropic velocity earth models, its speed for iteration<br />
and the calculation of residual <strong>3D</strong> RNMO for input to <strong>3D</strong><br />
tomography, the extension to multi- and wide azimuth data<br />
acquisition, and the capacity to handle both land and<br />
marine data.<br />
Figure 5 is a comparison of Kirchhoff time <strong>migration</strong><br />
and BPSDM applied to data from the Beaufort Sea (both<br />
plotted in time to help direct comparison). BPSDM was<br />
very successful at imaging steep dips where Kirchhoff<br />
PSTM had failed. Based on these images the structure is<br />
interpreted as an inversion anticline, not a shale diapir. The<br />
interpretation is thus utterly different.<br />
Figure 6 shows CRP offset gathers and stacks created<br />
using BPSDM on data from the KG-D4 basin from<br />
southwest India. After several iterations of <strong>migration</strong> and<br />
Continued on next page<br />
Figure 5: Kirchhoff <strong>prestack</strong> time <strong>migration</strong> (left) and BPSDM (right) on Beaufort Sea data. The <strong>beam</strong> <strong>migration</strong> imaged steep and overturned events.
TechLink August 2008 Page 4<br />
Results<br />
Continued from Page 3<br />
tomography there was still residual moveout due to<br />
unresolved local velocity anomalies associated with a<br />
rugose water bottom, slump sequences, and a strong<br />
velocity increase at the basement. After our efforts to solve<br />
the problem using velocity estimation and <strong>depth</strong> <strong>migration</strong>,<br />
further improvement was achieved using a non-hyperbolic<br />
residual moveout. The migrated offset gathers output by<br />
BPSDM allowed the flexibility required to address these<br />
data problems.<br />
Figure 7 is a line processed with BPSDM in the central<br />
Gulf of Mexico. Several known fields are indicated on this<br />
cross section. Play 1 appears as a high amplitude that<br />
correlates with structure. Subsalt play 2 and the recent<br />
discovery are truncations against the base salt. There are<br />
some interesting large amplitudes near the Play 2. Play 3<br />
appears as high amplitudes associated with an anticline, a<br />
fault, and pinchouts on the top salt. Subsalt Play 4 is<br />
associated with truncations on the base salt near the right<br />
edge of the section.<br />
Figure 6: BPSDM from the KG-D4 basin, southwest of India. The stack and migrated gathers show residual moveout due to local unresolved velocity<br />
anomalies associated with a rugose water bottom and slump sequences. Residual moveout can be used to flatten the gathers and improve the<br />
stack.<br />
Figure 7: BPSDM of a line from the deep water Gulf of Mexico through proven hydrocarbon fields and a recent discovery.
Page 5 A Publication of Petroleum Geo-Services<br />
Figures 8 through 12 show<br />
BPSDM results from southwest India.<br />
Volcanics were expected in this area<br />
and a strong velocity increase was<br />
identified below an unconformity<br />
identified in Figure 8. Seismic<br />
analyses indicate the velocity is<br />
significantly faster below the<br />
unconformity, but not fast enough to<br />
be basalt. Depth <strong>migration</strong> velocity of<br />
approximately 4000 m/s indicates this<br />
is potentially the top of a carbonate<br />
zone. Deeper, potentially volcanic<br />
Figure 8: BPSDM of a line from southwest India. Velocity analysis indicates the unconformity is<br />
structures are identified on the inline<br />
and cross-line sections (Figures 8 and<br />
potentially the top of a carbonate zone. There are deeper, potentially volcanic structures.<br />
9). The <strong>depth</strong> structure map of the horizon we identified as<br />
potentially the top of a carbonate zone (Figure 10) shows<br />
several faults or channels. One fault or channel shows<br />
offset when it crosses another fault. A structural high<br />
appears above the volcanics identified in Figures 8 and 9.<br />
Amplitude extraction maps on the right half of the<br />
structure map in Figure 10 are shown in Figure 11. The plot<br />
on the left is the amplitude 112 m above the horizon and<br />
the one on the right is 114 m above the horizons. Two<br />
interesting high amplitude anomalies are labeled Amp 1<br />
and Amp 2. These amplitudes are high on structure (see<br />
Figure 12). Current water <strong>depth</strong> (1500 m) is very deep for<br />
reefs. Perhaps the area was much shallower water at the<br />
time of deposition and these amplitudes are hydrocarbon<br />
indicators.<br />
Continued on next page<br />
Figure 9: Xline section from southwest India project with<br />
unconformity and volcanic structures identified.<br />
Figure 10: Potential Top of Carbonate Depth Structure Map from the southwest India project. Several faults or channels are identified. One fault or<br />
channel shows offset when it crosses another fault. A structural high appears above the volcanics identified in Figures 8 and 9.
TechLink August 2008 Page 6<br />
Results<br />
Continued from Page 5<br />
Figure 13 shows the BPSDM<br />
result from a line in the Arabian Sea.<br />
The <strong>depth</strong> migrated section is corendered<br />
with the velocity estimated<br />
with <strong>depth</strong> <strong>migration</strong> tomography.<br />
Blocks can be seen that slip down a<br />
large extensional fault. The blocks<br />
detach producing a series of toe<br />
thrusts. The low velocity (blue and<br />
green) beneath the toe thrusts may<br />
indicate shale.<br />
Conclusions<br />
BPSDM does have the anticipated<br />
merits of simplicity, economy,<br />
flexibility, and future development<br />
possibilities. Migrated images have<br />
excellent accuracy and quality,<br />
especially in areas of poor signal-tonoise<br />
ratio and steep dip. BPSDM’s<br />
relative economy makes it an excellent<br />
velocity estimation tool to use prior to<br />
other more compute intensive <strong>depth</strong><br />
<strong>migration</strong> methods.<br />
Acknowledgements<br />
The authors thank Devon Canada<br />
for permission to show the Beaufort<br />
Sea data, <strong>PGS</strong>’ MultiClient group for<br />
permission to show the deep water<br />
Gulf of Mexico data, Reliance for<br />
permission to show the KG-D4, southwest India, and<br />
Arabian Sea data. We also thank the AGS data processing<br />
and interpretation staff for their truly dedicated efforts<br />
applying BPSDM to numerous datasets.<br />
London<br />
Tel: 44-1932-260-001<br />
Fax: 44-1932-266-465<br />
Oslo<br />
Tel: 47-67-52-6400<br />
Fax: 47-67-52-6464<br />
CONTACT<br />
Petroleum Geo-Services<br />
Houston<br />
Tel: 1-281-509-8000<br />
Fax: 1-281-509-8500<br />
Singapore<br />
Tel: 65-6735-6411<br />
Fax: 65-6735-6413<br />
© 2008 Petroleum Geo-Services. All Rights Reserved<br />
Figure 11: Amplitude extraction maps on the right half of the structure map in Figure 10.<br />
Amplitude extracted 112 m above the <strong>depth</strong> mapped in Figure 10 (left plot) shows a high<br />
amplitude anomaly in blue labeled Amp 1. A similar high amplitude on the amplitude extracted<br />
144 m above the horizon <strong>depth</strong> (right plot) is labeled Amp 2. These amplitudes are high on<br />
structure (see Figure 12). Current water <strong>depth</strong> (1500 m) is very deep for reefs. Perhaps the area<br />
was much shallower water at the time of deposition and these amplitudes are hydrocarbon<br />
indicators.<br />
Figure 12: Cross-line through the amplitude anomalies identified on Figure 11. These amplitude<br />
anomalies are high on structure and there is interesting signal attenuation below the high<br />
amplitudes.<br />
Figure 13: BPSDM from the Arabian Sea. The <strong>depth</strong> migrated section<br />
is co rendered with the velocity estimated with <strong>depth</strong> <strong>migration</strong><br />
tomography. Blocks can be seen that slip down a large extensional<br />
fault. The blocks detach producing a series of toe thrusts. The low<br />
velocity (blue and green) beneath the toe thrusts may indicate shale.<br />
For Updates on <strong>PGS</strong> Technological Advances, visit<br />
www.pgs.com<br />
More TechLinks at www.pgs.com/techlink