FORM 10-Q
FORM 10-Q
FORM 10-Q

Create successful ePaper yourself
Turn your PDF publications into a flip-book with our unique Google optimized e-Paper software.
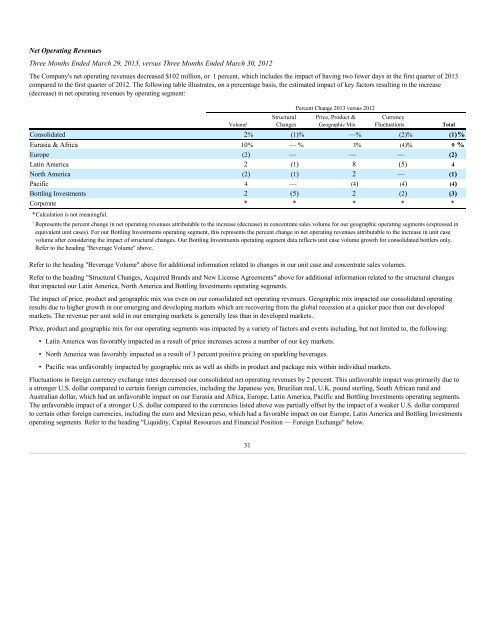
Net Operating Revenues<br />
Three Months Ended March 29, 2013, versus Three Months Ended March 30, 2012<br />
The Company's net operating revenues decreased $<strong>10</strong>2 million, or 1 percent, which includes the impact of having two fewer days in the first quarter of 2013<br />
compared to the first quarter of 2012. The following table illustrates, on a percentage basis, the estimated impact of key factors resulting in the increase<br />
(decrease) in net operating revenues by operating segment:<br />
Volume 1<br />
Structural<br />
Changes<br />
Percent Change 2013 versus 2012<br />
Price, Product &<br />
Geographic Mix<br />
Currency<br />
Fluctuations Total<br />
Consolidated 2% (1)% —% (2)% (1)%<br />
Eurasia & Africa <strong>10</strong>% — % 3% (4)% 9 %<br />
Europe (2) — — — (2)<br />
Latin America 2 (1) 8 (5) 4<br />
North America (2) (1) 2 — (1)<br />
Pacific 4 — (4) (4) (4)<br />
Bottling Investments 2 (5) 2 (2) (3)<br />
Corporate * * * * *<br />
*Calculation is not meaningful.<br />
1 Represents the percent change in net operating revenues attributable to the increase (decrease) in concentrate sales volume for our geographic operating segments (expressed in<br />
equivalent unit cases). For our Bottling Investments operating segment, this represents the percent change in net operating revenues attributable to the increase in unit case<br />
volume after considering the impact of structural changes. Our Bottling Investments operating segment data reflects unit case volume growth for consolidated bottlers only.<br />
Refer to the heading "Beverage Volume" above.<br />
Refer to the heading "Beverage Volume" above for additional information related to changes in our unit case and concentrate sales volumes.<br />
Refer to the heading "Structural Changes, Acquired Brands and New License Agreements" above for additional information related to the structural changes<br />
that impacted our Latin America, North America and Bottling Investments operating segments.<br />
The impact of price, product and geographic mix was even on our consolidated net operating revenues. Geographic mix impacted our consolidated operating<br />
results due to higher growth in our emerging and developing markets which are recovering from the global recession at a quicker pace than our developed<br />
markets. The revenue per unit sold in our emerging markets is generally less than in developed markets.<br />
Price, product and geographic mix for our operating segments was impacted by a variety of factors and events including, but not limited to, the following:<br />
• Latin America was favorably impacted as a result of price increases across a number of our key markets.<br />
• North America was favorably impacted as a result of 3 percent positive pricing on sparkling beverages.<br />
• Pacific was unfavorably impacted by geographic mix as well as shifts in product and package mix within individual markets.<br />
Fluctuations in foreign currency exchange rates decreased our consolidated net operating revenues by 2 percent. This unfavorable impact was primarily due to<br />
a stronger U.S. dollar compared to certain foreign currencies, including the Japanese yen, Brazilian real, U.K. pound sterling, South African rand and<br />
Australian dollar, which had an unfavorable impact on our Eurasia and Africa, Europe, Latin America, Pacific and Bottling Investments operating segments.<br />
The unfavorable impact of a stronger U.S. dollar compared to the currencies listed above was partially offset by the impact of a weaker U.S. dollar compared<br />
to certain other foreign currencies, including the euro and Mexican peso, which had a favorable impact on our Europe, Latin America and Bottling Investments<br />
operating segments. Refer to the heading "Liquidity, Capital Resources and Financial Position — Foreign Exchange" below.<br />
31