Download (20MB) - Repository@Napier
Download (20MB) - Repository@Napier Download (20MB) - Repository@Napier
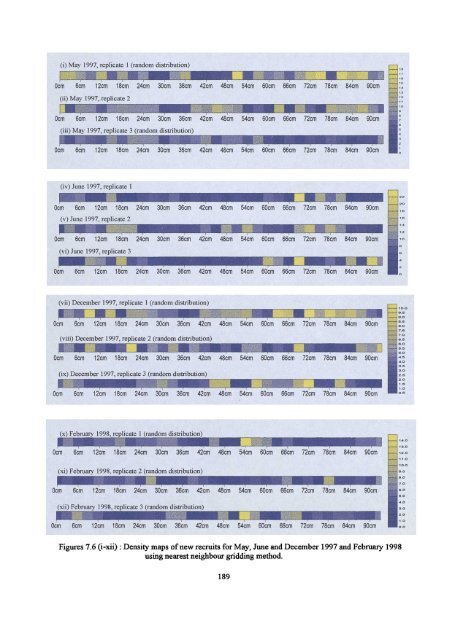
The new recruits were only sufficiently abundant for statistical analyses during May, June and December 1997 and February 1998. Mean abundances per core of new recruits for these months were rather similar for each patch replicate and, therefore, all 3 replicates were analysed for these months. The results of their indices of dispersion are displayed in Table 7.2. These results suggest that new recruits, i.e., individuals benthic for less than 1 month, were generally randomly distributed except during June 1997 when they were aggregated. Figures 7.6(i-xii) present the density plots of the abundances of new recruits for these months. Spatial autocorrelation analysis performed on these distributions revealed no significant spatial structuring and the correlograms are therefore not shown. The density plots suggest that the non-random distributions of new recruits during June 1997 probably resulted from patches which were smaller that the sampling unit, 3cm, which probably explains why their spatial correlograms were non-significant. Month v:m ratio pattern id pattern I,, pattern 1 1.428 Random 1.037 Random 0.385 Random May 1997 2 1.841 **A 1.106 *A 0.501 *A 3 0.916 Random 0.986 Random -0.096 Random 1 3.677 ***A 1.522 *A 0.507 *A June 1997 2 2.217 ***A 1.194 *A 0.502 *A 3 4.938 ***A 1.563 *A 0.508 *A 1 1.208 Random 1.038 Random 0.187 Random December 1997 2 1.163 Random 1.050 Random 0.146 Random 3 1.423 Random 1.042 Random 0.213 Random 1 0.832 Random 0.961 Random -0.191 Random February 1998 2 1.228 Random 1.066 Random 0.206 Random 3 1.441 Random 1.098 Random 0.397 Random Table 7.2 : Indices of dispersion of P. elegans new recruits for the months with mean densities greater than 3 individuals per core. A=Aggregated distribution where * represents a statistical significance from random at p
(i) May 1997, replicate 1 (random distribution) 4,.,dad 1111 Ocm 6cm 12cm 18cm 24cm 30cm 36cm 42cm 48cm 54cm 60cm 66cm 72cm 78cm 84c' m 90cm (ii) May 1997, replicate 2 I NM -111110111E- iii. _111[ Ocm 6cm 12cm 18cm 24cm 30cm 36cm 42cm 48cm 54cm 60cm 66cm 72cm 78cm 84cm 90cm 7 (iii) May 1997, replicate 3 (random distribution) :iuii ii 111EMEE„:,' Ocm 6cm 12cm 18cm 24cm 30cm 36cm 42cm 48cm 54cm 60cm 66cm 72cm 78cm 84cm 90cm (iv) June 1997, replicate 1 Ocm 6cm 12cm 18cm 24cm 30cm 36cm 42cm (v) June 1997, replicate 2 ,T7.111111111.1111.11:111t7r - APONIO Ocm 6cm 12cm 18cm 24cm 30cm 36cm 42cm 48cm 54cm 60cm 66cm 72cm 78cm 84cm 90cm (vi) June 1997, replicate 3 NW_ III IJ 6cm 12cm 18cm 24cm 30cm 36cm 42cm 48cm 54cm 60cm 66cm 72cm 78cm 84cm 90cm (vii) December 1997, replicate 1 (random distribution) Ocm 6c'm 12cm 18cm 24cm 30cm 36cm 42cm 48cm (viii) December 1997, replicate 2 (random distribution) • Va Ocm 6cm 12cm 18cm 24cm 30cm 36cm 42cm 48cm (ix) December 1997, replicate 3 (random distribution) 54cm 60cm 54cm 60cm 66cm 66cm 72cm 72cm 78cm 78cm 84cm 84cm 90cm 7,1N 90cm Mffill 10.0 MN 9.5 MI 9.0 NMI 8.5 8.0 NMI 7.5 NM 7.0 IN 6.5 6.0 5.5 6.0 4.5 4.0 3.6 3.0 2.6 2.0 ---111111.1111.1rMINERIL-AMINI---i“. 48cm 54cm 60cm 66cm 72cm 78cm 84cm 90cm 1.8 1.0 0.6 Ir C'' :'''' Ocm 6cm 12cm 18cm 24cm 30cm 36cm 42cm (x) February 1998, re licate 1 (random distribution Ocm 6cm 12cm 18cm 24cm 30cm 36cm 42cm 48cm 54cm (xi) February 1998, replicate 2 (random distribution) Ocm 6cm 12cm 18cm 24cm 30cm 36cm 42cm 48cm 54cm (xii) February 1998, replicate 3 (random distribution) 111___11.111111111.111F±7111.1111_1111- Ocm 6cm 12cm 18cm 24cm 30cm 36cm 42cm 48cm 54cm AM. 48 cm 54cm 60cm 66cm 72cm 78cm 84cm 90cm 18 17 15 14 13 12 5 4 3 2 1 22 20 10 10 14 12 14.0 13.0 60cm 66cm 72cm 78cm 84cm 90cm 12.0 1/.0 10.0 60cm 66cm 72cm 78cm 84cm 90cm 8.0 60cm 66cm 72cm 78cm 84cm 90cm 0.0 Figures 7.6 (i-xii) : Density maps of new recruits for May, June and December 1997 and February 1998 using nearest neighbour gridding method. 189 90 8.0 5.0 4.0 3.0 2.0 1.0
- Page 154 and 155: All statistics were performed using
- Page 156 and 157: RESULTS Univariate analysis of spec
- Page 158 and 159: 3.5 3 5 2 11 5 1 0.5 0 40 35 Ca 30
- Page 160 and 161: of non-patch areas (Figure 6.3(vi))
- Page 162 and 163: the individuals colonising patch az
- Page 164 and 165: Multivariate analysis of community
- Page 166 and 167: Month Sample statistic (Global R) N
- Page 168 and 169: 2NP 3NP 4NP .•,, 6NP 5NP 6P 1NP i
- Page 170 and 171: Figure 6.8: Two-dimensional MDS ord
- Page 172 and 173: - - 5P ... 4P . 6P • .‘2NP 1NP
- Page 174 and 175: I 50. 1 60. 70. 80. 90. 100. BRAY-C
- Page 176 and 177: 'P2-AZ P3-AZ N2-AZ .- - - " .„ ..
- Page 178 and 179: o • o -o + 350 — 300 = 250 7 g
- Page 180 and 181: The importance of the ambient commu
- Page 182 and 183: In April, when P. elegans larval av
- Page 184 and 185: not only for errant polychaetes, bu
- Page 186 and 187: observed in this study. How crucial
- Page 188 and 189: Micro-scale spatial patterns of mac
- Page 190 and 191: METHODS Experimental design - A pre
- Page 192 and 193: study. These individuals would not
- Page 194 and 195: RESULTS Pilot survey - The pilot su
- Page 196 and 197: Transect survey - Micro-scale patte
- Page 198 and 199: Month v:m ratio pattern Id pattern
- Page 200 and 201: (i) March 1997, replicate 1 -iAlmiA
- Page 202 and 203: (xix) October 1997, replicate 1 (ra
- Page 206 and 207: The results of correlation analyses
- Page 208 and 209: cf.) . crt N ,—, Cr) C,1 ,—, Cr
- Page 210 and 211: 1.2 -0.4 "a 0.8 > (i) % Water conte
- Page 212 and 213: examine the micro-scale spatial pat
- Page 214 and 215: Invertebrate larvae, those of polyc
- Page 216 and 217: laboratory observations are needed
- Page 218 and 219: CHAPTER 8 THE FAUNAL COMMUNITIES OF
- Page 220 and 221: Other theories have been postulated
- Page 222 and 223: RESULTS Univariate analysis of spec
- Page 224 and 225: -T. g 80 g 50 40 30 20 10 (i) Adult
- Page 226 and 227: in significant differences in size
- Page 228 and 229: 8.2). This was mainly because of th
- Page 230 and 231: 120 100 80 60 - 40 20 0. cn1 c.n (i
- Page 232 and 233: 3NP 6NP 4NP 1 NP 5NP 2NP : 3P 1P 6P
- Page 234 and 235: 4P 3P 5P 5NP 6P 2P 1P Figure 8.8: T
- Page 236 and 237: Figure 8.10 shows the dendrogram pr
- Page 238 and 239: NP1 NP2 NP2 NP2 NP1 NP1 NP2 NP2 NP2
- Page 240 and 241: Sediment water, organic and silt/cl
- Page 242 and 243: 5 350 — 300 250 200 — ISO — 1
- Page 244 and 245: abundances of P. ciliata had more d
- Page 246 and 247: levels of silt/clay and organics. S
- Page 248 and 249: 1973; Noji and Noji, 1991). Competi
- Page 250 and 251: shown to consume up to 68% of a 0-g
- Page 252 and 253: In Chapter 7 the micro-scale spatia
(i) May 1997, replicate 1 (random distribution)<br />
4,.,dad 1111<br />
Ocm 6cm 12cm 18cm 24cm 30cm 36cm 42cm 48cm 54cm 60cm 66cm 72cm 78cm 84c' m 90cm<br />
(ii) May 1997, replicate 2<br />
I NM -111110111E- iii. _111[<br />
Ocm 6cm 12cm 18cm 24cm 30cm 36cm 42cm 48cm 54cm 60cm 66cm 72cm 78cm 84cm 90cm 7<br />
(iii) May 1997, replicate 3 (random distribution)<br />
:iuii ii 111EMEE„:,'<br />
Ocm 6cm 12cm 18cm 24cm 30cm 36cm 42cm 48cm 54cm 60cm 66cm 72cm 78cm 84cm 90cm<br />
(iv) June 1997, replicate 1<br />
Ocm 6cm 12cm 18cm 24cm 30cm 36cm 42cm<br />
(v) June 1997, replicate 2<br />
,T7.111111111.1111.11:111t7r - APONIO<br />
Ocm 6cm 12cm 18cm 24cm 30cm 36cm 42cm 48cm 54cm 60cm 66cm 72cm 78cm 84cm 90cm<br />
(vi) June 1997, replicate 3<br />
NW_<br />
III IJ<br />
6cm 12cm 18cm 24cm 30cm 36cm 42cm 48cm 54cm 60cm 66cm 72cm 78cm 84cm 90cm<br />
(vii) December 1997, replicate 1 (random distribution)<br />
Ocm 6c'm 12cm 18cm 24cm 30cm 36cm 42cm 48cm<br />
(viii) December 1997, replicate 2 (random distribution)<br />
• Va<br />
Ocm 6cm 12cm 18cm 24cm 30cm 36cm 42cm 48cm<br />
(ix) December 1997, replicate 3 (random distribution)<br />
54cm 60cm<br />
54cm 60cm<br />
66cm<br />
66cm<br />
72cm<br />
72cm<br />
78cm<br />
78cm<br />
84cm<br />
84cm<br />
90cm<br />
7,1N<br />
90cm<br />
Mffill 10.0<br />
MN 9.5<br />
MI 9.0<br />
NMI 8.5<br />
8.0<br />
NMI 7.5<br />
NM 7.0<br />
IN 6.5<br />
6.0<br />
5.5<br />
6.0<br />
4.5<br />
4.0<br />
3.6<br />
3.0<br />
2.6<br />
2.0<br />
---111111.1111.1rMINERIL-AMINI---i“.<br />
48cm 54cm 60cm 66cm 72cm 78cm 84cm 90cm<br />
1.8<br />
1.0<br />
0.6<br />
Ir<br />
C'' :''''<br />
Ocm 6cm 12cm 18cm 24cm 30cm 36cm 42cm<br />
(x) February 1998, re licate 1 (random distribution<br />
Ocm 6cm 12cm 18cm 24cm 30cm 36cm 42cm 48cm 54cm<br />
(xi) February 1998, replicate 2 (random distribution)<br />
Ocm 6cm 12cm 18cm 24cm 30cm 36cm 42cm 48cm 54cm<br />
(xii) February 1998, replicate 3 (random distribution)<br />
111___11.111111111.111F±7111.1111_1111-<br />
Ocm 6cm 12cm 18cm 24cm 30cm 36cm 42cm 48cm 54cm<br />
AM.<br />
48 cm 54cm 60cm 66cm 72cm 78cm 84cm 90cm<br />
18<br />
17<br />
15<br />
14<br />
13<br />
12<br />
5<br />
4<br />
3<br />
2<br />
1<br />
22<br />
20<br />
10<br />
10<br />
14<br />
12<br />
14.0<br />
13.0<br />
60cm 66cm 72cm 78cm 84cm 90cm 12.0<br />
1/.0<br />
10.0<br />
60cm 66cm 72cm 78cm 84cm 90cm 8.0<br />
60cm 66cm 72cm 78cm 84cm 90cm 0.0<br />
Figures 7.6 (i-xii) : Density maps of new recruits for May, June and December 1997 and February 1998<br />
using nearest neighbour gridding method.<br />
189<br />
90<br />
8.0<br />
5.0<br />
4.0<br />
3.0<br />
2.0<br />
1.0


