Download (20MB) - Repository@Napier
Download (20MB) - Repository@Napier Download (20MB) - Repository@Napier
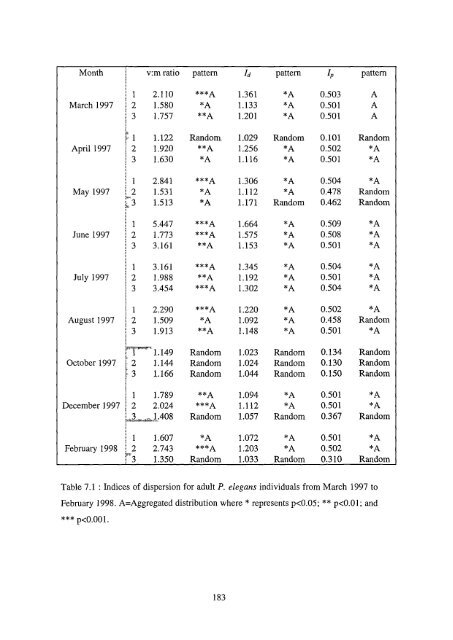
Month v:m ratio pattern Id pattern lp pattern 1 2.110 ***A 1.361 *A 0.503 A March 1997 2 1.580 *A 1.133 *A 0.501 A 3 1.757 **A 1.201 *A 0.501 A April 1997 1.122 Random. 1.029 Random 0.101 Random, 1.920 **A 1.256 *A 0.502 *A 3 1.630 *A 1.116 *A 0.501 *A 1 2.841 ***A 1.306 *A 0.504 *A May 1997 1.531 *A 1.112 *A 0.478 Random 1.513 *A 1.171 Random 0.462 Random 1 5.447 ***A 1.664 *A 0.509 *A June 1997 2 1.773 ***A 1.575 *A 0.508 *A 3 3.161 **A 1.153 *A 0.501 *A 1 3.161 ***A 1.345 *A 0.504 *A July 1997 2 1.988 **A 1.192 *A 0.501 *A 3 3.454 ***A 1.302 *A 0.504 *A 1 2.290 ***A 1.220 *A 0.502 *A August 1997 2 1.509 *A 1.092 *A 0.458 Random 3 1.913 **A 1.148 *A 0.501 *A n'1.149 Random 1.023 Random 0.134 Random October 1997 2 1.144 Random 1.024 Random 0.130 Random 3 1.166 Random 1.044 Random 0.150 Random 1 1.789 **A 1.094 *A 0.501 *A December 1997 2 2.024 ***A 1.112 *A 0.501 *A 3 1.408 Random 1.057 Random 0.367 Random 1 1.607 *A 1.072 *A 0.501 *A February 1998 2 2.743 ***A 1.203 *A 0.502 *A 1.350 Random 1.033 Random 0.310 Random Table 7.1: Indices of dispersion for adult P. elegans individuals from March 1997 to February 1998. A=Aggregated distribution where * represents p
Month v:m ratio pattern Id pattern I pattern 1 2.110 ***A 1.361 *A 0.503 A March 1997 2 1.580 *A 1.133 *A 0.501 A 3 1.757 **A 1.201 *A 0.501 A 1.122 Random. 1.029 Random 0.101 Random April 1997 2 1.920 **A 1.256 *A 0.502 *A 3 1.630 *A 1.116 *A 0.501 *A 1 2.841 ***A 1.306 *A 0.504 *A May 1997 2 1.531 *A 1.112 *A 0.478 Random p, 3 1.513 *A 1.171 Random 0.462 Random 1 5.447 ***A 1.664 *A 0.509 *A June 1997 2 1.773 ***A 1.575 *A 0.508 *A 3 3.161 **A 1.153 *A 0.501 *A 1 3.161 ***A 1.345 *A 0.504 *A July 1997 2 1.988 **A 1.192 *A 0.501 *A 3 3.454 ***A 1.302 *A 0.504 *A 1 2.290 ***A 1.220 *A 0.502 *A August 1997 2 1.509 *A 1.092 *A 0.458 Random 3 1.913 **A 1.148 *A 0.501 *A 1 1.149 Random 1.023 Random 0.134 Random October 1997 2 1.144 Random 1.024 Random 0.130 Random 3 1.166 Random 1.044 Random 0.150 Random 1 1.789 **A 1.094 *A 0.501 *A December 1997 2 2.024 ***A 1.112 *A 0.501 *A 3 1.408 Random 1.057 Random 0.367 Random 1 1.607 *A 1.072 *A 0.501 *A February 1998 2 2.743 ***A 3 1.203 *A 0.502 *A 1.350 Random 1.033 Random 0.310 Random Table 7.1 : Indices of dispersion for adult P. elegans individuals from March 1997 to February 1998. A=Aggregated distribution where * represents p
- Page 148 and 149: esulting community at any stage of
- Page 150 and 151: ambient sediment had been removed.
- Page 152 and 153: emoved since they were the only tax
- Page 154 and 155: All statistics were performed using
- Page 156 and 157: RESULTS Univariate analysis of spec
- Page 158 and 159: 3.5 3 5 2 11 5 1 0.5 0 40 35 Ca 30
- Page 160 and 161: of non-patch areas (Figure 6.3(vi))
- Page 162 and 163: the individuals colonising patch az
- Page 164 and 165: Multivariate analysis of community
- Page 166 and 167: Month Sample statistic (Global R) N
- Page 168 and 169: 2NP 3NP 4NP .•,, 6NP 5NP 6P 1NP i
- Page 170 and 171: Figure 6.8: Two-dimensional MDS ord
- Page 172 and 173: - - 5P ... 4P . 6P • .‘2NP 1NP
- Page 174 and 175: I 50. 1 60. 70. 80. 90. 100. BRAY-C
- Page 176 and 177: 'P2-AZ P3-AZ N2-AZ .- - - " .„ ..
- Page 178 and 179: o • o -o + 350 — 300 = 250 7 g
- Page 180 and 181: The importance of the ambient commu
- Page 182 and 183: In April, when P. elegans larval av
- Page 184 and 185: not only for errant polychaetes, bu
- Page 186 and 187: observed in this study. How crucial
- Page 188 and 189: Micro-scale spatial patterns of mac
- Page 190 and 191: METHODS Experimental design - A pre
- Page 192 and 193: study. These individuals would not
- Page 194 and 195: RESULTS Pilot survey - The pilot su
- Page 196 and 197: Transect survey - Micro-scale patte
- Page 200 and 201: (i) March 1997, replicate 1 -iAlmiA
- Page 202 and 203: (xix) October 1997, replicate 1 (ra
- Page 204 and 205: The new recruits were only sufficie
- Page 206 and 207: The results of correlation analyses
- Page 208 and 209: cf.) . crt N ,—, Cr) C,1 ,—, Cr
- Page 210 and 211: 1.2 -0.4 "a 0.8 > (i) % Water conte
- Page 212 and 213: examine the micro-scale spatial pat
- Page 214 and 215: Invertebrate larvae, those of polyc
- Page 216 and 217: laboratory observations are needed
- Page 218 and 219: CHAPTER 8 THE FAUNAL COMMUNITIES OF
- Page 220 and 221: Other theories have been postulated
- Page 222 and 223: RESULTS Univariate analysis of spec
- Page 224 and 225: -T. g 80 g 50 40 30 20 10 (i) Adult
- Page 226 and 227: in significant differences in size
- Page 228 and 229: 8.2). This was mainly because of th
- Page 230 and 231: 120 100 80 60 - 40 20 0. cn1 c.n (i
- Page 232 and 233: 3NP 6NP 4NP 1 NP 5NP 2NP : 3P 1P 6P
- Page 234 and 235: 4P 3P 5P 5NP 6P 2P 1P Figure 8.8: T
- Page 236 and 237: Figure 8.10 shows the dendrogram pr
- Page 238 and 239: NP1 NP2 NP2 NP2 NP1 NP1 NP2 NP2 NP2
- Page 240 and 241: Sediment water, organic and silt/cl
- Page 242 and 243: 5 350 — 300 250 200 — ISO — 1
- Page 244 and 245: abundances of P. ciliata had more d
- Page 246 and 247: levels of silt/clay and organics. S
Month v:m ratio pattern Id pattern I pattern<br />
1 2.110 ***A 1.361 *A 0.503 A<br />
March 1997 2 1.580 *A 1.133 *A 0.501 A<br />
3 1.757 **A 1.201 *A 0.501 A<br />
1.122 Random. 1.029 Random 0.101 Random<br />
April 1997 2 1.920 **A 1.256 *A 0.502 *A<br />
3 1.630 *A 1.116 *A 0.501 *A<br />
1 2.841 ***A 1.306 *A 0.504 *A<br />
May 1997 2 1.531 *A 1.112 *A 0.478 Random<br />
p, 3 1.513 *A 1.171 Random 0.462 Random<br />
1 5.447 ***A 1.664 *A 0.509 *A<br />
June 1997 2 1.773 ***A 1.575 *A 0.508 *A<br />
3 3.161 **A 1.153 *A 0.501 *A<br />
1 3.161 ***A 1.345 *A 0.504 *A<br />
July 1997 2 1.988 **A 1.192 *A 0.501 *A<br />
3 3.454 ***A 1.302 *A 0.504 *A<br />
1 2.290 ***A 1.220 *A 0.502 *A<br />
August 1997 2 1.509 *A 1.092 *A 0.458 Random<br />
3 1.913 **A 1.148 *A 0.501 *A<br />
1 1.149 Random 1.023 Random 0.134 Random<br />
October 1997 2 1.144 Random 1.024 Random 0.130 Random<br />
3 1.166 Random 1.044 Random 0.150 Random<br />
1 1.789 **A 1.094 *A 0.501 *A<br />
December 1997 2 2.024 ***A 1.112 *A 0.501 *A<br />
3 1.408 Random 1.057 Random 0.367 Random<br />
1 1.607 *A 1.072 *A 0.501 *A<br />
February 1998 2 2.743 ***A<br />
3<br />
1.203 *A 0.502 *A<br />
1.350 Random 1.033 Random 0.310 Random<br />
Table 7.1 : Indices of dispersion for adult P. elegans individuals from March 1997 to<br />
February 1998. A=Aggregated distribution where * represents p


