Download (20MB) - Repository@Napier
Download (20MB) - Repository@Napier Download (20MB) - Repository@Napier
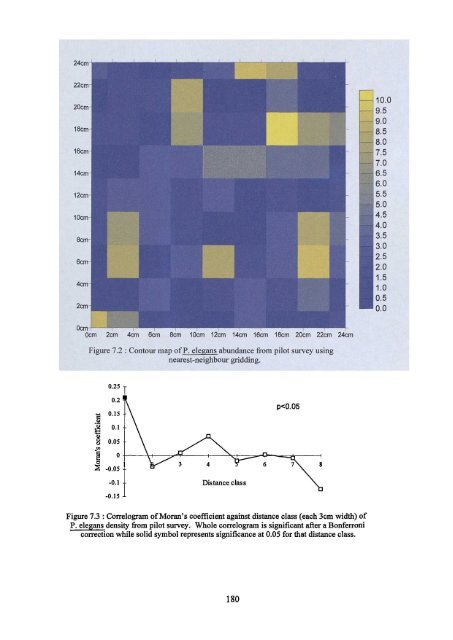
RESULTS Pilot survey - The pilot survey results indicated that P. elegans had an aggregated distribution with a variance : mean ratio of 1.97 (p
24cm 22cm 20cm 18cm 16cm 14cm- 12cm 10cm 8cm 6cm 4cm 2cm Ocm Ocm 2cm 4cm 6cm 8cm 10cm 12cm 14cm 16cm 18cm 20cm 22cm 24cm Figure 7.2 : Contour map of P. elegans abundance from pilot survey using nearest-neighbour gridding. 025 02 OAS „ OA cv. § 0.05 Jn -0.05 -OA -OAS Figure 7.3 : Correlogram of Moran's coefficient against distance class (each 3cm width) of P. elegans .density from pilot survey. Whole correlogram is significant after a Bonferroni correction while solid symbol represents significance at 0.05 for that distance class. 180 10.0 9.5 9.0 8.5 8.0 7.5 7.0 6.5 6.0 5.5 5.0 4.5 4.0 3.5 3.0 2.5 2.0 1.5 1.0 0.5 0.0
- Page 144 and 145: This reliance upon the early establ
- Page 146 and 147: CHAPTER 6 INITIAL COLONISATION OF D
- Page 148 and 149: esulting community at any stage of
- Page 150 and 151: ambient sediment had been removed.
- Page 152 and 153: emoved since they were the only tax
- Page 154 and 155: All statistics were performed using
- Page 156 and 157: RESULTS Univariate analysis of spec
- Page 158 and 159: 3.5 3 5 2 11 5 1 0.5 0 40 35 Ca 30
- Page 160 and 161: of non-patch areas (Figure 6.3(vi))
- Page 162 and 163: the individuals colonising patch az
- Page 164 and 165: Multivariate analysis of community
- Page 166 and 167: Month Sample statistic (Global R) N
- Page 168 and 169: 2NP 3NP 4NP .•,, 6NP 5NP 6P 1NP i
- Page 170 and 171: Figure 6.8: Two-dimensional MDS ord
- Page 172 and 173: - - 5P ... 4P . 6P • .‘2NP 1NP
- Page 174 and 175: I 50. 1 60. 70. 80. 90. 100. BRAY-C
- Page 176 and 177: 'P2-AZ P3-AZ N2-AZ .- - - " .„ ..
- Page 178 and 179: o • o -o + 350 — 300 = 250 7 g
- Page 180 and 181: The importance of the ambient commu
- Page 182 and 183: In April, when P. elegans larval av
- Page 184 and 185: not only for errant polychaetes, bu
- Page 186 and 187: observed in this study. How crucial
- Page 188 and 189: Micro-scale spatial patterns of mac
- Page 190 and 191: METHODS Experimental design - A pre
- Page 192 and 193: study. These individuals would not
- Page 196 and 197: Transect survey - Micro-scale patte
- Page 198 and 199: Month v:m ratio pattern Id pattern
- Page 200 and 201: (i) March 1997, replicate 1 -iAlmiA
- Page 202 and 203: (xix) October 1997, replicate 1 (ra
- Page 204 and 205: The new recruits were only sufficie
- Page 206 and 207: The results of correlation analyses
- Page 208 and 209: cf.) . crt N ,—, Cr) C,1 ,—, Cr
- Page 210 and 211: 1.2 -0.4 "a 0.8 > (i) % Water conte
- Page 212 and 213: examine the micro-scale spatial pat
- Page 214 and 215: Invertebrate larvae, those of polyc
- Page 216 and 217: laboratory observations are needed
- Page 218 and 219: CHAPTER 8 THE FAUNAL COMMUNITIES OF
- Page 220 and 221: Other theories have been postulated
- Page 222 and 223: RESULTS Univariate analysis of spec
- Page 224 and 225: -T. g 80 g 50 40 30 20 10 (i) Adult
- Page 226 and 227: in significant differences in size
- Page 228 and 229: 8.2). This was mainly because of th
- Page 230 and 231: 120 100 80 60 - 40 20 0. cn1 c.n (i
- Page 232 and 233: 3NP 6NP 4NP 1 NP 5NP 2NP : 3P 1P 6P
- Page 234 and 235: 4P 3P 5P 5NP 6P 2P 1P Figure 8.8: T
- Page 236 and 237: Figure 8.10 shows the dendrogram pr
- Page 238 and 239: NP1 NP2 NP2 NP2 NP1 NP1 NP2 NP2 NP2
- Page 240 and 241: Sediment water, organic and silt/cl
- Page 242 and 243: 5 350 — 300 250 200 — ISO — 1
24cm<br />
22cm<br />
20cm<br />
18cm<br />
16cm<br />
14cm-<br />
12cm<br />
10cm<br />
8cm<br />
6cm<br />
4cm<br />
2cm<br />
Ocm<br />
Ocm 2cm 4cm 6cm 8cm 10cm 12cm 14cm 16cm 18cm 20cm 22cm 24cm<br />
Figure 7.2 : Contour map of P. elegans abundance from pilot survey using<br />
nearest-neighbour gridding.<br />
025<br />
02<br />
OAS<br />
„ OA<br />
cv.<br />
§ 0.05<br />
Jn<br />
-0.05<br />
-OA<br />
-OAS<br />
Figure 7.3 : Correlogram of Moran's coefficient against distance class (each 3cm width) of<br />
P. elegans .density from pilot survey. Whole correlogram is significant after a Bonferroni<br />
correction while solid symbol represents significance at 0.05 for that distance class.<br />
180<br />
10.0<br />
9.5<br />
9.0<br />
8.5<br />
8.0<br />
7.5<br />
7.0<br />
6.5<br />
6.0<br />
5.5<br />
5.0<br />
4.5<br />
4.0<br />
3.5<br />
3.0<br />
2.5<br />
2.0<br />
1.5<br />
1.0<br />
0.5<br />
0.0


