Download (20MB) - Repository@Napier
Download (20MB) - Repository@Napier Download (20MB) - Repository@Napier
; 15 35 — 30 — 25 — 10 — 5 — 0 50 — 40 — 3(:) 20 10 — 0 ( i ) Initial • Control El Net DWeed P. elcgans C. cdul M. balthica C. capitata oligochactes P. elcgans P. eke ns (ii) 6 Weeks C. cdule (iii) 20 Weeks M. balthica 90.2 1€3 * •Control El Net El Weed C. capitata Gammaru spp. oligochactcs •Control DNet El Weed * + ICI: SITI1 I ===_.._. I--I—MI I I rf C. cdule M. balthica C. capitata oligochaetes A. mucosa Smaninensis Gammarus Figures 4.3(i-iii) : Mean abundances per core for initial, 6 week and 20 week results (± S.E.Mean, n=6). * Denotes a statistical difference from net plot values using One- way ANOVA with Tukey multiple comparison test at 5% level of significance. 95 sPP• 1
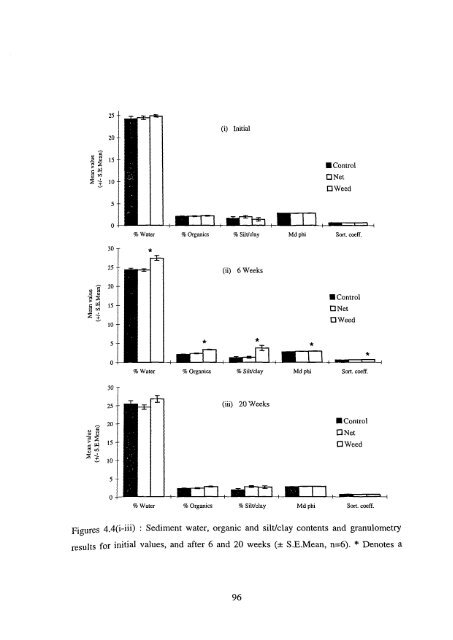
25 — 20 — 5 — 30 — 25 — 20 — 15 — 10 — 5 — 30 — 25 — 20 — 15 — 10 — 5 — % Water % Water (i) Initial (ii) 6 Weeks (iii) 20 Weeks ,T1flT1 , I % Organics % Silt/clay Md phi • Control 0 Net Weed _rl I_ , U1E171 % Organics % Silt/clay Md phi Sort. coeff. • Control 0 Net 0 Weed % Water % Organics % Silt/clay Md phi Sort. coeff. • Control CI Net 0 Weed Sort. coeff. Figures 4.4(i-iii) : Sediment water, organic and silt/clay contents and granulometry results for initial values, and after 6 and 20 weeks (± S.E.Mean, n=6). * Denotes a I I
- Page 60 and 61: a) Ts 1.4 0.6 u 0.2 -0.2 1.4 'E5 0.
- Page 62 and 63: 200m 150m 100m 50m (ix) C. edule 56
- Page 64 and 65: 73 ‘a• el 1.4 (ix) G. duebeni 1
- Page 66 and 67: DISCUSSION The main aims of this st
- Page 68 and 69: formed patches less than 1m2 and th
- Page 70 and 71: stutchbutyi, at Wirroa island, New
- Page 72 and 73: exhibited by the tube-building poly
- Page 74 and 75: CHAPTER 3 THE POPULATION STRUCTURE
- Page 76 and 77: Asexual reproduction by fragmentati
- Page 78 and 79: METHODS Survey design - It has been
- Page 80 and 81: RESULTS The species abundances in e
- Page 82 and 83: corresponds to 44 setigers using Eq
- Page 84 and 85: 1 0000000 00 rg 0 00 d- - Xauanbau
- Page 86 and 87: Reproductive activity of Pygospio e
- Page 88 and 89: P. elegans larvae at Drum Sands hav
- Page 90 and 91: Pygospio elegans showed great seaso
- Page 92 and 93: Previous studies have produced simi
- Page 94 and 95: The sole reliance on a planktonic m
- Page 96 and 97: abundance are highly seasonal, were
- Page 98 and 99: CHAPTER 4 THE EFFECTS OF MACROALGAL
- Page 100 and 101: studies may have been completely di
- Page 102 and 103: METHODS Study site - The exact posi
- Page 104 and 105: 1 C N W 4----111" 1.5m 2 NW C Contr
- Page 106 and 107: sediment sampling, together with re
- Page 108 and 109: RESULTS Species abundances - The me
- Page 112 and 113: statistical difference from net plo
- Page 114 and 115: Pygospio elegans size distribution
- Page 116 and 117: used, approximately equivalent to t
- Page 118 and 119: artefacts associated with the metho
- Page 120 and 121: present in high numbers around sewa
- Page 122 and 123: lack, hydrogen sulphide-smelling se
- Page 124 and 125: CHAPTER 5 THE EFFECTS OF MACROALGAL
- Page 126 and 127: METHODS Survey design - During late
- Page 128 and 129: The sediments could not be sampled
- Page 130 and 131: RESULTS Species abundances - Table
- Page 132 and 133: 90 — 80 — "-e-' 70 — 60 — 4
- Page 134 and 135: 35 — *** 30 25 — 1.) = .-c‘l
- Page 136 and 137: Pygospio elegans size distributions
- Page 138 and 139: which is difficult to compare with
- Page 140 and 141: eason why some invertebrates showed
- Page 142 and 143: This study did not set out to expli
- Page 144 and 145: This reliance upon the early establ
- Page 146 and 147: CHAPTER 6 INITIAL COLONISATION OF D
- Page 148 and 149: esulting community at any stage of
- Page 150 and 151: ambient sediment had been removed.
- Page 152 and 153: emoved since they were the only tax
- Page 154 and 155: All statistics were performed using
- Page 156 and 157: RESULTS Univariate analysis of spec
- Page 158 and 159: 3.5 3 5 2 11 5 1 0.5 0 40 35 Ca 30
25 —<br />
20 —<br />
5 —<br />
30 —<br />
25 —<br />
20 —<br />
15 —<br />
10 —<br />
5 —<br />
30 —<br />
25 —<br />
20 —<br />
15 —<br />
10 —<br />
5 —<br />
% Water<br />
% Water<br />
(i) Initial<br />
(ii) 6 Weeks<br />
(iii) 20 Weeks<br />
,T1flT1 , I<br />
% Organics % Silt/clay Md phi<br />
• Control<br />
0 Net<br />
Weed<br />
_rl I_ , U1E171<br />
% Organics % Silt/clay Md phi Sort. coeff.<br />
• Control<br />
0 Net<br />
0 Weed<br />
% Water % Organics % Silt/clay Md phi Sort. coeff.<br />
• Control<br />
CI Net<br />
0 Weed<br />
Sort. coeff.<br />
Figures 4.4(i-iii) : Sediment water, organic and silt/clay contents and granulometry<br />
results for initial values, and after 6 and 20 weeks (± S.E.Mean, n=6). * Denotes a<br />
I I


