- Page 1:
THESIS ENZYME-RESISTANT STARCH TYPE
- Page 5 and 6:
ACKNOWLEDGEMENTS I wish to express
- Page 7 and 8:
LIST OF TABLES Table Page 1 Classif
- Page 9 and 10:
LIST OF TABLES (Continued) Table Pa
- Page 11 and 12:
LIST OF FIGURES (Continued) Figure
- Page 13 and 14:
LIST OF FIGURES (Continued) Appendi
- Page 15 and 16:
LIST OF ABBREVIATIONS (Continued) R
- Page 17 and 18:
een used to produce a sample with l
- Page 19 and 20:
Overall objectives: OBJECTIVES 1. T
- Page 21 and 22:
However, it was discovered that a r
- Page 23 and 24:
Cassidy et al. (1994), in an intern
- Page 25 and 26:
fed both the 45 and 63g/100g rice s
- Page 27 and 28:
only about 3 g. The physiological b
- Page 29 and 30:
(Brown et al. 1995). This product,
- Page 31 and 32:
Figure 1 A detailed structure of th
- Page 33 and 34:
2.3 Chemical composition of rice st
- Page 35 and 36:
helix with only the ring oxygen poi
- Page 37 and 38:
Figure 5 Idealized diagram of the c
- Page 39 and 40:
2.5 Rice starch gelatinization Gela
- Page 41 and 42:
in excess water. The loss of birefr
- Page 43 and 44:
morphological changes occurring at
- Page 45 and 46:
amylose is the linear fraction of s
- Page 47 and 48:
units are known to inhibit retrogra
- Page 49 and 50:
(-1 to 43 o C) on concentrated star
- Page 51 and 52:
Figure 10 Schematic diagram showing
- Page 53 and 54:
ice due to the various cooking and
- Page 55 and 56:
Recently, there has been a flurry o
- Page 57 and 58:
3.1 Processing condition on improve
- Page 59 and 60:
of RS overall, 60%, among the three
- Page 61 and 62:
chains but liberates longer chains
- Page 63 and 64:
4.1 Amylolytic enzymes Three groups
- Page 65 and 66:
Structure and properties of β- amy
- Page 67 and 68:
Structure and properties: The pullu
- Page 69 and 70:
Action pattern: The amyloglucosidas
- Page 71 and 72:
methods, for instance in scanning e
- Page 73 and 74:
6. Low glycemic butter cake product
- Page 75 and 76:
Sugar increases cake volume by decr
- Page 77 and 78:
cereals, and baked potatoes. Low gl
- Page 79 and 80:
way to achieve a healthy food produ
- Page 81 and 82:
complexes. In the meantime, and inv
- Page 83 and 84:
would be only 2. In comparison, the
- Page 85 and 86:
ecause of an absolute decrease in t
- Page 87 and 88:
enhanced fat oxidation at the expen
- Page 89 and 90:
1. Raw Materials MATERIALS AND METH
- Page 91 and 92:
Methods 1. Production of resistant
- Page 93 and 94:
1.2.3 Degree of syneresis Degree of
- Page 95 and 96:
1.2.9 Starch hydrolysis rate and es
- Page 97 and 98:
1.3.3 Resistant starch content, sta
- Page 99 and 100:
2.1.1 Cake sample preparation Cake
- Page 101 and 102:
Nevertheless, the former refers to
- Page 103 and 104:
3. Experimental Design and Statisti
- Page 105 and 106:
essentially linear polymer of α-(1
- Page 107 and 108:
hydrolysis of the rice starch prehe
- Page 109 and 110:
a) b) Figure 15 Scanning electron m
- Page 111 and 112:
amylose content of starch had a har
- Page 113 and 114:
Degree of syneresis (%) 70.0 60.0 5
- Page 115 and 116:
1.2.7 Physicochemical properties of
- Page 117 and 118:
1.2.8 In vitro starch digestibility
- Page 119 and 120:
1.2.9 Hydrolysis index and glycemic
- Page 121 and 122:
Table 16 Effect of preheated treatm
- Page 123 and 124:
1.2.10 Crystallinity of RS III 108
- Page 125 and 126:
Figure 22 X-ray diffraction pattern
- Page 127 and 128:
content. The high correlation facto
- Page 129 and 130:
1.3.2 β-amylolysis (%) 114 β-amyl
- Page 131 and 132:
1.3.4 In vitro starch digestibility
- Page 133 and 134:
118 Non significant differences (P
- Page 135 and 136:
1.4.2 Degree of hydrolysis 120 The
- Page 137 and 138:
2 An application of resistant starc
- Page 139 and 140:
sucrose or maltose are reducing suc
- Page 141 and 142:
126 The different effect of HFCS on
- Page 143 and 144:
2.1.2 Sensory evaluation of HFCS re
- Page 145 and 146:
and objective percent moisture gene
- Page 147 and 148:
132 In the dietetic cake mix of Cor
- Page 149 and 150:
3) In vitro starch digestibility 13
- Page 151 and 152:
Table 23 Percentage (dwb) of starch
- Page 153 and 154:
al. (2006) reported that when gluco
- Page 155 and 156:
140 volume, crust and crumb color o
- Page 157 and 158:
(P
- Page 159 and 160:
2.2.2 Sensory evaluation of RS III
- Page 161 and 162:
3) Flavor score 146 Flavor is the m
- Page 163 and 164: 2.2.3 Chemical composition of RS II
- Page 165 and 166: Table 27 Mean values for chemical c
- Page 167 and 168: Table 28 Percentage (dwb) of starch
- Page 169 and 170: cake is lower in these samples than
- Page 171 and 172: CONCLUSIONS AND RECOMMENDATIONS 156
- Page 173 and 174: 158 syneresis of retrograded starch
- Page 175 and 176: LITERATURE CITED Abe, J.I., K. Naka
- Page 177 and 178: Biliaderis, C.G. and J. Zawastowski
- Page 179 and 180: Cheng, H.H. and M.H. Lai. 2000. Fer
- Page 181 and 182: Elgun, A. Z. Ertugay, M. Certel, an
- Page 183 and 184: Fitt L.E. and E.M. Snyder. 1984. Ph
- Page 185 and 186: Grandfeldt, A., C. Eliasson and I.
- Page 187 and 188: Hoseney, R.C. 1990. Principles of C
- Page 189 and 190: Juliano, B.O. and M.S. Goddard. 198
- Page 191 and 192: Lavin, M., E. Eshbaugh, J.-M. Hu, S
- Page 193 and 194: Ludwig, D.S. and R.H. Eckel. 2002.
- Page 195 and 196: Meilgaard, M., Civille, O.V., and C
- Page 197 and 198: Nakazawa, F., S. Noguchi, J.Takahas
- Page 199 and 200: Piyarat, N. 2003. The assessment of
- Page 201 and 202: Schoch, T. J. 1969. Non-carbohydrat
- Page 203 and 204: Srinivasa Rao, P. 1970. Studies on
- Page 205 and 206: Towar, J., C. Melito, E. Herrera, A
- Page 207 and 208: Yuan, R.C. and D.B. Thompson. 1998.
- Page 209 and 210: Appendix A Chemical analysis proced
- Page 211 and 212: 2.2 Method determination 196 Total
- Page 213: source and detach the extractor and
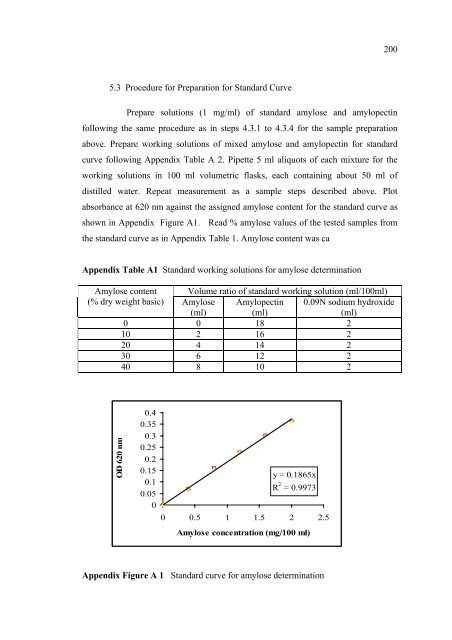
- Page 217 and 218: 1) Standard curve procedure 202 Usi
- Page 219 and 220: 7. Reducing sugar determination by
- Page 221 and 222: 8. Resistant starch determination b
- Page 223 and 224: 8.2.3 Measurement of resistant star
- Page 225 and 226: lank. starch. 210 3. Measure the ab
- Page 227 and 228: Appendix B Physical analysis proced
- Page 229 and 230: 2. X Ray Diffraction Measurement 2.
- Page 231 and 232: Appendix C Picture of some experime
- Page 233 and 234: Heated debranched samples Cooled de
- Page 235 and 236: Appendix Figure C4 Visuals appearan
- Page 237 and 238: 1. Introduction 222 There are sever
- Page 239 and 240: Appendix E Experimental data 224
- Page 241 and 242: Appendix Table E3 X-ray diffraction
- Page 243 and 244: Appendix F List of publications 228
- Page 245 and 246: 230
- Page 247 and 248: 232
- Page 249 and 250: 234
- Page 251 and 252: 236
- Page 253 and 254: 238
- Page 255 and 256: 240
- Page 257 and 258: 242
- Page 259 and 260: 244
- Page 261 and 262: 246
- Page 263: NAME : Miss Jirapa Pongjanta BIRTH