2005 - National Women's Hospital - Auckland District Health Board
2005 - National Women's Hospital - Auckland District Health Board
2005 - National Women's Hospital - Auckland District Health Board

Create successful ePaper yourself
Turn your PDF publications into a flip-book with our unique Google optimized e-Paper software.
Cover artwork:<br />
Chris Charteris, 2004. Unconditional love. Medium: Gold-lipped mother of pearl<br />
with bright yellow and red pigment.<br />
Chris Charteris, 2004. The unborn child and its connection to the universe.<br />
Medium: Mother of pearl in silver.<br />
Te Ao Marama Ngarimu, 2004. Kete Whakairo. Medium: Woven flax fibre.<br />
NICU and <strong>National</strong> <strong>Women's</strong> <strong>Health</strong> are deeply indebted to FHE Galleries<br />
(<strong>Auckland</strong>), Kathlene Fogarty, and the artists for providing the artwork installed in<br />
NICU (http://www.fhegalleries.com).<br />
2
<strong>National</strong> Women’s<br />
Annual Clinical Report<br />
Contact Details<br />
Marjet Pot, Project Manager<br />
marjetp@adhb.govt.nz<br />
Lynn Sadler, Epidemiologist<br />
lynns@adhb.govt.nz<br />
1<br />
<strong>2005</strong><br />
Shirley Beer, Maternity Clinical Information<br />
sbeer@adhb.govt.nz<br />
David Knight, Clinical Leader<br />
davidk@adhb.govt.nz<br />
Carl Kuschel, Clinical Director Neonatal Paediatrics<br />
carlk@adhb.govt.nz<br />
Denys Court, Clinical Director Obstetrics and<br />
Gynaeocology<br />
denysc@adhb.govt.nz
Reproduction of material<br />
<strong>National</strong> Women’s, <strong>Auckland</strong> <strong>District</strong> <strong>Health</strong> <strong>Board</strong>, permits the reproduction of material from this<br />
publication without prior notification, provided that all of the following conditions are met: the<br />
information must not be distorted or changed, and <strong>National</strong> Women’s must be acknowledged as<br />
the source.<br />
Disclaimer<br />
The purpose of this publication is to promote discussion and audit outcomes. The opinions<br />
expressed in this publication do not necessarily reflect the official views of <strong>National</strong> Women’s and<br />
<strong>Auckland</strong> <strong>District</strong> <strong>Health</strong> <strong>Board</strong>.<br />
Acknowledgements<br />
Project team<br />
Marjet Pot Project Co-ordinator<br />
Lynn Sadler Epidemiologist<br />
Andrea Hickman Data Manager/Analyst<br />
Shirley Beer Maternity Clinical Information<br />
David Knight Clinical Leader NW<br />
Carl Kuschel Clinical Director Newborn Service<br />
Denys Court Clinical Director Obstetrics and Gynaecology<br />
Many people have assisted in the production of this publication which has been appreciated by<br />
the project team<br />
Special thanks to all who provide, enter and check data used in this Annual Clinical Report,<br />
especially Julie Porfiriadis, Coralee Jones, and Coila Bevin, and to the clinicians who have<br />
provided chapter comments, especially Professor Peter Stone, Professor Cindy Farquhar,<br />
Associate Professor Lesley McCowan, Dr Janet Rowan, Dr Rose Elder, Dr Jenny MacDougall, Dr<br />
Renuka Bhat, Margaret Berry, Dr Claire McLintock, Margaret Merrilees, Dr Guy Gudex, Heidi<br />
Anderson, Lee Neale, Julie Arthur, Ann Yates, Marcia Roberts.<br />
ISSN 1175-6667<br />
This document is available on the <strong>National</strong> Women’s website<br />
http://www.adhb.govt.nz/nwhealthinfo<br />
2
Welcome to our <strong>2005</strong> Annual Clinical Report, which is the thirteenth in our series. Our<br />
Annual Clinical Report provides an opportunity for us to analyse and review our<br />
performance. The opportunity to share our information with colleagues and compare our<br />
results is valued.<br />
Understanding our service in relation to others provides us with opportunities to both<br />
improve in some areas of service delivery and also consolidate our performance in<br />
others. Our main focus, as always, remains on improving services to women and the<br />
newborn.<br />
<strong>2005</strong> was our first full year for our inpatient services at <strong>Auckland</strong> City <strong>Hospital</strong>. The<br />
<strong>National</strong> <strong>Women's</strong> <strong>Health</strong> facilities at Level 9 and Level 10 have been greatly<br />
appreciated by women and staff alike. Outpatient based services on the Greenlane<br />
Clinical Centre Campus moved to improved facilities in the early part of <strong>2005</strong>. These<br />
new facilities have also provided enhanced environments for the women who access our<br />
services.<br />
Thank you for sharing in our Annual Clinical Report.<br />
Kay Hyman<br />
General Manager <strong>National</strong> Women’s<br />
3
TABLE of CONTENTS<br />
1 INTRODUCTION ...............................................................................................................19<br />
1.1 PURPOSE OF THIS REPORT ...........................................................................................19<br />
1.2 REPORT STRUCTURE ....................................................................................................19<br />
1.3 DESCRIPTION OF MOTHERS AND BABIES INCLUDED IN THE ANNUAL CLINICAL REPORT..........20<br />
1.4 DATA SOURCES............................................................................................................20<br />
1.5 DATA QUALITY .............................................................................................................22<br />
1.6 DERIVED DEFINITIONS (MATERNITY)................................................................................22<br />
1.7 ANALYTICAL AND STATISTICAL METHODS.........................................................................24<br />
1.8 CLINICAL INDICATORS ...................................................................................................24<br />
2 SUMMARY STATISTICS...................................................................................................27<br />
2.1 MOTHER AND BABY NUMBERS: NATIONAL WOMEN’S <strong>2005</strong> ................................................27<br />
2.2 SUMMARY OF MATERNAL OUTCOMES <strong>2005</strong>......................................................................28<br />
2.3 SUMMARY OF NEONATAL OUTCOMES <strong>2005</strong>......................................................................30<br />
3 MATERNAL DEMOGRAPHY............................................................................................33<br />
3.1 MATERNAL DOMICILE ....................................................................................................33<br />
3.2 MATERNAL AGE............................................................................................................33<br />
3.3 PARITY........................................................................................................................34<br />
3.4 MATERNAL ETHNICITY...................................................................................................34<br />
3.5 LEAD MATERNITY CARER AND MATERNAL DEMOGRAPHIC CHARACTERISTICS.......................35<br />
3.6 SMOKING ....................................................................................................................36<br />
3.7 BODY MASS INDEX........................................................................................................37<br />
3.8 STANDARD PRIMIPARA ..................................................................................................37<br />
4 ANTENATAL COMPLICATIONS ......................................................................................41<br />
4.1 PRETERM BIRTH...........................................................................................................41<br />
4.2 SMALL FOR GESTATIONAL AGE (SGA).............................................................................44<br />
4.3 MULTIPLE PREGNANCY .................................................................................................46<br />
4.4 DIABETES....................................................................................................................50<br />
4.5 ANTEPARTUM HAEMORRHAGE........................................................................................56<br />
4.6 CERVICAL CERCLAGE....................................................................................................57<br />
4.7 HYPERTENSIVE DISORDERS OF PREGNANCY....................................................................59<br />
5 LABOUR AND BIRTH.......................................................................................................65<br />
5.1 INDUCTION OF LABOUR..................................................................................................65<br />
5.2 USE OF SYNTOCINON ...................................................................................................70<br />
5.3 MODE OF BIRTH ...........................................................................................................72<br />
5.4 CAESAREAN SECTION ...................................................................................................76<br />
4
5.5 INSTRUMENTAL VAGINAL BIRTH ......................................................................................78<br />
5.6 BREECH BIRTH.............................................................................................................81<br />
5.7 OBSTETRIC ANALGESIA .................................................................................................82<br />
5.8 PERINEAL TRAUMA .......................................................................................................85<br />
5.9 POSTPARTUM HAEMORRHAGE .......................................................................................87<br />
5.10 EMERGENCY PERIPARTUM HYSTERECTOMY.....................................................................89<br />
5.11 NEONATAL OUTCOMES BY MODE OF BIRTH ......................................................................90<br />
5.12 LABOUR AND BIRTH AT BIRTHCARE.................................................................................92<br />
6 POSTNATAL CARE..........................................................................................................97<br />
6.1 INFANT FEEDING...........................................................................................................97<br />
6.2 POSTNATAL ADMISSIONS.............................................................................................102<br />
7 NEWBORN SERVICES...................................................................................................109<br />
7.1 ADMISSIONS TO THE NEWBORN INTENSIVE CARE UNIT ...................................................109<br />
7.2 INFECTION.................................................................................................................112<br />
7.3 IMMUNISATION ...........................................................................................................113<br />
7.4 BREASTFEEDING IN NICU ADMISSIONS .........................................................................113<br />
7.5 HYPOXIC ISCHAEMIC ENCEPHALOPATHY (HIE)...............................................................115<br />
7.6 ASSISTED VENTILATION...............................................................................................116<br />
7.7 VERY LOW BIRTH WEIGHT INFANTS ...............................................................................123<br />
7.8 SURVIVAL OF BABIES FROM 23 TO 31 WEEKS GESTATIONAL AGE BORN IN NW ...................125<br />
7.9 INTRAVENTRICULAR HAEMORRHAGE IN ALL VERY LOW BIRTH WEIGHT INFANTS ADMITTED TO<br />
NICU FROM 1985 TO <strong>2005</strong>.........................................................................................126<br />
7.10 MORBIDITY OF INBORN VERY LOW BIRTH WEIGHT INFANTS AND BABIES
10 GYNAECOLOGY ............................................................................................................157<br />
10.1 HYPEREMESIS ...........................................................................................................157<br />
10.2 ECTOPIC PREGNANCY.................................................................................................159<br />
10.3 HYSTERECTOMY ........................................................................................................161<br />
11 TERMINATION OF PREGNANCY...................................................................................165<br />
12 APPENDICES ............................................................................................................... 1657<br />
APPENDIX 1. METHODOLOGY.............................................................................................169<br />
APPENDIX 2. SUMMARY STATISTICS .................................................................................173<br />
APPENDIX 3. MATERNAL DEMOGRAPHY ...........................................................................174<br />
APPENDIX 4. ANTENATAL COMPLICATIONS......................................................................181<br />
APPENDIX 5. LABOUR AND BIRTH......................................................................................188<br />
APPENDIX 6. POSTNATAL CARE.........................................................................................188<br />
APPENDIX 7. NEWBORN......................................................................................................208<br />
APPENDIX 8. PERINATAL MORTALITY................................................................................224<br />
APPENDIX 9. TERMINATION OF PREGNANCY ...................................................................228<br />
APPENDIX 10. GLOSSARY OF ABBREVIATIONS..................................................................229<br />
APPENDIX 11. DEFINITIONS .................................................................................................230<br />
6
LIST of TABLES<br />
Table 1: Mother and baby numbers: <strong>National</strong> Women’s <strong>2005</strong>……………………………………… 27<br />
Table 2: Mother and baby numbers by plurality: <strong>National</strong> Women’s <strong>2005</strong>…………………………27<br />
Table 3: Mode of onset of birth………………………………………………………………………… 28<br />
Table 4: Mode of birth…………………………………………………………………………………… 28<br />
Table 5: Postpartum outcome summary……………………………………………………………….29<br />
Table 6: Neonatal outcomes of babies born at <strong>National</strong> Women’s in <strong>2005</strong>……………………….. 30<br />
Table 7: Perinatal mortality <strong>2005</strong>……………………………………………………………………… 30<br />
Table 8: Rates of preterm birth
Table 36: Blood transfusion…………………………………………………………………………….. 88<br />
Table 37: Postpartum blood loss by mode of birth…………………………………………………… 88<br />
Table 38: Neonatal morbidity overall and by mode of birth (all gestations)……………………….. 90<br />
Table 39: Neonatal morbidity (by mode of birth) in term or post term (> 37 weeks) babies………90<br />
Table 40: Neonatal morbidity in term or post term (> 37 weeks) babies 2000-<strong>2005</strong>……………… 91<br />
Table 41: Demographic characteristics of women labouring at Birthcare by place of birth……… 92<br />
Table 42: Interventions and outcomes by parity among women commencing labour at Birthcare 93<br />
Table 43: Exclusive breastfeeding by mode of birth………………………………………………….. 98<br />
Table 44: Maternal destination immediately following birth………………………………………….<br />
Table 45: Length of stay by mode of birth among admissions to NW wards…………………….. 104<br />
Table 46: Reasons for readmission…………………………………………………………………… 104<br />
Table 47: Admissions to the Newborn Intensive Care Unit………………………………………… 109<br />
Table 48: Occupancy (baby-days) on NICU from 1999…………………………………………….. 111<br />
Table 49: Details of Hypoxic Ischaemic Encephalopathy Stages 2 or 3………………………….. 115<br />
Table 50: Number of babies on assisted ventilation………………………………………………… 116<br />
Table 51: HFOV and inhaled nitric oxide (iNO) use and survival over the last 10 years……….. 121<br />
Table 52: Outcome Categories for Infants under 30 Months of Age……………………………… 136<br />
Table 53: Outcome Categories at 18 Months for Children Under 1500g………………………… 137<br />
Table 54: Outcome of children
Table 71: Length of stay by type of hysterectomy ………………………………………………….. 162<br />
Table 72: Number of terminations…………………………………………………………………….. 165<br />
Table 73: Number of counselling sessions………………………………………………………….. 165<br />
Table 74: Level 2 prioritisation of ethnicity ………………………………………………………….. 172<br />
Table 75: Mode of birth 1998-<strong>2005</strong>…………………………………………………………………… 173<br />
Table 76: Domicile of women giving birth at <strong>National</strong> Women’s 2002-<strong>2005</strong>…………………….. 174<br />
Table 77: Maternal age distribution 2000-<strong>2005</strong>……………………………………………………… 174<br />
Table 78: Maternal age and parity…………………………………………………………………….. 174<br />
Table 79: Time trends in Nulliparity and Multiparity ……………………………………………….. 175<br />
Table 80: Prioritised ethnicity of women giving birth at <strong>National</strong> Women’s……………………… 175<br />
Table 81: Maternal ethnicity and age………………………………………………………………… 176<br />
Table 82: Ethnicity of women birthing at NW………………………………………………………… 176<br />
Table 83: Maternal ethnicity and parity………………………………………………………………. 176<br />
Table 84: LMC at birth…………………………………………………………………………………. 177<br />
Table 85: LMC at birth and maternal age…………………………………………………………… 177<br />
Table 86: LMC at birth and maternal ethnicity……………………………………………………… 178<br />
Table 87: LMC at birth and parity…………………………………………………………………….. 178<br />
Table 88: Smoking status and ethnicity……………………………………………………………… 179<br />
Table 89: Smoking and age…………………………………………………………………………… 179<br />
Table 90: Demographic characteristics of standard and non-standard primipara………………. 180<br />
Table 91: Preterm birth rate and demographic characteristics……………………………………. 181<br />
Table 92: Preterm birth ( 20 weeks gestation 183<br />
Table 95: Demographic characteristics of women with diabetes………………………………….. 183<br />
Table 96: Perinatal deaths 1993 – <strong>2005</strong> among babies of women with diabetes……………….. 184<br />
Table 97: Maternal outcomes among women with diabetes……………………………………….. 184<br />
Table 98: Characteristics of pregnancies complicated by antepartum haemorrhage…………… 185<br />
Table 99: Maternal outcomes of pregnancies complicated by antepartum haemorrhage……… 185<br />
Table 100: Fetal/neonatal outcomes of pregnancies complicated by antepartum haemorrhage 186<br />
Table 101: Demographic characteristics of women with hypertensive disease…………………. 187<br />
Table 102: Onset of birth among women with hypertensive disease…………………………….. 187<br />
Table 103: Induction of labour rates (1992-<strong>2005</strong>) …………………………………………………. 188<br />
Table 104: Indication for induction (all births) ……………………………………………………… 188<br />
Table 105: Rates of indication for induction by parity (term births) ………………………………. 189<br />
Table 106: Rates of indication for induction by age among nulliparous women (all gestations). 189<br />
Table 107: Demography of onset of birth at term…………………………………………………… 190<br />
9
Table 108: Induction rate by indication and ethnicity among nulliparous women (all gestations)191<br />
Table 109: Induction rate by indication and age among nulliparous women (all gestations)……191<br />
Table 110: Mode of birth at term by onset of birth and parity……………………………………… 192<br />
Table 111: Mode of birth at term among nulliparous women by most common indications for<br />
induction…………………………………………………………………………………… 192<br />
Table 112: Mode of birth at term among multiparous women by most common indications for<br />
induction…………………………………………………………………………………… 192<br />
Table 113: Gestation at birth among women whose primary indication for induction was ‘post<br />
dates’………………………………………………………………………………………. 193<br />
Table 114: Dilatation at start of syntocinon in induced and spontaneous labour-nullipara……... 193<br />
Table 115: Dilatation at start of syntocinon in induced and spontaneous labour-multipara……. 193<br />
Table 116: Mode of birth by parity and previous caesarean section status……………………… 194<br />
Table 117: Mode of birth by ethnicity…………………………………………………………………. 194<br />
Table 118: Mode of birth by maternal age…………………………………………………………… 194<br />
Table 119: Mode of birth by LMC at time of birth – nullipara………………………………………. 195<br />
Table 120: Mode of birth by LMC at time of birth – standard primipara ………………………… 195<br />
Table 121: Mode of birth by LMC at time of birth – multipara…………………………………….. 196<br />
Table 122: Indication for caesarean section by parity and gestation……………………………… 196<br />
Table 123: Indication for caesarean section at term by parity and type of caesarean section… 197<br />
Table 124: Operative vaginal birth rates………………………………………………………………197<br />
Table 125: Type of operative vaginal birth: 1992-<strong>2005</strong>…………………………………………….. 197<br />
Table 126: Mode of birth by ethnicity-nullipara……………………………………………………… 198<br />
Table 127: Mode of birth by ethnicity-multipara…………………………………………………….. 198<br />
Table 128: Breech birth 1995-<strong>2005</strong>………………………………………………………………….. 199<br />
Table 129: Mode of birth by type of breech (singletons only) ……………………………………. 199<br />
Table 130: Mode of birth by type of breech (multiples only) ……………………………………… 199<br />
Table 131: Epidural use among women with spontaneous and induced labour rates …………. 200<br />
Table 132: Analgesic use and maternal age (among nulliparous spontaneous and induced<br />
labours) …………………………………………………………………………………… 200<br />
Table 133: Analgesic use and LMC type among nulliparous spontaneous and induced<br />
labours…………………………………………………………………………………...… 200<br />
Table 134: Analgesic use and ethnicity (among nulliparous spontaneous and induced labours)201<br />
Table 135: Perineal trauma by mode of birth, parity and LMC…………………………………….. 202<br />
Table 136: Episiotomy in SVB by LMC at birth and parity…………………………………………. 202<br />
Table 137: 3 rd and 4 th degree tears in SVB by LMC at birth and parity…………………………… 203<br />
Table 138: Postpartum transfusion rates by recorded blood loss at birth………………………… 203<br />
Table 139: Method of infant feeding at discharge from NW……………………………………….. 204<br />
10
Table 140: Maternal demography and infant feeding on discharge from NW……………………. 204<br />
Table 141: Clinical characteristics and infant feeding on discharge from NW…………………… 205<br />
Table 142: Infant feeding at discharge from NW Homecare by LMC…………………………….. 205<br />
Table 143: Maternal destination following birth by mode of birth………………………………….. 205<br />
Table 144: Maternal destination following birth by LMC……………………………………………. 206<br />
Table 145: Maternal destination following birth by ethnicity……………………………………….. 206<br />
Table 146: Postnatal readmission reason by maternal destination following birth……………… 206<br />
Table 147: Postnatal readmission by LMC at birth…………………………………………………. 207<br />
Table 148: Admissions to NICU by gestational age of babies born in <strong>National</strong> Women’s……… 208<br />
Table 149: Admissions to NICU by birth weight of babies born in <strong>National</strong> Women’s………….. 209<br />
Table 150: Admissions to NICU by gestational age of babies transferred postpartum…………. 209<br />
Table 151: Admissions by birth weight of babies transferred postpartum to <strong>National</strong> Women’s. 210<br />
Table 152: Domicile of mother of all babies admitted to NICU…………………………………….. 210<br />
Table 153: Domicile of mother of babies
Table 173: Chronic lung disease by birth weight……………………………………………………. 217<br />
Table 174: Chronic lung disease by gestational age……………………………………………….. 218<br />
Table 175: Necrotising enterocolitis (NEC) by birth weight………………………………………… 218<br />
Table 176: Necrotising enterocolitis by gestational age……………………………………………. 218<br />
Table 177: Patent Ductus Arteriosus by birth weight……………………………………………….. 219<br />
Table 178: Patent Ductus Arteriosus by gestational age…………………………………………… 219<br />
Table 179: Pneumothorax by birth weight…………………………………………………………… 219<br />
Table 180: Pneumothorax by gestational age……………………………………………………….. 220<br />
Table 181: Percentage receiving antenatal corticosteroids by birth weight………………………. 220<br />
Table 182: Percentage receiving antenatal corticosteroids by gestational age………………….. 220<br />
Table 183: Extremely preterm neonatal and post-neonatal deaths ……………………………… 221<br />
Table 184: Premature neonatal and post-neonatal deaths ………………………………………... 222<br />
Table 185: Term/post-term neonatal and post-neonatal deaths………………………………….. 222<br />
Table 186: Babies with associated anomalies, neonatal and post-neonatal deaths …………… 222<br />
Table 187: Babies with lethal anomalies, neonatal and post-neonatal deaths …………………. 223<br />
Table 188: Postnatal transfer deaths ………………………………………………………………… 224<br />
Table 189: Perinatal and perinatal- related losses 1992 - <strong>2005</strong>…………………………………… 224<br />
Table 190: Perinatal mortality rate (per 1000 births) and perinatal-related loss rate (per 1000<br />
births) adjusted for termination for fetal abnormalities……………………………….. 224<br />
Table 191: Maternal characteristics and perinatal related mortality………………………………. 225<br />
Table 192: Cause of death 2000-<strong>2005</strong>……………………………………………………………….. 226<br />
Table 193: Termination of pregnancy among causes of death <strong>2005</strong>………………………………226<br />
Table 194: Perinatal deaths by cause (PSANZ-PDC) and gestational age……………………… 226<br />
Table 195: Necropsy rates 2001 – <strong>2005</strong>………………………………………………………..…… 227<br />
Table 196: Perinatal full necropsy rates …………………………………………………………….. 227<br />
Table 197: Demography and characteristics of women attending E.D.U. ………………………. 228<br />
12
LIST OF FIGURES<br />
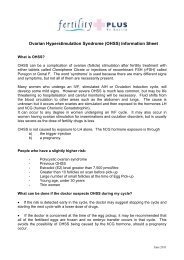
Figure 1: Numbers of women birthing and babies born at <strong>National</strong> Women’s 1991-<strong>2005</strong>............27<br />
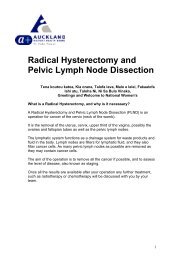
Figure 2: Mode of birth 1998-<strong>2005</strong>.............................................................................................29<br />
Figure 3: Maternal age distribution (1991-<strong>2005</strong>).........................................................................33<br />
Figure 4: Parity distribution (1992-<strong>2005</strong>) ....................................................................................34<br />
Figure 5: Maternal age among Maori, Pacific and Indian ethnicities ...........................................34<br />
Figure 6: Maternal age among NZ European, Asian, Other European and Other ethnicities .......34<br />
Figure 7: Parity distribution by maternal ethnicity .......................................................................35<br />
Figure 8: LMC at birth and maternal age....................................................................................35<br />
Figure 9: LMC at birth and maternal ethnicity.............................................................................36<br />
Figure 10: LMC at birth and parity..............................................................................................36<br />
Figure 11: Ethnicity of standard primpara...................................................................................37<br />
Figure 12: LMC at birth of standard primpara.............................................................................38<br />
Figure 13: Spontaneous and iatrogenic preterm birth (
Figure 34: Caesarean section rate among NW LMC October 2002- December <strong>2005</strong> .................75<br />
Figure 35: Caesarean section rate among Non-NW LMC October 2002- December <strong>2005</strong>..........75<br />
Figure 36: Contribution of gestation and parity to principal indications for caesarean section......78<br />
Figure 37: Operative vaginal birth (1992-<strong>2005</strong>) ..........................................................................79<br />
Figure 38: Mode of birth by ethnicity among nullipara ................................................................80<br />
Figure 39: Mode of birth by ethnicity among multipara ...............................................................80<br />
Figure 40: Analgesia use by induction status among spontaneous and induced labours.............83<br />
Figure 41: Use of analgesia by parity among spontaneous and induced labours ........................83<br />
Figure 42: Analgesic use and maternal age among nulliparous labours .....................................83<br />
Figure 43: Analgesic use and LMC type among nulliparous labours...........................................84<br />
Figure 44: Analgesic use and ethnicity among nulliparous labours .............................................84<br />
Figure 45: Episiotomy rates .......................................................................................................85<br />
Figure 46: Episiotomy associated with spontaneous vaginal birth by LMC at birth and parity......86<br />
Figure 47: Postpartum haemorrhage rates (1992-<strong>2005</strong>).............................................................87<br />
Figure 48: Emergency peripartum hysterectomy rates/1000 births (1992-<strong>2005</strong>) .........................89<br />
Figure 49: Method of infant feeding at discharge in <strong>2005</strong> ...........................................................97<br />
Figure 50: Infant feeding at discharge from NW by mode of birth ...............................................98<br />
Figure 51: Infant feeding at discharge from NW by maternal age ...............................................98<br />
Figure 52: Infant feeding at discharge from NW by maternal ethnicity ........................................99<br />
Figure 53: Infant feeding at discharge from NW by gestation at birth.........................................99<br />
Figure 54: Infant feeding at discharge from NW by fetal birthweight ...........................................99<br />
Figure 55: Infant feeding at discharge from NW by LMC ..........................................................100<br />
Figure 56: Comparison of exclusive and fully breastfeeding rates at discharge from NW facility<br />
and discharge from NW Homecare .......................................................................100<br />
Figure 57: Artificial feeding at discharge from NW facility and discharge from NW Homecare...101<br />
Figure 58: Maternal destination by mode of birth......................................................................102<br />
Figure 59: Postnatal destination by LMC..................................................................................103<br />
Figure 60: Postnatal destination by ethnicity ............................................................................103<br />
Figure 61: Rates of readmission indication by maternal destination following birth. ..................105<br />
Figure 62: Indication for readmission by LMC group at time of birth .........................................105<br />
Figure 63: Admissions to NICU 1981-<strong>2005</strong> ..............................................................................109<br />
Figure 64: Admissions to NICU by gestational age...................................................................110<br />
Figure 65: Admissions to NICU by birth weight ........................................................................110<br />
Figure 66: Admissions to NICU by maternal domicile...............................................................111<br />
Figure 67: Occupancy (baby days per year) of NICU by gestational age ..................................111<br />
Figure 68: Occupancy (baby days per year) of NICU by birth weight........................................112<br />
Figure 69: Infant feeding on discharge from NICU by birth weight ............................................113<br />
14
Figure 70: Infant feeding on discharge from NICU by gestational age ......................................114<br />
Figure 71: Median ventilation days on IPPV and CPAP and IPPV+CPAP by gestational age<br />
among survivors (<strong>2005</strong>) ........................................................................................116<br />
Figure 72: Proportion of babies receiving assisted ventilation (excluding for surgery or a<br />
congenital anomaly) 2003-<strong>2005</strong>............................................................................116<br />
Figure 73: Median days on IPPV .............................................................................................117<br />
Figure 74: Median days on CPAP............................................................................................117<br />
Figure 75: Median days on CPAP + IPPV................................................................................117<br />
Figure 76: Number on IPPV.....................................................................................................118<br />
Figure 77: Number on CPAP ...................................................................................................118<br />
Figure 78: Number on CPAP + IPPV .......................................................................................118<br />
Figure 79: Percentage on IPPV ...............................................................................................119<br />
Figure 80: Percentage on CPAP..............................................................................................119<br />
Figure 81: Median days on IPPV .............................................................................................119<br />
Figure 82: Median days on CPAP............................................................................................119<br />
Figure 83: Percentage on IPPV ...............................................................................................120<br />
Figure 84: Percentage on CPAP..............................................................................................120<br />
Figure 85: Median days on IPPV .............................................................................................120<br />
Figure 86: Median days on CPAP............................................................................................120<br />
Figure 87: HFOV at 24-7 weeks ..............................................................................................121<br />
Figure 88: Inhaled nitric oxide at 24-7 weeks ...........................................................................121<br />
Figure 89: Number of term and post term babies needing assisted ventilation..........................122<br />
Figure 90: Number of VLBW who were born elsewhere and admitted to NICU, or were born in<br />
ACH and alive at birth...........................................................................................123<br />
Figure 91: Number of inborn live-births ≤1500g from 1959 to <strong>2005</strong> ..........................................123<br />
Figure 92: Neonatal survival (0-28 days) of ≤1500g inborn live-births from 1959 to <strong>2005</strong>..........124<br />
Figure 93: Numbers of babies born alive at 23 to 31 weeks gestation in 2000-<strong>2005</strong> .................125<br />
Figure 94: Survival to discharge home of babies born in 2000-<strong>2005</strong>. ......................................125<br />
Figure 95: Survival of babies born in <strong>National</strong> Women’s and admitted to NICU ......................125<br />
Figure 96: Intraventricular haemorrhage in all
Figure 104: ROP at 28-31 weeks.............................................................................................130<br />
Figure 105: Chronic lung disease at 24-27wks.........................................................................131<br />
Figure 106: Chronic lung disease at 28-31wks.........................................................................131<br />
Figure 107: NEC in babies under 28 weeks gestation (with 95% confidence intervals) compared<br />
with the incidence in the ANZNN 1995-<strong>2005</strong>......................................................132<br />
Figure 108: Antenatal corticosteroids at 24-7 weeks ................................................................133<br />
Figure 109: Antenatal corticosteroids at 28-31 weeks ..............................................................133<br />
Figure 110: Percentage receiving postnatal dexamethasone by gestational age ......................134<br />
Figure 111: Percentage receiving postnatal dexamethasone by birth weight ............................134<br />
Figure 112: Caesarean section at 24-31wks ............................................................................134<br />
Figure 113: Outcome at 18 months of children
section<br />
1<br />
INTRODUCTION<br />
17
1 INTRODUCTION<br />
1.1 Purpose of this Report<br />
The purpose of the <strong>National</strong> Women’s Annual Clinical Report is:<br />
• To chronicle the care provided at <strong>National</strong> Women’s (NW) during <strong>2005</strong><br />
• To demonstrate trends in the population, service provision, and outcomes over<br />
time<br />
• To stimulate further analysis and thus improvement in services provided by NW<br />
• To encourage external commentary and critique of care provided at NW<br />
• To provide a benchmark for obstetric and neonatal care in New Zealand against<br />
which other services might compare themselves<br />
1.2 Report structure<br />
This year we have tried to present the report in a more descriptive style and have<br />
changed the format from previous years. The chapters contain figures and commentary<br />
with limited data tables. The similarly numbered appendices contain the comprehensive<br />
data tables relevant to the commentary in each chapter. The report is divided into the<br />
following chapters:<br />
Chapter 1: Introduction<br />
This chapter provides background information, describes the data sources and the<br />
methodology.<br />
Chapter 2: Summary statistics<br />
This chapter provides, for the obstetric and neonatal population at NW, the summary<br />
data on principal outcomes.<br />
Chapter 3: Maternal demography<br />
This chapter provides information on domicile, age, ethnicity, parity, smoking behaviour,<br />
and LMC for the women who birthed at <strong>National</strong> Women’s. It also provides data on the<br />
characteristics of standard primipara at NW.<br />
Chapter 4: Antenatal complications<br />
This chapter focuses on the following antenatal complications: diabetes, preterm birth,<br />
multiple pregnancy, antepartum haemorrhage, growth restriction, hypertensive disease<br />
and cervical cerclage.<br />
Chapter 5: Labour and birth<br />
This chapter focuses on birth interventions including induction of labour, mode of birth,<br />
and neonatal and maternal outcomes associated with birthing.<br />
Chapter 6: Postnatal care<br />
This chapter focuses on feeding outcomes and provision of postnatal care.<br />
19
Chapter 7: Newborn services<br />
This chapter describes interventions and outcomes for the babies cared for in the<br />
neonatal intensive care unit in <strong>2005</strong>. It includes a report of activity of the Child<br />
Development Unit.<br />
Chapter 8: Maternal and perinatal mortality<br />
This chapter provides information and analysis about mothers and babies who died at<br />
<strong>National</strong> Women’s.<br />
Chapter 9: Fertility<br />
This chapter documents the IVF and ICSI clinical outcomes from Fertility Plus in <strong>2005</strong><br />
and a discussion on recent advances in the service.<br />
Chapter 10: Gynaecology<br />
This chapter provides limited information on inpatient services provided at NW including<br />
care for women with hyperemesis, ectopic pregnancy and those undergoing<br />
hysterectomy.<br />
Chapter 11: Termination of pregnancy<br />
This chapter provides information on the number and demographic characteristics of<br />
women who have a termination at Epsom Day Unit.<br />
Appendices<br />
The appendices provide additional detailed statistical tables for the chapters. The<br />
appendices are numbered consistently with the chapters to which they apply.<br />
1.3 Description of mothers and babies included in the Annual<br />
Clinical Report<br />
The Maternity section of this Annual Clinical Report includes data pertaining to women<br />
giving birth to their babies at and beyond 20 weeks gestation at <strong>National</strong> Women’s<br />
during the <strong>2005</strong> calendar year or, if prior to arrival, due to unplanned birth at home or en<br />
route (BBA = born before arrival), and the babies of these women. Data in the Neonatal<br />
section pertain to all babies admitted to and cared for at the NW Neonatal Intensive Care<br />
Unit if born during the <strong>2005</strong> calendar year. This includes babies transferred from other<br />
units or home.<br />
1.4 Data sources<br />
Data for this report have been extracted from <strong>Health</strong>ware (ibahealth) and from standalone<br />
databases for Neonatology, Perinatal Mortality, Fertility Plus, Epsom Day Unit, and<br />
from the Decision Support Unit (DSU) who collect ICD-10 coded data on all inpatient<br />
admissions. Data from electronic discharges have also been used to reconcile<br />
gynaecology inpatient data.<br />
Data for years prior to 2001 were collected into the AMSIS (<strong>Auckland</strong> Maternity Services<br />
Information System) database. For this report, most data for the years prior to 2001,<br />
included in tables and figures to demonstrate time trends, have been obtained from<br />
previous Annual Clinical Reports.<br />
20
1.4.1 <strong>Health</strong>ware<br />
In 2001, <strong>Health</strong>ware was introduced to <strong>National</strong> Women’s to replace the clinical<br />
database system AMSIS. The implementation process was difficult and no systems were<br />
initially put in place for data extraction and cleaning. As a result, not all 2001 births were<br />
recorded. Further, data on all births were captured in 2002 and 2003, but these data<br />
were cleaned only sporadically with the focus directed to claiming via Section 88.<br />
Since 2004, Information Services staff have modified and developed early <strong>Health</strong>ware<br />
data extraction tools allowing improved flexibility. This has greatly enhanced clinical data<br />
management.<br />
The majority of booking data on mothers with non-<strong>National</strong> Women’s LMCs are entered<br />
into <strong>Health</strong>ware by one <strong>Health</strong>ware administrator. Booking data for NW bookings, and all<br />
antenatal, birth, and postnatal data are entered by clerks and NW midwives.<br />
Cleaning is undertaken daily for birth numbers. On a monthly basis, cleaning of place<br />
and mode of birth and reconciliation with Birthcare numbers is undertaken. Further to<br />
this, monthly cleaning is undertaken for Section 88 claiming. This is primarily cleaning of<br />
missing data.<br />
For the 2004 and <strong>2005</strong> years, the data have been cleaned for the purpose of this clinical<br />
report. Cleaning has included completing missing data and checking out of range and<br />
inconsistent data. These cleaning strategies have been focussed around priority areas<br />
for reporting and areas where cleaning could be efficiently completed within the resource<br />
available. Further details of variables cleaned are provided below and in Appendix 1.<br />
Data on gynaecological inpatient visits have been collected during the 2006 year and will<br />
be reported in our next Annual Clinical Report.<br />
1.4.2 Decision Support Unit (DSU)<br />
DSU data were used, along with <strong>Health</strong>ware data, to clean hypertension, antepartum<br />
and postpartum haemorrhage, blood transfusion and medical history data. DSU data<br />
were the principal source of general gynaecology data in <strong>2005</strong>.<br />
1.4.3 PIMS Theatre database<br />
The PIMS Theatre Database includes details of operative procedures and anaesthesia<br />
use in obstetrics and gynaecology. These data were reconciled with <strong>Health</strong>ware records<br />
as part of routine data cleaning.<br />
1.4.4 Neonatology database<br />
The Newborn Unit data are collected prospectively by the Resident Medical Officers and<br />
Nurse Specialists - Advanced Neonatal Practice working on the Newborn Intensive Care<br />
Unit. The Neonatal Database is used to produce problem lists, flow sheets and letters,<br />
so that there are checks of data integrity throughout a baby’s stay. Further data are<br />
collected and accuracy checked for the Australia and New Zealand Neonatal Network<br />
(ANZNN).<br />
21
1.5 Data quality<br />
1.5.1 Maternity data quality<br />
Specific cleaning queries were run and identified discrepancies were checked and<br />
corrected prior to analysis of the data for the <strong>2005</strong> <strong>National</strong> Women’s Annual Clinical<br />
Report. These are listed in Appendix 1.<br />
It should be acknowledged that these cleaning efforts, while extremely time consuming,<br />
are not comprehensive. On occasion, it became apparent during analysis that further<br />
cleaning was required and this was performed on an ad hoc basis and may not be<br />
included in the list provided in the appendix.<br />
Services or individuals wishing to use the <strong>2005</strong> data for further analysis should be aware<br />
that areas not mentioned may not have been cleaned.<br />
1.5.2 Neonatal data quality<br />
Additional checks of the accuracy of the data were made in preparing the Annual Report<br />
and prior to sending the data to ANZNN. The clinical records and some original<br />
radiology images were checked on all serious adverse outcomes (IVH, PVL, ROP, NEC,<br />
death). Laboratory and clinical records were checked on all possible or definite<br />
septicaemias or meningitides. Records were checked when the data entered in different<br />
fields in the database appeared inconsistent. Maternal and neonatal records were<br />
reviewed of all babies with encephalopathy or neonatal seizures.<br />
The introduction of comprehensive computerised clinical records (CRIS, Concerto, Éclair<br />
and Impax) by ADHB has aided data collection, checks on data integrity and clinical<br />
audit tremendously. Authorised clinical staff can access the complete clinical record ‘online’<br />
so that no clinical record is lost and there are no delays inherent in the old paperbased<br />
system.<br />
1.6 Derived definitions (maternity)<br />
The definitions given here are for derived variables (as opposed to variables collected<br />
directly by the <strong>Health</strong>ware database system). Definitions of variables within <strong>Health</strong>ware<br />
are given in Appendix 1.<br />
Maternal age<br />
Defined as age at birth.<br />
Gestation<br />
The gestation used in the maternity section of this report is derived from Best Estimate of<br />
date of birth (EDD Best) calculated by <strong>Health</strong>ware at booking based on Last Menstrual<br />
Period (LMP), scan data (overriding LMP data based on scan accuracy data sourced<br />
from the Australasian Society for Ultrasound Medicine), or clinical override of these<br />
dates as deemed appropriate. <strong>Health</strong>ware does not include gestation calculated from<br />
these data into its dataset, so this gestation, in weeks, is derived by taking the integer<br />
value of 40 + (date of birth - EDD Best)/ 7.<br />
The gestation derived by this definition was then compared with the gestation entered<br />
into <strong>Health</strong>ware on examination of the baby at birth. Where this gestation differed from<br />
that defined above by at least 2 weeks, gestation was manually checked against the<br />
22
clinical record and data in <strong>Health</strong>ware amended where appropriate. Further checking<br />
was undertaken against gestation recorded in the perinatal mortality database for<br />
perinatal deaths and the neonatal database for all neonatal unit admissions. The clinical<br />
record was checked where gestation varied by at least 1 week in these instances.<br />
Because of the incomplete reconciliation of data sets, there may be a minimal number of<br />
cases where gestation varies in reporting of the neonatal and maternity data.<br />
Ethnicity<br />
Ethnicity is collected at registration at the hospital with the standard census 2001<br />
question. Three options are input into the CMS (Case Management System) database.<br />
In preparing the data for this report, each mother has been allocated to a single ethnic<br />
group. When more than one ethnic group is recorded, the prioritised ethnicity system<br />
outlined in ‘Ministry of <strong>Health</strong>. 2004. Ethnicity Data Protocols for the <strong>Health</strong> and Disability<br />
Sector. Wellington: Ministry of <strong>Health</strong>.’ (available online at<br />
http://www.nzhis.govt.nz/documentation/ethnicity/index.html) has been used.<br />
The most summarised (Level 1) prioritisation is as follows: Maori, Pacific peoples, Asian,<br />
other groups except NZ European, NZ European. To this, we have added ‘Other<br />
European’ and split ‘Indian’ from Asian, either because these are a large group in our<br />
population and/or because their obstetric risk profile is significantly different from the<br />
remaining women in the ‘Other’ or ‘Asian’ category. In the majority of figures in this<br />
document, these categories are recombined, and the small category of women with<br />
‘Unstated’ ethnicity has been excluded. Level 2 prioritisation is given in Appendix 1.<br />
Standard primipara<br />
A woman with<br />
• no prior birth > 20 weeks,<br />
• aged 20-34 years at index birth,<br />
• with a singleton pregnancy,<br />
• cephalic presentation,<br />
• gestation 37-41 weeks,<br />
• baby not small for gestational age (customised centile >10 th ),<br />
• no medical disease (defined as no history of cardiac disease, renal disease,<br />
mental health disorder, SLE, HIV infection, or CVA/TIA) diabetes or hypertension,<br />
• no gestational diabetes in index pregnancy,<br />
• no pregnancy associated hypertensive disease in index pregnancy,<br />
• and no antepartum haemorrhage during index pregnancy.<br />
Onset of birth<br />
This variable has been redefined from the 2004 report to include a 4 th pathway<br />
‘emergency Caesarean before the onset of labour’ which was previously included with<br />
spontaneous onset of birth. There are 4 pathways to birth included in this report: (1)<br />
elective caesarean section, (2) emergency caesarean before the onset of labour, (3)<br />
induction of labour, and (4) spontaneous onset of labour.<br />
Mode of birth for multiple pregnancies<br />
For analyses where the denominator is mothers, mode of birth is represented as the<br />
mode of birth of the baby requiring most intervention. Mode of birth has been prioritised<br />
23
as emergency caesarean, elective caesarean, forceps, ventouse, vaginal breech, then<br />
spontaneous cephalic vaginal.<br />
1.7 Analytical and statistical methods<br />
The data in Maternity and Neonatology have been analysed using Access, Excel,<br />
StatView, EpiInfo, and STATA9.<br />
Tables are formatted with either column or row percentages as appropriate.<br />
1.8 Clinical indicators<br />
Clinical indicators in maternity are largely only appropriate for use in benchmarking.<br />
There is inadequate evidence in many of the areas of greatest interest in obstetric care<br />
to determine what ideal rates should be for interventions and so use of clinical indicators<br />
to drive practice improvement is limited. Clinical intervention and outcome rates in<br />
obstetrics are also hugely affected by case-mix, as the data presented in this report even<br />
in relation to simple variables such as parity and age clearly demonstrate. Unless<br />
obstetric facilities can adjust for case-mix, benchmarking is of limited value.<br />
At NW we have discussed various clinical indicator systems in current use, and for some<br />
years have contributed data to the WHA (Women’s <strong>Health</strong> Australasia) benchmarking<br />
initiative. Ideally, we would establish a system to allow us to benchmark within New<br />
Zealand, and this is a goal which is increasingly achievable as obstetric clinical database<br />
systems become standardised across the country.<br />
24
section<br />
2<br />
SUMMARY STATISTICS<br />
SSSTATISTICSNTRODUC<br />
25
2 SUMMARY STATISTICS<br />
2.1 Mother and baby numbers: <strong>National</strong> Women’s <strong>2005</strong><br />
Table 1: Mother and baby numbers: <strong>National</strong> Women’s <strong>2005</strong><br />
Total number of mothers birthing at <strong>National</strong> Women’s 7178<br />
Mothers birthing before arrival* (BBA’s) 16<br />
Total number of mothers 7194<br />
Total number of babies born at <strong>National</strong> Women’s 7368<br />
Babies born before arrival (BBA’s) 16<br />
Total number of babies 7384<br />
BBA = Baby born before arrival and is defined as those babies who were born at home or en route to hospital where the<br />
intention was to be born in a hospital.<br />
One woman gave birth twice during the calendar year <strong>2005</strong> & is therefore counted twice in the above table and throughout<br />
this report.<br />
Table 2: Mother and baby numbers by plurality: <strong>National</strong> Women’s <strong>2005</strong><br />
10000<br />
8000<br />
6000<br />
4000<br />
2000<br />
0<br />
<strong>National</strong> Women’s<br />
births<br />
27<br />
Mothers Babies<br />
Singletons 7007 6994<br />
Twins 184 368<br />
Triplets 3 9<br />
Totals (not including BBA’s) 7178 7368<br />
BBA’s<br />
Singletons 16 16<br />
Twins 0 0<br />
Triplets 0 0<br />
Totals (including BBA’s) 7194 7384<br />
Mothers Babies<br />
1991 1992 1993 1994 1995 1996 1997 1998 1999 2000 2001 2002 2003 2004 <strong>2005</strong><br />
Figure 1: Numbers of women birthing and babies born at <strong>National</strong> Women’s 1991-<strong>2005</strong>
2.2 Summary of maternal outcomes <strong>2005</strong><br />
Table 3: Mode of onset of birth<br />
Table 4: Mode of birth<br />
28<br />
Birthing mothers<br />
n=7194<br />
n %<br />
Spontaneous 4246 59.0<br />
Iatrogenic<br />
CS elective 833 11.6<br />
CS before onset labour 221 3.1<br />
Induction of labour 1894 26.3<br />
Birthing mothers<br />
n=7194<br />
n %<br />
Spontaneous cephalic birth 3845 53.4<br />
Vaginal breech birth 54 0.7<br />
Operative birth 1022 14.2<br />
Forceps 294 4.1<br />
Ventouse 728 10.1<br />
Caesarean section 2273 31.6<br />
CS elective 833 11.6<br />
CS emergency 1440 20.0
%<br />
70<br />
60<br />
50<br />
40<br />
30<br />
20<br />
10<br />
0<br />
1998 1999 2000 2001 2002 2003 2004 <strong>2005</strong><br />
Figure 2: Mode of birth 1998-<strong>2005</strong><br />
SVB Vaginal breech Operative vaginal Caesarean<br />
Table 5: Postpartum outcome summary<br />
29<br />
Birthing mothers n %<br />
PPH >1000mls 7194 367 5.1<br />
SVD 3845 97 2.5<br />
Instrumental vaginal birth 1022 35 3.4<br />
Caesarean section 2273 235 10.3<br />
Episiotomy 4921 1093 22.2<br />
Third/ fourth degree tears 4921 99 2.0<br />
Postpartum blood transfusions 7194 139 1.9<br />
Infant Feeding at discharge from NW facility 5765<br />
Exclusive breastfeeding 3686 63.9<br />
Fully breastfeeding 485 8.4<br />
Partial breastfeeding 1375 23.9<br />
Artificial feeding 219 3.8
2.3 Summary of neonatal outcomes <strong>2005</strong><br />
Table 6: Neonatal outcomes of babies born at <strong>National</strong> Women’s in <strong>2005</strong><br />
Gender<br />
30<br />
Babies born<br />
n=7384<br />
n %<br />
Male 3880 52.6<br />
Female 3503 47.4<br />
Preterm birth<br />
20-27 weeks 108 1.5<br />
28-31 weeks 139 1.9<br />
32-36 weeks 559 7.6<br />
Term birth<br />
37-41 weeks<br />
42+ weeks<br />
5 minute Apgar < 7<br />
Preterm<br />
At term<br />
SGA (by Customised Centile)<br />
Preterm<br />
At term<br />
Admission to NICU<br />
Preterm<br />
At term<br />
Table 7: Perinatal mortality <strong>2005</strong><br />
6408 86.8<br />
170 2.3<br />
52 0.7<br />
48 0.7<br />
258 3.5<br />
693 9.4<br />
453 6.1<br />
346 4.7<br />
Babies born<br />
n=7384<br />
Number of fetal deaths 68<br />
Number of early neonatal deaths 38<br />
Number of late neonatal deaths 5<br />
Perinatal mortality rate 14.4<br />
Perinatal-related loss rate 15.0
section<br />
3<br />
MATERNAL DEMOGRAPHY<br />
31
3 MATERNAL DEMOGRAPHY<br />
This chapter describes the demographic characteristic of the women birthing at <strong>National</strong><br />
Women’s including those for each of the LMC groups and for standard primipara.<br />
Additional data pertaining to this chapter can be found in Appendix 3.<br />
3.1 Maternal domicile<br />
In <strong>2005</strong>, 69% of women giving birth at <strong>National</strong> Women’s were from the <strong>Auckland</strong> <strong>District</strong><br />
<strong>Health</strong> <strong>Board</strong> area. Births of women from within our own area have slowly increased<br />
from 65% in 2002. This has been associated with a steady decrease in births of women<br />
from Waitemata and Counties Manukau <strong>District</strong> <strong>Health</strong> <strong>Board</strong> areas, whose births<br />
comprised 14% and 15% respectively in <strong>2005</strong>. Small numbers of births (138 in total)<br />
among women from other areas made up the total of 7194 birthing mothers in <strong>2005</strong>.<br />
3.2 Maternal age<br />
The trend towards increasing age among women giving birth at <strong>National</strong> Women’s<br />
continues. The proportion of births to women in all age groups below 30 continues to fall<br />
while rising among women over 30. Since the late 90s, the most common age category<br />
for parturients whether nulliparous or multiparous has been 31-35 years. The second<br />
most frequent age category is 26-30 year old women although if the current trend<br />
continues this is likely to be 36-40 year old women within the next 2 years.<br />
%<br />
40<br />
35<br />
30<br />
25<br />
20<br />
15<br />
10<br />
5<br />
0<br />
40 yrs<br />
1991 1992 1993 1994 1995 1996 1997 1998 1999 2000 2001 2002 2003 2004 <strong>2005</strong><br />
Figure 3: Maternal age distribution (1991-<strong>2005</strong>)<br />
33
3.3 Parity<br />
There was no apparent change in the proportion of nullipara to multipara birthing at<br />
<strong>National</strong> Women’s in the period 1992-2000. Unfortunately, the data from 2001-2003 are<br />
unreliable and have not been presented. In 2004 and <strong>2005</strong>, the ratio of nullipara to<br />
multipara appears to have increased from the previous steady rate of around 0.8:1 to<br />
0.96:1. This trend combined with the trend to increasing maternal age is likely impacting<br />
on maternal and neonatal outcomes and on interventions in pregnancy and birth.<br />
%<br />
65<br />
60<br />
55<br />
50<br />
45<br />
40<br />
35<br />
1992 1993 1994 1995 1996 1997 1998 1999 2000 2001 2002 2003 2004 <strong>2005</strong><br />
Figure 4: Parity distribution (1992-<strong>2005</strong>)<br />
3.4 Maternal ethnicity<br />
Nullipara Multipara<br />
There have been small shifts in the ethnic distribution of mothers giving birth at <strong>National</strong><br />
Women’s over the past 5 years, probably reflecting the domicile of birthing mothers. In<br />
<strong>2005</strong>, 48.4% of mothers identified as European (NZ or other), 7.6% as Maori, 13.6% as<br />
Pacific, 7.6% as Indian, 10.7% as Chinese, and 5.0% as other Asian.<br />
50<br />
40<br />
30<br />
20<br />
10<br />
0<br />
%<br />
Maori Pacific Indian<br />
80<br />
70<br />
60<br />
50<br />
40<br />
30<br />
20<br />
10<br />
0<br />
%<br />
Nullipara Multipara<br />
NZ European Maori Pacific Asian Indian Other<br />
European<br />
Figure 7: Parity distribution by maternal ethnicity<br />
35<br />
Other<br />
Age and parity distributions vary widely by ethnicity. Maori and Pacific mothers are<br />
younger than European and Asian and are more likely to be multiparous.<br />
Consideration should be given to age and parity standardisation of outcomes among<br />
these groups to account for associated differences in risk by age and parity.<br />
3.5 Lead Maternity Carer and maternal demographic<br />
characteristics<br />
In <strong>2005</strong>, 42% of mothers were booked with independent midwives (IMW) at birth,<br />
22% with private obstetricians, 16% with <strong>National</strong> Women’s Community clinics, 8%<br />
with <strong>National</strong> Women’s Domino midwives, 8% with <strong>National</strong> Women’s specialist<br />
medical and diabetic clinics. Overall, 66% of women who gave birth at NW in <strong>2005</strong><br />
were booked with private Lead Maternity Carers. These proportions are unchanged<br />
from 2004.<br />
60<br />
50<br />
40<br />
30<br />
20<br />
10<br />
0<br />
%<br />
IMW Priv<br />
Obstetrician<br />
70<br />
60<br />
50<br />
40<br />
30<br />
20<br />
10<br />
0<br />
% NZ European Maori Pacific Asian Other<br />
IMW Pvt<br />
Obstetrician<br />
Figure 9: LMC at birth and maternal ethnicity<br />
GP NW Domino NW NW DiabetesNW Medical Other DHB Unbooked<br />
Community*<br />
The women cared for by different LMC groups vary considerably in their<br />
demography. Women booked with private obstetricians are on average older and<br />
more often European. Women cared for by <strong>National</strong> Women’s community clinics are<br />
younger, more often multiparous, and more often Maori, Pacific and Indian. Women<br />
cared for by Independent midwives are intermediate between these two former<br />
groups and also care for the largest proportion of Asian (non-Indian) women. There is<br />
an over-representation of Maori and Pacific among women who are unbooked at<br />
birth and women transferred from other DHB areas for birth.<br />
70<br />
60<br />
50<br />
40<br />
30<br />
20<br />
10<br />
0<br />
%<br />
IMW Priv<br />
Obstetrician<br />
Figure 10: LMC at birth and parity<br />
3.6 Smoking<br />
Nullipara Multipara<br />
GP NW Domino NW Community NW ADAPT NW Diabetes NW Medical<br />
In 2004, smoking status data were missing for 21% of women. In <strong>2005</strong>, due to almost<br />
complete collection of smoking data on the antenatal summary, which is completed<br />
at the time of birth, only 5% of smoking status data are missing. The smoking rate<br />
among women with known smoking status in <strong>2005</strong> was 8.2%, consistent with the<br />
8.1% in 2004, suggesting that missing data does not indicate non-smoking.<br />
36
Significantly, more complete data have revealed a considerably higher rate of known<br />
smoking among Maori mothers (37% in <strong>2005</strong> compared with 28% reported in 2004)<br />
and among mothers under 20, a large proportion of whom are Maori.<br />
It was difficult to reconcile data entered in early pregnancy with data at birth. These<br />
data should allow us to ascertain how effective smoke change interventions are in<br />
our service.<br />
3.7 Body mass index<br />
These data continue to be inadequate for reporting with 46% of height data and 38%<br />
of weight data missing allowing only 52% of BMI to be calculated.<br />
3.8 Standard primipara<br />
Standard primipara were defined as they were in 2004, although our collection and<br />
cleaning of hypertensive disease and antepartum haemorrhage data were improved<br />
this year. The definition is given in the introductory chapter.<br />
The objective in describing the standard primipara is to determine the outcomes and<br />
interventions for women in this pre-defined “low risk” group. This allows for<br />
comparison between institutions and between LMC groups.<br />
Only 34% of our primipara were defined as standard this year, compared to 45% in<br />
2004. This is in the most part due to improved data cleaning around hypertensive<br />
disease and antepartum haemorrhage and revised definition of small for gestational<br />
age from customised centiles. There is also a contribution from the increasing age of<br />
the obstetric population.<br />
The proportion of primipara who were aged 20-34 years at birth, with a singleton<br />
pregnancy, cephalic presentation, gestation 37 – 41 weeks (i.e. 37+0 days – 40+6<br />
days) in <strong>2005</strong> was 49.5%.<br />
% Standard primipara Non-standard primipara<br />
100<br />
80<br />
60<br />
40<br />
20<br />
0<br />
NZ<br />
European<br />
Figure 11: Ethnicity of standard primpara<br />
Maori Pacific Asian Indian Other<br />
European<br />
37<br />
Other
Standard primipara status varies by ethnicity. The low rate of standard primipara<br />
status among Maori primipara is in large part due to their young age. The distribution<br />
of standard primipara is also very different by caregiver at birth, which supports the<br />
use of this definition in the comparison of outcomes and interventions by caregiver<br />
group.<br />
% Standard primipara Non-standard primipara<br />
100<br />
80<br />
60<br />
40<br />
20<br />
0<br />
IMW Pvt<br />
Obstetrician<br />
Figure 12: LMC at birth of standard primpara<br />
GP NW Domino NW<br />
Community<br />
38<br />
NW Diabetic NW Medical
section<br />
4<br />
ANTENATAL COMPLICATIONS<br />
CCOMPLICATIONSMATERNAL<br />
39
4 ANTENATAL COMPLICATIONS<br />
This chapter provides data and analysis on the complications and diseases which<br />
affect some women in the antenatal period, namely preterm birth, growth restriction,<br />
multiple pregnancy, antepartum haemorrhage, hypertensive disease and cervical<br />
cerclage. Additional data on these complications can be found in Appendix 4.<br />
4.1 Preterm birth<br />
Methods<br />
Iatrogenic preterm birth has been defined as induction of labour, elective caesarean<br />
section and emergency caesarean before the onset of labour. In the 2004 data,<br />
emergency caesarean before onset of labour was included with spontaneous onset<br />
of birth. Prior to 2001, elective caesareans were not defined at data entry but derived<br />
based on a definition of caesarean section before the onset of contractions.<br />
Findings<br />
Table 8: Rates of preterm birth
Table 9: Rates of preterm birth
predict risk. It may be useful to explore the reasons for consistently lower<br />
spontaneous preterm birth rates among multipara birthing at NW.<br />
Table 10: Perinatal outcome of preterm births by gestation (n=7384)<br />
Gestation Births<br />
Fetal<br />
deaths<br />
Livebirths % Liveborn Neonatal<br />
death<br />
43<br />
% of Livebirths<br />
surviving > 28<br />
days<br />
20 10 9 1 10 1 0<br />
21 16 9 7 44 7 0<br />
22 11 7 4 36 4 0<br />
23 10 7 3 30 2 33<br />
24 19 3 16 84 7 56<br />
25 12 0 12 100 1 92<br />
26 8 3 5 62 0 100<br />
27 8 1 7 87 2 71<br />
28 25 5 20 80 1 95<br />
29 38 2 36 94 0 100<br />
30 27 1 26 96 0 100<br />
31 27 1 26 96 0 100<br />
32 36 1 35 97 1 97<br />
33 36 2 34 94 0 100<br />
34 75 1 74 99 1 99<br />
35 108 2 106 98 1 99<br />
36 219 1 218 99 1 99<br />
The data given in the table above are of value when counselling women at risk of<br />
preterm birth. It would be useful to combine data over a number of years and to<br />
determine outcomes for spontaneous and iatrogenic preterm births. For further<br />
comment on prognosis, see Chapter 7, Newborn.<br />
Summary/Implications<br />
• Singleton preterm birth rate was 8.1%.<br />
• Preterm birth is associated with multiple pregnancy, ethnicity, smoking, and<br />
nulliparity.<br />
• Local data on survival are useful for counselling at risk mothers. It would be<br />
useful to compile several years data for this purpose.
4.2 Small for gestational age (SGA)<br />
Methods<br />
Up until 2004 the <strong>National</strong> Women’s Annual Clinical reports had defined small for<br />
gestational age according to a nomogram published by Beeby (J Paed Child <strong>Health</strong><br />
1996) which is largely derived from Caucasian births. A customised birth weight centile<br />
calculator has been developed for New Zealand women (Aust NZ J Obstet Gynaecol<br />
2004). This calculator individualises birth weight centiles adjusting for gestation at birth,<br />
gender, maternal ethnicity, height, booking weight, and parity. The resulting definition of<br />
small for gestational age reclassifies as normal many babies who are born to small<br />
mothers. It more accurately predicts adverse perinatal outcomes and is thought to<br />
identify babies with growth restriction.<br />
Height data were available for only 54% and weight data for 62% of mothers giving birth<br />
at NW in <strong>2005</strong>. For women without height and/or weight data, mean height and/or weight<br />
for women of the same ethnicity has been used. The lack of complete data on maternal<br />
height and weight may reduce the accuracy of the customised birth centile data in this<br />
year’s report. In our 2004 report babies who were small by customised birthweight<br />
centiles had high rates of perinatal morbidity whereas babies that were small by<br />
population centiles but normally grown by customised birthweight centiles had extremely<br />
low morbidity. This year size at birth is only classified using customised centiles.<br />
In <strong>2005</strong> significantly more babies had birth-weight
Table 11: Interventions and outcomes among SGA babies<br />
Onset of birth<br />
Customised birthweight<br />
2 days 226 23.8 479 7.4 3.19 (2.77-3.68)<br />
Apgar at 5 mins 30) is an important risk factor for many pregnancy<br />
complications. Calculation of a body mass index can therefore also help with<br />
risk selection early in pregnancy.
4.3 Multiple pregnancy<br />
This section describes the characteristics and outcomes of mothers who gave birth to<br />
twins and triplets at NW during <strong>2005</strong> and the outcomes of their babies.<br />
Findings<br />
Table 12: Multiple pregnancy rates (per 100 births)<br />
Total number of<br />
multiple pregnancies<br />
1994 1995 1996 1997 1998 1999 2000 2001 2002 2003 2004 <strong>2005</strong><br />
185 172 194 210 182 172 218 179 208 191 188 187<br />
Incidence % 2.4 2.3 2.8 2.4 2.7 2.5 2.5 2.6<br />
Number of twin<br />
pregnancies<br />
Number of triplet<br />
pregnancies<br />
Number of quadruplet<br />
pregnancies<br />
181 169 187 204 176 166 207 175 201 184 188 184<br />
4 2 7 6 5 6 11 4 7 7 0 3<br />
0 1 0 0 1 0 0 0 0 0 0 0<br />
There has been no change in rate of multiple birth since 1998, suggesting that the<br />
assisted reproduction programmes contributing births to NW are well regulated.<br />
Table 13: Fetal/neonatal outcomes of multiple pregnancies (per 100 babies born)<br />
Total number of<br />
babies born in a<br />
multiple pregnancy<br />
1994 1995 1996 1997 1998 1999 2000 2001 2002 2003 2004 <strong>2005</strong><br />
356 348 395 426 371 350 445 362 421 384 376 377<br />
Incidence % 4.8 4.6 5.3 4.7 5.3 4.9 4.9 5.1<br />
Number of multiple<br />
pregnancies where<br />
one or more babies<br />
died<br />
Incidence % (no. of<br />
multiple pregnancies<br />
where a baby<br />
died/number of<br />
multiple pregnancies)<br />
Number of babies<br />
who died in a<br />
multiple pregnancy<br />
Twin perinatal<br />
mortality rate*<br />
16 10 23 20 12 12 14 26 11 15 13<br />
8.6 5.4 11.9 9.5 6.6 7.0 6.4<br />
22 12 36 30 25 22 23<br />
61.8 34.5 91.1 61.3 51.1 63.3 48.3<br />
*Perinatal twin deaths/1000 twin babies born<br />
46<br />
12.5 5.8 8.0 7.0<br />
23 17<br />
61.2 43.5
Table 14: Mode of onset of birth among twin pregnancies<br />
Mode of onset of birth<br />
47<br />
Term births<br />
n=69<br />
Preterm births<br />
n=115<br />
n % n %<br />
CS elective 24 35 28 24<br />
CS emergency before labour 2 3 27 23<br />
Induction of labour 34 49 14 12<br />
Spontaneous labour 9 13 46 40<br />
Of the 38% of twin pregnancies reaching term, 38% were delivered by elective<br />
caesarean or prior to onset of labour. Only 13% went into spontaneous labour.<br />
Table 15: Mode of birth among twin pregnancies<br />
Spontaneous vaginal birth/vaginal breech both<br />
twins<br />
Spontaneous vaginal birth 1 st twin, operative<br />
vaginal 2 nd twin<br />
Operative vaginal 1 st twin, spontaneous vaginal<br />
2 nd twin<br />
2000<br />
n=207<br />
Twin pregnancies<br />
2004<br />
n=188<br />
<strong>2005</strong><br />
n=184<br />
n % n % n %<br />
84 41 52 28 53 29<br />
7 3 4 2 8 4.3<br />
9 4 8 4 5 2.7<br />
Instrumental vaginal birth both twins 11 5 7 4 7 3.8<br />
Spontaneous vaginal birth 1 st twin, caesarean<br />
section 2 nd twin<br />
Operative vaginal birth 1 st twin, caesarean section<br />
2 nd twin<br />
4 2 4 2 1 0.5<br />
2 1 5 3 0<br />
CS elective both twins<br />
90 44<br />
48 26 52 28.3<br />
CS emergency both twins<br />
60 32 58 31.5<br />
The twin pregnancies which result in vaginal birth of the first twin followed by<br />
caesarean for the second twin are those best avoided for safety of baby and mother.<br />
There was only one twin birth where this occurred in <strong>2005</strong>. However, there was also<br />
little risk of this outcome as 60% of all twin pregnancies were delivered by<br />
caesarean. There is currently no good evidence that caesarean section is necessary<br />
or beneficial for twin pregnancy per se.
Table 16: Fetal/newborn outcomes of twin babies<br />
48<br />
Twin babies<br />
n=368<br />
n %<br />
Small for gestational age (
Of the 9 pregnancies in which one twin died, 2 died of extreme prematurity, 2 from<br />
TTTS, 1 from infection, 3 from congenital abnormalities, and one from discordant<br />
growth.<br />
Of the 4 pregnancies where both twins died, the cause of death was extreme<br />
prematurity in 2 pregnancies, TTTS in 1, and one was terminated for maternal<br />
reasons.<br />
Summary/Implications<br />
• Overall rate of multiple pregnancy is stable.<br />
• Fertility treatments are not leading to high rates of multiple pregnancy.<br />
• Collection of more specific data on multiple pregnancy characteristics would<br />
allow teasing out of the associations between these characteristics e.g. type<br />
of twinning and complications, interventions and outcome.<br />
• Early recognition of monochorionic twins and subsequent twin-to-twin<br />
transfusion syndrome is a key issue for improving twin outcome.<br />
• Twins have a high operative birth rate at NW.<br />
• It is not known if customised birth centiles will be appropriate for monitoring<br />
and assessing growth in twin pregnancy.<br />
49
4.4 Diabetes<br />
Methods<br />
The statistics given below relate to women with a diagnosis of pre-existing or<br />
gestational diabetes who delivered at <strong>National</strong> Women’s.<br />
Findings<br />
In <strong>2005</strong>, all women with a diagnosis of pre-existing or gestational diabetes who<br />
delivered at <strong>National</strong> Women’s had some input from the Diabetes Clinic staff<br />
although not all were cared for exclusively with the Diabetes Clinic as their LMC. In<br />
addition, the team cared for 8 women with type 1 diabetes and 16 women with type 2<br />
diabetes who booked, but had losses prior to 20 weeks or moved away and 11<br />
women with GDM who delivered elsewhere.<br />
The pre-pregnancy service continues to grow and 57 new referrals were seen in<br />
<strong>2005</strong> compared with 40 in 2004. Next year we plan to report the HbA1c level at<br />
conception and compare it with HbA1c levels at the pre-pregnancy assessment.<br />
%<br />
5.0<br />
4.0<br />
3.0<br />
2.0<br />
1.0<br />
0.0<br />
GDM Type I Type 2<br />
1991 1992 1993 1994 1995 1996 1997 1998 1999 2000 2001 2002 2003 2004 <strong>2005</strong><br />
Figure 14: Incidence of diabetes (% of all inborn and BBA births) time trends<br />
Over the past 3 years there has been a plateau in numbers compared with a marked<br />
increase over the previous 2 years. The explanation for this is unclear. We suspect<br />
rates of GDM are still increasing, but that women are not diagnosed because<br />
screening is inconsistent. In a recent audit of macrosomic babies born at NWH, only<br />
50% of the mothers had been screened for GDM, supporting the contention that a<br />
prevalence of 5% (Figure 1) is an underestimate. In <strong>2005</strong>, two significant publications<br />
confirmed that treatment of GDM is associated with improved perinatal outcomes (N<br />
Engl Med J <strong>2005</strong>; Am J Obstet Gynecol <strong>2005</strong>). Efforts should be directed to ensure<br />
all pregnant women are offered screening for GDM so that those with GDM are<br />
diagnosed and benefit from intervention. A document outlining the screening<br />
process is available from the diabetes service. More women with both type 1 and<br />
type 2 diabetes diagnosed prior to pregnancy are also being seen by the service.<br />
50
4.4.1 Demographics of women with diabetes<br />
Of women with GDM and type 2 diabetes, 38.2% and 38.5% respectively are over<br />
the age of 35 years compared with 22.1% of the rest of the delivery population.<br />
Almost 12% of women who delivered at <strong>National</strong> Women’s over the age of 40 years<br />
had underlying type 2 diabetes or GDM.<br />
12<br />
10<br />
8<br />
6<br />
4<br />
2<br />
0<br />
%<br />
Type 1 Type 2 GDM<br />
NZ European Maori Pacific Asian Indian Other<br />
Figure 15: Incidence of diabetes by ethnic group <strong>2005</strong><br />
51<br />
European<br />
The ethnicity of women with type 1 diabetes is predominantly European in contrast to<br />
women with GDM or type 2 diabetes, who are more likely to be Pacific Island<br />
Polynesians or Indian or Asian women.<br />
The graph above, at first glance, seems to suggest that the incidence of GDM varies<br />
greatly by ethnic group. However, it also reflects different rates of screening. As<br />
highlighted in the 2004 Annual Report, screening for GDM in Maori and Pacific Island<br />
women is likely to be inadequate, as we would expect higher rates of GDM in<br />
populations with higher rates of type 2 diabetes. Unfortunately, this is still a problem,<br />
but we hope this will improve with increasing education about the benefits of<br />
identifying GDM.<br />
Over 10% of Indian women are diagnosed with GDM. The population is known to be<br />
at increased risk, partly because they are more insulin resistant at lower BMIs than<br />
European and Polynesian populations. This relates to differences in body<br />
composition, with increased central fat mass and lower muscle mass at any given<br />
BMI.<br />
This year, some data are available on the booking weight of women attending<br />
diabetes clinic. Unfortunately, due to differences in weights between different<br />
ethnicities, absolute values are not meaningful. However, it appears that weights are<br />
increasing in these populations of GDMs and type 2 diabetics. If complete weight<br />
and height data are available, we intend to evaluate BMI data for different ethnic<br />
groups.<br />
Other
4.4.2 Outcomes of pregnancies complicated by diabetes<br />
The induction rate is over 50% in women with diabetes, double the rate in the<br />
background population. Women with GDM in particular are not routinely induced. If<br />
they have a normally grown fetus, good glycaemic control and no other specific risk<br />
factors (e.g. advanced maternal age, pre-eclampsia) we anticipate the onset of<br />
normal labour, but will induce in the 41 st week of gestation. Many women have<br />
several indications for delivery prior to 40 weeks. It is recognised that obesity is<br />
associated with increased rates of induction and caesarean section, independently of<br />
diabetes. Obese women have increased perinatal risks and may have delayed onset<br />
of labour. This is a further factor in our induction rates.<br />
Rates of spontaneous vaginal, operative vaginal, and caesarean births appear<br />
relatively stable among women with GDM. This year, the caesarean section rate in<br />
women with type 1 diabetes (74.2%) was higher than other years, but numbers are<br />
small. The type 2 caesarean rate of just under 20% elective and 40% emergency is<br />
similar to other years and other centres report similar results.<br />
Women with type 1 and 2 diabetes have increased rates of postpartum haemorrhage<br />
requiring transfusion compared to other women.<br />
%<br />
60<br />
50<br />
40<br />
30<br />
20<br />
10<br />
0<br />
Spontaneous vaginal birth Operative vaginal birth Caesarean section<br />
1999 2000 2001 2002 2003 2004 <strong>2005</strong><br />
Figure 16: Mode of birth among women with GDM 1999-<strong>2005</strong><br />
The preterm birth rate
4.4.3 Maternal postpartum glucose tolerance testing<br />
Table 18: Rates of postnatal glucose tolerance testing (GTT) among women with GDM<br />
(1999-<strong>2005</strong>)<br />
1999<br />
n=183<br />
2000<br />
n=180<br />
2001<br />
n=163<br />
53<br />
2002<br />
n=253<br />
2003<br />
n=352<br />
2004<br />
n=342<br />
<strong>2005</strong><br />
n=304<br />
n % n % n % n % n % n % n %<br />
Postnatal GTT 129 70 121 67 132 81 171 68 260 74 260 76 238 78<br />
No postnatal GTT 54 30 59 33 31 19 82 32 92 26 82 24 65 22<br />
Table 19: Results of postnatal glucose tolerance testing (GTT) among women with<br />
GDM (1999-<strong>2005</strong>)<br />
1999<br />
n=129<br />
2000<br />
n=121<br />
2001<br />
n=132<br />
2002<br />
n=171<br />
2003<br />
n=260<br />
2004<br />
n=260<br />
<strong>2005</strong><br />
n=238<br />
n % n % n % n % n % n % n %<br />
Normal 89 69 89 74 90 68 116 68 196 75 194 74 190 80<br />
IFG/ IGT 22 17 17 14 23 17 37 22 39 15 49 19 34 14<br />
Type 2 18 14 15 12 17 13 16 9 25 10 17 7 14 6<br />
The rate of postnatal glucose tolerance testing is very high (78%), with more than 20%<br />
abnormal at that time. The women who do not perform follow-up testing are often women<br />
that we anticipate will have undiagnosed type 2 diabetes, which has implications for<br />
ongoing health status.<br />
4.4.4 Neonatal outcomes among babies of women with diabetes in pregnancy<br />
It is difficult to compare outcomes in infants of women with diabetes between centres, as<br />
often different definitions are used (e.g. for hypoglycaemia). Postnatal care of infants<br />
varies between centres, particularly in the use of supplemental feeds. Biochemical<br />
hypoglycaemia (
Table 20: Neonatal outcomes among babies of women with diabetes<br />
Type I<br />
n=30<br />
Type 2<br />
n=56<br />
54<br />
GDM<br />
n=307<br />
Postnatally<br />
diagnosed<br />
Type 2 n=17<br />
No diabetes<br />
n=6991<br />
n % n % n % n % n %<br />
Birthweight (Mean(sd)) 3505(829) 3185(736) 3259(636) 3461(888) 3332(704)<br />
Recommendations<br />
• Investigate the change in HbA1c levels in women who come for prepregnancy<br />
counselling from baseline to conception.<br />
• Provide further education about the importance of screening for GDM.<br />
• Review the customised growth charts in relation to obese populations.<br />
• Undertake a detailed audit of the women with type 2 diabetes and assess<br />
management, birth size and other neonatal morbidity.<br />
• Evaluate breast feeding rates and whether early supplemental feeds are<br />
indicated, especially in infants with capillary glucose >2.3 mmol/l.<br />
55
4.5 Antepartum haemorrhage<br />
Antepartum haemorrhage was last reported in the NW Annual Clinical Report in<br />
2000. These data are collected in our new database and with that comes the<br />
possibility that the numbers are not comparable with data prior to 2001.<br />
Methods<br />
Antepartum haemorrhage has been defined as vaginal bleeding beyond 20 weeks<br />
during pregnancy and labour. Also included in this definition are women with placenta<br />
praevia who did not experience bleeding. In cleaning antepartum haemorrhage data,<br />
data from the antenatal summary and intrapartum data have been reconciled with the<br />
details of any pregnancy where antepartum haemorrhage was given as an indication<br />
for induction or operative delivery. Data from Decision Support Unit (DSU) have also<br />
been reconciled with <strong>Health</strong>ware data.<br />
Findings<br />
Table 21: Antepartum haemorrhage incidence<br />
1992 1993 1994 1995 1996 1997 1998 1999 2000 <strong>2005</strong><br />
Total APH 286 365 515 460 451 453 451 484 594 398<br />
Incidence % 6.3 4.1 5.6 5.0 4.9 5.6 6.0 6.5 7.6 5.5<br />
Proven abruption 58 72 94 101 96 115 82 49 54 41<br />
Proven placenta<br />
38 65 61 86 67 94 91 74 69 81<br />
praevia<br />
APH (uncertain<br />
origin)<br />
190 227 365 273 287 281 278 361 471 276<br />
In <strong>2005</strong>, 5.5% of mothers were recorded as experiencing an episode of bleeding after<br />
20 weeks. In the majority of cases the reason for the bleeding was unknown.<br />
Approximately 1% of mothers were reported to have placenta praevia and half this<br />
number to have had an abruption.<br />
The known association between placenta praevia and previous caesarean section is<br />
evident in our data, with 26% of women with placenta praevia having a history of<br />
previous caesarean compared with 12-14% among women with other causes of<br />
antepartum haemorrhage and women without a history of bleeding.<br />
Placenta praevia is associated with maternal age over 35. Placental abruption is<br />
associated with maternal smoking and hypertension. Hypertension is also associated<br />
with antepartum haemorrhage of unknown origin.<br />
Praevia, abruption, and other bleeding are all associated with increased rates of<br />
preterm birth, maternal blood transfusion and caesarean section. Bleeding was<br />
associated with preterm birth in 18% of preterm births < 37 weeks, and with preterm<br />
birth
4.6 Cervical cerclage<br />
Preterm birth is a leading cause of perinatal morbidity and mortality. We still do not<br />
have a full understanding of the events that lead to early delivery.<br />
Cervical cerclage is not the usual treatment for threatened preterm delivery, but may<br />
be offered to women suspected of cervical incompetence. These women usually fall<br />
into one of three groups:<br />
1. They have a history of second trimester pregnancy losses. Often the<br />
presenting symptoms are not clear cut and the losses may not be painless as<br />
is classically described for cervical incompetence.<br />
2. They have ultrasound findings of shortening or funnelling of the cervix in the<br />
second trimester on a routine scan.<br />
3. They present for the first time with ‘silent’, i.e. painless dilatation and<br />
effacement of the cervix.<br />
Findings<br />
In the year <strong>2005</strong>, 24 women underwent cervical cerclage. Twelve were placed for<br />
women with a history of second trimester loss, 10 for ultrasound identified cervical<br />
changes, and 3 for painless dilatation of the cervix.<br />
Table 22: Clinical characteristics of women undergoing cerclage in <strong>2005</strong> by gravidity<br />
57<br />
Nulligravid<br />
N=3<br />
Multigravid<br />
N=21<br />
Parity<br />
0 3 5<br />
>1 - 16<br />
Previous history<br />
Previous cerclage 0 8<br />
Previous cervical surgery (LLETZ or Cone) 0 3*<br />
Previous spontaneous first trimester miscarriage - 11<br />
Previous TOP - 6<br />
Previous mid-trimester loss - 13<br />
Previous preterm birth - 10<br />
Indication for cerclage<br />
Elective cerclage 0 10<br />
Emergency/unplanned cerclage 3 10<br />
Cerclage in situ from previous pregnancy 0 1<br />
Neonatal outcome †<br />
Fetal loss 2 3<br />
Birth 36 weeks 0 15<br />
SGA 2 7<br />
* all had LLETZ and one also had a cone biopsy<br />
† 25 babies (one set of twins gave birth >36wks)<br />
Two women had abnormal swab results reported after their cervical suture was<br />
inserted (Chlamydia and Trichomonas on one and bacterial vaginosis on the other),<br />
raising the possibility of infection as the cause of cervical dilatation in these cases.<br />
There were 3 abdominally placed sutures. One had been left in situ after a<br />
laparoscopic placement in a previous pregnancy and two were placed at laparotomy<br />
at 13 and 15 weeks. Of the sutures placed abdominally in the current pregnancy, one
had had a Manchester operation for utero-vaginal prolapse followed by several<br />
pregnancy losses and the other had a LLETZ and a cone biopsy for AIS and a<br />
previous failed attempt at a vaginally placed suture. Both these women achieved a<br />
viable pregnancy and were delivered by caesarean section.<br />
Of the 13 unplanned sutures placed vaginally, 4 failed to prolong the pregnancy to<br />
viability. All of these had a dilated cervix and membranes bulging through the cervix<br />
at presentation. There was one ‘emergency’ stitch in a case of twins. This was placed<br />
at 26 weeks for an ultrasound finding of shortening and dilatation of the cervix. She<br />
delivered at term by caesarean section. Of the remaining 9, a further 2 delivered<br />
preterm (27 and 32 weeks).<br />
Of the 10 planned sutures, one pregnancy was terminated for fetal anomaly. Of the<br />
remainder there were two preterm births (24 and 32 weeks).<br />
One mother laboured, unrecognised, on the ward and delivered through her stitch,<br />
resulting in bilateral cervical tears requiring suturing.<br />
All 5 deaths were of babies born before 24 weeks. One was iatrogenic for multiple<br />
fetal abnormalities. The remaining 4 had unplanned cerclage after effacement and<br />
dilatation of the cervix with bulging membranes. Two of these cases were later found<br />
to have infection on vaginal swabs. These positive swabs suggest that labour had<br />
already started and this is usually difficult to stop. The insertion of a suture in these<br />
cases was, in retrospect, inappropriate.<br />
In summary, of 24 women in whom a suture was placed, there were 5 pre-24 week<br />
deaths (21%), and a total of 9 preterm births (38%). There were 9 growth restricted<br />
babies (38%), 6 of whom were preterm births.<br />
Summary<br />
Cervical cerclage may have been helpful in the appropriately selected patients<br />
described above. The process of preterm labour is complex and has multifactorial<br />
aetiology. It is important to establish that cervical changes are due to a mechanical<br />
cause rather than an inflammatory cause as cerclage may not be beneficial in the<br />
latter situation. Cerclage may cause harm by scarring or by causing cervical<br />
incompetence. History, combined with a meaningful examination, is the best<br />
diagnostic tool. Prevention of preterm birth remains a major challenge.<br />
The Cochrane Review on this topic, which includes 6 randomised trials and a total of<br />
2175 women, found no conclusive evidence that inserting a cervical suture in women<br />
perceived to be at risk of preterm birth or second trimester pregnancy loss attributed<br />
to cervical factors, reduces the risk of pregnancy loss, preterm birth or morbidity<br />
associated with preterm birth.<br />
Recommendations<br />
We consider there is probably a role for cervical cerclage in women considered very<br />
high risk of second trimester miscarriage due to a cervical factor. However<br />
selection is critical as it is difficult to predict which women will miscarry and cerclage<br />
is an invasive procedure with risks for the pregnancy.<br />
58
4.7 Hypertensive disorders of pregnancy<br />
Hypertensive disorders of pregnancy include gestational hypertension, preeclampsia<br />
and chronic hypertension and complicate approximately 10% of all pregnancies.<br />
These disorders are associated with increased maternal and perinatal morbidity and<br />
are one of the commonest causes for iatrogenic preterm birth.<br />
Methods<br />
The definitions of the hypertensive disorders of pregnancy used in the Annual Clinical<br />
Report are not as rigorous as those used in clinical research. In addition, adherence<br />
to the definitions as used has not been formally audited.<br />
The following definitions of hypertension in pregnancy have been used in this report:<br />
• Gestational hypertension: diastolic BP >90mmHg without proteinuria, when<br />
diastolic BP < 90mmHg at booking.<br />
• Preeclampsia: diastolic BP > 90mmHg with proteinuria > ‘+’ or >0.3g/24h,<br />
when diastolic 90mmHg at booking or a medical<br />
history of essential hypertension.<br />
<strong>2005</strong> is the first year since 2000 that the hypertension data has been thoroughly<br />
checked in NW data. This involved reconciling indications for induction and operative<br />
delivery, past medical history, and data from DSU (Decision Support Unit).<br />
Findings<br />
The rate of gestational hypertension in the population of women who delivered at<br />
<strong>National</strong> Women’s in <strong>2005</strong> is unchanged from 2000 (5.9% in <strong>2005</strong> v 5.6% in 2000).<br />
Conversely, there has been a small, but significant increase in rates of pre-eclampsia<br />
(3.8% in <strong>2005</strong> v 2.4% in 2000) and chronic hypertension (2.3% in <strong>2005</strong> v 1.5% in<br />
2000). Four nulliparous women suffered eclampsia in <strong>2005</strong>.<br />
Table 23: Hypertensive disease in pregnancy <strong>2005</strong><br />
Any hypertensive disease<br />
All women Nullipara Multipara<br />
n=7194 n=3522 n=3672<br />
N % n % n %<br />
Chronic hypertension 163 2.3 66 1.9 97 2.6<br />
Gestational hypertension 421 5.9 258 7.3 163 4.4<br />
Preeclampsia 275 3.8 199 5.7 76 2.1<br />
Eclampsia antepartum 1 1 0<br />
Eclampsia postpartum 3 3 0<br />
As expected, the rates of gestational hypertension and pre-eclampsia are higher in<br />
nullipara, while chronic hypertension is more common among multipara. Women over<br />
35 years were more likely to develop gestational hypertension or have chronic<br />
hypertension than younger women but this association with age was not apparent<br />
among women with pre-eclampsia.<br />
All hypertensive disorders of pregnancy were less common among women of Asian<br />
ethnicity compared to women of other ethnicities. A similar trend was apparent in<br />
rates of chronic hypertension, although numbers are small. The rates of hypertensive<br />
disorders of pregnancy did not differ significantly across other ethnic groups. The<br />
59
lower rate among Asian women may be explained by confounding risk factors such<br />
as body mass index, age or parity.<br />
70<br />
60<br />
50<br />
40<br />
30<br />
20<br />
10<br />
0<br />
%<br />
Gestational<br />
hypertension<br />
Spont onset of labour Induced labour<br />
CS emergency before labour CS elective<br />
Preeclampsia Chronic<br />
hypertension<br />
Figure 17: Onset of birth and hypertensive disorders of pregnancy<br />
Table 24: Mode of birth for women with hypertensive disease<br />
Mode of birth<br />
Gestational<br />
hypertension<br />
n=421<br />
Preeclampsia<br />
n=275<br />
60<br />
Normotensive<br />
Chronic<br />
hypertension<br />
n=163<br />
Normotensive<br />
n=6335<br />
n % n % n % n %<br />
Normal vaginal 181 43.0 77 28.0 62 38.0 3539 55.9<br />
Vaginal breech 0 0 2 0.7 2 1.2 41 0.7<br />
Operative vaginal 70 16.6 39 14.4 20 12.3 888 14.0<br />
CS elective 37 8.8 32 11.6 28 17.2 736 11.6<br />
CS emergency 133 31.6 125 45.5 51 31.3 1131 17.9<br />
As would be anticipated, fewer women with hypertensive disorders of pregnancy<br />
went into spontaneous labour. Similarly, women with hypertensive disorders had a<br />
lower rate of vaginal birth and higher rate of caesarean section.<br />
Table 25: Perinatal outcomes and hypertensive complications of pregnancy<br />
Gestation at birth<br />
Gestational<br />
hypertension<br />
n=431<br />
Preeclampsia<br />
n=301<br />
Chronic<br />
hypertension<br />
n=167<br />
Normotensive<br />
n=6485<br />
n % n % n % n %<br />
< 37 weeks 56 13.0 117 38.9 36 21.6 597 9.2<br />
< 32 weeks 8 1.9 28 9.3 17 10.2 194 3.0<br />
SGA 74 17.2 87 28.9 40 24.0 750 11.6<br />
NICU Admission 56 13.0 91 30.2 32 19.2 620 9.6<br />
> 2 days in NICU 49 11.4 88 29.2 27 16.2 541 6.3<br />
Apgars < 7 at 5 mins 6 1.4 3 1.0 6 3.6 85 1.3<br />
Perinatal deaths 2 4.6 4 1.3 6 3.6 99 1.5
Very preterm birth (25 kg/m 2 with the risk increasing to almost three-fold in women<br />
with a BMI >30 kg/m 2 .<br />
Use of more robust definitions of the hypertensive disorders of pregnancy would<br />
allow effective comparison of maternal and fetal outcomes in these disorders to other<br />
tertiary level centres.<br />
Implications<br />
• Multivariate analysis would be required to fully assess the independent role of<br />
maternal risk factors in the development of hypertensive disorders of<br />
pregnancy and their impact on maternal and fetal outcomes.<br />
• The relationship between maternal BMI and hypertensive disorders of<br />
pregnancy plays an essential role in interpretation of these clinical data and<br />
must be collected for future reports.<br />
61
section<br />
5<br />
LABOUR and BIRTH<br />
DEMOGRAPHY<br />
63
5 LABOUR AND BIRTH<br />
This chapter includes data on labour and birth interventions and outcomes, including<br />
induction of labour, mode of birth and postpartum haemorrhage. For further data<br />
relating to this chapter, see Appendix 5.<br />
5.1 Induction of labour<br />
Methods<br />
A fourth pathway to birth has been added in this <strong>2005</strong> report by splitting “emergency<br />
caesarean section prior to the onset of labour” from “spontaneous onset of labour”.<br />
Comparisons with 2004 data can be made by recombining these two groups.<br />
The 4 pathways to birth described in this report are: (1) induction of labour, (2)<br />
elective caesarean section, (3) emergency caesarean prior to onset of labour, and (4)<br />
spontaneous onset of labour. If any woman had a failed induction, she has been<br />
categorised as an induced labour for the purposes of this section.<br />
Collection of data on induction of labour in the <strong>Health</strong>ware database requires active<br />
opening of an induction screen. We suspect this is not consistently done, especially<br />
if ‘inductions’ are performed on the Labour and Birth Unit. To improve capture of<br />
these inductions, clinical notes were reviewed if the indication for ARM (artificial<br />
rupture of membranes) was induction or if an ARM was performed or syntocinon<br />
commenced before the onset of contractions. However, the possibility remains that<br />
the numbers given under-represent the true induction rate for 2004 and <strong>2005</strong> and are<br />
not comparable with rates prior to 2001. To improve capture in the future<br />
consideration could be given to adding a Boolean (yes/no) field for induction of<br />
labour.<br />
Findings<br />
35<br />
30<br />
25<br />
20<br />
15<br />
10<br />
%<br />
IOL rate (total) IOL rate (nullipara) IOL rate (multipara)<br />
1992 1993 1994 1995 1996 1997 1998 1999 2000 2001 2002 2003 2004 <strong>2005</strong><br />
Figure 18: Induction of labour rates (1992-<strong>2005</strong>)<br />
The IOL rate has remained stable at 26-27% of all births since 1997. It was 26.3% in<br />
<strong>2005</strong>, 29.6% among nullipara and 23.2% among multipara.<br />
65
Rates of induction vary by LMC, maternal age and ethnicity. Induction rates are<br />
lowest among women with independent midwifery, <strong>National</strong> Women’s Community<br />
and Domino midwifery LMCs (21%, 26% and 22% respectively), and highest among<br />
diabetic clinic and medical clinic LMCs (63% and 42%) with private obstetricians<br />
being between these (33%). These latter three LMC groups also have the highest<br />
rates of elective caesarean section (17%, 20% and 25%) and consequently the<br />
lowest rates of spontaneous onset of labour (20%, 37% and 39%).<br />
Induction of labour increased in frequency with increasing maternal age, from 21%<br />
among mothers up to age 20 to 40% of women over 40, while spontaneous onset of<br />
labour dropped from 77% to 27% in these age groups. There were also differences<br />
by ethnicity with NZ European mothers least likely to experience spontaneous onset<br />
of birth and 14-15% less likely than Pacific or Maori mothers.<br />
These differences are unadjusted however, and apparent differences would likely<br />
narrow after age, parity, ethnicity, and obstetric risk factors were taken into account.<br />
Indication for induction<br />
Indication for induction is prioritised at data entry to primary and secondary<br />
indication.<br />
The indications for induction both by gestation and by parity remain largely<br />
unchanged from 2004. Post dates is cited (most commonly) as the primary reason<br />
for induction at term (26%), followed by hypertension (15%) and term PROM (12%).<br />
Maternal request was the fifth most commonly cited primary indication for induction at<br />
term (131 inductions, 8%).<br />
Indication for induction also varies by ethnicity and age. There is an increasing rate of<br />
induction for post dates with increasing age until age 35. Over 35, SGA,<br />
hypertension, and maternal request become more common indications. Term PROM<br />
appears consistent across all age groups.<br />
40<br />
35<br />
30<br />
25<br />
20<br />
15<br />
10<br />
5<br />
0<br />
%<br />
NZ European Maori Pacific Asian Other<br />
Post dates Hypertension Term PROM SGA Diabetes Maternal<br />
request<br />
Figure 19: Indication for induction by ethnicity among nulliparous women (all<br />
gestations)<br />
66<br />
Other
Other<br />
Large for gestational age<br />
Maternal age<br />
Poor obstetric history<br />
Fetal distress<br />
Not in established labour<br />
IUD/Fetal anomaly<br />
Decreased liquor<br />
PPROM<br />
Maternal medical complications<br />
Maternal request<br />
SGA<br />
Diabetes<br />
Term PROM<br />
Hypertension<br />
Post dates<br />
%<br />
0 1 2 3 4 5 6 7<br />
67<br />
Term induction Preterm induction<br />
Figure 20: Primary indication for induction as a percentage of all births (n=1733<br />
inductions /7194 birthing mothers)<br />
Other<br />
Large for gestational age<br />
Maternal age<br />
Poor obstetric history<br />
Fetal distress<br />
Not in established labour<br />
IUD/Fetal anomaly<br />
Decreased liquor<br />
PPROM<br />
Maternal medical complications<br />
Maternal request<br />
SGA<br />
Diabetes<br />
Term PROM<br />
Hypertension<br />
Post dates<br />
Multipara Nullipara<br />
%<br />
0 1 2 3 4 5 6 7 8 9 10<br />
Figure 21: Primary indication for induction at term by parity (as a percentage of term<br />
births)
% 35<br />
10<br />
9<br />
8<br />
7<br />
6<br />
5<br />
4<br />
3<br />
2<br />
1<br />
0<br />
Post dates Hypertension Term PROM SGA Diabetes Maternal<br />
request<br />
68<br />
Other<br />
Figure 22: Indication for induction by maternal age among nulliparous women (all<br />
gestations)<br />
Induction for post dates resulted in birth prior to 41 weeks in 21.8% of post dates<br />
inductions. Fifty-two of these 99 “prior to post-dates” post dates inductions occurred<br />
in women under 35 years of age. The majority (58%) of post dates inductions were<br />
undertaken between 41weeks and 0 days and 41 weeks and 6 days.<br />
Outcomes following induction<br />
90<br />
80<br />
70<br />
60<br />
50<br />
40<br />
30<br />
20<br />
10<br />
0<br />
% Spontaneous vaginal birth Instrumental vaginal CS emergency<br />
Nullipara<br />
spontaneous labour<br />
Nullipara IOL Multipara<br />
spontaneous labour<br />
Multipara IOL<br />
Figure 23: Mode of birth among intended vaginal births at term by parity and onset of<br />
labour (IOL=induction of labour)<br />
Rates of caesarean section are substantially higher among nullipara following<br />
induction of labour than following spontaneous labour. Emergency caesarean section<br />
follows induction in 35% of nullipara compared to 21% following spontaneous labour.<br />
This difference in caesarean section rate is apparent for all indications for induction<br />
including post dates. This is contrary to published literature which suggests that<br />
women induced for post dates are more likely than spontaneous post-date births to<br />
deliver vaginally.
This year, the emergency Caesarean section rate among multipara was also higher<br />
following induction than spontaneous labour (16% compared to 12%). This difference<br />
was not apparent in 2004 data, and may be related to a change in induction practice.<br />
This is currently being investigated.<br />
Epidural rates were consistently higher among induced labours (73.6%) than among<br />
spontaneous labours (49.9%) for all indications and irrespective of parity. Data are<br />
not currently available on indication for epidural and it is possible that a proportion of<br />
these epidurals were inserted after a decision for emergency caesarean section was<br />
made.<br />
69
5.2 Use of Syntocinon<br />
Table 26: Use of syntocinon by onset of labour and parity<br />
%<br />
35<br />
30<br />
25<br />
20<br />
15<br />
10<br />
5<br />
0<br />
Total births Syntocinon<br />
70<br />
N n %<br />
Total 7194 2467 34.3<br />
Induction of labour<br />
Nullipara 1042 708 68.0<br />
Multipara 852 472 55.4<br />
Spontaneous onset of birth<br />
Nullipara 2113 945 44.7<br />
Multipara 2133 338 15.9<br />
Induced labour Spontaneous labour<br />
0 1 2 3 4 5 6 7 8 9 10 Missing<br />
Figure 24: Dilatation at commencement of syntocinon infusion among nulliparous<br />
induced and spontaneous labour<br />
% Induced labour Spontaneous labour<br />
35<br />
30<br />
25<br />
20<br />
15<br />
10<br />
5<br />
0<br />
0 1 2 3 4 5 6 7 8 9 10 missing<br />
Figure 25: Dilatation at commencement of syntocinon infusion in multiparous induced<br />
and spontaneous labour
Use of syntocinon is high in spontaneous labours (45% of nullipara and 16% of<br />
multipara). 18% of the nullipara and 20% of the multipara who received syntocinon<br />
for augmentation in spontaneous labour started syntocinon before 3cm dilatation.<br />
Summary<br />
• The induction rate appears to be stable<br />
• Induction is associated with European ethnicity, high risk NW clinic care and<br />
private obstetrician care. It is associated with age and parity.<br />
• The most common indications for term induction are post dates, hypertension,<br />
and premature rupture of the membranes.<br />
• Emergency caesarean section and epidural more often follow induced than<br />
spontaneous labour.<br />
• 22% of inductions for post dates result in birth before 41 weeks and 0 days;<br />
16% in women under 35; 36% in women 35 and older.<br />
Implications<br />
• The increased rate of intervention following induction of labour should be<br />
discussed with women, especially nullipara.<br />
• Evidence based guidelines for management of post dates pregnancy should<br />
be established at NW.<br />
• 18% of the nullipara and 20% of the multipara who received syntocinon for<br />
augmentation in spontaneous labour started syntocinon before 3cm dilatation.<br />
The impact of syntocinon on labour outcomes among women receiving<br />
syntocinon at this early stage requires investigation.<br />
• Standard definitions for “diagnosis of labour” and “induction of labour” should<br />
be adopted.<br />
71
5.3 Mode of birth<br />
Findings<br />
Table 27: Mode of birth trends 1991-<strong>2005</strong> (n = mothers).<br />
1991 1992 1993 1994 1995 1996 1997 1998 1999 2000 2001 2002 2003 2004 <strong>2005</strong><br />
Number of births 8833 8315 8690 8812 9125 9157 8055 7531 7501 7827 7452 7775 7611 7491 7194<br />
Spontaneous<br />
vaginal<br />
% % % % % % % % % % % % % %<br />
67.9 68.8 68.0 67.4 65.9 65.5 63.5 62.0 61.8 59.4 55.7 56.1 54.4 53.5<br />
Vaginal breech 1.8 1.8 1.2 1.1 1.0 1.1 1.1 1.0 1.1 1.1 0.8 0.8 0.7 0.8<br />
Forceps/<br />
ventouse<br />
14.4 12.2 12.1 12.5 12.3 12.8 13.1 12.3 12.6 12.9 13.9 14.0 15.6 14.2<br />
Caesarean 16.6 17.2 18.6 19.0 20.8 20.8 22.3 24.7 24.5 26.6 29.6 29.2 29.3 31.6<br />
Elective 10.4 11.6<br />
Emergency 18.8 20.0<br />
From 1998, data exclude postnatal transfers.<br />
In the case of twins only one mode of birth is given and mode of birth is prioritised as caesarean, forceps/ventouse,<br />
vaginal breech, then spontaneous vaginal.<br />
80<br />
70<br />
60<br />
50<br />
40<br />
30<br />
20<br />
10<br />
% SVB Vaginal breech Operative v aginal Caesarean<br />
0<br />
1991 1992 1993 1994 1995 1996 1997 1998 1999 2000 2001 2002 2003 2004 <strong>2005</strong><br />
Figure 26: Mode of birth (1991–<strong>2005</strong>)<br />
Caesarean section rates continue to rise at <strong>National</strong> Women’s, consistent with<br />
worldwide trends. The increase in operative birth is at the expense of spontaneous<br />
vaginal birth. This increase is apparent among both nullipara and multipara,<br />
including women with a history of previous caesarean section. The lower rate of<br />
caesarean section among Maori and Pacific mothers at <strong>National</strong> Women’s has<br />
previously been shown to be accounted for by lower age and higher parity among<br />
these ethnic groups. There is a clear trend of increasing caesarean section rate with<br />
increasing maternal age though this can explain only part of the increasing<br />
caesarean section rate at <strong>National</strong> Women’s where maternal age continues to rise<br />
(as shown in the Chapter 3, Maternal Demography)<br />
72
% Nullipara Multip no prev CS Multip prev CS<br />
80<br />
70<br />
60<br />
50<br />
40<br />
30<br />
20<br />
10<br />
0<br />
1996 1997 1998 1999 2000 2001 2002 2003 2004 <strong>2005</strong><br />
Figure 27: Caesarean section rates at term by parity and previous caesarean status<br />
(1996 – <strong>2005</strong>)<br />
%
70<br />
60<br />
50<br />
40<br />
30<br />
20<br />
10<br />
0<br />
% IMW Pvt Obstetrician NW Domino NW Community<br />
SVB Operative vaginal CS elective CS emergency<br />
Figure 30: Mode of birth by LMC at birth among standard primipara<br />
90<br />
80<br />
70<br />
60<br />
50<br />
40<br />
30<br />
20<br />
10<br />
0<br />
% IMW Pvt Obstetrician NW Domino NW Community<br />
SVB Operative vaginal CS elective CS emergency<br />
Figure 31: Mode of birth by LMC at time of birth among multipara<br />
There is a lower spontaneous vaginal birth rate among women cared for by private<br />
obstetricians, and this difference is apparent even among standard primipara. Although<br />
the definition of standard primipara may not exclude all women at higher risk of operative<br />
birth, these data suggest that there are practice differences and/or patient preference<br />
differences between these women and women cared for by midwifery-led LMC groups.<br />
On the subsequent page are a series of “Run Charts” showing rate of spontaneous<br />
vaginal birth and caesarean section according to caregiver group. <strong>National</strong> Women’s<br />
(NW) LMC includes all women for whom a NW clinic is LMC (i.e. Community, Medical,<br />
Diabetic, ADAPT, Domino, Other DHB (transfers), and unbooked). Non-NW includes<br />
women with a private LMC (i.e. Independent midwife, private obstetrician, GP).<br />
Run charts are a method of analysing trends over time and help to identify where a<br />
particular rate is outside limits expected within the system analysed. One of the simplest<br />
ways to identify a change in rate is to plot the data over time along with the median and<br />
then count how many data points consecutively fall above or below the median. If 8 or<br />
more points fall on one side of the median, a “special cause” is deemed to have<br />
occurred. If fewer than 8 points lie on one side of the line, the variation in rate is said to<br />
be “within the limits expected in the process”.<br />
74
%<br />
65<br />
60<br />
55<br />
50<br />
45<br />
40<br />
65<br />
60<br />
55<br />
50<br />
45<br />
40<br />
Oct-02<br />
%<br />
40<br />
30<br />
20<br />
40<br />
30<br />
20<br />
%<br />
Oct-02<br />
Oct-02<br />
%<br />
Oct-02<br />
Jan-03<br />
Jan-03<br />
Jan-03<br />
Jan-03<br />
Apr-03<br />
Apr-03<br />
Apr-03<br />
Apr-03<br />
Jul-03<br />
Jul-03<br />
Jul-03<br />
Jul-03<br />
Oct-03<br />
Oct-03<br />
Oct-03<br />
Oct-03<br />
NWH SVB MEDIAN<br />
Jan-04<br />
Jan-04<br />
Jan-04<br />
Apr-04<br />
Apr-04<br />
Jul-04<br />
Jul-04<br />
Oct-04<br />
Oct-04<br />
Jan-05<br />
Jan-05<br />
Apr-05<br />
NWH LSCS MEDIAN<br />
Jan-04<br />
Non NWH SVB MEDIAN<br />
Apr-04<br />
Apr-04<br />
Jul-04<br />
Jul-04<br />
Oct-04<br />
Oct-04<br />
Jan-05<br />
Jan-05<br />
Apr-05<br />
Apr-05<br />
Non NWH LSCS MEDIAN<br />
Apr-05<br />
Jul-05<br />
Jul-05<br />
Jul-05<br />
Jul-05<br />
Oct-05<br />
Oct-05<br />
Oct-05<br />
Oct-05<br />
Figure 32: Spontaneous vaginal birth rate<br />
among NW LMC October 2002-December<br />
<strong>2005</strong><br />
There is no change in rate of spontaneous<br />
vaginal births over the period presented<br />
among mothers cared for by <strong>National</strong><br />
Women’s LMCs. There is, however, normal<br />
variation around the median from month to<br />
month.<br />
Figure 33: Spontaneous vaginal birth rate<br />
among Non-NW LMC October 2002-<br />
December <strong>2005</strong><br />
There is a period between March and<br />
November <strong>2005</strong>(circled) where the rate of<br />
spontaneous vaginal births is lower<br />
among mothers cared for by non-<strong>National</strong><br />
Women’s LMCs.<br />
75<br />
Figure 34: Caesarean section rate among<br />
NW LMC October 2002- December <strong>2005</strong><br />
This run chart shows a significant period<br />
during 2004 when the caesarean section<br />
rate was below the median. Prior and<br />
since this period the rate has varied<br />
around the median.<br />
Figure 35: Caesarean section rate among<br />
Non-NW LMC October 2002- December<br />
<strong>2005</strong><br />
There has been a significant increase in<br />
the use of caesarean section over time<br />
among mothers cared for by Non-NW<br />
LMCs.
5.4 Caesarean section<br />
Methods<br />
In 2004 and <strong>2005</strong>, we have collected data on elective and emergency caesarean. An elective<br />
caesarean is defined as a caesarean which was scheduled in advance and prior to the onset of<br />
labour. Therefore, caesarean sections performed after the onset of labour but scheduled<br />
electively prior to labour are included with elective caesareans. Conversely, unscheduled<br />
caesarean section prior to onset of labour has been classified as emergency caesarean section.<br />
Table 28: Caesarean section rates<br />
Total births<br />
(mothers)<br />
Caesarean<br />
sections<br />
1992 1993 1994 1995 1996 1997 1998 1999 2000 2001 2002 2003 2004 <strong>2005</strong><br />
8315 8690 8812 9125 9157 8055 7531 7501 7827 7471 7775 7611 7491 7194<br />
1420 1620 1670 1900 1905 1797 1851 1837 2084 2301 2219 2193 2273<br />
Incidence % 17.1 18.6 19.0 20.8 20.8 22.3 24.6 24.5 26.6 29.6 29.1 29.3 31.6<br />
Total nullipara 3700 3649 3814 4037 4018 3591 3263 3262 3454 3597 3522<br />
Caesarean 726 755 790 936 888 912 900 898 1047 1118 1178<br />
Incidence % 19.6 20.7 20.7 23.2 22.1 25.4 27.6 27.5 30.3 31.1 33.4<br />
Elective % 6.5 7.0<br />
Emergency % 24.6 26.4<br />
Total multipara 4615 5041 4998 5088 5139 4464 4229 4238 4372 3894 3672<br />
Caesarean 694 865 880 964 1017 885 951 939 1037 1075 1095<br />
Incidence % 15 17.2 17.6 18.9 19.8 19.8 22.5 22.2 23.7 27.6 29.8<br />
Elective % 14.1 15.9<br />
Emergency% 13.5 13.9<br />
From 1998, data excludes postnatal transfers<br />
As noted in the previous section, the caesarean section rate is increasing. The overall rate in<br />
<strong>2005</strong> was 31.6%, 33.4% among nullipara and 29.8% among multipara.<br />
5.4.1 Vaginal birth after caesarean section<br />
Table 29: VBAC: parity 1, all gestations by mode of onset of labour (n=680)<br />
Spontaneous<br />
n=258<br />
Parity 1, previous caesarean, all gestations<br />
Induced<br />
n=87<br />
CS elective<br />
n=303<br />
CS emergency<br />
before onset of<br />
labour n=32<br />
Total<br />
n=680<br />
n % n % n n n %<br />
SVB 79 30.6 19 21.8 98 14.4<br />
Vaginal breech 1 0.4 2 2.3 3 0.4<br />
Forceps 11 4.3 3 3.5 14 2.1<br />
Ventouse 43 16.7 11 12.6 54 7.9<br />
CS elective 1 φ 303 304 44.4<br />
CS emergency 124 48.1 51 59.8 32 207 30.6<br />
φ This mother had an elective caesarean for maternal request after the start of induction.
Of the 3672 multipara delivering at NW in <strong>2005</strong>, 1052 (28.7%) had a history of prior<br />
caesarean section (890 had a history of one prior caesarean, 128 two and 34 three or more).<br />
These women with a history of caesarean section accounted for 14.6% of women delivering<br />
in <strong>2005</strong>.<br />
Table 30: VBAC: Parity 1, singleton, cephalic, term, by mode of onset of labour (n=584)<br />
Spontaneous<br />
n=233<br />
Parity 1, previous caesarean, singleton, cephalic, term<br />
Induced<br />
n=72<br />
77<br />
CS elective<br />
n=255<br />
CS<br />
emergency<br />
before onset<br />
of labour<br />
n=24<br />
Total<br />
n=584<br />
n % n % n n n %<br />
SVB 72 30.9 13 18.1 85 14.5<br />
Forceps 11 4.7 9 12.5 14 2.4<br />
Ventouse 43 18.5 3 4.2 52 8.9<br />
CS elective 255 255 43.7<br />
CS emergency 107 45.9 47 65.3 24 178 30.5<br />
Vaginal birth after caesarean section continues at a low rate. In <strong>2005</strong>, among the 680<br />
mothers with a history of one prior caesarean and no previous vaginal births, the vaginal birth<br />
rate (VBAC) was 24.9%. Even among mothers with a history of one prior caesarean and no<br />
previous vaginal births with a singleton, cephalic, term birth, the VBAC rate was only 25.9%.<br />
The majority of caesarean births were elective. Among women who have a spontaneous<br />
onset of labour after one prior caesarean and no prior vaginal birth, more than 50% achieved<br />
a vaginal birth.<br />
These data challenge whether <strong>National</strong> Women’s actively supports vaginal birth after<br />
caesarean section.<br />
In <strong>2005</strong>, 150 mothers gave birth after 2 or more prior caesarean sections. Of these women,<br />
125 had an elective caesarean, 19 an emergency caesarean, and 6 had vaginal births.<br />
5.4.2 Indication for caesarean section<br />
The distribution of primary indications for caesarean section has not changed since 2004.<br />
The most common primary indication for caesarean section is failure to progress (28%)<br />
followed by repeat caesarean (18.5%), fetal distress (16.9%), and malpresentation (11.9%).<br />
All other indications account for fewer than 10% of caesareans overall.<br />
Among nullipara at term, 55% of emergency caesareans are performed for failure to<br />
progress and 27% for fetal distress, while the most common indications for elective<br />
caesareans are malpresentation (38%) and maternal request (25%). Among multipara at<br />
term, the most common indications for emergency caesarean are the same as for nullipara,<br />
but repeat caesarean section accounts for 65% of primary indications for elective caesarean.
Other<br />
Failed Induction<br />
Diabetes<br />
Cord prolapse / presentation<br />
Maternal distress<br />
Disproportion<br />
Hypertension<br />
APH / abruption<br />
Maternal request<br />
Obstetric history<br />
Malpresentation<br />
Fetal distress<br />
Repeat caesarean<br />
Nullipara preterm Nullipara term Multipara preterm Multipara term<br />
Failure to progress<br />
0.0 5.0 10.0 15.0 20.0 25.0<br />
%<br />
30.0<br />
Figure 36: Contribution of gestation and parity to principal indications for caesarean section<br />
5.5 Instrumental vaginal birth<br />
This section describes mothers who gave birth after successful vaginal instrumental<br />
intervention. It does not include women who gave birth by caesarean after failed vaginal<br />
instrumentation.<br />
Data are presented for mothers, so this section does not include those multiple births where<br />
one baby was born by vaginal instrumentation and a later baby by caesarean. The<br />
experience of these mothers is described more accurately in Chapter 4<br />
The total operative vaginal birth rate was 14.2% in <strong>2005</strong> compared to 15.6% in 2004. This is<br />
elevated from the years 1992-2000 when the rate fluctuated from 12.3% - 13.5% but is not<br />
apparently continuing to rise.<br />
Ventouse continues to be the instrument of choice accounting for 9% of all births and 64% of<br />
instrumental vaginal births. Sixty vaginal births (1% of all births) in <strong>2005</strong> were effected by<br />
forceps following an attempt at ventouse, as in 2004.<br />
78
%<br />
18<br />
16<br />
14<br />
12<br />
10<br />
8<br />
6<br />
4<br />
2<br />
0<br />
Total operative vaginal birth rate Kiellands forceps<br />
Forceps(non-Kiellands) Ventouse<br />
Forceps/ ventouse<br />
1992 1993 1994 1995 1996 1997 1998 1999 2000 2001 2002 2003 2004 <strong>2005</strong><br />
Figure 37: Operative vaginal birth (1992-<strong>2005</strong>)<br />
The majority of operative vaginal births were performed for failure to progress. Given<br />
morbidity associated with operative vaginal birth, change might be targeted at this apparent<br />
difficulty mothers are experiencing in achieving spontaneous vaginal birth.<br />
Table 31: Indication for operative vaginal birth by parity and gestation at birth<br />
Failure to<br />
progress<br />
Nullipara<br />
term<br />
n=772<br />
Nullipara<br />
preterm<br />
n=37<br />
79<br />
Multipara<br />
term<br />
n=201<br />
Multipara<br />
preterm<br />
n=12<br />
Total<br />
n=1022<br />
n % n % n % n % n %<br />
460 59.6 16 43.2 115 57.2 2 16.7 593 58.0<br />
Fetal distress 270 35.0 18 48.7 71 35.3 7 58.3 366 35.8<br />
Maternal distress 24 3.1 2 5.4 10 5.0 1 8.3 37 3.6<br />
Maternal request 6 0.8 0 0 0 6 0.6<br />
Other 12 1.7 1 2.7 5 2.5 2 16.7 20 2.0
.<br />
%<br />
70<br />
60<br />
50<br />
40<br />
30<br />
20<br />
10<br />
0<br />
SVB Operative vaginal Caesarean<br />
NZ European Maori Pacific Asian Indian Other<br />
European<br />
Figure 38: Mode of birth by ethnicity among nullipara<br />
%<br />
80<br />
70<br />
60<br />
50<br />
40<br />
30<br />
20<br />
10<br />
0<br />
NZ<br />
European<br />
SVB Operative vaginal Caesarean<br />
Maori Pacific Asian Indian Other<br />
European<br />
Figure 39: Mode of birth by ethnicity among multipara<br />
80<br />
Other<br />
Other<br />
There is a striking association between instrumental vaginal birth and ethnicity. Pacific<br />
mothers are the least likely to undergo instrumental vaginal birth. In Pacific women the lower<br />
instrumental birth rate is not at the expense of a higher caesarean rate as the caesarean<br />
section rate is also lowest among Pacific women.<br />
The bar graphs (figures27-30) in the mode of birth section demonstrate that instrumental<br />
vaginal birth is not obviously associated with age. There is no strong association with LMC<br />
at birth, although instrumental vaginal birth appears to be marginally more common among<br />
mothers giving birth at <strong>National</strong> Women’s with a private obstetrician or an independent<br />
midwife as their LMC.
5.6 Breech birth<br />
In <strong>2005</strong>, 432 (5.9%) of all babies born at <strong>National</strong> Women’s were born by the breech. Of<br />
these babies, 328 were singletons, 225 of whom were born at term. Of these term singleton<br />
breech births, all but 2 were born by caesarean section.<br />
Seventy-eight (78) external cephalic versions (ECVs) were attempted for breech presentation<br />
at <strong>National</strong> Women’s among women delivering in <strong>2005</strong>. These were performed between 35<br />
and 41 weeks gestation. Of these 78 ECVs, 40 (51%) were successful. Of the 40 successful<br />
ECVs, 30 (75%) delivered vaginally and 10 by emergency caesarean section (including two<br />
breech presentations).<br />
Table 32: Mode of birth by breech presentation (singletons)<br />
Total<br />
singleton<br />
births<br />
N Total breech<br />
81<br />
% Breech<br />
/total<br />
singleton<br />
births<br />
Breech & CS<br />
% CS/ total<br />
breech<br />
7007 328 4.7 289 88.1<br />
20-31 weeks 176 63 35.8 32 50.8<br />
32-36 weeks 391 40 10.2 34 85.0<br />
>37 weeks 6440 225 3.5 223 99.1
5.7 Obstetric analgesia<br />
Methods<br />
Currently data are not collected on indication for epidural at <strong>National</strong> Women’s so we are<br />
unable to separate epidurals inserted primarily for pain relief from epidurals inserted for<br />
operative delivery or other indications.<br />
Findings<br />
Table 33: Analgesia use by parity and mode of onset of birth<br />
Total Epidural Entonox Pethidine TENS Water<br />
N n % n % n % n % n %<br />
All women 7194 4480 62.3 2750 38.2 1215 16.9 101 1.4 512 7.1<br />
Mode of onset of birth<br />
CS elective 833 809 97.1 5† 0.6 2† 0.2 0 0<br />
CS emergency before<br />
onset labour<br />
221 190 86.0 1† 0.45 4† 1.8 0 0<br />
Labouring women* 6140 3483 56.7 2744 44.7 1209 19.7 101 1.6 512 8.3<br />
Nullipara 3155 2205 69.9 1473 46.7 739 23.4 72 2.3 375 12.0<br />
Multipara 2985 1278 42.8 1271 42.6 470 15.8 29 1.0 137 4.6<br />
Induced labour 1894 1374 72.5 735 38.8 357 18.9 19 1.0 108 5.7<br />
Nullipara 1042 857 82.2 406 39.0 231 22.2 12 1 80 7.7<br />
Multipara 852 517 60.7 329 38.6 126 14.8 7 1 28 3.3<br />
Spontaneous labour 4246 2109 49.7 2009 47.3 852 20.1 82 1.9 404 9.5<br />
Nullipara 2113 1348 63.8 1067 50.5 508 24.0 60 3 295 14.0<br />
Multipara 2133 761 35.7 942 44.2 344 16.1 22 1 109 5.1<br />
* Excludes elective caesarean and emergency caesarean before onset of labour.<br />
† Pain relief given prior to caesarean<br />
Epidural analgesia or anaesthesia was used by 57% of mothers overall in <strong>2005</strong> up from 52%<br />
in 2000, in part explained by the 4% increase in caesarean section since 2000. Increases in<br />
epidural use are also evident in spontaneous and induced labours. The rate of epidural use<br />
was 45% among spontaneous labours in 2000 and 50% in 2004 and <strong>2005</strong>; 66% among<br />
induced labours in 2000 and 73% in 2004 and <strong>2005</strong>. Rates of use of all methods of analgesia<br />
reported are higher among nullipara.<br />
Water was used in labour by 14% of spontaneously labouring nullipara and 8% of nullipara<br />
with induced labour. The use of water for pain relief in labour did not vary by maternal age<br />
among nullipara.<br />
82
%<br />
80<br />
70<br />
60<br />
50<br />
40<br />
30<br />
20<br />
10<br />
0<br />
Induced labour Spontaneous labour<br />
Epidural Entonox Pethidine Tens Water<br />
Figure 40: Analgesia use by induction status among spontaneous and induced labours<br />
80<br />
70<br />
60<br />
50<br />
40<br />
30<br />
20<br />
10<br />
0<br />
% Multiparous Nulliparous<br />
Epidural Entonox Pethidine Tens Water<br />
Figure 41: Use of analgesia by parity among spontaneous and induced labours<br />
90<br />
80<br />
70<br />
60<br />
50<br />
40<br />
30<br />
20<br />
10<br />
0<br />
%
Younger women are less likely to choose epidurals and more likely to choose entonox and<br />
pethidine in labour. It is difficult to be certain to what extent age itself determines analgesic<br />
choices among labouring women at <strong>National</strong> Women’s. There are competing influences due<br />
to the associations between age and ethnicity, induction, and choice of LMC.<br />
100<br />
90<br />
80<br />
70<br />
60<br />
50<br />
40<br />
30<br />
20<br />
10<br />
0<br />
% IMW Pv t Obstetrician NW Domino NW Community<br />
Epidural Entonox Pethidine Tens Water<br />
Figure 43: Analgesic use and LMC type among nulliparous labours<br />
%<br />
90<br />
80<br />
70<br />
60<br />
50<br />
40<br />
30<br />
20<br />
10<br />
0<br />
NZ European Maori Pacific Asian Other<br />
Epidural Entonox Pethidine Water<br />
Figure 44: Analgesic use and ethnicity among nulliparous labours<br />
Summary/Implications<br />
• There is a need to collect better data on epidural use and explore its impact on labour<br />
outcomes at <strong>National</strong> Women’s.<br />
84
5.8 Perineal trauma<br />
Table 34: Episiotomy rates (n=vaginal births)<br />
Number of<br />
episiotomies<br />
1995<br />
n=7224<br />
1996<br />
n=7250<br />
1997<br />
n=6253<br />
85<br />
1998<br />
n=5676<br />
1999<br />
n=5661<br />
2000<br />
n=5739<br />
2004<br />
n=5298<br />
<strong>2005</strong><br />
n=4921<br />
1473 1434 1252 1195 1251 1367 1181 1093<br />
Incidence % 20.4 19.8 20.0 21.1 22.1 23.8 22.3 22.2<br />
Episiotomy<br />
with 3 rd /4 th<br />
degree tear<br />
14 25 8 9 5 17 15 23<br />
Incidence % 0.2 0.3 0.1 0.2 0.1 0.3 0.3 0.5<br />
All 3 rd /4 th<br />
degree tears<br />
47 61 41 35 29 47 72 97<br />
Incidence % 0.7 0.8 0.7 0.6 0.5 0.8 1.3 2.0<br />
The overall rate of episiotomy among vaginal births at <strong>National</strong> Women’s has changed little<br />
over the past 10 years. It was around 20% in the mid 90s and has been steady at around<br />
22% since 1999. However, during this time there has been a tripling of the rate of third or<br />
fourth degree tears from 0.7% of vaginal births to 2%. This may be a reporting issue.<br />
All 3rd / 4th degree tears<br />
2.5<br />
2<br />
1.5<br />
1<br />
0.5<br />
0<br />
%<br />
1995 1996 1997 1998 1999 2000 2001 2002 2003 2004 <strong>2005</strong><br />
Figure 45: Episiotomy rates<br />
Episiotomy with 3rd/4th degree tear All 3rd/4th degree tears Episiotomies<br />
As expected, higher perineal trauma rates are associated with primiparity and instrumental<br />
vaginal birth. In <strong>2005</strong>, 23% of primiparous spontaneous vaginal births were associated with<br />
episiotomy and 8% of multiparous spontaneous vaginal births. Third or fourth degree tear<br />
rates among spontaneous vaginal births were 2.3% and 0.9% respectively. However, it is<br />
surprising, in a background of evidence of harm associated with perineal trauma, that there<br />
are differences in episiotomy rate by LMC group. The episiotomy rate for nullipara having<br />
spontaneous vaginal births was 30% among women under the care of a private obstetrician,<br />
28% among women under the care of an Independent midwife 19% among <strong>National</strong><br />
Women’s community midwifery clinics, and 12% among women cared for by <strong>National</strong><br />
Women’s Domino midwifery service. Multiparous rates varied similarly by caregiver group.<br />
%<br />
25<br />
20<br />
15<br />
10<br />
5<br />
0<br />
Episiotomy
There is a suggestion that third and fourth degree tears were more common among<br />
midwifery-led care groups, but numbers are too small to be sure. This is counter to available<br />
evidence that a policy of expectant episiotomy is associated with lower rates of third and<br />
fourth degree tears. It may also be that completeness of reporting of third and fourth degree<br />
tears varies by caregiver group.<br />
%<br />
35<br />
Independent MW Private Obstetrician Domino Community<br />
30<br />
25<br />
20<br />
15<br />
10<br />
5<br />
0<br />
Nullipara Multipara<br />
Figure 46: Episiotomy associated with spontaneous vaginal birth by LMC at birth and parity<br />
86
5.9 Postpartum haemorrhage<br />
In <strong>2005</strong>, total blood loss has been calculated as blood loss recorded at birth plus any further<br />
major loss recorded in the postnatal admission screen. Postpartum transfusion includes<br />
transfusion recorded at any postnatal admission. Data on blood loss were unable to be<br />
obtained for 19 women (7 spontaneous vaginal births, 5 operative vaginal births and 7<br />
caesarean sections).<br />
Table 35: Postpartum haemorrhage rate (1992-<strong>2005</strong>)<br />
1992 1993 1994 1995 1996 1997 1998 1999 2000 2004 <strong>2005</strong><br />
Total Births 8315 8690 8812 9125 9157 8055 7531 7501 7827 7491 7194<br />
Primary PPH (>500mls) 881 1211 1390 1655 1633 1882 1818 1921 2088 2056 2158<br />
Incidence % 10.6 13.9 15.8 18.1 17.8 23.4 24.1 25.6 26.7 27.4 30.0<br />
Primary PPH (>1000mls) 127 249 227 267 344 303 318 381 423 262 366<br />
Incidence (%) 1.5 2.9 2.6 2.9 3.8 3.8 4.2 5.1 5.4 3.5 5.1<br />
Primary PPH >500mls rate<br />
%<br />
35<br />
30<br />
25<br />
20<br />
15<br />
10<br />
5<br />
0<br />
Primary PPH rate >=500mls Primary PPH rate >=1000mls) Blood transfusion rate<br />
1992 1993 1994 1995 1996 1997 1998 1999 2000 2001 2002 2003 2004 <strong>2005</strong><br />
Figure 47: Postpartum haemorrhage rates (1992-<strong>2005</strong>)<br />
87<br />
%<br />
10<br />
9<br />
8<br />
7<br />
6<br />
5<br />
4<br />
3<br />
2<br />
1<br />
0<br />
PPH >1000mls / blood transfusion<br />
rate<br />
In <strong>2005</strong>, as in previous years, there is a rise in the recorded incidence of blood loss of 500<br />
mls or more at birth. The increase in blood loss of 1000 mls or more is of a similar magnitude<br />
(i.e about 3 times in 2006 what it was in 1992). This is an expected outcome in an<br />
environment of increasing caesarean birth. However, there is no change in combined<br />
pregnancy and postpartum transfusion rate over the 13 years reported here. The data do not<br />
tell us whether this disparity is due to increasing over-estimation of blood loss, to an<br />
increased ability of our mothers to sustain increased blood losses, or due to an increasingly<br />
higher threshold for transfusion.
Table 36: Blood transfusion<br />
1993 1994 1995 1996 1997 1998 1999 2000 2004 <strong>2005</strong><br />
Antenatal 5 3 9 4 2 4 4 0 10 12<br />
Antenatal & intrapartum 1 0 0 0 1 0<br />
Antenatal & postpartum 1 0 3<br />
Intrapartum 3 3 11 7 3 3 3 4 2 2<br />
Intrapartum & postpartum 1 3 6 3 4 4 3<br />
Postpartum 151 128 152 90 94 110 100 96 128 133<br />
Total transfusions 159 134 172 103 102 123 110 105 145 153<br />
Total transfusion rate 2.0 2.0 2.0 1.1 1.3 1.6 1.5 1.3 1.9 2.1<br />
Table 37: Postpartum blood loss by mode of birth<br />
Spontaneous<br />
vaginal birth<br />
n=3845<br />
Vaginal<br />
breech<br />
n=54<br />
Ventouse<br />
birth<br />
n=728<br />
88<br />
Forceps<br />
birth<br />
n=294<br />
CS<br />
emergency<br />
n=1440<br />
CS<br />
elective<br />
n=833<br />
Total<br />
N=7194<br />
n % n % n % n % n % n % n %<br />
PPH >500mls 347 9.0 9 16.7 101 13.9 50 17.0 1052 73.1 598 71.8 2157 30.0<br />
PPH >1000mls 97 2.5 1 1.9 24 3.3 11 3.7 139 9.6 96 11.5 367 5.1<br />
Post partum<br />
blood transfusion<br />
44 1.1 13 1.8 1 2.0 1 2.0 57 4.0 15 1.8 139 1.9<br />
Spontaneous vaginal birth is associated with the lowest blood losses and caesarean section<br />
with the highest. Women are most likely to receive blood transfusion following emergency<br />
caesarean section.
5.10 Emergency peripartum hysterectomy<br />
Methods<br />
Emergency peripartum hysterectomy is defined as hysterectomy performed for complications<br />
related to pregnancy within 6 weeks of delivery, when that pregnancy resulted in birth at<br />
<strong>National</strong> Women’s at or beyond 20 weeks gestation. Semi-elective cases are excluded.<br />
There were 5 emergency peripartum hysterectomies in <strong>2005</strong>. This is a rate of 0.7/1000<br />
births, which is consistent with rates before and following the period from 1998-2000.<br />
rate/1000 births<br />
3<br />
2.5<br />
2<br />
1.5<br />
1<br />
0.5<br />
0<br />
1992 1993 1994 1995 1996 1997 1998 1999 2000 2001 2002 2003 2004 <strong>2005</strong><br />
Figure 48: Emergency peripartum hysterectomy rates/1000 births (1992-<strong>2005</strong>)<br />
89
5.11 Neonatal outcomes by mode of birth<br />
Methods<br />
The following tables include all babies born. However in counting Apgar scores, stillbirths<br />
are excluded from the numerators.<br />
Table 38: Neonatal morbidity overall and by mode of birth (all gestations)<br />
SVB<br />
n=3911<br />
Vaginal<br />
breech<br />
n=57<br />
90<br />
Forceps<br />
birth<br />
n=297<br />
Ventouse<br />
birth<br />
n=732<br />
CS<br />
elective<br />
n=889<br />
CS<br />
emergency<br />
n=1498<br />
Total<br />
n=7384<br />
n % n % n % n % n % n % n %<br />
1 min Apgar
Table 40: Neonatal morbidity in term or post term (> 37 weeks) babies 2000-<strong>2005</strong><br />
2000<br />
n=6915<br />
2001 2002 2003<br />
91<br />
2004<br />
n=7679<br />
<strong>2005</strong><br />
n=6578<br />
n % n % n %<br />
1 min apgar
5.12 Labour and birth at Birthcare<br />
Birthcare is a level 1 obstetric facility located very close to <strong>Auckland</strong> City <strong>Hospital</strong>. It is able<br />
to provide labour and birth care and postnatal care in normal pregnancies and labour. It does<br />
not have anaesthesists or obstetricians and so does not provide for epidurals or operative<br />
births.<br />
Methods<br />
The data for mothers birthing at Birthcare (n=275) during <strong>2005</strong> were provided by Birthcare.<br />
The data on mothers transferred to <strong>National</strong> Women’s in labour and birthing at <strong>National</strong><br />
Women’s and for mothers transferred to <strong>National</strong> Women’s after birthing at Birthcare have<br />
been obtained from <strong>Health</strong>ware.<br />
Table 41: Demographic characteristics of women labouring at Birthcare by place of birth<br />
Parity<br />
Age<br />
Birthed at<br />
Birthcare<br />
n=275<br />
92<br />
Intrapartum<br />
transfer to NW<br />
n=58<br />
Total<br />
n=333<br />
n % n % n %<br />
Nullipara 82 30 44 76 126 38<br />
Multipara 192 70 14 24 206 62<br />
40 4 1 4 1.2<br />
Ethnicity<br />
NZ European 148 54 30 52 178 53<br />
Maori 33 12 3 5 36 11<br />
Pacific 47 17 7 12 54 16<br />
Asian 10 4 3 5 13 4<br />
Indian 3 1 0 3 1<br />
Other European 29 11 13 22 42 13<br />
Other 5 2 2 3 7 2<br />
Three hundred and thirty-three women began their labour care at Birthcare. Of these, 275<br />
gave birth at Birthcare, and 58 (17%) of women were transferred from Birthcare to NW for<br />
birth. Nullipara were more likely to transfer to NW (35%) than Multipara (7%). All women<br />
who gave birth at Birthcare were under the care of Independent Midwives. The largest<br />
number of women cared for and birthed by any LMC at Birthcare was 19, and 59 different<br />
Independent midwives cared for women who birthed at Birthcare.
Table 42: Interventions and outcomes by parity among women commencing labour at Birthcare<br />
(includes 58 intrapartum transfers to NW)*<br />
Nullipara Multipara<br />
n=126<br />
n=206<br />
n % n %<br />
Intrapartum transfer to NW 44 35 14 7<br />
Analgesia<br />
Epidural 40 32 8 4<br />
Pethidine 14 11 7 3<br />
Entonox 67 53 17 8<br />
TENS 4 3 2 1<br />
Water 58 46 94 46<br />
Syntocinon 28 22 2 1<br />
Mode of birth<br />
Normal vaginal 90 72 143 69<br />
Waterbirth 9 7 57 28<br />
Operative vaginal 17 12 1<br />
Emergency caesarean 10 8 4 2<br />
Perineal trauma<br />
Episiotomy 13 11 7 3<br />
Third/fourth degree tear 1 1 0<br />
Blood Loss<br />
> 500 mls 22 18 10 5<br />
> 1000 mls 5 4 2 1<br />
Apgars<br />
1min < 7 5 4 8 4<br />
1min < 4 0 1<br />
5min < 7 0 1<br />
NICU admission 4 3 1<br />
NICU admission > 2days 4 3 0<br />
Postpartum transfer to NW 2 2 3 1<br />
* Many of these interventions occurred at <strong>National</strong> Women’s<br />
Gestation at birth was 37-42 weeks in all cases.<br />
There are clear differences in management of labour and obstetric outcomes for women<br />
whose labour care is provided at Birthcare. Of nullipara commencing labour at Birthcare,<br />
32% ultimately had an epidural compared to 67% among standard nullipara cared for at NW;<br />
22% had syntocinon during spontaneous labour compared to 45%, 11% had an episiotomy<br />
compared to 29%, and 92% had vaginal births compared to 79%.<br />
There were 2 perinatal deaths among women commencing labour at Birthcare. One was an<br />
early neonatal death associated with maternal death due to massive maternal amniotic fluid<br />
embolism. The other was an unexplained stillbirth at 39 weeks.<br />
93
Summary<br />
• The caesarean section rate at NW is continuing to increase. This is more apparent among<br />
non-NW LMCs, and caesarean rates vary by caregiver even with “apparently low risk”<br />
standard primipara.<br />
• The increased caesarean section rate is at the expense of spontaneous vaginal birth.<br />
• Operative vaginal birth continues at a consistent rate around 15% despite increases in<br />
caesarean section.<br />
• VBAC and breech vaginal births occur at low rates at NW and thus contribute to the high<br />
caesarean section rate.<br />
• Episiotomy rates are stable at 22% overall although rates of third and fourth degree<br />
perineal tear have significantly increased. There are large differences in rate of episiotomy<br />
by caregiver group among spontaneous vaginal births to both nullipara and multipara.<br />
• Postpartum haemorrhage rates are increasing overall although blood transfusion rates<br />
have not increased.<br />
• Rates of epidural use at NW are high (62% of all women birthing at NW).<br />
• Inadequate data are collected on the use and implications of use of epidural analgesia in<br />
normal labour.<br />
• There has been a significant reduction between 2000 and <strong>2005</strong> in the proportion of term<br />
babies born with Apgars
section<br />
6<br />
POSTNATAL CARE<br />
95
6 POSTNATAL CARE<br />
This chapter provides information on infant feeding and postnatal admissions.<br />
6.1 Infant feeding<br />
Breastfeeding remains a vital health promotion strategy to improve the health of<br />
<strong>Auckland</strong>ers. Breastfeeding contributes positively to five of the 13 population health<br />
objectives in the New Zealand health strategy, improving nutrition, reducing obesity, reducing<br />
the incidence and impact of cancer, cardiovascular disease and diabetes. <strong>National</strong> Women’s<br />
continues to focus on increasing the exclusive breastfeeding rate and implementing<br />
processes to become a Baby Friendly <strong>Hospital</strong>.<br />
Methods<br />
<strong>National</strong> Women’s breastfeeding statistics are collected for infants birthed in the facility<br />
whether they remain for postnatal care or are discharged to Birthcare or home within a few<br />
hours of the birth. Babies admitted to NICU are excluded from the data presented here and<br />
are included in the Newborn chapter.<br />
Data are collected at the time of discharge from the facility. Data are also collected at 5-6<br />
weeks postpartum for women whose post discharge care was provided by NW. Data<br />
collection at discharge from the facility improved in <strong>2005</strong>.<br />
Findings<br />
Statistics on infant feeding are prepared monthly and the figures for all feeding groups<br />
remained static for the first nine months of <strong>2005</strong> with a rise in exclusive breastfeeding and a<br />
fall in fully breastfeeding in the last three months. The increase in exclusive breastfeeding is<br />
continuing in 2006. This is possibly related to the employment of a second lactation<br />
consultant in September <strong>2005</strong>.<br />
%<br />
80<br />
Exclusive Fully Partial Artificial<br />
70<br />
60<br />
50<br />
40<br />
30<br />
20<br />
10<br />
0<br />
Jan-04<br />
Feb-04<br />
Mar-04<br />
Apr-04<br />
May-04<br />
Jun-04<br />
Jul-04<br />
Figure 49: Method of infant feeding at discharge in <strong>2005</strong><br />
Aug-04<br />
Sep-04<br />
Oct-04<br />
Nov-04<br />
Dec-04<br />
In <strong>2005</strong> 63.9% exclusive breastfeeding was achieved, a 10% increase over two years. The<br />
trend towards a reduction in artificial feeding has continued with only 3.8% of mothers<br />
artificial feeding on discharge in <strong>2005</strong>.<br />
97<br />
Jan-05<br />
Feb-05<br />
Mar-05<br />
Apr-05<br />
May-05<br />
Jun-05<br />
Jul-05<br />
Aug-05<br />
Sep-05<br />
Oct-05<br />
Nov-05<br />
Dec-05
%<br />
80<br />
60<br />
40<br />
20<br />
0<br />
Spontaneous Vaginal Operative Vaginal Elective CS Emergency CS<br />
Exclusive BF Fully BF Partial BF Artificial<br />
Figure 50: Infant feeding at discharge from NW by mode of birth<br />
Table 43: Exclusive breastfeeding by mode of birth<br />
2004 <strong>2005</strong><br />
% %<br />
Spontaneous vaginal 74.2 78.6<br />
Operative vaginal 64.9 69.1<br />
Caesarean section 38.6 38.6<br />
Mode of birth remains a significant factor in breastfeeding outcomes. There have been<br />
noticeable improvements in exclusive breastfeeding among women having vaginal births.<br />
Medications given during birth and operative procedures impact on the mother’s response to<br />
her baby’s feeding cues. They also result in dependence on staff to achieve attachment, and<br />
they delay initiation of the second phase of lactogenesis. The second phase of lactogenesis<br />
is triggered by the baby regularly stimulating and stretching the areola and nipple. These<br />
issues pose challenges for the future in our path to becoming a Baby Friendly <strong>Hospital</strong>.<br />
%<br />
80<br />
60<br />
40<br />
20<br />
0<br />
=41 yrs<br />
Exclusive BF Fully BF Partial BF Artificial<br />
Figure 51: Infant feeding at discharge from NW by maternal age<br />
98
%<br />
80<br />
60<br />
40<br />
20<br />
0<br />
NZ European Maori Pacific Asian<br />
Indian Other European Other<br />
Exclusive BF Fully BF Partial BF Artificial<br />
Figure 52: Infant feeding at discharge from NW by maternal ethnicity<br />
The number of Maori women exclusively breastfeeding has increased by 6% to 68.4%, and<br />
is associated with a reduction in artificial feeding from 9.9% in 2004 to 5.6% in <strong>2005</strong>. These<br />
figures support the health messages and work of the Maori health team members and LMCs.<br />
%<br />
80<br />
60<br />
40<br />
20<br />
0<br />
< 37 weeks 37 - 40 weeks 41+ weeks<br />
Exclusive BF Fully BF Partial BF Artificial<br />
Figure 53: Infant feeding at discharge from NW by gestation at birth<br />
There have been small improvements in exclusive breastfeeding rates in babies < 37 weeks<br />
(1.9%) and 37–40 weeks (1.7%) with a more significant improvement of 5.1% to a rate of<br />
70.9% in the 41+ weeks group. While this is a smaller group it does represent 16.9% of the<br />
available breastfeeding data.<br />
%<br />
80<br />
60<br />
40<br />
20<br />
0<br />
< 2.5 kgs 2.5 – 2.9 kgs 3.0 – 4.4 kgs 4.5+kgs<br />
Exclusive BF Fully BF Partial BF Artificial<br />
Figure 54: Infant feeding at discharge from NW by fetal birthweight<br />
99
While the
increase in numbers in the Medical and Diabetes groups, from discharge from NW to<br />
discharge from Homecare, reflects a number of babies who were partial breastfeeding on<br />
discharge but have gone on to establish successful breastfeeding.<br />
%<br />
20<br />
15<br />
10<br />
5<br />
0<br />
Domino Community Medical Diabetes<br />
AF on discharge from NW AF on discharge from Homecare<br />
Figure 57: Artificial feeding at discharge from NW facility and discharge from NW Homecare<br />
Summary/Implications<br />
Breastfeeding rates at NW continue to rise particularly among<br />
• Vaginal births – both spontaneous and operative<br />
• Mothers under 35 years and more particularly in younger mothers<br />
• Maori mothers<br />
• Babies with gestation of 41 or more weeks<br />
• Mothers with Community Midwives as LMC<br />
There are challenges for improvements among<br />
• Caesarean Section Births<br />
• Mothers over 40 years<br />
• Pacific, Asian and Indian mothers<br />
• Mothers with Diabetes or Medical teams as LMC<br />
Towards the end of <strong>2005</strong> a second Lactation Consultant was appointed part time to assist<br />
progress towards achieving the Baby Friendly <strong>Hospital</strong> Award. Work has commenced to<br />
provide additional staff education to provide the support necessary to assist an increasing<br />
number of mothers to achieve their goals for exclusive breastfeeding.<br />
Women who have identified breastfeeding problems and are inpatients, or a history of<br />
previous breastfeeding difficulties, and mothers of babies on the Neonatal Unit can be<br />
referred to the Lactation Consultant. The Lactation Consultants work with staff and the<br />
mothers to assess and assist to overcome challenges. Mothers with medical conditions that<br />
make exclusive breastfeeding difficult to achieve are assisted to reach positive outcomes,<br />
and are fully supported with establishing expressing routines and information to assist<br />
transition to home.<br />
Readmissions for mastitis or breast abscess, and outpatient antenatal and postnatal referrals<br />
are seen within the hospital. Telephone advice is also available.<br />
101
6.2 Postnatal admissions<br />
Postnatal care following birth is provided at <strong>Auckland</strong> City <strong>Hospital</strong> for those women requiring<br />
secondary care or closer observation for themselves or their babies. Women requiring only<br />
primary care in the postnatal period and with well babies are transferred to Birthcare<br />
<strong>Auckland</strong>, or other primary units nearer their own home or, if they wish, are discharged<br />
home.<br />
Methods<br />
Additional analysis and cleaning of data this year have enabled us to report on postnatal<br />
readmissions.<br />
Findings<br />
Table 44: Maternal destination immediately following birth<br />
102<br />
2004 <strong>2005</strong><br />
N = 7491 N = 7194<br />
n % n %<br />
NW Wards 4618 61.6 4286 59.6<br />
Birthcare 2245 29.9 2354 32.7<br />
Home 539 7.2 510 7.1<br />
Other Units 89 1.2 44 0.6<br />
The transfer of women from NW to Birthcare postnatally is a contractual agreement. There<br />
has been concern that insufficient numbers of women are transferred to meet this contract,<br />
and so it is good to see a 2.8% increase in <strong>2005</strong>. A further 491 women, 11.5% of postnatal<br />
admissions to NW wards, transferred to Birthcare for ongoing postnatal care after initial care<br />
at <strong>National</strong> Women’s. Transfers to other units have halved, possibly because fewer women<br />
from the Howick/Botany area are booking at <strong>National</strong> Women’s since the move to <strong>Auckland</strong><br />
City <strong>Hospital</strong>.<br />
2500<br />
2000<br />
1500<br />
1000<br />
500<br />
0<br />
Spontaneous vaginal Operative vaginal Caesarean section<br />
NW Wards Birthcare Home Other Units<br />
Figure 58: Maternal destination by mode of birth<br />
50.4% of all spontaneous vaginal births and 40.6% of operative vaginal births transferred to<br />
Birthcare with only 7.7% of all births going home after birth.
Of the 2013 women with vaginal births initially cared for postnatally at NW, 1086 (54%) can<br />
be identified from <strong>Health</strong>ware as having a neonatal reason for their stay. These reasons<br />
include<br />
• neonatal admission to NICU,<br />
• low birth weight (
The higher percentage of Indian women remaining at NW reflects the higher caesarean<br />
section rate in this group of women. As in previous years higher numbers of European<br />
women transfer to Birthcare whereas Maori, Pacific Island and Asian women predominate<br />
among discharges to home.<br />
Table 45: Length of stay by mode of birth among admissions to NW wards<br />
N = 4286<br />
Length of stay<br />
Days<br />
n % Median<br />
Caesarean section birth - discharged to home 2067 48.2 4.3<br />
Caesarean section birth - transferred to Birthcare 144 3.4 1.0<br />
Caesarean section birth - transferred to other destinations 62 1.4 5.5<br />
Operative vaginal birth - discharged to home 407 9.5 2.8<br />
Operative vaginal birth - transferred to Birthcare 140 3.3 0.4<br />
Operative vaginal birth - transferred to other destinations 18 0.4 2.6<br />
Spontaneous vaginal birth - discharged to home 1193 27.8 2.0<br />
Spontaneous vaginal birth - transferred to Birthcare 189 4.4 0.4<br />
Spontaneous vaginal birth - transferred to other destinations 66 1.5 2.9<br />
6.2.1 Postnatal readmissions<br />
A total of 335 women of the 7194 women who gave birth at NW had postnatal readmissions<br />
in <strong>2005</strong> (4.7%), either after their initial postnatal stay or after being discharged to other<br />
postnatal facilities or to their home. These women had 360 readmissions, as follows<br />
• 311 had one readmission<br />
• 23 had two readmissions<br />
• 1 had three readmissions<br />
Of the women readmitted, 55.8% were primipara and 44.3% were multipara.<br />
The length of stay varied from 1 hour to 10.1 days with a median of 1.76 days.<br />
Table 46: Reasons for readmission<br />
104<br />
N = 360<br />
n %<br />
Neonatal Admission 1 77 21.4<br />
Infection 2 75 20.8<br />
Breast 3 60 16.7<br />
Wound breakdown 4 27 7.5<br />
Postpartum haemorrhage 29 8.1<br />
Hypertension 17 4.7<br />
Retained products 12 3.3<br />
Epidural complications 12 3.3<br />
Other 5 51 14.2<br />
12 women had a repeat readmission for a separate indication<br />
1<br />
includes babies requiring admission to NICU and babies admitted to the wards for phototherapy or feeding problems<br />
2<br />
includes infected caesarean section wound, urinary tract infection and other conditions where infection is suspected/diagnosed<br />
eg endometritis<br />
3<br />
includes mastitis, breast abscess or other conditions of the breast requiring hospital admission<br />
4<br />
breakdown of caesarean section or perineal wound requiring further medical intervention<br />
5<br />
Other reasons for readmission included abdominal pain, anaemia, psychiatric reasons, deep vein thrombosis, other maternal<br />
conditions e.g. cardiac complications, asthma.
The rate of re-admission is half that reported nationally (Report on Maternity Maternal and<br />
Newborn Information 2003, available at http://www.moh.govt.nz) although this may merely<br />
reflect different sources of data with national data derived from coding data rather than a<br />
specific clinical database such as NW maintains.<br />
% NW Wards Birthcare Home<br />
2.5<br />
2<br />
1.5<br />
1<br />
0.5<br />
0<br />
Neonatal Admission Infection Breast Wound<br />
Figure 61: Rates of re-admission indication by maternal destination following birth.<br />
Women were more likely to be re-admitted from Birthcare for neonatal reasons and for breast<br />
problems and from NW care for infection. Increased neonatal admissions from Birthcare<br />
likely reflect the lack of availability of paediatric review at Birthcare, while the excess infection<br />
re-admissions of women under NW postnatal care likely reflects the predominance of<br />
operative births among women receiving postnatal care at NW. The reason for increased readmission<br />
for breast problems from Birthcare is not immediately obvious.<br />
%<br />
3<br />
Neonatal admission Infection Breast Wound<br />
2.5<br />
2<br />
1.5<br />
1<br />
0.5<br />
0<br />
IMW Pvt Obstetrician NW Domino NW Community NW High Risk<br />
Figure 62: Indication for readmission by LMC group at time of birth<br />
There is a striking difference in re-admission by LMC with high rates among NW Domino<br />
and Community mothers. This may reflect both the demography of this group and the lack of<br />
24 hour midwifery availability among the community midwifery mothers.<br />
Postnatal admissions where births occurred at other facilities<br />
As a secondary and tertiary facility NW admits women requiring further care for themselves<br />
but more frequently for postnatal care when their baby requires admission to NICU or<br />
Starship. Of 44 women admitted after the birth of their babies at other facilities 37 (84%)<br />
were accompanying their babies with a further 4 (9%) admitted for retained products or PPH.<br />
The majority of these admissions (84%) came from DHBs within the greater <strong>Auckland</strong> area.<br />
105
106
section<br />
7<br />
NEWBORN SERVICES<br />
107
108
7 NEWBORN SERVICES<br />
This chapter provides data on the outcomes of babies cared for at the Neonatal Intensive<br />
Care Unit. Additional data can be found in Appendix 7.<br />
7.1 Admissions to the Newborn Intensive Care Unit<br />
Neonatal unit admissions have been falling for several years. Over the last two years this has<br />
been because of the opening of two local Level 2 neonatal units. In July 2004, Waitakere<br />
<strong>Hospital</strong> opened a 10-cot Level 2 Neonatal Unit. The North Shore <strong>Hospital</strong> Neonatal Unit<br />
opened in October 2003. This resulted in a decreased number of admissions to the ACH<br />
NICU in 2004-5. Because of these developments, <strong>Auckland</strong> City <strong>Hospital</strong> has decreased its<br />
cot numbers from 59 to 46 over the last two years<br />
The Waitemata units admit babies >1500 gm and >31 weeks gestation and will administer<br />
CPAP. <strong>Auckland</strong> City <strong>Hospital</strong> continues to be the level 3 referral unit for the two Waitemata<br />
hospitals and for Northland Base <strong>Hospital</strong>.<br />
Table 47: Admissions to the Newborn Intensive Care Unit<br />
1993 1994 1995 1996 1997 1998 1999 2000 2001 2002 2003 2004 <strong>2005</strong><br />
Number 1635 1666 1464 1690 1420 1300 1352 1412 1312 1331 1220 975 906<br />
Number<br />
1800<br />
1600<br />
1400<br />
1200<br />
1000<br />
800<br />
600<br />
400<br />
200<br />
0<br />
1981<br />
1983<br />
1985<br />
1987<br />
Figure 63: Admissions to NICU 1981-<strong>2005</strong><br />
1989<br />
7.1.1 Admissions to the Newborn Intensive Care Unit by gestation and birth weight<br />
1991<br />
The reduction in admissions has occurred in the group of babies ≥32 weeks gestation as<br />
many of these babies are now being born and stay in North Shore and Waitakere <strong>Hospital</strong>s.<br />
109<br />
1993<br />
Year<br />
1995<br />
1997<br />
1999<br />
2001<br />
2003<br />
<strong>2005</strong>
Number<br />
700<br />
600<br />
500<br />
400<br />
300<br />
200<br />
100<br />
0<br />
1999 2000 2001 2002 2003 2004 <strong>2005</strong><br />
Figure 64: Admissions to NICU by gestational age<br />
Number<br />
800<br />
700<br />
600<br />
500<br />
400<br />
300<br />
200<br />
100<br />
Figure 65: Admissions to NICU by birth weight<br />
0<br />
36<br />
=2500<br />
1999 2000 2001 2002 2003 2004 <strong>2005</strong><br />
7.1.1 Admissions to NICU by domicile of mother<br />
The fall in admissions is mainly from babies whose mothers are domiciled in the Waitemata<br />
<strong>District</strong> <strong>Health</strong> <strong>Board</strong> area. However, there is also a steady decline in admissions of babies<br />
whose mothers live in the local <strong>Auckland</strong> <strong>District</strong> <strong>Health</strong> <strong>Board</strong> area.<br />
The decrease in admission numbers was mostly in the larger, more mature babies. The<br />
number of admissions of babies whose mothers were domiciled in the Waitemata area fell by<br />
58% overall but by only 16% in babies
Number<br />
600<br />
500<br />
400<br />
300<br />
200<br />
100<br />
0<br />
ADHB CMDHB Waitemata Other<br />
2001 2002 2003 2004 <strong>2005</strong><br />
Figure 66: Admissions to NICU by maternal domicile<br />
7.1.2 Newborn Unit occupancy<br />
There has been a 29% decrease in bed occupancy since 2002 because the are fewer<br />
admissions and now many premature babies whose mothers are domiciled in the Waitemata<br />
and Counties Manukau DHB areas are transferred to their local level 2 unit once they are<br />
stable and of a certain size and gestation.<br />
Table 48: Occupancy (baby days) on NICU from 1999<br />
1999 2000 2001 2002 2003 2004 <strong>2005</strong><br />
Baby days 18407 20652 20108 20551 19249 14958 14541<br />
Baby-days<br />
10000<br />
8000<br />
6000<br />
4000<br />
2000<br />
0<br />
=2500<br />
1999 2000 2001 2002 2003 2004 <strong>2005</strong><br />
Figure 67: Occupancy (baby days per year) of NICU by gestational age<br />
111
Baby-days<br />
10000<br />
8000<br />
6000<br />
4000<br />
2000<br />
0<br />
7.3 Immunisation<br />
A number of babies are still in NICU when they are due their first immunisation at 6 weeks,<br />
and a few when their 2 nd immunisation is due at 3 months. In <strong>2005</strong> 74 of 86 babies (86%) still<br />
in NW on day 42 were immunised before going home. Three babies were very unwell and<br />
died within a few days and were not immunised. Five parents of 6 babies declined to have<br />
their babies immunised. One baby was transferred to a level II unit at 45 days of age with the<br />
recommendation to obtain parental consent when they were available. Immunisation was<br />
contraindicated in one baby on immunosuppressive drugs.<br />
Sixteen of 18 babies (89%) still in NICU at 3 months of age received their 2 nd immunisation<br />
before discharge. Parents declined immunisation in the other two.<br />
In 2004, 96% of babies in ACH at 42 days were immunised compared with 86% in <strong>2005</strong>. At 3<br />
months, 100% were immunised in 2004 and 89% in <strong>2005</strong>.<br />
Of note, five of the 69 parents of these 80 babies refused immunisations despite strong<br />
recommendations. In 2004, no parents declined consent.<br />
7.4 Infant feeding in NICU admissions<br />
Data are presented on babies admitted to NICU who were either discharged to a ACH postnatal<br />
ward or to home. In NICU all VLBW infants receive human milk fortifier as this is<br />
considered a ‘standard of care’ for such infants. According to the Ministry definitions, all<br />
these infants would be classified as having received breast milk substitutes and therefore be<br />
classified as being fully or partially rather than exclusively breast milk fed. However, for this<br />
report, human milk fortifier has not been included as a formula supplement.<br />
Overall 88% of babies were discharged receiving some breast milk. Sixty-six percent were<br />
discharged receiving only breast milk and 35% were exclusively breast fed (up from 18% in<br />
2004)<br />
100<br />
90<br />
80<br />
70<br />
60<br />
50<br />
40<br />
30<br />
20<br />
10<br />
0<br />
% Exclusive Full Partial Artificial<br />
500-999 1000-1499 1500-1999 2000-2499 2500+ Total<br />
Birth weight (g)<br />
Figure 69: Infant feeding on discharge from NICU by birth weight<br />
Data on babies discharged home or to postnatal wards only. Babies transferring to other units/hospitals excluded.<br />
Exclusive = only received breast milk during stay or received only breast milk plus human milk fortifier.<br />
Fully = received some formula during stay but discharge on breast milk only<br />
Partial = receiving both breast milk and infant formula at discharge.<br />
113
100<br />
90<br />
80<br />
70<br />
60<br />
50<br />
40<br />
30<br />
20<br />
10<br />
0<br />
% Exclusive Full Partial Artificial<br />
36 Total<br />
Gestational age (wks)<br />
Figure 70: Infant feeding on discharge from NICU by gestational age<br />
There are different challenges to achieve high breastfeeding rates in the different groups of<br />
babies. Very preterm infants are in hospital for several months. It is important to achieve<br />
maximum growth. Their mothers have to express breast milk for many weeks before their<br />
babies are ready to suckle. In this group, 71% are discharged fully or exclusively breastfed.<br />
This approximates the breastfeeding rate at 2-4 months of age (the usual age of discharge).<br />
This represents a considerable achievement by their mothers and the staff helping them.<br />
Moderately preterm babies are usually not as sick as the less mature infants. The time taken<br />
to achieve satisfactory sucking feeds is usually the main determinant of the length of stay.<br />
Sixty-nine percent of babies 32-36 weeks gestation are discharged exclusively or fully<br />
breastfeeding and only 9% are not receiving any breast milk. However only 29% of these<br />
babies were exclusively breast fed.<br />
As most term infants are only in NICU for a few days, the aim is to get the babies back with<br />
their mothers. The mother may be unwell herself and unable to be with her baby as much as<br />
desirable. The majority of babies (61%) in this group receive some formula feeds however<br />
61% are exclusively or fully breast fed on discharge.<br />
114
7.5 Hypoxic ischaemic encephalopathy (HIE)<br />
Only 4 inborn babies (three at term) developed significant stage 2 or 3 encephalopathy in<br />
<strong>2005</strong> giving an incidence of 0.5/1000 term live-births. The incidence was 1.6/1000 term live<br />
births in 2004 and 0.6/1000 term live births in 2003.<br />
Table 49: Details of Hypoxic Ischaemic Encephalopathy Stages 2 or 3.<br />
Born at Gestation<br />
Birth<br />
Weight<br />
Apgar<br />
1/5<br />
HIE<br />
Stage<br />
ACH 36 2205 6 / 8 2<br />
ACH 39 3970 1 / 0 3 1<br />
115<br />
Day<br />
died Comment<br />
SRM and fetal distress.<br />
Emergency caesarean.<br />
Spontaneous labour and<br />
delivery. Decelerations with<br />
good recovery only.<br />
ACH 40 3940 0 / 2 2 Shoulder dystocia.<br />
ACH 41 4680 0 / 0 3 0<br />
Home 39 4035 2 / 3 2<br />
Amniotic fluid embolus,<br />
delivered during maternal<br />
resuscitation attempt in<br />
Emergency Dept.<br />
Unplanned precipitous<br />
delivery at home<br />
Home 42 3560 3 / 5 3 1 No known fetal distress<br />
Whangarei<br />
Hosp<br />
40 2945 3 / 6 2 Probable placental abruption<br />
The care of all babies with significant HIE is reviewed confidentially to try to identify factors<br />
that may have contributed to the poor outcome and to attempt to improve care. Educational<br />
feedback is given to individual clinicians and to the units involved, as appropriate.
Days<br />
7.6 Assisted ventilation<br />
7.6.1 Number of babies receiving and duration of assisted ventilation<br />
Data in this section are presented for babies born at ACH, excluding babies transferred in<br />
postnatally. Excluding postnatal transfers allows more meaningful comparisons of postnatal<br />
care at NW/ACH across the years.<br />
Table 50: Number of babies on assisted ventilation<br />
80<br />
70<br />
60<br />
50<br />
40<br />
30<br />
20<br />
10<br />
0<br />
2001 2002 2003 2004 <strong>2005</strong><br />
CPAP or IPPV 393 446 404 402 395<br />
IPPV 126 140 109 123 140<br />
CPAP 379 421 388 388 367<br />
Total IPPV CPAP<br />
24 26 28 30 32 34 36 38 40<br />
Gestational age<br />
Figure 71: Median ventilation days on IPPV and<br />
CPAP and IPPV+CPAP by gestational age among<br />
survivors (<strong>2005</strong>)<br />
116<br />
100%<br />
80%<br />
60%<br />
40%<br />
20%<br />
0%<br />
IPPV CPAP only None<br />
23<br />
25<br />
27<br />
29<br />
31<br />
33<br />
35<br />
37<br />
Gestational age<br />
39<br />
41<br />
43<br />
Figure 72: Proportion of babies receiving assisted<br />
ventilation (excluding for surgery or a congenital<br />
anomaly) 2003-<strong>2005</strong><br />
Denominator is all inborn babies from 2003-<strong>2005</strong>, excluding delivery<br />
room deaths. n = 23089<br />
There is a dramatic reduction in the time on positive pressure ventilation from 27 weeks<br />
gestation onwards. There is a similar decrease in the time on CPAP from 29 weeks onwards.<br />
These data are important in deciding on timing of delivery for mildly preterm babies.<br />
While NICU has adopted CPAP as the primary mode of respiratory support, most babies ≤28<br />
weeks’ gestation will receive a period of positive pressure ventilation. There is a steady<br />
reduction in the need for positive pressure ventilation from 26 to 32 weeks and for the need<br />
for CPAP from 31 to 35 weeks.
7.6.2 Trends in use of assisted ventilation among
7.6.3 Trends in the use of assisted ventilation over the last eleven years. Data on all<br />
infants born in NW<br />
240<br />
200<br />
160<br />
120<br />
80<br />
40<br />
0<br />
24-25 26-27 28-29<br />
30-31 32-36 >36<br />
1995 1996 1997 1998 1999 2000 2001 2002 2003 2004 <strong>2005</strong><br />
Figure 76: Number on IPPV<br />
440<br />
400<br />
360<br />
320<br />
280<br />
240<br />
200<br />
160<br />
120<br />
80<br />
40<br />
0<br />
24-25 26-27 28-29<br />
30-31 32-36 >36<br />
1995 1996 1997 1998 1999 2000 2001 2002 2003 2004 <strong>2005</strong><br />
Figure 77: Number on CPAP<br />
480<br />
440<br />
400<br />
360<br />
320<br />
280<br />
240<br />
200<br />
160<br />
120<br />
80<br />
40<br />
0<br />
24-25 26-27 28-29<br />
30-31 32-36 >36<br />
1995 1996 1997 1998 1999 2000 2001 2002 2003 2004 <strong>2005</strong><br />
Figure 78: Number on CPAP + IPPV<br />
118<br />
These figures show the number of babies<br />
requiring assisted ventilation at ACH/NW<br />
over the last 10 years.<br />
In 1997, double short-pronged Hudson®<br />
CPAP was introduced and aspects of the<br />
“Columbia approach” to respiratory<br />
support were adopted.<br />
This resulted in a dramatic reduction in the<br />
number of infants needing intubation and<br />
assisted ventilation. There was a<br />
concomitant increase in the use of CPAP,<br />
particularly in babies from 32-36 weeks<br />
gestation.<br />
Head-box oxygen administration was<br />
phased out and all babies requiring<br />
oxygen were placed on CPAP.
7.6.4 Positive pressure ventilation and CPAP use in NW and across Australia and<br />
New Zealand at 24-27 weeks’ gestation<br />
These data compare the use of IPPV and CPAP in NW and across the Australia and New<br />
Zealand Neonatal Network. The Network collects standardised data from all NICUs in<br />
Australia and New Zealand.<br />
100%<br />
95%<br />
90%<br />
85%<br />
80%<br />
75%<br />
70%<br />
ANZNN NWH<br />
1995 1996 1997 1998 1999 2000 2001 2002 2003 2004 <strong>2005</strong><br />
Figure 79: Percentage on IPPV<br />
100%<br />
95%<br />
90%<br />
85%<br />
80%<br />
75%<br />
70%<br />
65%<br />
60%<br />
ANZNN NWH<br />
1995 1996 1997 1998 1999 2000 2001 2002 2003 2004 <strong>2005</strong><br />
Figure 80: Percentage on CPAP<br />
119<br />
30<br />
25<br />
20<br />
15<br />
10<br />
5<br />
0<br />
ANZNN NWH<br />
1995 1996 1997 1998 1999 2000 2001 2002 2003 2004 <strong>2005</strong><br />
Figure 81: Median days on IPPV<br />
50<br />
40<br />
30<br />
20<br />
10<br />
0<br />
ANZNN NWH<br />
1995 1996 1997 1998 1999 2000 2001 2002 2003 2004 <strong>2005</strong><br />
Figure 82: Median days on CPAP<br />
NW changed its policy on ventilatory support of preterm infants in 1997 to put a greater<br />
emphasis on CPAP use. The percentage of very immature infants treated with IPPV and the<br />
duration on IPPV declined to below the median of the of the Network overall. However, most<br />
of these infants require IPPV at some stage in their hospitalisation.<br />
CPAP use has always been high at NW. There has been a steady increase over the years.<br />
Its use in the rest of the Network is comparatively lower.
7.6.5 Positive pressure ventilation and CPAP use in NW and across Australia and<br />
New Zealand at 28-31 weeks’ gestation<br />
100%<br />
90%<br />
80%<br />
70%<br />
60%<br />
50%<br />
40%<br />
30%<br />
20%<br />
10%<br />
0%<br />
ANZNN NWH<br />
1995 1996 1997 1998 1999 2000 2001 2002 2003 2004 <strong>2005</strong><br />
Figure 83: Percentage on IPPV<br />
100%<br />
90%<br />
80%<br />
70%<br />
60%<br />
50%<br />
40%<br />
ANZNN NWH<br />
1995 1996 1997 1998 1999 2000 2001 2002 2003 2004 <strong>2005</strong><br />
Figure 84: Percentage on CPAP<br />
120<br />
10<br />
9<br />
8<br />
7<br />
6<br />
5<br />
4<br />
3<br />
2<br />
1<br />
0<br />
ANZNN NWH<br />
1995 1996 1997 1998 1999 2000 2001 2002 2003 2004 <strong>2005</strong><br />
Figure 85: Median days on IPPV<br />
20<br />
18<br />
16<br />
14<br />
12<br />
10<br />
8<br />
6<br />
4<br />
2<br />
0<br />
ANZNN NWH<br />
1995 1996 1997 1998 1999 2000 2001 2002 2003 2004 <strong>2005</strong><br />
Figure 86: Median days on CPAP<br />
The changing use of assisted ventilation in babies of 28-31 weeks’ gestation parallels that<br />
seen in the less mature babies. Fewer babies are ventilated for a shorter time. CPAP use at<br />
NW has always been high. However, the time spent on CPAP in babies of 28-31 weeks<br />
gestation has fallen since a peak in 1997.
7.6.6 High frequency oscillatory ventilation and inhaled nitric oxide<br />
These data are on all babies admitted to NICU in each year, including those born in other<br />
hospitals or at home.<br />
High frequency oscillatory ventilation (HFOV) is used only for ‘rescue’ treatment at <strong>National</strong><br />
Women’s. Hence, babies treated with HFOV are the sickest babies in NICU who would be<br />
expected to have a very poor outlook whatever the treatment. At all gestations, mortality in<br />
these infants is high. Term babies do slightly better than preterm infants.<br />
Table 51: HFOV and inhaled nitric oxide (iNO) use and survival over the last 10 years<br />
30%<br />
25%<br />
20%<br />
15%<br />
10%<br />
5%<br />
0%<br />
HFOV iNO HFOV + iNO<br />
n %Survived n %Survived n %Survived<br />
Total 136 53 177 62 74 51<br />
7.6.7 Term/post-term infants on assisted ventilation from 1995 to <strong>2005</strong><br />
This figure shows the number of term infants ventilated or treated with CPAP. Inborn and<br />
outborn infants are included. There has been a significant increase in CPAP use and little<br />
change in numbers on IPPV.<br />
140<br />
120<br />
100<br />
80<br />
60<br />
40<br />
20<br />
0<br />
1995<br />
1996<br />
CPAP IPPV<br />
122<br />
1997<br />
1998<br />
1999<br />
2000<br />
2001<br />
2002<br />
2003<br />
2004<br />
<strong>2005</strong><br />
Figure 89: Number of term and post term babies needing assisted ventilation<br />
In 1996, the largest group of term infants needing IPPV was those with meconium aspiration<br />
syndrome (MAS) and persistent pulmonary hypertension (PPHN). In 1996, 24 infants were<br />
ventilated for these indications. This number fell to 11 in <strong>2005</strong>. However, there was a rise in<br />
CPAP use in babies with MAS and PPHN from 15 to 22.<br />
The largest increase in CPAP use is in those infants with transient tachypnoea or respiratory<br />
distress syndrome. In 1996-7, 20 infants with these conditions were treated with CPAP and 8<br />
ventilated. In 2004-5, the numbers were 103 babies received CPAP and 8 ventilated,<br />
reflecting the change in unit policy in 1997-98.
7.7 Very low birth weight infants<br />
There was a peak of VLBW infants at NW in 2001 and then a reduction over the next three<br />
years. That decline in numbers seems to have halted in <strong>2005</strong>. Overall the proportion of<br />
outborn babies is low, representing only 9% both over the entire 10 years and in <strong>2005</strong>.<br />
Inborn & total number of babies<br />
240<br />
210<br />
180<br />
150<br />
120<br />
90<br />
60<br />
30<br />
Total Inborn Outborn<br />
0<br />
0<br />
1996 1997 1998 1999 2000 2001 2002 2003 2004 <strong>2005</strong><br />
Figure 90: Number of VLBW who were born elsewhere and admitted to NICU, or were born in<br />
ACH and alive at birth<br />
These numbers include outborn babies who were transferred to NW and babies who were<br />
born alive but died at birth and who were either >20 weeks gestation or >400gms birth<br />
weight. In <strong>2005</strong>, 20 of the 168 inborn infants
%<br />
100<br />
90<br />
80<br />
70<br />
60<br />
50<br />
40<br />
30<br />
20<br />
10<br />
0<br />
1959<br />
1963<br />
1967<br />
1971<br />
1001-1500 gm 501-1000 gm<br />
1975<br />
Figure 92: Neonatal survival (0-28 days) of ≤1500g inborn live-births from 1959 to <strong>2005</strong><br />
1979<br />
In <strong>2005</strong>, the majority of deaths in infants between 501 and 1000 gm were at birth (59%),<br />
either from extreme prematurity (9) or a lethal anomaly (1). However there were 2 infant<br />
deaths of premature babies who were still in hospital after 28 days that are not included in<br />
this figure. Over the years the definitions used have been the same, with all deaths at birth<br />
included if they showed signs of life.<br />
The number of babies with anomalies and the number who were not actively treated<br />
because of their low gestation varies from year to year, and has a big influence on the overall<br />
survival rate, particularly in the extremely low birth weight group (501-1000gms) (ELBW).<br />
There has been an enormous improvement in the results of perinatal and neonatal intensive<br />
care over this time period. In the first three years (1959-61) only 5/85 (6%) ELBW babies<br />
survived to 28 days compared to 150/191 (79%) in the last three years.<br />
The biggest improvements happened in the late 1970s and early 1980s with the beginning of<br />
modern intensive care and the introduction of techniques for ventilatory support. The trend of<br />
increasing survival in the ELBW group continues over the last 20 years. Artificial surfactant<br />
treatment was introduced in 1990.<br />
1983<br />
124<br />
1987<br />
1991<br />
1995<br />
1999<br />
2003
7.8 Survival of babies from 23 to 31 weeks gestational age born in<br />
<strong>National</strong> Women’s<br />
280<br />
240<br />
200<br />
160<br />
120<br />
80<br />
40<br />
0<br />
Survived Died in NICU Died at birth<br />
23 24 25 26 27 28 29 30 31<br />
Gestational age<br />
Figure 93: Numbers of babies born alive at<br />
23 to 31 weeks gestation in 2000-<strong>2005</strong><br />
100%<br />
80%<br />
60%<br />
40%<br />
20%<br />
0%<br />
125<br />
100%<br />
80%<br />
60%<br />
40%<br />
20%<br />
0%<br />
Survived Died in NICU Died at birth<br />
23 24 25 26 27 28 29 30 31<br />
Gestational age<br />
Figure 94: Survival to discharge home of<br />
babies born in 2000-<strong>2005</strong>. (n= 1113)<br />
23 24 25 26 27 28 29 30 31<br />
Gestational age<br />
Figure 95: Survival of babies born in <strong>National</strong> Women’s and admitted to NICU from 1995 to<br />
<strong>2005</strong> (n = 1972)<br />
Survival in very preterm infants has been fairly steady over the last decade. The NW/ACH<br />
data is confirmed by outcomes published by the ANZNN, which approximate population data.<br />
There is no overall increase in survival of these very preterm infants.<br />
The number of in each group in each year is small. The present survival rate is not<br />
significantly different to those of earlier years in any gestation category.
7.9 Intraventricular haemorrhage in all very low birth weight<br />
infants admitted to NICU from 1985 to <strong>2005</strong><br />
100%<br />
90%<br />
80%<br />
70%<br />
60%<br />
50%<br />
40%<br />
30%<br />
20%<br />
10%<br />
0%<br />
1985<br />
Grade 4 Grade 3 Grade 2 Grade 1 None Unknown<br />
1987<br />
1989<br />
1991<br />
1993<br />
Figure 96: Intraventricular haemorrhage in all
7.10 Morbidity of inborn very low birth weight infants and babies<br />
7.10.2 Survival<br />
100%<br />
90%<br />
80%<br />
70%<br />
60%<br />
50%<br />
ANZNN NWH<br />
1995 1996 1997 1998 1999 2000 2001 2002 2003 2004 <strong>2005</strong><br />
Figure 97: Survival at 24-5 wks gestation<br />
1995-2003 ANZNN 66%.<br />
NW 72% (CI 66%-78%).<br />
128<br />
100%<br />
95%<br />
90%<br />
85%<br />
80%<br />
75%<br />
70%<br />
ANZNN NWH<br />
1995 1996 1997 1998 1999 2000 2001 2002 2003 2004 <strong>2005</strong><br />
Figure 98: Survival at 26-7 weeks<br />
1995-2003 ANZNN 86%.<br />
NW 89% (CI 85%-92%).<br />
Survival at NW at these immature gestations is consistently good. The relatively small<br />
numbers at 24-25 weeks gestation accounts for the year to year variation at NW. Over the 11<br />
years, there were between 21 and 37 babies per year. These data are for all babies<br />
admitted, including those with lethal malformations but excluding deaths in the delivery room.
7.10.3 Intraventricular haemorrhage<br />
Overall, 14% of VLBW infants had any degree of IVH in <strong>2005</strong>. Because of the change in<br />
scanning policy, 19 (13%) mainly larger infants were not scanned. These babies are<br />
unlikely to have had an IVH. In the group under 32 weeks’ gestation, the incidence of any<br />
degree of IVH was also 14%.<br />
Six babies had more severe grades of IVH (grade 3 or 4). Four of these were under<br />
1000gms and 5 were under 26 weeks’ gestation. Three of these 6 babies died.<br />
50%<br />
40%<br />
30%<br />
20%<br />
10%<br />
0%<br />
ANZNN NWH<br />
1995 1996 1997 1998 1999 2000 2001 2002 2003 2004 <strong>2005</strong><br />
Figure 99: Any IVH at 24-7 weeks<br />
1995-2003 ANZNN 35%.<br />
NW 26% (CI 23%-30%).<br />
20%<br />
15%<br />
10%<br />
5%<br />
0%<br />
ANZNN NWH<br />
1995 1996 1997 1998 1999 2000 2001 2002 2003 2004 <strong>2005</strong><br />
Figure 100: Severe (G3-4) IVH at 24-7 weeks<br />
1995-2003 ANZNN 13%.<br />
NW 10% (CI 8%-13%).<br />
129<br />
30%<br />
25%<br />
20%<br />
15%<br />
10%<br />
5%<br />
0%<br />
ANZNN NWH<br />
1995 1996 1997 1998 1999 2000 2001 2002 2003 2004 <strong>2005</strong><br />
Figure 101: Any IVH at 28-31 weeks<br />
1995-2003 ANZNN 16%.<br />
NW 8% (CI 6%-10%).<br />
6%<br />
4%<br />
2%<br />
0%<br />
ANZNN NWH<br />
1995 1996 1997 1998 1999 2000 2001 2002 2003 2004 <strong>2005</strong><br />
Figure 102: Severe (G3-4) IVH at 28-31<br />
weeks<br />
1995-2003 ANZNN 3%.<br />
NW 1% (CI 1%-3%).<br />
The incidence of all grades is falling both in the Network and at NW. NW rates are<br />
consistently lower than the overall rate in the rest of ANZNN.
7.10.4 Cystic periventricular leukomalacia<br />
Two babies developed cystic PVL in <strong>2005</strong>. One was an unusual presentation at birth of a<br />
baby of 24 weeks gestation, with PVL confirmed at post-mortem examination. The other<br />
occurred in a baby of 29 weeks gestation weighing 1000gms.<br />
7.10.5 Retinopathy of prematurity<br />
From 1995 to 1997 the denominator for the ROP data was the number of infants alive at 42<br />
days of age (ANZNN definition). From 1998 onwards, it is those alive at 36 weeks postmenstrual<br />
age. This definition change makes very little difference to the results.<br />
In <strong>2005</strong>, NW changed its screening policy. Therefore there is an increase in the number of<br />
larger infants who were not screened. Prior to <strong>2005</strong>, babies
7.10.6 Chronic lung disease<br />
The ANZNN definition of chronic lung disease is used. CLD is the requirement for oxygen or<br />
any form of respiratory support (CPAP or IPPV) at 36 weeks post menstrual age. In some<br />
publications, the definition is only a requirement for supplemental oxygen. Including<br />
respiratory support in the definition increases the incidence. If the definition of “in oxygen”<br />
was used, the incidence of CLD in the
7.10.7 Necrotising enterocolitis<br />
In <strong>2005</strong> 4% of VLBW infants and 3% of
7.10.9 Pneumothorax needing drainage<br />
Thirteen inborn babies developed a pneumothorax that needed drainage in <strong>2005</strong>. An<br />
additional five outborn babies had pneumothoraces drained.<br />
7.10.10 Antenatal corticosteroids<br />
Antenatal steroid use is high in the Network and NW. In babies
7.10.11 Postnatal corticosteroids<br />
These data are on the use of postnatal corticosteroids used to treat CLD. Data on steroid<br />
use to facilitate extubation are excluded. The denominator used in the figures is the number<br />
of babies alive at 1 week of age.<br />
In the mid-1990s, dexamethasone became an accepted and proven treatment to lessen the<br />
severity of CLD. However, use then declined when concerns were raised as to whether<br />
dexamethasone may increase the rate of cerebral palsy in survivors. In the last few years it<br />
has become clearer which babies may benefit from postnatal dexamethasone. With this, the<br />
use of dexamethasone has increased slightly<br />
over the last three years.<br />
100<br />
90<br />
80<br />
70<br />
60<br />
50<br />
40<br />
30<br />
20<br />
10<br />
0<br />
%<br />
Ov erall 24-25 wks 26-27 wks<br />
28-29 wks 30-31 wks<br />
1995 1996 1997 1998 1999 2000 2001 2002 2003 2004 <strong>2005</strong><br />
Figure 110: Percentage receiving postnatal<br />
dexamethasone by gestational age<br />
134<br />
Figure 111: Percentage receiving<br />
postnatal dexamethasone by birth<br />
weight<br />
In <strong>2005</strong>, 9% of babies
7.11 Death of babies born in or admitted to <strong>National</strong> Women’s<br />
in <strong>2005</strong><br />
There were 56 neonatal and infant deaths in <strong>2005</strong>. These include all deaths of babies<br />
born in NW or admitted to NICU before 28 days or up to hospital discharge, whichever is<br />
the greater. Forty-nine of the 56 infants who died were born in ACH.<br />
Thirty-two deaths (57%) were in babies of
7.12 Child Development Unit<br />
7.12.1 Follow up at 18 months of children under 1500 grams born in 2003<br />
One hundred and forty-two infants who weighed
Table 53: Outcome Categories at 18 Months for Children Under 1500g<br />
Category I 3 (2.4%)<br />
.<br />
Category II 17 (13.8%)<br />
Category III 20 (16.3%)<br />
Category IV 83 (67.5%)<br />
Number Description<br />
1 with cognitive and motor impairment and severe visual impairment;<br />
1 with spastic quadriplegia, developmental delay and squint;<br />
1 with low cognitive and motor scores<br />
1 with cognitive and motor impairment and tonal abnormality,<br />
1 with cognitive and motor delays and squint (spectacles);<br />
6 with low cognitive and motor scores;<br />
9 with low cognitive scores.<br />
3 with low motor scores and tonal abnormalities,<br />
17 with motor delay.<br />
Table 54: Outcome of children
100%<br />
90%<br />
80%<br />
70%<br />
60%<br />
50%<br />
40%<br />
30%<br />
20%<br />
10%<br />
0%<br />
1985<br />
1986<br />
1987<br />
1988<br />
1989<br />
1990<br />
Cat I Cat II Cat III Cat IV<br />
n = 22 30 37 37 42 30 42 33 55 44 51 57 59 39 46 50 51 39 41<br />
1991<br />
Figure 113: Outcome at 18 months of children
Table 56: Outcome categories at 4 years<br />
Category I<br />
Category II<br />
(Severe disability): one or more of the following<br />
(i) Sensorineural deafness (requiring hearing aids)<br />
(ii) Bilateral blindness<br />
(iii) Severe cerebral palsy<br />
(iv) Stanford-Binet* Composite Score 2 or more standard deviations<br />
below mean<br />
One or more of the following:<br />
(i)<br />
(ii)<br />
Mild-moderate cerebral palsy<br />
Stanford-Binet* Composite Score between 1 & 2 standard deviations<br />
below mean.<br />
Category III Motor Skills † Standard Score more than one standard deviation<br />
below mean<br />
Category IV Normal development i.e. none of the above<br />
* The Stanford-Binet Intelligence Scale 4 th edition.<br />
† Vineland Adaptive Behavior Scales, 1984 : Motor Skills Domain.<br />
Table 57: Outcome categories at 4 years for children under 1500g born 2001 (n = 92)<br />
Number Description<br />
Category I 8 (8.7%) One child with spastic quadriplegia and cognitive impairment<br />
One child with mild cerebral palsy, cognitive and motor<br />
impairment<br />
6 children with cognitive impairment and low motor scores.<br />
Category II 15 (16.3%) 11 with low cognitive and motor scores<br />
3 with low cognitive scores and motor skills within the average<br />
range<br />
1 child with cerebral palsy and a low motor score.<br />
Category III 17 (18.5%) When tested, these children were within the average range for<br />
cognitive performance but below average for motor ability.<br />
Category IV 52 (56.5%)<br />
Summary<br />
• Admission numbers have decreased in response to regional changes in bed<br />
numbers and development of local Level 2 services. However, the number of<br />
infants admitted who weigh
140
section<br />
8<br />
PERINATAL MORTALITY<br />
141
142
8 PERINATAL MORTALITY<br />
This chapter provides information on perinatal and maternal deaths. Further data tables<br />
can be found in Appendix 8.<br />
<strong>National</strong> Women’s has a Bereavement team who care for women experiencing<br />
pregnancy loss, termination for fetal abnormality, intrauterine death and neonatal loss.<br />
The Bereavement team comprises of: midwifery, nursing and medical staff, pregnancy<br />
loss counsellors, chaplaincy, pathology team and the funeral directors.<br />
The aim of the service is to provide safe, respectful, culturally sensitive and holistic<br />
woman and whanau focused care; ensuring the legalities are completed. As a team we<br />
believe the care given to parents should be responsive to their individual feelings and<br />
needs. Parents should be able to feel in control and should be supported in making their<br />
own decisions about what happens to them and to their baby. We acknowledge that all<br />
communication with parents should be clear, sensitive and honest.<br />
We believe that all those who care for families who experience loss of a pregnancy or<br />
baby’s death should be well informed, have access to support for themselves and be<br />
given opportunities to develop their knowledge, understanding and skills.<br />
All women experiencing acute pregnancy loss will be seen on Women’s Assessment<br />
Unit (WAU). If under 20 wks and stable they will be transferred to the Gynaecology<br />
ward. If over 20wks they will remain on WAU. Those women having a Termination of<br />
Pregnancy over 20wks for fetal abnormality will be cared for on WAU. Women under<br />
20wks will be cared for in Ward 97. WAU has a specified bereavement room which is<br />
homely in design and encourages whanau involvement. The Quiet Room for <strong>National</strong><br />
Women’s is situated on WAU and open to everyone. It is also available for small farewell<br />
ceremonies and a quiet area for families to come together and say goodbye. The Rose<br />
Room is a facility for keeping babies nearer their parents and facilitates the grieving<br />
process and allows parents to see their baby when they wish.<br />
All perinatal deaths are reviewed by a multidisciplinary team comprising an obstetrician<br />
(MFM subspecialist), neonatologist, midwife, and perinatal pathologist. The pregnancy<br />
loss counsellor has recently joined this team. This group classifies the cause of death,<br />
summarises recommendations for management in a future pregnancy and if necessary<br />
makes recommendations about changes in systems and education for practitioners.<br />
143
Rate<br />
8.1 Perinatal and perinatal–related mortality rates<br />
Table 58: Inborn and BBA deaths<br />
Fetal<br />
deaths<br />
2000 2001 2002 2003 2004 <strong>2005</strong><br />
20-22 weeks 33 20 30 23 25 26<br />
23-24 weeks 12 10 10 8 18 11<br />
25-26 weeks 9 2 4 6 3 3<br />
27-28 weeks 3 1 2 1 10 6<br />
29-38 weeks<br />
27<br />
15 17 24 13 17<br />
>38 weeks<br />
9 6 2 13 5<br />
Total fetal deaths 84 57 69 64 82 68<br />
Neonatal<br />
deaths<br />
Early neonatal<br />
deaths (
All babies born at <strong>National</strong> Women’s who were transferred out of <strong>National</strong> Women’s and<br />
died within 7 days of birth have been included in the perinatal death rate, and those who<br />
died within 28 days of birth have been included in the perinatal related death rates.<br />
The stillbirth and neonatal mortality rates have remained stable over the last 5 years at<br />
<strong>National</strong> Women’s.<br />
8.2 Gestational age and perinatal-related loss<br />
Table 59: Gestational age and perinatal related mortality<br />
Births Stillbirths Neonatal deaths<br />
n % n %<br />
SB<br />
rate* n %<br />
145<br />
NND<br />
rate<br />
** n %<br />
Total perinatal related<br />
deaths<br />
Perinatal<br />
related<br />
death<br />
risk***<br />
20-27 weeks 108 1.5 41 61 5.6 27 63 402.9 68 61 9.2<br />
28-31 weeks 139 1.9 9 13 1.2 2 5 15.4 11 10 1.5<br />
32-36 weeks 559 7.6 8 12 1.1 6 14 10.9 14 12.6 2.0<br />
37-40 weeks 5437 73.6 9 13 1.4 5 12 0.9 14 12.6 2.1<br />
>41 weeks 1141 15.5 1 1 0.9 3 7 2.6 4 4 3.5<br />
Total 7384 100 68 100 9.2 43 100 5.9 111 100 15.0<br />
* Stillbirth rate = number of stillbirths per 1000 fetuses in utero<br />
** NND rate = number of deaths per 1000 live births in that gestation category<br />
*** Perinatal related death risk = number of perinatal related deaths per 1000 babies remaining in utero at that<br />
gestation bracket<br />
8.3 Maternal characteristics and perinatal mortality<br />
In <strong>2005</strong> as in 2004, both Maori and Pacific women had higher perinatal mortality than<br />
European where as Asian women had a reduced rate. In Maori the increased rate was<br />
predominantly due to higher neonatal mortality. These cases were reviewed in more<br />
detail and were found to be heterogeneous. Four (40%) died due to extreme<br />
prematurity, 4 had lethal fetal abnormalities and 2 babies died at 24 weeks from Twin to<br />
Twin Transfusion Syndrome.<br />
In Pacific women the high perinatal mortality was due to an increased number of<br />
stillbirths. These 18 stillbirths have been reviewed individually. Nine (50%) were<br />
Samoan, 5 (28%) Tongan, and 4 (22%) other Pacific ethnicity. BMI was available in<br />
13/18 cases and in 9 women was >35 and in 4 of these women was >40. Seven (39%)<br />
of Pacific stillbirths were due to fetal abnormalities, and 4 (22%) were unexplained. In 2<br />
cases sub-dural and/or intra-cerebral haemorrhage was confirmed and in a further case<br />
it was suspected on scan but no post-mortem was performed.<br />
The increased stillbirth rate in Pacific women appears to be multi-factorial. As confirmed<br />
in our data maternal obesity (BMI >30) is a known risk factor for stillbirth. Large<br />
prospective studies with complete data on body mass index are needed to determine<br />
whether Pacific ethnicity is an independent risk factor for stillbirth.
Sub-dural haemorrhage is a rare cause of stillbirth almost totally confined to Pacific<br />
island babies. This condition was seen more commonly in the 1970s and 1980s. The<br />
aetiology is unknown but some women have reported traditional Pacific Island massage<br />
during an affected pregnancy. In the 2 confirmed and one suspected case of fetal subdural<br />
there was no reported history of maternal traditional massage.<br />
BMI data was available in 50% of stillbirths and 58 % of neonatal deaths. Given these<br />
limited data, obesity (BMI>30) was associated with a 2 fold increase in perinatal death<br />
which is consistent with overseas data showing a 2-5 fold increase in obese women.<br />
Current smoking and unknown smoking status were associated with an increased<br />
perinatal death rate. A small number of women with perinatal deaths were reported to<br />
have stopped smoking during pregnancy and they had a trend to increased perinatal<br />
deaths. Overseas data suggests that if women become smoke free by 16 weeks that in<br />
our data the risk of perinatal loss is similar to non smokers. The explanation for the<br />
observed trend might be: small numbers, that some of these women were not truly<br />
smoke free or that they did not become smokefree early enough in pregnancy to impact<br />
on the risk of perinatal death. Women transferred to <strong>National</strong> Women’s and unbooked<br />
women are over-represented among women without smoking data. These women have<br />
other risk factors, including high rates of preterm birth for perinatal loss<br />
8.4 Plurality and perinatal mortality<br />
Table 60: Plurality and perinatal related mortality<br />
Births Stillbirths Neonatal deaths<br />
n % n %<br />
SB<br />
rate* n %<br />
146<br />
NND<br />
rate ‡ n %<br />
Total perinatal related<br />
deaths<br />
Perinatal<br />
related<br />
death<br />
rate†<br />
Singleton 7007 94.9 63 92 9.0 31 72 4.5 94 85 13.4<br />
Multiple 377 5.1 5 7 13.3 12 28 32.3 17 15 45.1<br />
Total 7384 68 9.2 43 5.9 111 15.0<br />
* Stillbirth rate = number of stillbirths per 1000 births<br />
‡ Neonatal Death rate = number of deaths per 1000 live births<br />
† Perinatal-related Death rate = number of perinatal related deaths per 1000 births<br />
Multiple pregnancies had a 3 fold higher risk of perinatal death compared with singleton<br />
pregnancies. The causes of death in multiples were: preterm birth (n=7, 41%), twin to<br />
twin transfusion syndrome (n=5, 29%), fetal abnormality (n=3, 18%) and one termination<br />
for a severe maternal medical condition (n=2, 12%)
8.5 Lead maternity carer (LMC) at birth and perinatal mortality<br />
Table 61: LMC and perinatal related mortality<br />
Births Stillbirths Neonatal deaths<br />
n % n %<br />
SB<br />
rate* n %<br />
147<br />
NND<br />
rate ‡ N %<br />
Total perinatal related<br />
deaths<br />
Perinatal<br />
related death<br />
rate†<br />
Independent Midwife 3023 41.1 15 22.0 5.0 15 34.9 5.0 30 27.0 9.9<br />
Private Obstetrician 1651 22.5 9 13.2 5.5 4 9.3 2.4 13 11.7 7.9<br />
G.P. 172 2.3 1 1.5 5.8 0 0 0 1 0.9 5.8<br />
NW Medical 375 5.1 9 13.2 24 10 23.2 27.3 19 17.1 50.7<br />
NW Diabetes 216 2.9 2 2.9 9.2 1 2.3 4.7 3 2.7 13.9<br />
NW Domino 596 8.1 2 2.9 7.3 0 0 0 2 1.8 3.4<br />
NW Community 1098 14.9 8 11.8 7.3 6 14.0 5.5 14 12.6 12.8<br />
NW ADAPT 79 1.1 2 2.9 25.3 0 0 0 2 1.8 25.3<br />
Other DHB 145 2.0 16 23.6 110 5 11.6 38.8 21 18.9 144.8<br />
Unbooked 55 0.7 4 5.8 73 2 4.7 39.2 6 5.4 109<br />
Total 7384 100 68 100 9.2 43 100 5.9 111 100 15.0<br />
* Stillbirth rate = number of stillbirths per 1000 births<br />
‡ Neonatal Death rate = number of deaths per 1000 live births<br />
† Perinatal related death rate = number of perinatal related deaths per 1000 births<br />
The high perinatal mortality rate in the fetal medicine/medical clinics likely largely reflects the<br />
increased death rate in babies with severe congenital abnormalities.<br />
8.6 Causes of perinatal-related deaths<br />
Table 62: Stillbirth and neonatal death by cause (PSANZ-PDC) <strong>2005</strong><br />
Fetal deaths Neonatal deaths Total<br />
n % Rate* n % Rate** n % Rate*<br />
Congenital abnormality 25 37 3.4 13 30 1.8 38 34 5.1<br />
Perinatal infection 6 9 0.8 5 12 0.7 11 10 1.5<br />
Hypertension 3 4 0.4 0 0 0 3 3 0.4<br />
Antepartum haemorrhage 3 4 0.4 3 7 0.4 6 5 0.8<br />
Maternal conditions 7 10 0.9 1 2 0.1 8 7 1.1<br />
Specific perinatal<br />
conditions<br />
5 7 0.7 5 12 0.7 10 9 1.4<br />
Hypoxic peripartum death 1 1 0.1 3 7 0.4 4 4 0.5<br />
Fetal growth restriction 1 1 0.1 0 0 0 1 1 0.1<br />
Spontaneous preterm 7 10 0.9 13 30 1.8 20 18 2.7<br />
Unexplained antepartum<br />
death<br />
10 15 1.4 0 0 0 10 1.4<br />
Total 68 100 9.2 43 100 5.9 111 100 15.0<br />
* Rate: per 1000 births (n=7384 in <strong>2005</strong>) ** Rate: per 1000 livebirths (n=7316 in <strong>2005</strong>)
Fetal growth restriction<br />
Hypertension<br />
Hypoxic peripartum death<br />
Antepartum haemorrhage<br />
Maternal conditions<br />
Unexplained antepartum death<br />
Specific perinatal conditions<br />
Perinatal infection<br />
Spontaneous preterm<br />
Congenital abnormality<br />
Figure 115: Contribution to perinatal death by cause (PSANZ-PDC) and gestation at birth<br />
8.7 Neonatal deaths<br />
%<br />
0 5 10 15 20 25 30 35 40<br />
Table 63: Neonatal deaths by cause (PSANZ-NDC) and gestational age<br />
Total neonatal<br />
deaths<br />
148<br />
37 weeks<br />
< 37 weeks > 37 weeks<br />
n % n %<br />
Total 43 35 81 8 19<br />
Extreme prematurity 17 17 100 0<br />
Congenital abnormality 11 7 64 4 36<br />
Infection 5 4 80 1 20<br />
Neurological 5 3 60 2 40<br />
Cardio-respiratory disorders 4 3 75 1 25<br />
Gastrointestinal 1 1 100 0<br />
In recent years the commonest category of perinatal deaths after 37 weeks has been<br />
unexplained antepartum death. This year there were 3 perinatal deaths due to infection,<br />
2 late stillbirths had E coli cultured from the lungs and one baby died in the neonatal<br />
period after hospital discharge from an unspecified viral infection.
8.8 Necropsy<br />
80<br />
70<br />
60<br />
50<br />
40<br />
30<br />
20<br />
10<br />
0<br />
% Stillbirth Neonatal death Perinatal death<br />
1991 1992 1993 1994 1995 1996 1997 1998 1999 2000 2001 2002 2003 2004 <strong>2005</strong><br />
Figure 116: Necropsy rates 1991-<strong>2005</strong><br />
8.9 Maternal deaths<br />
In <strong>2005</strong> there were 2 maternal deaths, one associated with hyperemesis in the antenatal<br />
period and one with an amniotic fluid embolism intrapartum. These deaths have been<br />
reviewed by a subgroup of the Maternal Clinical Review Committee.<br />
149
150
section<br />
9<br />
FERTILITY SERVICES<br />
151
152
9 FERTILITY SERVICES<br />
This chapter documents the IVF and ICSI clinical outcomes from Fertility Plus in <strong>2005</strong><br />
and a discussion on recent advancements in the service<br />
Table 64: Fertility Plus IVF/ICSI clinical outcomes<br />
153<br />
1999 2000 2001 2002 2003 2004 <strong>2005</strong><br />
Number of Cycles started 132 125 289 309 306 316 398<br />
Number of Cycles stopped 41 41<br />
Percent cycles stopped 13% 10%<br />
NPSU 2000 benchmark for cycles stopped 10% 10% 10% 10% 10% 10%<br />
Number of Cycles reaching Oocyte Pick Up (OPU) 100 115 230 247 246 275 357<br />
Number of Cycles reaching Embryo Replacement 80 99 189 201 206 237 304<br />
Percent cycles reaching Embryo Replacement 86% 85%<br />
NPSU 2002 benchmark for replacement 87% 87% 87% 87%<br />
Number of Clinical Pregnancies 23 24 57 65 67 83 96*<br />
Clinical pregnancy rate/cycle started 26% 24%*<br />
NPSU 2000 benchmark for clinical<br />
pregnancy rate/cycle started<br />
24% 24% 24% 24% 24% 24%<br />
Clinical Pregnancy rate/OPU 23% 21% 25% 26% 27% 30% 27%*<br />
NPSU 2002 benchmark Clinical pregnancy rate<br />
/OPU<br />
26% 26% 26% 26%<br />
Clinical Pregnancy rate/Embryo Replacement 29% 24% 30% 32% 33% 35% 32%*<br />
Clinical Pregnancy rate/Embryo Replacement<br />
(women
As expected, the replacement of only one embryo in these younger women resulted in a<br />
decrease in their pregnancy rate, in the overall pregnancy rate, and in the twinning rate<br />
for the year. However, the percentage of embryos replaced that resulted in a pregnancy<br />
did not decrease. This is the Implantation Rate and was 20% in both 2004 and <strong>2005</strong>.<br />
Preimplantation genetic diagnosis (PGD)<br />
Government funding has recently been made available for screening of embryos before<br />
transfer. Preimplantation genetic diagnosis (PGD) is currently being developed at fertility<br />
PLUS. PGD allows couples at risk of passing on a genetic disease to have a child that<br />
does not carry the genes for the disease and that is fully related to them. It is a<br />
diagnostic test generally performed on day 3 embryos (8 cell stage) to detect known<br />
genetic diseases or chromosomal abnormalities.<br />
Previously, options for screening included amniocentesis and chorionic villus sampling,<br />
but these techniques pose couples with the dilemma of whether or not to terminate the<br />
pregnancy if a genetic abnormality is present. PGD facilitates diagnosis before embryos<br />
are replaced allowing for the transfer of unaffected embryos only.<br />
PGD is most useful for patients who are at risk of passing on single gene defects like<br />
Cystic Fibrosis, Thalassemia, Tay Sachs, Spinal Muscular Atrophy or Huntington’s<br />
disease. It is also useful for detecting the chromosomal abnormalities (aneuploidy) that<br />
result in Down Syndrome (an extra chromosome 21), Kleinfelter syndrome (47XXY) or<br />
Turner Syndrome (45X).<br />
IVF or ICSI is required in order to perform PGD. On Day 3 the embryos are “biopsied” to<br />
remove a cell. A small hole is made in the shell of the embryo (zona pellucida) using a<br />
laser and 1 or 2 cells are gently removed from the embryo. The cells from each embryo<br />
are then analysed to look for abnormalities by either PCR (Polymerase Chain Reaction)<br />
or FISH (Fluorescence in situ Hybridisation). PCR is mainly used for detecting single<br />
gene defects. Multiple copies of the piece of DNA coding for the gene in question are<br />
made using PCR. They are then analysed for the presence of mutations. FISH is used to<br />
detect sex-linked disorders, chromosomal abnormalities and aneuploidies. A fluorescent<br />
marker is attached to chromosome-specific DNA probes and mixed with the DNA<br />
obtained from the removed cells. Fluorescence microscopy is then used to detect<br />
coloured spots corresponding to specific chromosomes thus allowing abnormal<br />
chromosomes to be detected.<br />
Currently, after embryo biopsy, the cells will be sent to Australia for analysis. The results<br />
will be available within 48 hours, during which time, the remaining embryo will stay in<br />
New Zealand and be cultured to the blastocyst stage. Embryo(s) not affected by the<br />
disease will be transferred to the uterus on Day 5 or 6. Any “spare” normal embryos can<br />
be frozen at the blastocyst stage.<br />
154
section<br />
10<br />
GYNAECOLOGY<br />
155
156
10 GYNAECOLOGY<br />
10.1 Hyperemesis<br />
Methods<br />
These data were sourced from DSU. They include all inpatient admissions to the<br />
gynaecology or obstetric services during <strong>2005</strong> coded with a diagnosis of hyperemesis within<br />
the first six diagnostic codes. The numbers were reconciled against Electronic Discharge<br />
data for the gynaecology inpatient service. This process revealed a further 2 hyperemesis<br />
visits. These visits are not included in the tables below.<br />
Data for re-admissions have been presented but these data do not include repeat<br />
admissions if these occurred in 2004 and 2006. Therefore re-admissions are likely to have<br />
been underestimated.<br />
Findings<br />
Table 65: Demographic characteristics of women admitted with hyperemesis<br />
Maternal age<br />
Total<br />
N=177<br />
157<br />
Single admission<br />
n=115<br />
Multiple admissions<br />
n=62<br />
n % n % n %<br />
< 20 15 8.5 11 9.6 4 6.5<br />
21-25 48 27.1 30 26.1 18 29.0<br />
26-30 47 26.6 33 28.7 14 22.6<br />
31-35 39 22.0 22 19.1 17 27.4<br />
>35 28 15.8 19 16.5 9 14.5<br />
Ethnicity 0.0 0.0<br />
NZ European 47 26.6 34 29.6 13 21.0<br />
Māori 7 4.0 5 4.3 2 3.2<br />
Pacific 50 28.2 29 25.2 21 33.9<br />
Asian 17 9.6 12 10.4 5 8.1<br />
Indian 30 16.9 19 16.5 11 17.7<br />
Other European 6 3.4 2 1.7 4 6.5<br />
Other 19 10.7 13 11.3 6 9.7<br />
Unstated 1 0.6 1 0.9 0 0.0<br />
<strong>District</strong> <strong>Health</strong> <strong>Board</strong> 0.0<br />
<strong>Auckland</strong> 151 85.3 95 82.6 56 90.3<br />
Counties Manukau 10 5.6 8 7.0 2 3.2<br />
Waitemata 14 7.9 10 8.7 4 6.5<br />
Other DHB 2 1.1 2 1.7 0 0.0<br />
Number of admissions<br />
1 177 115 100<br />
2 38 61<br />
3 12 19<br />
4 -7 11 18<br />
Length of stay<br />
(median (IQR))<br />
* Based on 174 admissions<br />
1.5(0.5-2.2) 2.9(1.6-4.2)*
Seven women admitted with hyperemesis are recorded as having had an enteral<br />
infusion.<br />
Summary /Implications<br />
Hyperemesis is a challenging problem for all involved. It is significant that one third of<br />
women have more than one admission. The establishment of a day stay facility for these<br />
women has been proposed in the past and should be given further consideration<br />
especially for those women requiring repeat admissions. During the day stay the patients<br />
could have their electrolytes checked, be given intra-venous fluids and have their<br />
medications reviewed.<br />
158
10.2 Ectopic pregnancy<br />
Methods<br />
These data were sourced from the Decision Support Unit coding data (DSU). They<br />
include all inpatient admissions to the gynaecology service during <strong>2005</strong> coded with a<br />
diagnosis of ectopic pregnancy within the first six diagnostic codes. The numbers were<br />
reconciled against Electronic Discharge data for the gynaecology inpatient service. This<br />
process revealed a further 1 ectopic visit.<br />
Table 66: Demography and clinical characteristics of inpatient admissions with ectopic<br />
pregnancy during <strong>2005</strong><br />
Maternal age<br />
Ethnicity<br />
Women<br />
n=106<br />
n %<br />
< 20 7 7<br />
21-25 16 15<br />
26-30 27 26<br />
31-35 34 32<br />
>35 22 21<br />
NZ European 29 27<br />
Māori 8 8<br />
Pacific 20 19<br />
Asian 19 18<br />
Indian 6 6<br />
Other European 13 12<br />
Other 8 8<br />
<strong>District</strong> <strong>Health</strong> <strong>Board</strong><br />
<strong>Auckland</strong> 88 83<br />
Counties Manukau 4 4<br />
Waitemata 11 10<br />
Northland 1 1<br />
Overseas 2 2<br />
Mode of treatment ‡<br />
Expectant* 35 33<br />
Medical 11 10<br />
Surgical** 60 57<br />
No of admissions<br />
1 79 74.5<br />
2 18 17.0<br />
3 3 2.8<br />
4-6 6 5.7<br />
‡ The data given here denote management during inpatient stay. See text below for outcomes among these women.<br />
*Expectant means that no medical or surgical treatment has been coded during an inpatient admission for this woman.<br />
**Two of these women were first managed medically prior to surgery.<br />
159
Six further cases were identified from the Early Pregnancy Assessment Unit (EPAU). These<br />
cases are not included in the tables of inpatient care given below. Further data on<br />
management of women managed conservatively during their inpatient visit were obtained<br />
from checking the clinical records in CRIS.<br />
Data for re-admissions have been presented but these data do not include re-admissions if<br />
these occurred in 2004 and 2006. Therefore multiple admissions are likely to have been<br />
underestimated.<br />
Findings<br />
Of the 35 expectant management cases identified from the DSU data and reported in the<br />
table above, 5 ultimately did not have an ectopic pregnancy, 3 further cases were managed<br />
with surgery (one of whom then required Methotrexate), 12 were treated with Methotrexate<br />
alone, 2 were managed elsewhere by unknown method and 13 had no treatment recorded.<br />
Of the 6 additional cases identified from EPAU records, two were treated with methotrexate<br />
and 4 were managed conservatively.<br />
In total, therefore, of 107 apparently confirmed cases of ectopic pregnancy treated within our<br />
service (both gynaecology inpatient service and EPAU) in <strong>2005</strong>, 25 were managed solely<br />
with Methotrexate (23%), and 63 primarily with surgery (59%), two were managed in other<br />
places and the remaining 17 women were managed conservatively.<br />
Table 67: Length of stay among all inpatient admissions for ectopic pregnancy (n=151)<br />
Length of stay (days)<br />
Expectant<br />
n= 78<br />
160<br />
Medical<br />
n=13<br />
Surgical<br />
n=60<br />
Median (IQR) 0.2(0.2-0.9) 0.3(0.2-0.9) 2.5(1.9-3.1)<br />
Of all 106 women admitted as inpatients with a diagnosis of ectopic pregnancy, 9 (8%)<br />
were recorded as having had a blood transfusion. All of these women received surgical<br />
treatment for their ectopic.<br />
Summary /Implications<br />
Although these data are welcome, they are limited in that the tables do not accurately reflect<br />
what happened during the clinical care of these women with an ectopic pregnancy. We do<br />
not collect data on their presentation, their management, the HCG levels, their ultrasound<br />
findings or their final outcomes.<br />
The current criteria for medical management is a diagnosis of ectopic pregnancy with a βhCG<br />
level
10.3 Hysterectomy<br />
Methods<br />
These data were sourced from DSU coding data. They include all inpatient admissions<br />
to the gynaecology service during <strong>2005</strong> coded with hysterectomy as a procedure within<br />
the first four procedure codes. The numbers were reconciled against Electronic<br />
Discharge data for the gynaecology inpatient service. This process revealed a further 4<br />
hysterectomies. These cases are included in the clinical tables below but not in the<br />
length of stay data.<br />
The definition “Malignant indication” is not equivalent to “Oncology” as used in the<br />
hysterectomy review data presented in the 2000 and 2001-2003 annual clinical reports.<br />
“Oncology” in 2000 and 2001-2003 was defined as patients operated on by surgeons<br />
working in the oncology service plus by other surgeons with cancer as an indication for<br />
surgery. This year the definition is based only on indication for hysterectomy because<br />
surgeon is not a variable in the DSU dataset. Our oncology surgeons also provide a<br />
service for difficult surgical cases and therefore do perform non-malignant<br />
hysterectomies. Therefore, it is likely that the proportion of cases described as<br />
oncological this year will be smaller than in the previous years.<br />
Findings<br />
Table 68: Characteristics of women undergoing hysterectomy during <strong>2005</strong> by indication<br />
Maternal age<br />
Ethnicity<br />
Malignant<br />
indication<br />
n=82<br />
161<br />
Non malignant<br />
n=161<br />
n % n %<br />
65 20 24 28 17<br />
NZ European 33 40 62 39<br />
Māori 8 10 17 11<br />
Pacific 15 18 24 15<br />
Asian 4 5 19 12<br />
Indian 4 5 12 7<br />
Other European 12 15 13 8<br />
Other 6 7 11 7<br />
Not stated 3 2<br />
<strong>District</strong> <strong>Health</strong> <strong>Board</strong><br />
<strong>Auckland</strong> 28 34 146 91<br />
Counties Manukau 15 18 5 3<br />
Waitemata 24 29 8 5<br />
Bay of Plenty 10 12 1 1<br />
Other 5 6 1 1
Table 69: Primary indication for hysterectomy (non malignant)<br />
Type of hysterectomy<br />
162<br />
Non malignant<br />
n=161<br />
n %<br />
Total abdominal 77 48<br />
Subtotal abdominal 9 6<br />
Vaginal 54 34<br />
Laparoscopic assisted vaginal (LAVH) 21 13<br />
Indication for hysterectomy<br />
Excessive frequent menstruation 47 29<br />
Fibroids 34 21<br />
Prolapse 29 18<br />
Benign neoplasm ovary 10 6<br />
Postmenopausal bleeding 8 5<br />
Endometriosis 7 4<br />
Carcinoma in situ-cervix 6 4<br />
Carcinoma in situ/hyperplasia-endometrium 5 3<br />
Dysmenorrhoea/other pain 5 3<br />
Other bleeding 2 1<br />
Other 8 5<br />
Table 70: Length of stay for women having a hysterectomy<br />
Malignant<br />
indication<br />
n=82<br />
Non malignant<br />
n=157<br />
Median (IQR) Median (IQR)<br />
Length of stay 6.3(5.2-7.5) 4.2(3.2-5.2)<br />
Table 71: Length of stay by type of hysterectomy (n=239)<br />
Total abdominal Subtotal abdominal Vaginal LAVH<br />
Median(IQR) Median(IQR) Median(IQR) Median(IQR)<br />
Length of stay 5.2(4.2-7) 4.3(3.7-4.9) 3.3(3.1-4.3) 2.5(2.3-4.6)<br />
Summary /Implications<br />
The mode of hysterectomy has not changed since the last audit 4 years ago. Vaginal<br />
hysterectomy is considered the safest and most cost effective option (Surgical approach<br />
to hysterectomy for benign gynaecological disease; The Cochrane Database of<br />
Systematic Reviews 2006) and in some centres accounts for at least 50% of the<br />
hysterectomies performed. Continued audit of hysterectomies should occur along with<br />
an initiative to increase the number of vaginal hysterectomies. Data should be collected<br />
on adherence to antibiotic and anticoagulant guidelines and on complications including<br />
return to theatre.
section<br />
11<br />
TERMINATION of PREGNANCY<br />
163
164
11 TERMINATION OF PREGNANCY<br />
Epsom Day Unit is the <strong>Auckland</strong> Regional, first trimester, termination of pregnancy<br />
service. It is a multi-disciplinary service incorporating Staff Nurses, <strong>Health</strong> Care<br />
Assistants, Social Workers, Surgeons from NW, Community Doctors with a particular<br />
interest in family planning and a small administration support team.<br />
Epsom Day Unit provides a two day service. Day one for assessment - psychosocial,<br />
medical, legal certification, contraceptive prescription and education. The women will<br />
meet with a social worker, community doctor and staff nurse. Day two - 2nd certifying<br />
assessment and if certified, the surgical termination of pregnancy.<br />
Approximately one third of the women come from Central <strong>Auckland</strong>, one third from<br />
South <strong>Auckland</strong> and the final third from North and West <strong>Auckland</strong>. The percentage of<br />
interpreters required for women accessing the service was 10%.<br />
The service also offers pregnancy option counselling and post op termination<br />
counselling.<br />
Table 72: Number of terminations<br />
Total number of<br />
terminations<br />
Table 73: Number of counselling sessions<br />
2000 2001 2002 2003 2004 <strong>2005</strong><br />
5835 5557 5775 5960 5809 5598<br />
2001 2002 2003 2004 <strong>2005</strong><br />
n n n n n<br />
Post op counselling 51 36 10 22 35<br />
Pregnancy option<br />
counseling<br />
78 90 70 92 89<br />
Declines (%) 2 1.4 1.8 2.6 2.7<br />
Pregnancy Option Counselling refers to an appointment a woman had with a social<br />
worker prior to her assessing appointment.<br />
Declines refer to the number of women who don't meet the legal criteria of abortion as<br />
agreed by 2 certifying consultants.<br />
165
%<br />
45<br />
40<br />
35<br />
30<br />
25<br />
20<br />
15<br />
10<br />
5<br />
0<br />
Chinese<br />
Cook Island<br />
European<br />
Fijian<br />
Indian<br />
Maori<br />
166<br />
Nuiean<br />
Other<br />
Figure 117: Ethnicity of women having a termination in <strong>2005</strong><br />
45<br />
40<br />
35<br />
30<br />
25<br />
20<br />
15<br />
10<br />
5<br />
0<br />
%<br />
Pacific Island<br />
Samoan<br />
< 19 20 – 24 25 – 29 30 – 34 35 –39 40+<br />
Figure 118: Age of women having a termination in <strong>2005</strong><br />
Tongan
section<br />
12<br />
APPENDICES<br />
167
168
APPENDIX 1. METHODOLOGY<br />
1.2 Data cleaning queries<br />
The following is a list of the data cleaning and validation queries which were carried out for the production of<br />
this report.<br />
Antenatal Data<br />
LMC is Other Please Specify, Null or charge midwives, etc.<br />
Check parity if parity is less than parity at previous live birth (although previously parity was defined as 2 for<br />
twins). Check that obstetric history has been completed for women with a gravidity >1.<br />
Homebirths & BBA’s (babies born before arrival at hospital when intended birth in hospital) All checked as<br />
appropriately classified.<br />
BMI (Body Mass Index) Calculated from earliest weight recorded, as weight (kg)/height(m) 2 . If BMI 40, check height and weight.<br />
Previous Caesarean<br />
If indication for caesarean section=repeat caesarean, previous Caesar=yes and parity is > 0.<br />
Medical Conditions: If delivered at NW HDU (High Dependency Unit), any DCC (Department of Critical<br />
Care) or ICU (Intensive Care Unit), then antenatal summary medical conditions is not = missing.<br />
Antenatal Summary - Hypertension Fields Is Null (Eclampsia, Gestational Hypertension, Pre eclampsia,<br />
Other Current Med Surg Cond).<br />
Eclampsia = Yes (Boolean in Antenatal Summary).<br />
Diastolic greater than or equal to 90, but no Hypertension entered in AN Summary fields.<br />
Antenatal Admission: Reason for Admission is Other & Comment Field.<br />
Induction of Labour<br />
If time at ARM is earlier than onset of contraction time, assume this is an induction.<br />
If time at start of Syntocinon is earlier than onset of contraction time, then check this is an induction.<br />
If indication for ARM is induction and time of ARM is before onset of contractions, then induction data are<br />
entered.<br />
If indication for ARM is induction and time of ARM is after onset of contractions, then indication for ARM is<br />
labour augmentation.<br />
If an induction occurred, there is an Induction Indication entered.<br />
Indication for Induction Is Other Please Specify and Comment fields for checking.<br />
Pregnancy/Birth<br />
Patient’s Mother Pregnancy Number on the Baby ID screen does not match the Gravida on the Pregnancy<br />
screen.<br />
Number of fetuses (Pregnancy Screen) does not match Birth Order (Labour & Delivery Baby Screen) i.e. the<br />
number of fetuses does not match the number of babies born.<br />
169
Check ‘Delivered by’ is not missing.<br />
Check that admission to Labour & Birth Suite/Operating Theatre/WAU is before birth time (unless is<br />
recorded as BBA).<br />
If birth location is BBA, then birth time is before admission.<br />
If indication for induction is SROM then rupture of membrane time should be before induction start time<br />
which in turn is before onset of contraction time.<br />
Onset of contraction time is before full dilatation which is in turn before Birth time (sometimes there is no<br />
onset of contraction time because of pre-labour caesarean).<br />
There should be NO onset of contraction time if method of Birth is Elective Caesarean not in labour or<br />
Emergency Caesarean not in labour.<br />
Onset of contraction time should not be missing if method of Birth is Caesarean (elective or emergency) in<br />
labour.<br />
Check all Classical Caesareans to ensure they are authentic.<br />
If Delivery Method is a SVD or Spontaneous Breech Delivery, check there is NO reason for operative<br />
delivery.<br />
Full Dilatation Time should not be null if Delivery Method is a vaginal delivery.<br />
If Delivery Method is 'Elective CS' then Dilatation at Syntocinon should be null.<br />
Syntocinon Time is before Delivery Time.<br />
Membranes Ruptured Time is null.<br />
Membranes ruptured time is before delivery time.<br />
Membrane method is SRM but has indication for ARM, check.<br />
If indication for induction is SRM then rupture of membrane time should be before induction start time which<br />
in turn is before onset of contraction time.<br />
If ARM check there is an indication for ARM.<br />
Placenta Delivery Time is not null.<br />
Delivery Presentation is null.<br />
If had an epidural, then dilatation at last VE is not missing and time of epidural is not missing.<br />
A Caesarean Section (CS) must have an option from the expanded tree to describe what type of CS. Cannot<br />
be just Lower Segment Caesarean Section or Classical Caesarean Section.<br />
If indication for caesarean is breech or malpresentation, then presentation is NOT cephalic.<br />
Delivery Method is anything other than SVD or Spontaneous Breech Delivery, check there is a reason for<br />
Operative Delivery.<br />
If Delivery Presentation is Breech, should not be a Spontaneous Vertex Delivery.<br />
If Indication for Operative Delivery Is Repeat Caesarean Section then Women is not a Primipara & has a CS<br />
in her Obstetric History.<br />
Indication for Operative Delivery Is Other Please Specify + Comment fields - for checking.<br />
170
If indication for operative delivery is fetal distress, then fetal distress variable (in 802) is yes or meconium<br />
was present.<br />
Check Birth Methods fields 1 & 2 are consistent.<br />
Birth time is always before delivery of placenta time.<br />
If Birth method is breech, then presentation is breech.<br />
Time of epidural insertion is before birth time.<br />
If caesarean is mode of birth, anaesthesia is not missing.<br />
If there is postpartum transfusion and blood loss is < 1000 mls, check blood loss.<br />
Blood Loss is not out of range ie: 1500 or is null.<br />
Blood Loss >=1500 & Blood Transfusion = No.<br />
Blood Loss 35 weeks, check birth weight if 44 wks.<br />
If indication for induction is post term, check gestation if gestation is < 40 weeks.<br />
Days in NICU/PIN/Paed care on Ward are not null or check if >30.<br />
Derived Gestation to Neonatal Gestation (Immediate Newborn Assessment screen) >2 weeks difference.<br />
Gestational Age (Immediate Newborn Assessment) Is Null.<br />
Missing Apgars.<br />
Live birth with Apgars 1min or Apgars 5 min of 0.<br />
171
Admissions<br />
HDU (High Dependency Unit) Admission (i.e. Admission Time &/or Admission from) but reason for<br />
Admission Is Null.<br />
Antenatal Admission - Primary Reason for Admission is Null.<br />
Antenatal Assessment - Referral Reason for is Null.<br />
1.3 Derived definitions – maternity<br />
Ethnicity<br />
Table 74: Level 2 prioritisation of ethnicity as outlined in ‘Ministry of <strong>Health</strong>. 2004.<br />
Ethnicity Data Protocols for the <strong>Health</strong> and Disability Sector.’<br />
Priority order Ethnic Group Code Description<br />
1 Māori<br />
2 Tokelauan<br />
3 Fijian<br />
4 Niuean<br />
5 Tongan<br />
6 Cook Island Maori<br />
7 Samoan<br />
8 Other Pacific Island<br />
9 Pacific Island NFD (Not Further Defined)<br />
10 South East Asian<br />
11 Indian<br />
12 Chinese<br />
13 Other Asian<br />
14 Asian NFD<br />
15 Latin American / Hispanic<br />
16 African<br />
17 Middle Eastern<br />
18 Other<br />
19 Other European<br />
20 European NFD<br />
21 NZ European<br />
172
APPENDIX 2. SUMMARY STATISTICS<br />
Table 75: Mode of birth 1998-<strong>2005</strong><br />
1998<br />
n=7531<br />
1999<br />
n=7501<br />
2000<br />
n=7827<br />
2001<br />
n=7654<br />
173<br />
2002<br />
n=7775<br />
2003<br />
n=7611<br />
2004<br />
n=7491<br />
<strong>2005</strong><br />
n=7194<br />
n % n % n % n % n % n % n %<br />
SVB 4670 62 4635 61.8 4650 59.4 4327 55.7 4269 5656.1 4073 54.4 3845 53.4<br />
Vaginal<br />
breech<br />
Operative<br />
vaginal<br />
75 1 83 1.1 87 1.1 66 0.8 58 0.8 54 0.7 54 0.7<br />
926 12.3 945 12.6 1010 12.9 1081 13.9 1065 1414.0 1171 15.6 1022 14.2<br />
Caesarean 1860 24.7 1838 24.5 2080 26.6 2301 29.6 2219 2929.1 2193 29.3 2273 31.6
APPENDIX 3. MATERNAL DEMOGRAPHY<br />
Table 76: Domicile of women giving birth at <strong>National</strong> Women’s 2002-<strong>2005</strong><br />
2002<br />
n=7775<br />
2003<br />
n=7611<br />
174<br />
2004<br />
n=7491<br />
<strong>2005</strong><br />
n=7194<br />
n % n % n % n %<br />
<strong>Auckland</strong> Central 5085 65.4 5007 65.8 5055 67.5 4985 69.3<br />
<strong>Auckland</strong> Waitemata 1180 15.2 1138 15 1068 14.2 982 13.7<br />
<strong>Auckland</strong> South 1408 18.1 1368 18 1240 16.6 1089 15.1<br />
North of <strong>Auckland</strong> 29 0.4 38 0.5 37 0.5 31 0.4<br />
North Island Other 68 0.9 42 0.6 72 1.0 93 1.3<br />
South Island 5 0.1 13 0.2 12 0.2 9 0.1<br />
Overseas 5 0.1 7 0.1 5 0.1<br />
Table 77: Maternal age distribution 2000-<strong>2005</strong><br />
40 yrs<br />
N n % n % n % n % n % n %<br />
2000 7827 431 5.5 1091 13.9 2204 28.2 2670 34.1 1232 15.7 199 2.5<br />
2002 7775 376 4.8 998 12.8 2018 26.0 2816 36.2 1335 17.2 232 3.0<br />
2003 7611 372 4.9 959 12.6 1933 25.4 2738 36.0 1380 18.1 229 3.0<br />
2004 7491 357 4.8 913 12.2 1809 24.1 2781 37.1 1384 18.5 247 3.3<br />
<strong>2005</strong> 7194 330 4.6 828 11.5 1685 23.4 2702 37.6 1395 19.4 254 3.5<br />
Table 78: Maternal age and parity<br />
Total 40 yrs<br />
N n % n % n % n % n % n %<br />
Nullipara 3522 264 7.5 518 14.7 992 28.2 1216 34.5 454 12.9 78 2.2<br />
Multipara 3672 66 1.8 310 8.4 693 18.9 1486 40.5 941 25.6 176 4.8
Table 79: Time trends in Nulliparity and Multiparity (Data for 2001-2003 not available)<br />
1992 1993 1994 1995 1996 1997 1998 1999 2000 2004 <strong>2005</strong><br />
Number of births 8315 8690 8812 9125 9157 8055 7797 7501 7827 7491 7194<br />
Nullipara 3700 3649 3814 4037 4018 3591 3413 3262 3455 3597 3522<br />
% 44.5 42.0 43.3 44.2 43.9 44.6 43.8 43.5 44.1 48.0 49.0<br />
Multipara 4615 5041 4998 5088 5139 4464 4384 4239 4372 3894 3672<br />
% 55.5 58.0 56.7 55.8 56.1 55.4 56.2 56.5 55.9 52.0 51.0<br />
Table 80: Prioritised ethnicity of women giving birth at <strong>National</strong> Women’s<br />
(for information on assigning ethnicity and prioritising ethnicity, see Appendix 1<br />
<strong>2005</strong><br />
n=7194<br />
n %<br />
NZ European 2802 38.9<br />
Chinese 769 10.7<br />
Maori 545 7.6<br />
Indian 545 7.6<br />
Other European 537 7.5<br />
Other 344 4.8<br />
Samoan 339 4.7<br />
Tongan 315 4.4<br />
Other Asian 248 3.5<br />
European NFD 137 1.9<br />
Niuean 111 1.5<br />
Cook Island Maori 107 1.5<br />
African 81 1.1<br />
Middle Eastern 73 1.0<br />
South East Asian 63 0.9<br />
Fijian 62 0.9<br />
Asian NFD 43 0.6<br />
Other Pacific Island 31 0.4<br />
Latin American/ Hispanic 23 0.3<br />
Tokelauan 9 0.1<br />
Pacific Island NFD 8 0.1<br />
Not Stated 3 0.04<br />
175
Table 81: Maternal ethnicity and age<br />
Total NZ European Maori Pacific Asian Indian<br />
176<br />
Other<br />
European<br />
Other<br />
N n % n % n % n % n % n % n %<br />
Total 7194 2802 38.9 545 7.6 981 13.6 1123 15.6 545 7.6 674 9.4 521 7.2<br />
3.1 Lead Maternity Carer and maternal demographic<br />
characteristics<br />
Table 84: LMC at birth<br />
n=7194<br />
n %<br />
Independent Midwife 2996 41.6<br />
Private Obstetrician 1577 21.9<br />
General Practitioner 142 2.0<br />
NW Domino 591 8.2<br />
NW Community 1060 14.7<br />
NW Community/ADAPT 76 1.1<br />
NW Diabetic 212 2.9<br />
NW Medical 351 4.9<br />
Other DHB 131 1.8<br />
Unbooked 58 0.8<br />
Table 85: LMC at birth and maternal age<br />
Total
Table 86: LMC at birth and maternal ethnicity<br />
Total<br />
NZ<br />
European<br />
Maori Pacific Asian Indian<br />
178<br />
Other<br />
European Other<br />
N n % n % n % n % n % n % n %<br />
Total 7194 2802 39.0 545 7.6 981 13.6 1123 15.6 545 7.6 674 9.4 521 7.2<br />
Independent<br />
Midwife<br />
Private<br />
Obstetrician<br />
General<br />
Practitioner<br />
2996 1182 39.5 197 6.6 314 10.5 648 21.6 168 5.6 299 10.0 187 6.2<br />
1577 1032 65.4 34 2.2 19 1.2 105 6.7 53 3.4 228 14.5 106 6.7<br />
142 58 40.9 6 4.2 15 10.6 41 28.9 4 2.8 11 7.8 7 4.9<br />
NW Domino 591 135 22.8 60 10.2 149 25.2 63 10.7 79 13.4 54 9.1 51 8.6<br />
NW Community 1060 131 12.4 105 9.9 311 29.3 189 17.8 165 15.6 39 3.7 118 11.1<br />
NW Community/<br />
ADAPT<br />
76 21 27.6 17 22.4 19 25.0 8 10.5 4 5.3 4 5.3 3 4.0<br />
NW Diabetes 212 35 16.5 21 9.9 60 28.3 30 14.2 42 19.8 10 4.7 14 6.6<br />
NW Medical 351 161 45.9 38 10.8 53 15.1 29 8.3 23 6.6 22 6.3 25 7.1<br />
Other DHB 131 45 34.4 44 33.6 16 12.2 5 3.8 7 5.3 6 4.6 8 6.1<br />
Unbooked 58 2 3.5 23 39.7 25 43.1 5 8.6 0 1 1.7 2 3.5<br />
Table 87: LMC at birth and parity<br />
Total Nullipara Multipara<br />
N n % n %<br />
Total 7194 3522 48.9 3672 51.0<br />
Independent Midwife 2996 1589 53.0 1407 47.0<br />
Private Obstetrician 1577 784 49.7 793 50.3<br />
General Practitioner 142 75 52.8 67 47.2<br />
NW Domino 591 275 46.5 316 53.5<br />
NW Community 1060 432 40.8 628 59.2<br />
NW Community/ADAPT 76 30 39.5 46 60.5<br />
NW Diabetes 212 72 34.0 140 66.0<br />
NW Medical 351 153 43.6 198 56.4<br />
Other DHB 131 85 64.9 46 35.1<br />
Unbooked 58 27 46.6 31 53.5
3.2 Smoking<br />
Table 88: Smoking status and ethnicity<br />
NZ European<br />
n=2802<br />
Maori<br />
n=545<br />
Pacific<br />
n=981<br />
179<br />
Asian<br />
n=1123<br />
Indian<br />
n=545<br />
Other<br />
European<br />
n=674<br />
Other<br />
n=521<br />
n % n % n % n % n % n % n %<br />
Current 164 5.9 204 37.4 160 16.3 10 0.9 8 1.5 27 4.0 19 3.7<br />
Stopped in<br />
pregnancy<br />
Not<br />
currently<br />
smoking<br />
23 0.8 16 2.9 28 2.9 3 0.3 3 0.6 6 0.9 5 1.0<br />
2,482 88.6 275 50.5 731 74.5 1060 94.4 510 93.6 604 89.6 470 90.2<br />
Missing 133 4.8 50 9.2 62 6.3 50 4.5 24 4.4 37 5.5 27 5.2<br />
Table 89: Smoking and age<br />
3.3 Standard primipara<br />
Table 90: Demographic characteristics of standard and non-standard primipara<br />
Total<br />
Standard<br />
primipara<br />
180<br />
Non-standard<br />
primipara<br />
N n % n %<br />
Total 3522 1209 34.3 2313 65.7<br />
Age<br />
< 21 264 42 15.9 222 84.1<br />
21-25 518 232 44.8 286 55.2<br />
26-30 992 452 45.6 540 54.4<br />
31-35 1216 483 39.7 733 60.3<br />
36-40 454 0 454 100.0<br />
41+ 78 0 78 100.0<br />
Ethnicity<br />
NZ European 1419 442 31.1 977 68.9<br />
Maori 230 54 23.5 176 76.5<br />
Pacific 315 88 27.9 227 72.1<br />
Asian 576 288 50.0 288 50.0<br />
Indian 277 118 42.6 159 57.4<br />
Other European 383 118 30.8 265 69.2<br />
Other 321 102 31.8 219 68.2<br />
Not stated 1 0 1 100.0<br />
LMC at Birth<br />
Independent Midwife 1589 658 41.4 931 58.6<br />
Private Obstetrician 784 232 29.6 552 70.4<br />
General Practitioner 75 23 30.7 52 69.3<br />
NW Domino 275 109 39.6 166 60.4<br />
NW Community 432 134 31.0 298 69.0<br />
NW Community/ADAPT 30 8 26.7 22 73.3<br />
NW Diabetic 72 0 0 72 100<br />
NW - Medical 153 27 17.7 126 82.4<br />
Other DHB 85 8 9.4 77 90.6<br />
Unbooked 27 11 40.7 16 59.3
APPENDIX 4. ANTENATAL COMPLICATIONS<br />
4.1 Preterm birth<br />
Table 91: Preterm birth rate and demographic characteristics<br />
Age<br />
Total Total preterm birth Iatrogenic preterm<br />
181<br />
Spontaneous<br />
preterm<br />
N n % n % n %<br />
4.2 SGA<br />
Table 93: Demography of mothers of SGA babies as defined by Customised Birth Centiles<br />
(this table includes mothers of twins twice)<br />
Total<br />
Babies<br />
Customised SGA<br />
40 265 30 11.3 235 88.7 1(0.70-1.43)<br />
Ethnicity<br />
Parity<br />
NZ European 2908 348 12.0 2560 88.0 1<br />
Maori 557 90 16.2 467 83.8 1.35(1.09-1.67)<br />
Pacific 1064 180 16.9 884 83.1 1.41(1.20-1.67)<br />
Asian 1073 133 12.4 940 87.6 1.04(0.86-1.25)<br />
Indian 549 75 13.7 474 86.3 1.14(0.90-1.44)<br />
Other European 695 64 9.2 631 90.8 0.77(0.60-0.99)<br />
Other 535 61 11.4 474 88.6 0.95(0.74-1.23)<br />
Unstated 3 0 0 3 100<br />
Multipara 3769 470 12.5 3299 87.5 1<br />
Primipara 3615 481 13.3 3134 86.7 1.07(0.95-1.20)<br />
Smoker<br />
Current 611 142 23.2 469 76.8 2.06(1.76-2.42)<br />
Stopped in<br />
pregnancy<br />
Not currently<br />
smoking<br />
87 16 18.4 71 81.6 1.63(1.04-2.55)<br />
6281 708 11.3 5573 88.7 1<br />
Unknown 405 85 21.0 320 79.0 1.86(1.52-2.28)<br />
Plurality<br />
Singleton 7007 809 11.6 6198 88.5 1<br />
Twins 368 136 37.0 232 63.0 3.20(2.76-3.71)<br />
Triplets 9 6 66.7 3 33.3 5.77(3.62-9.21)
4.3 Diabetes<br />
Table 94: Women with diabetes attending diabetes clinic and delivering > 20 weeks gestation<br />
1991 1992 1993 1994 1995 1996 1997 1998 1999 2000 2001 2002 2003 2004 <strong>2005</strong><br />
Type I 23 29 19 12 19 15 14 21 26 22 26 21 20 25 31<br />
Type 2 26 19 21 26 32 35 22 23 28 32 37 49 40 47 52<br />
GDM 125 140 197 160 221 245 247 221 181 186 161 251 352 343 304<br />
Total 174 188 237 198 270 295 283 265 235 240 224 321 412 414 387<br />
Table 95: Demographic characteristics of women with diabetes<br />
Age<br />
Type I<br />
n=31<br />
Type 2<br />
n=52<br />
183<br />
GDM<br />
n=304<br />
No diabetes<br />
n=6807<br />
n % n % n % n %<br />
< 20 2 6.5 0 0 5 1.6 323 4.8<br />
21-25 2 6.5 6 11.5 12 3.9 808 11.9<br />
26-30 12 38.7 7 13.5 61 20.0 1605 23.6<br />
31-35 9 29.0 19 36.5 111 36.5 2563 37.7<br />
36-40 5 16.1 15 28.9 93 30.6 1282 18.8<br />
41+ 1 3.2 5 9.6 22 7.2 226 3.3<br />
Ethnicity<br />
NZ European 16 51.6 9 17.3 49 16.2 2728 40.1<br />
Maori 7 22.6 4 7.7 11 3.6 523 7.7<br />
Pacific 1 3.2 22 42.3 63 20.7 895 13.2<br />
Asian 0 4 7.7 82 27.1 1037 15.2<br />
Indian 0 10 19.2 57 18.8 477 7.0<br />
Other European 5 16.1 0 21 6.9 648 9.5<br />
Other 2 6.5 3 5.8 21 6.9 495 7.3<br />
Body weight at booking<br />
Median (IQR) 72.4(61-77.9) 91(72.5-108.3) 77.2(66.6-100.4)
Table 96: Perinatal deaths 1993 – <strong>2005</strong> among babies of women with diabetes<br />
Total number of<br />
perinatal related<br />
losses<br />
Perinatal related<br />
loss rate /1000<br />
births<br />
1993 1994 1995 1996 1997 1998 1999 2000 2001 2002 2003 2004 <strong>2005</strong><br />
3 1 3 6 3 6 1 2 2 3 6 0 2<br />
13 5 11 20 11 21 4 8 9 9 9 0 5<br />
Table 97: Maternal outcomes among women with diabetes<br />
Type I<br />
n=31<br />
Type 2<br />
n=52<br />
184<br />
GDM<br />
n=290<br />
Postnatally<br />
Diagnosed Type 2<br />
n=14<br />
n % n % n % n % n %<br />
No diabetes<br />
n=6807<br />
Induction of labour 13 41.9 32 61.5 153 52.8 8 57.1 1688 24.8<br />
Mode of birth<br />
SVB 6 19.4 18 34.6 141 48.6 9 64.3 3859 53.6<br />
Ventouse 1 3.2 1 1.9 26 9.0 0 693 10.2<br />
Forceps 1 3.2 2 3.9 9 3.1 0 282 4.1<br />
CS emergency 11 35.5 21 40.4 76 26.2 3 21.4 1440 20.0<br />
CS elective 12 38.7 9 17.3 37 12.8 2 14.3 833 11.6<br />
Gestation at birth 3 9.7 3 5.8 3 1.0 0 202 3.0<br />
1000 mls 4 12.9 7 13.5 13 4.5 0 343 5.0<br />
Postpartum transfusion 3 9.7 4 7.7 3 1.0 0 129 1.9
4.4 Antepartum haemorrhage<br />
Table 98: Characteristics of pregnancies complicated by antepartum haemorrhage<br />
Maternal age<br />
Placenta praevia<br />
N=81<br />
185<br />
Placental<br />
abruption<br />
n=41<br />
APH unknown<br />
origin<br />
n=276<br />
No APH<br />
n=6796<br />
n % n % n % n %<br />
Table 100: Fetal/neonatal outcomes of pregnancies complicated by antepartum haemorrhage<br />
Birthweight<br />
Placenta praevia<br />
n=83<br />
186<br />
Placental<br />
abruption<br />
n=42<br />
APH unknown<br />
origin<br />
n=291<br />
No APH<br />
n=6968<br />
n % n % n % n %<br />
Mean (sd) 3085(799) 2535(1008) 2814(978) 3359(674)<br />
4.5 Hypertensive disease<br />
Table 101: Demographic characteristics of women with hypertensive disease<br />
Ethnicity<br />
Gestational<br />
hypertension<br />
187<br />
Preeclampsia<br />
Chronic<br />
hypertension<br />
Normotensive<br />
Total n % n % n % n %<br />
NZ European 2802 186 6.6 124 4.4 68 2.4 2424 86.5<br />
Maori 545 32 5.9 20 3.7 18 3.3 475 87.2<br />
Pacific 981 53 5.4 46 4.4 27 2.8 855 87.2<br />
Asian 1123 36 3.2 20 1.8 12 1.1 1055 93.9<br />
Indian 545 35 6.4 23 4.2 8 1.5 479 87.9<br />
Other European 674 53 7.9 26 3.9 18 2.7 577 85.6<br />
Other 521 26 5.0 16 3.1 12 2.3 467 89.6<br />
Not stated 3 0 0 0 3 100<br />
Maternal age<br />
APPENDIX 5. LABOUR AND BIRTH<br />
6.1 Induction of labour<br />
Table 103: Induction of labour rates (1992-<strong>2005</strong>) No data available on induction rates for 2001-<br />
2003<br />
1992 1993 1994 1995 1996 1997 1998 1999 2000 2004 <strong>2005</strong><br />
Total Births 8315 8690 8812 9125 9157 8055 7531 7501 7827 7491 7194<br />
Women Induced 1734 2049 2033 2366 2225 2135 2053 2040 2106 1922 1894<br />
Incidence (%) 20.9 23.6 23.1 25.9 24.3 26.5 27.2 27.2 26.9 25.7 26.3<br />
Total Nullipara 3700 3649 3814 4037 4018 3591 3263 3262 3455 3597 3522<br />
Nullipara Induced 914 931 1046 1191 1112 1104 992 923 1049 1064 1042<br />
Incidence (%) 24.7 25.5 27.4 29.5 27.7 30.7 30.4 28.3 30.4 29.6 29.5<br />
Total Multipara 4615 5041 4998 4088 5139 4464 4229 4239 4372 3894 3672<br />
Multipara Induced 820 1118 987 1175 1113 1031 1061 987 1057 858 852<br />
Incidence (%) 17.8 22.2 19.7 28.7 21.7 23.1 25.1 23.3 24.2 22.0 23.2<br />
Table 104: Indication for induction (all births)<br />
Preterm<br />
Term<br />
n= 685<br />
n=6509<br />
n % n %<br />
Post dates 0 0.0 445 6.8<br />
Hypertension 27 0.4 255 3.9<br />
Term PROM 0 0.0 210 3.2<br />
Diabetes 2 0.03 155 2.4<br />
Maternal request 1 0.01 131 2.0<br />
SGA 15 0.2 121 1.9<br />
Maternal medical<br />
complications<br />
11 0.2 86 1.3<br />
Decreased liquor 2 0.03 67 1.0<br />
PPROM 48 0.7 41 0.6<br />
IUD/Fetal anomaly 35 0.5 14 0.2<br />
Fetal distress 2 0.03 37 0.6<br />
Not in established labour 2 0.03 36 0.6<br />
Poor obstetric history 1 0.01 22 0.3<br />
Large for gestational age 0 0.0 22 0.3<br />
Maternal age 1 0.01 19 0.3<br />
Other 14 0.2 72 1.1<br />
188
Table 105: Rates of indication for induction by parity (term births)<br />
Multipara<br />
Nullipara<br />
n=3362<br />
n=3147<br />
n % n %<br />
Post dates 173 5.1 272 8.6<br />
Hypertension 77 2.3 178 5.7<br />
Term PROM 70 2.1 140 4.4<br />
SGA 47 1.4 74 2.4<br />
Diabetes 96 2.9 59 1.9<br />
Maternal request 84 2.5 47 1.5<br />
Maternal medical<br />
complications 49 1.5 37 1.2<br />
Decreased liquor 33 1.0 34 1.1<br />
PPROM 10 0.3 31 1.0<br />
Fetal distress 15 0.4 22 0.7<br />
Not in established labour 23 0.7 13 0.4<br />
IUD/Fetal anomaly 7 0.2 7 0.2<br />
Maternal age 12 0.4 7 0.2<br />
Large for gestational age 18 0.5 4 0.1<br />
Poor obstetric history 18 0.5 4 0.1<br />
Other 49 1.5 23 0.7<br />
Table 106: Rates of indication for induction by age among nulliparous women (all<br />
gestations)<br />
35<br />
n=542<br />
n % n % n % n %<br />
Post dates 43 5.5 73 7.4 110 9.0 46 8.5<br />
Hypertension 35 4.5 51 5.1 69 5.7 42 7.7<br />
Term PROM 27 3.5 42 4.2 54 4.4 17 3.1<br />
SGA 21 2.7 19 1.9 23 1.9 20 3.7<br />
Diabetes 7 0.9 23 2.3 18 1.5 13 2.4<br />
Maternal request 4 0.5 4 0.4 11 0.9 28 5.2<br />
Other 56 7.2 63 6.4 81 6.7 42 7.7
Table 107: Demography of onset of birth at term<br />
Total<br />
Spontaneous<br />
labour<br />
190<br />
Induction<br />
CS<br />
elective<br />
CS<br />
emergency<br />
before labour<br />
N n % n % n % n %<br />
Total 6509 3923 60.0 1733 26.7 757 11.6 96 1.5<br />
LMC at birth<br />
IMW 2838 2069 73.0 604 21.3 141 5.0 24 0.9<br />
Private<br />
Obstetrician<br />
1424 556 39.0 467 32.8 358 25.1<br />
43 3.0<br />
GP 132 80 60.6 37 28.0 13 9.9 2 1.5<br />
NW Community 978 580 59.3 256 26.2 123 12.6 19 1.9<br />
ADAPT 63 42 66.7 10 15.9 11 17.5 0 0<br />
NW Domino 559 408 73.0 124 22.2 24 4.3 3 0.5<br />
NW Medical 267 99 37.1 113 42.3 52 19.5 3 1.1<br />
NW Diabetes 183 36 19.8 115 62.8 30 16.4 2 1.1<br />
Unbooked 38 36 94.7 1 2.8 1 2.8 0 0<br />
Other DHB 27 17 63.0 6 22.2 4 14.8 0 0<br />
Maternal age<br />
Ethnicity<br />
< 20 281 215 76.5 60 21.4 6 2.1 0 0<br />
21-25 745 541 72.6 174 23.4 27 3.6 3 0.4<br />
26-30 1523 1002 65.8 383 25.1 121 7.9 17 1.1<br />
31-35 2481 1508 60.8 628 25.3 302 12.2 43 1.7<br />
36-40 1256 593 47.2 398 31.7 238 18.9 27 2.2<br />
41+ 223 64 28.7 90 40.4 63 28.2 6 2.7<br />
NZ European 2529 1361 53.8 738 29.2 390 15.4 40 1.6<br />
Māori 454 305 67.2 112 24.7 32 7.1 5 1.1<br />
Pacific 885 604 68.3 222 25.1 52 5.9 7 0.8<br />
Asian 1050 735 70.0 207 19.7 99 9.4 9 0.9<br />
Indian 498 299 60.0 130 26.1 54 10.8 15 3.0<br />
Other European 619 328 53.0 188 30.4 89 14.4 14 2.3<br />
Other 471 289 61.4 136 28.9 40 8.5 6 1.3<br />
Not stated 3 2 66.7 0 0 1 33.3 0 0
Table 108: Induction rate by indication and ethnicity among nulliparous women (all gestations)<br />
NZ<br />
European<br />
n=1419<br />
Maori<br />
n=230<br />
Pacific<br />
n=315<br />
191<br />
Asian<br />
n=576<br />
Indian<br />
n=277<br />
Other<br />
European<br />
n=383<br />
Other<br />
n=321<br />
n % n % n % n % n % n % n %<br />
Total 467 32.9 60 26.1 88 27.9 132 22.9 89 32.1 113 29.5 93 29.0<br />
Post dates 122 8.6 15 6.5 19 6.0 32 5.6 15 5.4 39 10.2 30 9.3<br />
Hypertension 106 7.5 15 6.5 15 4.8 10 1.7 15 5.4 23 6.0 13 4.0<br />
Term PROM 50 3.5 7 3.0 15 4.8 27 4.7 16 5.8 14 3.7 11 3.4<br />
PPROM 33 2.3 4 1.7 4 1.3 5 0.9 4 1.4 3 0.8 2 0.6<br />
SGA 27 1.9 3 1.3 8 2.6 20 3.5 11 4.0 7 1.8 7 2.2<br />
Maternal request 26 1.8 1 0.4 2 0.6 5 0.9 1 0.4 7 1.8 5 1.6<br />
Diabetes 23 1.6 4 1.7 8 2.6 8 1.4 11 4.0 3 0.8 4 1.2<br />
Maternal medical<br />
complications<br />
21 1.5 1 0.4 3 1.0 5 0.9 3 1.1 5 1.3 7 2.2<br />
Decreased liquor 14 1.0 0 0.0 3 1.0 6 1.0 4 1.4 6 1.6 2 0.6<br />
Fetal distress 10 0.7 0 0.0 1 0.3 4 0.7 3 1.1 1 0.3 4 1.2<br />
IUD/Fetal anomaly 11 0.8 5 2.2 4 1.3 4 0.7 0 0.0 0 0.0 0 0.0<br />
Not in established<br />
labour<br />
5 0.4 1 0.4 2 0.6 1 0.2 0 0.0 1 0.3 4 1.2<br />
Maternal age 4 0.3 0 0.0 0 0.0 0 0.0 0 0.0 2 0.5 1 0.3<br />
Poor obstetric<br />
history<br />
3 0.2 1 0.4 0 0.0 0 0.0 0 0.0 0 0.0 0 0.0<br />
Large for<br />
gestational age<br />
2 0.1 0 0.0 0 0.0 1 0.2 0 0.0 0 0.0 1 0.3<br />
Other 10 0.7 3 1.3 4 1.3 4 0.7 6 2.2 2 0.5 2 0.6<br />
Table 109: Induction rate by indication and age among nulliparous women (all gestations)<br />
≤20<br />
n=264<br />
21-25<br />
n=518<br />
26-30<br />
n=992<br />
31-35<br />
n=1216<br />
36-40<br />
n=464<br />
41+<br />
n=78<br />
n % n % n % n % n % n %<br />
Total 58 22.0 135 26.1 275 27.7 366 30.1 176 38.8 32 41.0<br />
Post dates 13 4.9 30 5.2 73 7.4 110 9.0 44 9.5 2 2.6<br />
Hypertension 12 4.5 23 4.0 51 5.1 69 5.7 37 8.0 5 6.4<br />
Term PROM 10 3.8 17 2.9 42 4.2 54 4.4 12 2.6 5 6.4<br />
SGA 4 1.5 17 2.9 19 1.9 23 1.9 17 3.7 3 3.8<br />
Diabetes 2 0.8 5 0.9 23 2.3 18 1.5 12 2.6 1 1.3<br />
Maternal request 0 0.0 4 0.7 4 0.4 11 0.9 17 3.7 11 14.1<br />
PPROM 2 0.8 7 1.2 19 1.9 21 1.7 6 1.3 0 0.0<br />
Maternal medical<br />
complications<br />
4 1.5 10 1.7 6 0.6 18 1.5 6 1.3 1 1.3<br />
Decreased liquor 2 0.8 3 0.5 11 1.1 13 1.1 6 1.3 0 0.0<br />
Fetal distress 1 0.4 3 0.5 8 0.8 8 0.7 2 0.4 1 1.3<br />
IUD/Fetal anomaly 3 1.1 8 1.4 5 0.5 3 0.2 5 1.1 0 0.0<br />
Large for gestational age 0 0.0 1 0.2 2 0.2 1 0.1 0 0.0 0 0.0<br />
Maternal age 0 0.0 0 0.0 0 0.0 0 0.0 6 1.3 1 1.3<br />
Not in established labour 1 0.4 3 0.5 3 0.3 5 0.4 2 0.4 0 0.0<br />
Poor obstetric history 0 0.0 0 0.0 0 0.0 3 0.2 1 0.2 0 0.0<br />
Other 4 1.5 4 0.7 9 0.9 9 0.7 3 0.6 2 2.6
Mode of birth<br />
6.2 Outcomes following induction<br />
Table 110: Mode of birth at term by onset of birth and parity<br />
Spontaneous<br />
labour<br />
n=1935<br />
Nullipara Multipara<br />
192<br />
Induced<br />
labour<br />
n=952<br />
Spontaneous<br />
labour<br />
n=1988<br />
Induced<br />
labour<br />
n=781<br />
n % n % n % n %<br />
Mode of birth<br />
SVB + vaginal breech 1027 53.1 353 37.1 1612 81.1 593 75.9<br />
Forceps 139 7.2 86 9.0 30 1.5 18 2.3<br />
Ventouse 369 19.1 178 18.7 107 5.4 46 5.9<br />
CS emergency 400 20.7 335 35.2 239 12.0 124 15.9<br />
Epidural 1255 64.9 801 84.1 702 35.3 475 60.8<br />
Table 111: Mode of birth at term among nulliparous women by most common indications<br />
for induction<br />
Post dates Term PROM Hypertension Other<br />
n=272 n=140 n=178 n=362<br />
n % n % n % n %<br />
Mode of birth<br />
SVB + vaginal breech 101 37.1 58 41.4 53 29.8 141 39.0<br />
Forceps 26 9.6 9 6.4 15 8.4 36 9.9<br />
Ventouse 50 18.4 25 17.9 36 20.2 67 18.5<br />
CS emergency 95 34.9 48 34.3 74 41.6 118 32.6<br />
Epidural 218 80.1 117 83.6 159 89.3 307 84.8<br />
Table 112: Mode of birth at term among multiparous women by most common indications for<br />
induction<br />
Post dates<br />
n=173<br />
Diabetes<br />
n=96<br />
Maternal<br />
request<br />
n=84<br />
Term PROM<br />
n=70<br />
Hypertension<br />
n=78<br />
Other<br />
n= 281<br />
n % n % n % n % n % n %<br />
SVB 134 77.5 72 75.0 65 77.4 57 81.4 49 63.6 211 75.1<br />
Vaginal breech 0 0.0 1 1.0 2 2.4 0 0.0 0 0.0 2 0.7<br />
Forceps 5 2.9 0 0.0 2 2.4 1 1.4 2 2.6 8 2.9<br />
Ventouse 9 5.2 2 2.1 7 8.3 2 2.9 8 10.4 18 6.4<br />
CS emergency 25 14.5 21 21.9 8 9.5 10 14.3 18 23.4 42 15.0<br />
Epidural 88 18.5 41 8.6 61 12.8 46 9.7 55 11.6 184 65.5
Table 113: Gestation at birth among women whose primary indication for induction was ‘post<br />
dates’<br />
Gestation at birth<br />
Induction for post<br />
dates<br />
n=445<br />
Induction for post dates<br />
and age 35<br />
n=129<br />
n % n % n %<br />
39 – 39 6 2 0.5 2 0.6 0<br />
40 – 40 6 97 21.8 50 15.8 47 36.4<br />
41 – 41 6 258 58.0 192 60.8 66 51.2<br />
42 – 42 6 83 18.7 67 21.2 16 12.4<br />
43 – 43 6 5 1.1 5 1.6 0<br />
6.3 Use of Syntocinon<br />
Table 114: Dilatation at start of syntocinon in induced and spontaneous labour-nullipara<br />
Induced n=708<br />
Spontaneous onset<br />
n=945<br />
n % n %<br />
0 36 5.1 7 0.7<br />
1 121 17.1 45 4.8<br />
2 203 28.7 129 13.7<br />
3 172 24.3 186 19.7<br />
4 60 8.5 149 15.8<br />
5 23 3.2 98 10.4<br />
6 14 2.0 72 7.6<br />
7 7 1.0 47 5.0<br />
8 7 1.0 58 6.1<br />
9 12 1.7 45 4.8<br />
10 25 3.5 68 7.2<br />
Missing 28 4.0 41 4.3<br />
Table 115: Dilatation at start of syntocinon in induced and spontaneous labour-multipara<br />
Induced<br />
Spontaneous<br />
n=472<br />
n=338<br />
n % n %<br />
0 16 3.4 2 0.6<br />
1 50 10.6 12 3.6<br />
2 154 32.6 54 16.0<br />
3 152 32.2 71 21.0<br />
4 44 9.3 74 21.9<br />
5 13 2.8 39 11.5<br />
6 6 1.3 17 5.0<br />
7 3 0.6 8 2.4<br />
8 5 1.1 20 5.9<br />
9 4 0.8 6 1.8<br />
10 4 0.8 25 7.4<br />
Missing 21 4.4 10 3.0
6.4 Mode of birth<br />
Table 116: Mode of birth by parity and previous caesarean section status<br />
Nullipara<br />
preterm<br />
n=375<br />
Nullipara<br />
term<br />
n=3147<br />
194<br />
Multipara<br />
no prev CS<br />
preterm<br />
n=221<br />
Multipara<br />
no prev CS<br />
term<br />
n=2400<br />
Multipara<br />
prev CS<br />
preterm<br />
n=89<br />
Multipara<br />
prev CS<br />
term<br />
n=962<br />
n % n % n % n % n % n %<br />
SVB 136 36.3 1378 43.8 111 50.2 2008 83.7 23 25.8 189 19.7<br />
Vaginal breech 19 5.1 2 21 9.5 8 0.3 4 4.5 0<br />
Operative vaginal<br />
birth<br />
37 9.92 772 26.4 8 3.6 132 5.5 4 4.5 69 7.2<br />
Ventouse 21 5.6 547 17.4 4 1.8 99 4.1 3 3.4 54 5.6<br />
Forceps 16 4.3 225 9 4 1.8 33 1.4 1 1.1 15 1.6<br />
Caesarean section 183 48.8 995 31.6 81 36.7 252 10.5 58 65.2 704 73<br />
Emergency 149 39.7 780 24.8 62 28.1 178 7.4 35 39.3 236 24.5<br />
Elective 34 9.1 215 6.8 19 8.6 74 3.1 23 25.8 468 48.7<br />
Table 117: Mode of birth by ethnicity<br />
NZ<br />
European<br />
n=2802<br />
Maori<br />
n=545<br />
Pacific<br />
n=981<br />
Asian<br />
n=1123<br />
Indian<br />
n=545<br />
Other<br />
European<br />
n=674<br />
Other<br />
n=521<br />
n % n % n % n % n % n % n %<br />
SVB 1368 48.8 343 62.9 688 70.1 615 54.8 260 47.7 300 44.5 269 51.6<br />
Vaginal breech 19 0.7 7 1.3 12 1.2 3 0.3 5 0.9 3 0.5 5 1.0<br />
Forceps 145 5.2 14 2.6 11 1.1 31 2.8 22 4.0 44 6.5 27 5.2<br />
Ventouse 284 10.1 43 7.9 45 4.6 158 14.1 47 8.6 88 13.1 63 12.1<br />
CS elective 429 15.3 40 7.3 62 6.3 107 9.5 58 10.6 94 14.0 43 8.3<br />
CS emergency 557 19.9 98 18.0 163 16.6 209 18.6 153 28.1 145 21.5 114 21.8<br />
Table 118: Mode of birth by maternal age<br />
Table 119: Mode of birth by LMC at time of birth – nullipara<br />
Total SVB<br />
Vaginal<br />
breech<br />
195<br />
Operative<br />
vaginal<br />
CS elective<br />
CS<br />
emergency<br />
n n % n % n % n % n %<br />
Total 3522 1535 43.6 21 6.0 809 23.0 249 7.1 929 26.4<br />
IMW 1589 744 46.8 5 0.3 403 25.4 51 3.2 386 24.3<br />
Pvt Obstetrician 784 214 27.3 2 0.3 192 24.5 137 17.5 239 30.5<br />
GP 75 34 45.3 0 17 22.7 3 4.0 21 28.0<br />
NW Domino 275 161 58.5 0 53 19.3 9 3.3 52 18.9<br />
NW Community 432 206 47.8 2 0.5 86 19.9 20 4.6 118 27.3<br />
NW Community/ADAPT 30 16 53.3 0 5 16.7 2 6.7 7 23.3<br />
NW Diabetes 72 23 31.9 0 17 23.6 6 8.3 26 36.1<br />
NW Medical 153 57 37.2 4 2.6 34 22.2 14 9.2 44 28.8<br />
Other DHB 85 35 41.2 8 9.4 1 1.2 7 8.3 34 40.0<br />
Unbooked 27 24 88.9 0 1 3.7 0 2 7.4<br />
Table 120: Mode of birth by LMC at time of birth – standard primipara (Definition of standard<br />
primipara is given in Chapter 1)<br />
Total SVB<br />
Operative<br />
vaginal<br />
CS elective<br />
CS<br />
emergency<br />
n n % n % n % n %<br />
Total 1210 647 53.5 303 25.0 41 3.4 219 18.0<br />
IMW 658 373 56.7 167 25.4 5 0.8 113 17.2<br />
Pvt Obstetrician 232 75 32.3 74 31.9 33 14.2 50 21.6<br />
GP 23 13 56.5 5 21.7 0 5 21.7<br />
NW Domino 109 70 64.2 22 20.2 0 17 15.6<br />
NW Community 134 83 61.9 24 17.9 0 27 20.2<br />
NW Community/ADAPT 8 6 75.0 1 12.5 0 1 12.5<br />
NW Diabetes 0<br />
NW Medical 27 11 40.7 9 33.3 2 7.4 5 18.5<br />
Other DHB 8 7 87.5 0 1 12.5 0<br />
Unbooked 11 9 81.8 1 9.1 0 1 9.1
Table 121: Mode of birth by LMC at time of birth – multipara<br />
Total SVB<br />
196<br />
Vaginal<br />
breech<br />
Operative<br />
vaginal<br />
CS elective<br />
CS<br />
emergency<br />
n n % n % n % n % n %<br />
Total 3672 2331 63.5 33 0.9 213 5.8 584 15.9 511 13.9<br />
IMW 1407 1048 74.5 11 0.8 80 5.7 100 7.1 168 11.9<br />
Pvt Obstetrician 793 373 47.0 9 1.1 65 8.2 250 31.5 96 12.1<br />
GP 67 51 76.1 0 0 2 3.0 10 14.9 4 6.0<br />
NW Domino 316 253 80.1 0 0 13 4.1 16 5.1 34 10.8<br />
NW Community 628 370 58.9 5 0.8 25 4.0 111 17.7 117 18.6<br />
NW Community/ADAPT 46 28 6.1 0 1 2.2 10 21.7 7 15.2<br />
NW Diabetes 140 67 47.9 2 1.4 5 3.6 32 22.9 34 24.3<br />
NW Medical 198 94 47.5 2 1.0 20 10.0 48 24.2 34 17.2<br />
Other DHB 46 20 43.5 1 2.2 2 4.4 6 13.0 17 37.0<br />
Unbooked 31 27 87.1 3 9.7 0 1 3.2 0<br />
6.5 Operative births<br />
Table 122: Indication for caesarean section by parity and gestation<br />
Nullipara<br />
preterm<br />
n=183<br />
Nullipara<br />
term<br />
n=995<br />
Multipara<br />
preterm<br />
n=139<br />
Multipara<br />
term<br />
n=956<br />
Total<br />
n=2273<br />
n % n % n % n % n %<br />
Failure to progress 14 7.7 430 43.2 6 4.3 186 19.5 636 28.0<br />
Repeat caesarean NA NA NA NA 21 15.1 400 41.8 421 18.5<br />
Fetal distress 53 29.0 212 21.3 31 22.3 88 9.2 384 16.9<br />
Malpresentation 31 16.9 134 13.6 23 16.6 82 8.6 270 11.9<br />
Obstetric history 5 2.7 36 3.6 10 7.2 85 8.9 136 6.0<br />
Maternal request 1 0.6 57 5.7 3 2.2 33 3.5 94 4.1<br />
APH / abruption 14 7.7 27 2.7 17 12.2 20 2.1 78 3.4<br />
Hypertension 37 20.2 15 1.5 10 7.2 7 0.7 69 3.0<br />
Disproportion 1 0.6 29 2.9 1 0.7 17 1.8 48 2.1<br />
Diabetes 3 1.6 5 0.5 2 1.4 8 0.8 18 0.8<br />
Failed induction 1 0.5 9 0.9 0 5 0.5 15 0.7<br />
Maternal distress 3 1.6 4 0.3 0 3 0.3 10 0.4<br />
Cord<br />
prolapse/presentation<br />
1 0.6 0 3 2.2 8 0.8 12 0.5<br />
Other 19 10.4 37 3.7 12 8.6 14 1.5 82 3.6
Total births<br />
(mothers)<br />
Total operative<br />
vaginal births<br />
Table 123: Indication for caesarean section at term by parity and type of caesarean section<br />
Nullipara<br />
CS elective<br />
n=215<br />
Nullipara CS<br />
emergency<br />
n=780<br />
197<br />
Multipara<br />
CS elective<br />
n=542<br />
Multipara CS<br />
emergency<br />
n=414<br />
Total<br />
n=1951<br />
n % n % n % n % n %<br />
Failure to progress 1 0.5 429 55.0 5 0.9 181 43.7 616 31.5<br />
Repeat caesarean NA NA NA NA 353 65.1 47 11.4 400 20.5<br />
Fetal distress 0 212 27.2 3 0.6 85 20.5 300 15.4<br />
Malpresentation 82 38.1 52 6.7 42 7.8 40 9.7 216 11.1<br />
Obstetric history 26 12.1 10 1.3 72 13.3 13 3.1 121 6.2<br />
Maternal request 53 24.7 4 0.6 28 5.2 5 1.2 90 4.6<br />
APH / abruption 8 3.7 19 2.4 10 1.9 10 2.4 47 2.4<br />
Disproportion 9 4.2 20 2.6 6 1.1 11 2.7 46 2.4<br />
Hypertension 2 0.9 13 1.7 4 0.7 3 0.7 22 1.1<br />
Failed Induction 0 9 1.1 0 5 1.2 14 0.7<br />
Diabetes 4 1.9 1 0.1 7 1.3 1 0.2 13 0.6<br />
Cord prolapse 0 0 2 0.4 6 1.5 8 0.4<br />
Maternal distress 2 0.9 2 0.3 2 0.4 1 0.2 7 0.4<br />
Maternal age 5 2.3 0 2 0.4 0 7 0.4<br />
Abnormal PH 0 0 2 0.3 0 0 0 0 2 0.1<br />
Other 23 10.9 7 0.9 6 1.1 6 1.4 42 2.2<br />
Table 124: Operative vaginal birth rates<br />
1992 1993 1994 1995 1996 1997 1998 1999 2000 2001 2002 2003 2004 <strong>2005</strong><br />
8315 8690 8812 9125 9157 8055 7531 7501 7827 7471 7775 7611 7491 7194<br />
1039 1070 1190 1120 1156 1051 925 949 1006 1081 1065 1171 1022<br />
Incidence % 12.5 12.3 13.5 12.3 12.6 13.0 12.3 12.7 12.9 13.9 14.0 15.6 14.2<br />
Total nullipara 3700 3649 3814 4037 4018 3591 3263 3262 3455 3597 3522<br />
Operative vaginal<br />
births<br />
Nulliparous<br />
operative vaginal<br />
birth rate (%)<br />
820 70 893 850 895 776 704 722 733 875 809<br />
21.2 19.0 22.8 21.1 22.2 21.6 21.6 22.1 21.2 24.3 23.0<br />
Total multipara 4615 5041 4998 5088 5139 4464 4229 4238 4372 3894 3672<br />
Operative vaginal<br />
births<br />
Multiparous<br />
operative vaginal<br />
birth rate (%)<br />
219 370 297 270 261 275 221 227 273 296 213<br />
4.7 7.3 5.9 5.3 5.1 6.2 5.2 5.4 6.2 7.6 5.8<br />
Table 125: Type of operative vaginal birth: 1992-<strong>2005</strong>
1992 1993 1994 1995 1996 1997 1998 1999 2000 2001 2002 2003 2004 <strong>2005</strong><br />
Total births 8315 8690 8812 9125 9157 8055 7531 7501 7827 7471 7755 7611 7491 7194<br />
Total operative<br />
vaginal births<br />
1039 1070 1190 1120 1156 1051 925 949 1006 1081 1065 1171 1022<br />
% of all births 12.5 12.3 13.5 12.3 12.6 13.0 12.3 12.7 12.9 13.9 14.0 15.6 14.2<br />
Total forceps<br />
alone<br />
854 883 795 739 590 464 439 435 391 352 323 292<br />
% of all births 10.3 10.2 8.7 8.1 7.3 6.2 5.9 5.6 5.0 4.6 4.3 4.1<br />
Kiellands<br />
forceps<br />
131 123 112 83 73 41 33 21 36 22<br />
% of all births 1.6 1.5 1.2 0.9 0.9 0.5 0.4 0.3 0.5 0.3<br />
Other forceps 723 760 683 656 517 423 406 414 287 270<br />
% of all births 8.7 8.7 7.5 7.2 6.4 5.6 5.4 5.3 3.8 3.8<br />
Ventouse or<br />
forceps<br />
/ventouse<br />
185 185 325 417 461 461 510 571 690 713 848 962<br />
% of all births 2.2 2.1 3.6 4.6 5.7 6.1 6.8 7.3 8.9 9.4 11.3 13.4<br />
Ventouse<br />
alone<br />
198<br />
436 516 771 651<br />
% of all births 5.8 6.6 10.3 9.0<br />
Forceps/<br />
ventouse<br />
74 55 77 60<br />
% of all births 1.0 0.7 1.0 0.8<br />
Table 126: Mode of birth by ethnicity – nullipara<br />
NZ<br />
European<br />
SVB<br />
Vaginal<br />
breech<br />
Operative<br />
forceps<br />
Operative<br />
ventouse<br />
CS elective<br />
CS<br />
emergency<br />
N n % n % n % n % n % n %<br />
1420 547 38.5 6 0.4 118 8.3 218 15.4 128 9.0 403 28.4<br />
Maori 230 123 53.5 5 2.2 8 3.5 31 13.5 7 3.0 56 24.4<br />
Pacific 347 205 59.1 4 1.2 9 2.6 41 11.1 14 4.0 74 21.3<br />
Asian 543 256 47.2 0 25 4.6 117 21.6 22 4.1 123 22.7<br />
Indian 277 107 38.6 1 0.4 21 7.6 38 13.7 17 6.1 93 33.6<br />
Other<br />
European<br />
383 137 35.8 1 0.3 35 9.1 67 17.5 39 10.2 104 27.2<br />
Other 321 139 43.3 3 0.9 25 7.8 56 17.5 22 6.9 76 23.7<br />
Table 127: Mode of birth by ethnicity - multipara
NZ<br />
European<br />
SVB<br />
Vaginal<br />
breech<br />
199<br />
Operative<br />
forceps<br />
Operative<br />
ventouse<br />
CS<br />
elective<br />
CS<br />
emergency<br />
N n % n % n % n % n % n %<br />
1383 821 59.5 13 0.9 27 2.0 66 4.8 301 21.8 154 11.1<br />
Maori 315 220 69.8 2 0.6 6 1.9 12 3.8 33 10.5 42 13.3<br />
Pacific 666 493 74.0 7 1.1 4 0.6 10 1.5 53 8.0 99 14.9<br />
Asian 547 349 63.8 3 0.6 4 0.7 35 6.4 80 14.6 76 13.9<br />
Indian 268 153 57.1 4 1.5 1 0.4 9 3.4 41 15.3 60 22.4<br />
Other<br />
European<br />
291 163 56.0 2 0.7 9 3.1 21 7.2 55 18.9 41 14.1<br />
Other 200 130 65.0 2 1.0 2 1.0 7 3.5 21 10.5 38 19.0<br />
Table 128: Breech birth 1995-<strong>2005</strong><br />
1995 1996 1997 1998 1999 2000 2001 2002 2003 2004 <strong>2005</strong><br />
Total nos of babies born 9516 9612 8270 7721 7679 8054 7654 7988 7804 7679 7384<br />
Total breech births 535 479 434 400 440 484 421 432<br />
Percent of total births 5.6 5.0 5.2 5.2 5.7 6.0 5.5 5.9<br />
Total singleton babies 7329 7609 7303 7007<br />
Total singleton breech<br />
births<br />
Percent of singleton<br />
births<br />
Total multiple birth<br />
babies<br />
Total multiple breech<br />
births<br />
Percent of multiple birth<br />
babies<br />
Table 129: Mode of birth by type of breech (singletons only)<br />
Extended leg<br />
n=177<br />
Flexed leg<br />
n=89<br />
Unspecified<br />
n=62<br />
Total breech<br />
n= 328<br />
n % n % n % n %<br />
Vaginal breech 19 10.7 11 12.4 9 14.5 39 11.9<br />
Caesarean section 158 89.3 78 87.6 53 85.5 289 88.1<br />
CS emergency 83 46.9 42 47.2 23 37.1 148 45.1<br />
CS elective 75 42.4 36 40.4 30 48.4 141 43.0<br />
Table 130: Mode of birth by type of breech (multiples only)<br />
341 363 318 328<br />
4.7 4.8 4.4 4.7<br />
350 445 376 377<br />
99 121 103 104<br />
28.3 27.2 27.4 27.6
Spontaneous breech<br />
birth<br />
Extended leg<br />
n=31<br />
Flexed leg<br />
n=33<br />
200<br />
Unspecified<br />
n=40<br />
Total breech<br />
n= 104<br />
n % n % n % n %<br />
5 15.6 9 27.3 4 10.0 18 17.1<br />
Caesarean section 26 83.9 24 72.7 36 90.0 86 82.7<br />
CS emergency 20 64.5 7 21.2 17 42.5 44 41.9<br />
CS elective 6 19.4 17 51.5 19 47.5 42 40.4<br />
6.6 Analgesia/anaesthesia<br />
Table 131: Epidural use among women with spontaneous and induced labour rates (2000-<br />
<strong>2005</strong>)<br />
2000 2001 2002 2003 2004 <strong>2005</strong><br />
Number of births 7827 7491 7194<br />
Number women with spontaneous labour 4820 4817 4246<br />
Spontaneous labour and epidural 2143 2434 2138<br />
% 44.5 50.5 50.4<br />
Number of women with induced labour 2002 1922 1894<br />
Induced labour and epidural 1313 1412 1373<br />
% 65.6 73.5 72.5<br />
Table 132: Analgesic use and maternal age (among nulliparous spontaneous and induced<br />
labours)<br />
Maternal<br />
age (years)<br />
Total Epidural Entonox Pethidine TENS Water<br />
N n % n % n % n % n %<br />
LMC type<br />
Total Epidural Entonox Pethidine TENS Water<br />
n n % n % n % n % n %<br />
IMW 1516 1032 68.1 673 44.4 372 24.5 46 3.0 211 13.9<br />
Pvt Obstetrician 601 521 86.7 225 37.4 59 9.8 11 1.8 55 9.2<br />
GP 70 53 75.7 37 52.9 18 25.7 2 2.9 10 14.3<br />
NW Domino 265 152 57.4 159 60.0 71 26.8 5 1.9 62 23.4<br />
NW Community 399 261 65.4 241 60.4 140 35.1 4 1.0 27 6.8<br />
NW Community/ADAPT 26 13 50.0 15 57.7 8 30.8 2 7.7 0 0<br />
NW Diabetes 62 46 74.2 29 46.8 18 29.0 2 3.2 1 1.6<br />
NW Medical 130 92 70.8 61 46.9 29 22.3 0 0 8 6.2<br />
Other DHB 59 25 42.4 22 37.3 21 35.6 0 0 1 1.7<br />
Unbooked 27 10 37.0 11 40.7 3 11.1 0 0 0 0<br />
Table 134: Analgesic use and ethnicity (among nulliparous spontaneous and induced labours)<br />
Total Epidural Entonox Pethidine TENS Water<br />
N n % n % n % n % n %<br />
NZ European 1233 944 76.6 561 45.5 203 16.5 37 3.0 184 14.9<br />
Maori 210 119 56.7 114 54.3 58 27.6 2 1.0 24 11.4<br />
Pacific 300 148 49.3 146 48.7 81 27.0 1 0.3 26 8.7<br />
Asian 540 360 66.7 255 47.2 187 34.6 9 1.7 26 4.8<br />
Indian 249 180 72.3 112 45.0 79 31.7 1 0.4 15 6.0<br />
Other 331 251 75.8 142 42.9 60 18.1 14 4.2 65 19.6<br />
Other European 291 202 69.4 143 49.1 71 24.4 8 2.8 35 12.0<br />
201
6.7 Perineal trauma<br />
Table 135: Perineal trauma by mode of birth, parity and LMC<br />
Total Episiotomy 3 rd /4 th tear* Vaginal wall tear<br />
N n % n % n %<br />
Total vaginal births 4921 1093 22.2 99 2.0 178 3.6<br />
Mode of birth<br />
Parity<br />
LMC<br />
Normal vaginal 3845 539 14.0 53 1.4 132 3.4<br />
Vaginal breech 54 2 3.7 0 0<br />
Ventouse 728 332 45.6 24 3.3 28 3.8<br />
Forceps 294 216 73.5 20 6.8 18 6.1<br />
Nulliparous 2344 817 34.9 71 3.0 124 5.3<br />
Multiparous 2577 276 10.7 26 1.0 54 2.1<br />
Independent MW 2291 560 24.4 39 1.7 72 3.1<br />
GP 104 28 26.9 2 1.9 5 4.8<br />
Private Obstetrician 855 255 29.8 11 1.3 22 2.6<br />
Domino 480 66 13.8 13 2.7 24 5.0<br />
Community 694 115 16.6 28 4.1 30 4.3<br />
ADAPT/ Community 50 5 10.0 1 2.0 1 2.0<br />
Diabetic 114 21 18.4 2 1.8 10 8.9<br />
Medical 211 38 18.0 4 1.9 10 4.7<br />
Other DHB 67 2 3.0 0 2 2.9<br />
Unbooked 55 3 5.5 0 2 3.6<br />
Table 136: Episiotomy in SVB by LMC at birth and parity<br />
Nullipara Multipara<br />
Total n % Total n %<br />
Total 1514 351 23.2 2331 188 8.1<br />
Independent MW 744 205 27.6 1048 94 10.0<br />
GP 34 8 25.5 51 7 13.8<br />
Private Obstetrician 214 65 30.4 373 50 13.4<br />
Domino 161 19 11.8 253 10 4.0<br />
Community 206 39 18.9 370 16 4.3<br />
ADAPT/ Community 16 1 6.3 28 1 3.6<br />
Diabetic 23 2 8.7 67 6 10.0<br />
Medical 57 8 14.0 94 3 3.2<br />
Other DHB 35 2 5.7 20 0<br />
Unbooked 24 2 8.3 27 1 3.7<br />
202
Table 137: 3 rd and 4 th degree tears in SVB by LMC at birth and parity<br />
Nullipara Multipara<br />
Total n % Total n %<br />
Total 1514 35 2.3 2331 20 0.9<br />
Independent MW 744 15 2.0 1048 4 0.4<br />
GP 34 0 51 1 2.0<br />
Private Obstetrician 214 2 0.9 373 3 0.8<br />
Domino 161 7 4.3 253 4 1.6<br />
Community 206 9 4.4 370 7 1.9<br />
ADAPT/ Community 16 0 28 0<br />
Diabetic 23 0 67 1 1.5<br />
Medical 57 2 3.5 94 0<br />
Other DHB 35 0 20 0<br />
Unbooked 24 0 27 0<br />
Table 138: Postpartum transfusion rates by recorded blood loss at birth<br />
Postpartum<br />
transfusion<br />
n=133<br />
Total n %<br />
Blood loss < 500mls 5037 10 0.2<br />
PPH > 500 - 1000mls 367 82 22.3<br />
Blood loss unknown 19 0<br />
203
APPENDIX 6. POSTNATAL CARE<br />
6.1 Infant feeding<br />
Table 139: Method of infant feeding at discharge from NW<br />
2003 2004 <strong>2005</strong><br />
n = 5177 n = 5938 n = 5765<br />
n % n % n %<br />
Exclusive breastfeeding 2789 53.9 3673 61.9 3686 63.9<br />
Fully breastfeeding 562 10.9 464 7.8 485 8.4<br />
Partial breastfeeding 1521 29.4 1497 25.2 1375 23.9<br />
Artificial feeding 305 5.9 304 5.1 219 3.8<br />
Table 140: Maternal demography and infant feeding on discharge from NW<br />
Total Exclusive BF Fully BF Partial BF Artificial<br />
N n % n % n % n %<br />
Total 5765 3686 63.9 485 8.4 1375 23.9 219 3.8<br />
Mode of Birth<br />
Spontaneous vaginal 3066 2411 78.6 108 3.5 440 14.4 107 3.5<br />
Operative vaginal 805 556 69.1 52 6.5 173 21.5 24 3.0<br />
Elective CS 756 317 41.9 117 15.5 281 37.2 41 5.4<br />
Emergency CS 1138 402 35.3 208 18.3 481 42.3 47 4.1<br />
LMC at birth<br />
IMW 2506 1829 73.0 156 6.2 467 18.6 54 2.2<br />
Private Obstetrician 1290 842 65.3 121 9.4 295 22.9 50 3.9<br />
GP 123 80 65.0 11 8.9 24 19.5 8 6.5<br />
NW Community 932 505 54.2 91 9.8 283 30.4 53 5.7<br />
NW Domino 478 323 67.6 36 7.5 98 20.5 21 4.4<br />
NW Medical 220 73 33.2 40 18.2 92 41.8 15 6.8<br />
NW Diabetes 153 19 12.4 25 16.3 101 66.0 8 5.2<br />
Unbooked 34 19 55.9 2 5.9 5 14.7 8 23.5<br />
Other DHB 29 14 48.3 3 10.3 10 34.5 2 6.9<br />
Maternal age<br />
< 20 225 153 68.0 15 6.7 34 15.1 23 10.2<br />
21-25 633 411 64.9 53 8.4 136 21.5 33 5.2<br />
26-30 1370 896 65.4 103 7.5 326 23.8 45 3.3<br />
31-35 2184 1466 67.1 185 8.5 476 21.8 57 2.6<br />
36-40 1143 663 58.0 101 8.8 325 28.4 54 4.7<br />
41+ 210 97 46.2 28 13.3 78 37.1 7 3.3<br />
Ethnicity<br />
NZ European 2232 1581 70.8 196 8.8 379 17.0 76 3.4<br />
Māori 393 269 68.4 34 8.7 68 17.3 22 5.6<br />
Pacific 779 442 56.7 58 7.4 236 30.3 43 5.5<br />
Asian 954 517 54.2 59 6.2 339 35.5 39 4.1<br />
Indian 438 221 50.5 51 11.6 159 36.3 7 1.6<br />
Other European 563 385 68.4 55 9.8 108 19.2 15 2.7<br />
Other 403 269 66.7 32 7.9 85 21.1 17 4.2<br />
204
Table 141: Clinical characteristics and infant feeding on discharge from NW<br />
Total Exclusive BF Fully BF Partial BF Artificial<br />
N n % n % n % n %<br />
Total 5765 3686 63.9 485 8.4 1375 23.9 219 3.8<br />
Gestation<br />
< 37 weeks 241 73 30.3 45 18.7 108 44.8 15 6.2<br />
37 - 40 weeks 4552 2924 64.2 372 8.2 1081 23.7 175 3.8<br />
41+ weeks 972 689 70.9 68 7.0 186 19.1 29 3.0<br />
Weight<br />
< 2.5 kgs 149 17 11.4 31 20.8 94 63.1 7 4.7<br />
2.5 - 2.9 kgs 862 452 52.4 95 11.0 262 30.4 53 6.1<br />
3.0 - 4.4 kgs 4633 3169 68.4 348 7.5 963 20.8 153 3.3<br />
> 4.5 kgs 121 48 39.7 11 9.1 56 46.3 6 5.0<br />
Infant feeding at discharge from NW Homecare by LMC<br />
Domino 525 295 56.2 79 15.0 89 17.0 62 11.8<br />
Community 747 331 44.3 123 16.5 187 25.0 106 14.2<br />
Medical 118 37 31.4 28 23.7 30 25.4 23 19.5<br />
Diabetes 69 13 18.8 18 26.1 29 42.0 9 13.0<br />
Table 142: Infant feeding at discharge from NW Homecare by LMC<br />
Total Exclusive BF Fully BF Partial BF Artificial<br />
N n % n % n % n %<br />
Infant feeding at discharge from NW Homecare by LMC<br />
Domino 525 295 56.2 79 15.0 89 17.0 62 11.8<br />
Community 747 331 44.3 123 16.5 187 25.0 106 14.2<br />
Medical 118 37 31.4 28 23.7 30 25.4 23 19.5<br />
Diabetes 69 13 18.8 18 26.1 29 42.0 9 13.0<br />
6.2 Postnatal admissions<br />
Table 143: Maternal destination following birth by mode of birth<br />
NW Wards<br />
n=4286<br />
Birthcare<br />
n=2354<br />
205<br />
Home<br />
n=510<br />
Other Units<br />
n=44<br />
n % n % n % n %<br />
Spontaneous vaginal 1396 32.6 1939 82.4 475 93.1 35 79.5<br />
Breech vaginal 52 1.2 0 0 2 0.4 0 0<br />
Operative vaginal 565 13.2 415 17.6 33 6.5 9 20.5<br />
CS elective 834 19.5 0 0 0 0 0 0<br />
CS emergency 1439 33.6 0 0 0 0 0 0
Table 144: Maternal destination following birth by LMC<br />
NW Wards Birthcare Home Other Units<br />
N n % n % n % n %<br />
Independent Midwife 2996 1400 46.7 1259 42.0 314 10.5 23 0.8<br />
Private Obstetrician 1577 1009 64.0 534 33.9 19 1.2 15 1.0<br />
General Practitioner 142 71 50.0 62 43.7 9 6.3 0 0<br />
NW Domino 591 295 49.9 246 41.6 49 8.3 1 0.2<br />
NW Community 1212 847 69.9 256 21.1 107 8.8 2 0.2<br />
NW Diabetes 212 210 99.1 2 0.9 0 0 0 0<br />
NW Medical 351 347 98.9 1 0.3 3 0.9 0 0<br />
Other DHB 131 125 95.4 0 0 3 2.3 3 2.3<br />
Unbooked 58 43 74.1 5 8.6 10 17.2 0 0<br />
Table 145: Maternal destination following birth by ethnicity<br />
Total NW Wards Birthcare Home Other Units<br />
N n % n % n % n %<br />
NZ European 2802 1609 57.4 1091 38.9 79 2.8 23 0.8<br />
Maori 545 344 63.1 133 24.4 62 11.4 6 1.1<br />
Asian 1123 635 56.5 330 29.4 156 13.9 2 0.2<br />
Indian 544 375 68.9 138 25.4 29 5.3 2 0.4<br />
Other European 674 400 59.3 241 35.8 28 4.3 5 0.7<br />
Other 492 319 64.8 169 34.3 32 6.5 1 0.2<br />
Table 146: Postnatal readmission reason by maternal destination following birth<br />
NW Wards<br />
n=4618<br />
Birthcare<br />
n=2245<br />
206<br />
Home<br />
n=539<br />
n % n % n %<br />
Neonatal Admission 27 0.6 44 2.0 6 1.1<br />
Infection 57 1.2 13 0.6 2 0.4<br />
Breast 25 0.5 29 1.3 2 0.4<br />
Wound 18 0.4 5 0.2 2 0.4
Table 147: Postnatal readmission by LMC at birth<br />
Neonatal<br />
Admission<br />
Infection Breast Wound<br />
n % n % n % n %<br />
Independent Midwife 2996 27 0.9 26 0.9 22 0.7 10 0.3<br />
Private Obstetrician 1577 10 0.6 11 0.7 3 0.2 1 0.1<br />
NW Domino 591 12 2.0 4 0.7 16 2.7 3 0.5<br />
NW Community 1060 24 2.3 18 1.7 7 0.7 6 0.6<br />
NW High Risk 563 3 0.5 6 1.1 6 1.1 4 0.7<br />
207
APPENDIX 7. NEWBORN<br />
7.1 Admissions to NICU<br />
Table 148: Admissions to NICU by gestational age of babies born in <strong>National</strong> Women’s<br />
Gestation<br />
(weeks)<br />
1999 2000 2001 2002 2003 2004 <strong>2005</strong><br />
Total 1108 1154 1104 1098 1004 861 825<br />
23 3 5 7 1 1 0 1<br />
24 3 4 10 8 9 3 15<br />
25 17 21 12 13 10 8 14<br />
26 10 23 12 15 15 18 11<br />
27 29 15 14 20 15 24 9<br />
28 23 18 21 19 18 18 23<br />
29 28 34 29 32 18 19 41<br />
30 35 32 36 32 31 35 29<br />
31 49 54 42 36 43 32 33<br />
32 73 78 58 67 49 42 42<br />
33 72 98 77 100 78 65 38<br />
34 122 135 125 138 137 79 83<br />
35 138 106 116 125 96 84 70<br />
36 98 114 112 92 89 79 62<br />
37 69 88 77 84 71 61 70<br />
38 100 93 101 98 88 86 83<br />
39 74 77 88 61 85 68 72<br />
40 93 109 106 78 90 84 80<br />
41 57 44 55 66 52 51 39<br />
42 14 6 6 13 9 5 9<br />
43 1 0 0 0 0 0 1<br />
208
Table 149: Admissions to NICU by birth weight of babies born in <strong>National</strong> Women’s<br />
Birth Weight<br />
(gms)<br />
1999 2000 2001 2002 2003 2004 <strong>2005</strong><br />
Total 1108 1154 1104 1098 1004 861 825<br />
Table 151: Admissions by birth weight of babies transferred postpartum to <strong>National</strong><br />
Women’s<br />
Birth Weight<br />
(gms)<br />
1999 2000 2001 2002 2003 2004 <strong>2005</strong><br />
Total 244 258 209 228 216 114 81<br />
500-749 4 3 5 3 2 3 2<br />
750-999 4 3 6 10 4 4 5<br />
1000-1249 4 2 3 4 8 3 4<br />
1250-1499 5 7 6 11 5 5 6<br />
1500-1999 17 14 15 14 18 18 15<br />
2000-2499 29 35 34 21 28 11 10<br />
2500-2999 44 37 32 34 29 13 10<br />
3000-3999 104 120 87 101 91 43 22<br />
>4000 33 37 21 30 31 14 7<br />
Table 152: Domicile of mother of all babies admitted to NICU<br />
2001 2002 2003 2004 <strong>2005</strong><br />
n % n % n % n % n %<br />
210<br />
%<br />
change<br />
Total 1313 1331 1222 975 906 -30<br />
Northern Region 1274 97 1280 96 1177 96 934 96 833 92 -33<br />
<strong>Auckland</strong> 554 42 515 39 494 40 461 47 441 49 -15<br />
Counties Manukau 157 12 179 13 174 14 162 17 144 16 -15<br />
Waitemata 524 40 558 42 477 39 275 28 217 24 -58<br />
Northland 39 3.0 28 2.1 32 2.6 36 3.7 32 3.5 -3<br />
Midland Region 24 1.8 36 2.7 19 1.6 14 1.4 34 3.8 +29<br />
Central Region 8 0.6 8 0.6 9 0.7 16 1.6 23 2.5 +176<br />
Southern Region 5 0.4 6 0.5 13 1.1 7 0.7 8 0.9 0<br />
Overseas 2 0.2 1 0.1 4 0.3 4 0.4 5 0.6 +114<br />
Change is from the average of 2001-2003 to <strong>2005</strong> admission numbers.
Table 153: Domicile of mother of babies
Table 156: Occupancy (baby-days) for NICU by birth weight<br />
Weight(gms) 1999 2000 2001 2002 2003 2004 <strong>2005</strong><br />
Total 18407 20652 20108 20580 19249 14958 14505<br />
Table 159: Late onset serious infection (septicaemia)<br />
Gestation<br />
(weeks)<br />
Birth Weight<br />
(gms)<br />
Type<br />
Gestation<br />
(weeks)<br />
213<br />
Birth Weight<br />
(gms)<br />
Type<br />
24 705 CONS day 9 25 935 S. aureus day 34<br />
24 820 S. epi day 9 25 647 S. aureus day 55<br />
24 690 S. aureus day 16 25 647 GBS day 78<br />
24 750 S. epi day 22 26 725 GBS day 65<br />
24 620 S. aureus day 26 26 725 CONS day 107<br />
24 750 S. epi day 68 28 860 S. aureus day 16<br />
24 750 S. epi day 77 28 1166 S. aureus day 44<br />
24 750 S. epi day 90 29 1190 S. epi day 5<br />
24 750 S. epi day 016 31 1195 S. epi day 21<br />
25 647 E. coli day 10 33 2135 CONS day 45<br />
25 720 E. coli day 14 34 1910 S. epi day 10<br />
25 935 S. epi day 17 35 2535 Serratia day 6<br />
25 720 E. coli day 25<br />
(All septicaemias) CONS = Coagulase negative Staphylococcus, GBS = Group B Streptococcus or Strep agalactiae S.epi<br />
= Staph epidermidis<br />
7.3 Infant feeding in babies discharged from NICU<br />
Note human milk fortifier has not been included as a supplement in the definition used for NICU<br />
babies<br />
Table 160: Infant feeding in babies discharged either directly home or to a post-natal ward<br />
by gestational age<br />
Gestation (weeks) Exclusive Fully Partial Artificial<br />
N n % n % n % n %<br />
Total 658 232 35 201 31 144 22 81 12<br />
≤28 24 13 54 4 17 0 0 7 29<br />
29-31 51 16 31 22 43 2 4 11 22<br />
32-36 260 76 29 105 40 55 21 24 9<br />
>36 323 127 39 70 22 87 27 39 12<br />
Table 161: Infant feeding in babies discharged either directly home or to a post-natal ward<br />
by birth weight<br />
Birthweight (gms) Exclusive Fully Partial Artificial<br />
N n % n % n % n %<br />
Total 658 232 35 201 31 144 22 81 12<br />
500-999 22 12 55 5 23 0 0 5 23<br />
1000-1499 42 15 36 19 45 0 0 8 19<br />
1500-1999 92 22 24 44 48 14 15 12 13<br />
2000-2499 146 40 27 56 38 33 23 17 12<br />
2500+ 356 143 40 77 22 97 27 39 11
7.4 Assisted ventilation<br />
Table 162: Proportion of babies needing assisted ventilation (excluding for surgery or a<br />
congenital anomaly) 2003-<strong>2005</strong><br />
Gestation<br />
(weeks)<br />
No<br />
support<br />
%<br />
CPAP<br />
only<br />
% IPPV %<br />
23 0 0 0 0 2 100<br />
24 0 0 0 0 33 100<br />
25 0 0 1 3 32 97<br />
26 0 0 9 18 40 82<br />
27 0 0 10 19 42 81<br />
28 0 0 23 33 46 67<br />
29 5 5 55 60 31 34<br />
30 8 8 82 78 15 14<br />
31 15 13 85 71 20 17<br />
32 46 30 89 58 19 12<br />
33 88 44 103 52 9 5<br />
34 248 71 91 26 12 3<br />
35 373 84 69 16 2 0<br />
36 750 93 52 6 8 1<br />
37 1657 97 40 2 16 1<br />
38 3726 98 55 1 19 1<br />
39 5446 99 38 1 14 0<br />
40 5633 98 64 1 24 0<br />
41 3233 99 33 1 13 0<br />
42 524 98 5 1 5 1<br />
43 31 100 0 0 0 0<br />
Denominator is all inborn babies from 2003-<strong>2005</strong>, excluding delivery room deaths. n = 23089<br />
Table 163: High Frequency Oscillatory Ventilation<br />
Gestation<br />
(weeks)<br />
1996 1997 1998 1999 2000 2001 2002 2003 2004 <strong>2005</strong> Total %<br />
Total 1/3 3/6 8/14 7/18 11/20 3/10 12/25 7/9 5/10 15/21 72/136 53<br />
Table 164: Inhaled Nitric Oxide (iNO)<br />
Gestation<br />
(weeks)<br />
1996 1997 1998 1999 2000 2001 2002 2003 2004 <strong>2005</strong> Total %<br />
Total 10/16 11/14 11/22 12/21 16/25 11/16 13/24 6/10 7/13 13/16 110/177 62<br />
7.5 Very low birth weight infants<br />
Table 167: Number of VLBW who were born elsewhere and admitted to NICU, or were born<br />
in ACH and alive at birth<br />
1996 1997 1998 1999 2000 2001 2002 2003 2004 <strong>2005</strong><br />
Total 205 178 181 204 210 219 204 175 159 185<br />
Total Inborn 189 166 169 186 195 199 176 156 144 168<br />
Table 170: Intraventricular haemorrhage by gestation<br />
Gestation (weeks) n Unknown None Grade 1 Grade 2 Grade 3 Grade 4<br />
Total 176 26 125 6 13 3 3<br />
Table 174: Chronic lung disease by gestational age<br />
Gestation<br />
(weeks)<br />
n Dead by<br />
36 wks<br />
Alive at<br />
36 wks<br />
218<br />
In O2<br />
CPAP/<br />
IPPV<br />
CLD %CLD<br />
in All<br />
%CLD<br />
if Alive<br />
Total 176 11 165 21 13 27 15 16<br />
Table 177: Patent Ductus Arteriosus by birth weight<br />
Indo = treated with indomethacin. Ligate = surgical ligation of PDA.<br />
Birth<br />
2001 2002 2003 2004 <strong>2005</strong><br />
weight<br />
(gms) N Indo Ligate N Indo Ligate N Indo Ligate N Indo Ligate N Indo Ligate<br />
Total 155 42 4 157 42 4 136 40 7 121 34 2 148 39 0<br />
500-749 23 15 4 14 7 1 20 15 6 11 4 1 25 20 0<br />
750-999 37 19 0 37 19 0 32 11 0 37 18 0 34 15 0<br />
1000-1249 47 7 0 47 9 2 31 10 0 38 11 1 47 3 0<br />
1250-1499 48 1 0 56 7 1 53 4 1 35 1 0 42 1 0<br />
Gestation<br />
(weeks)<br />
Table 178: Patent Ductus Arteriosus by gestational age<br />
2001 2002 2003 2004 <strong>2005</strong><br />
N Indo Ligate N Indo Ligate N Indo Ligate N Indo Ligate N Indo Ligate<br />
Total 183 42 4 175 45 4 160 43 6 157 35 2 176 41 1<br />
Table 180: Pneumothorax by gestational age<br />
Gestation<br />
(weeks)<br />
2001 2002 2003 2004 <strong>2005</strong><br />
N n % N n % N n % N n % N n %<br />
7.7 Details of babies who died<br />
Table 183: Extremely preterm neonatal and post-neonatal deaths (n = 28)<br />
Born at Gest<br />
age<br />
(weeks)<br />
Birth<br />
Weight<br />
(gms)<br />
Apgar<br />
1/5<br />
Admit<br />
NICU<br />
Died<br />
dy:hr<br />
221<br />
Single/<br />
twin<br />
Cause of Death<br />
ACH 21 360 2/1 No 0:0 S APH, Premature labour. NR<br />
ACH 21 360 2/1 No 0:0 S Spontaneous labour. NR<br />
ACH 21 365 / No 0:1 S Spontaneous labour. NR<br />
ACH 21 410 2/2 No 0:1 S SROM and labour. NR<br />
ACH 21 440 3/2 No 0:0 S Spontaneous labour. NR<br />
ACH 21 450 / No 0:0 T Spontaneous labour. NR<br />
ACH 22 475 3/2 No 0:0 S Spontaneous labour. NR<br />
ACH 22 510 1/1 No 0:0 S Spontaneous labour. NR<br />
ACH 22 530 2/1 No 0:1 S Spontaneous labour. NR<br />
ACH 22 650 2/1 No 0:1 S Spontaneous labour. NR<br />
ACH 23 590 / No 0:0 T Spontaneous labour. NR<br />
ACH 23 605 2/2 No 0:0 S Spontaneous labour. NR<br />
ACH 23 610 2/2 No 0:1 S Spontaneous labour. NR<br />
ACH 24 535 2/2 No 0:0 T Twin-twin Tx, induced. NR.<br />
ACH 24 550 4/7 Yes 3:0 S Periventricular leukomalacia<br />
ACH 24 570 2/2 No 0:0 T Twin-twin Tx, induced. NR.<br />
ACH 24 605 9/10 Yes 0:15 S Grade 4 IVH, E coli sepsis.<br />
ACH 24 625 2/7 Yes 6:20 T IVH grade 4<br />
ACH 24 655 4/9 Yes 43:19 T Renal failure following NEC<br />
ACH 24 700 7/8 Yes 6:9 T Necrotising enterocolitis<br />
ACH 24 705 3/3 Yes 10:5 S Overwhelming sepsis, IVH<br />
ACH 24 710 1/1 No 0:1 S Spontaneous labour. NR<br />
Waitakere 24 770 8/8 Yes 20:13 S Necrotising enterocolitis<br />
ACH 25 720 1/6 Yes 61:5 S Necrotising enterocolitis<br />
ACH 25 1030 1/0 No 0:0 T Failed resuscitation. Infection.<br />
ACH 26 1200 5/9 Yes 1:1 T Twin/twin Tx/resp. failure<br />
ACH 27 830 2/3 Yes 0:5 T<br />
Twin/twin transfusion, resp.<br />
failure<br />
ACH 27 1045 3/6 Yes 0:20 S Pulmonary hypoplasia/PIE<br />
N/R = not resuscitated
Table 184: Premature neonatal and post-neonatal deaths (n = 3)<br />
Born at Gest<br />
age<br />
(weeks)<br />
Birth<br />
Weight<br />
(gms)<br />
Apgar<br />
1/5<br />
Admit<br />
NICU<br />
Died<br />
dy:hr<br />
222<br />
Single/<br />
twin<br />
Cause of Death<br />
ACH 28 810 4/7 Yes 0:0 T Twin/twin transfusion, resp. failure<br />
MMH 28 1340 6/9 Yes 11:18 S Necrotising enterocolitis<br />
ACH 32 1670 5/9 Yes 1:1 S Global severe brain injury (antenatal)<br />
Table 185: Term/post-term neonatal and post-neonatal deaths (n = 4)<br />
Born at Gest<br />
age<br />
(weeks)<br />
Birth<br />
Weight<br />
(gms)<br />
Apgar<br />
1/5<br />
Admit<br />
NICU<br />
Died<br />
dy:hr<br />
Single/<br />
twin<br />
ACH 39 3970 1/0 Yes 1:2 S<br />
Cause of Death<br />
Perinatal asphyxia, stage 3<br />
encephalopathy<br />
ACH 41 4060 10/10 No 23:6 S Bronchiolitis, post discharge<br />
ACH 41 4680 0/0 Yes 0:6 S<br />
Home 42 3560 3/5 Yes 1:4 S<br />
Perinatal asphyxia, stage 3<br />
encephalopathy<br />
Perinatal asphyxia, stage 3<br />
encephalopathy<br />
Table 186: Babies with associated anomalies, neonatal and post-neonatal deaths (n = 8)<br />
Born at Gest<br />
age<br />
Birth<br />
Weight<br />
Apgar<br />
1/5<br />
Admit<br />
NICU<br />
Died<br />
dy:hr<br />
Single/<br />
twin<br />
Cause of Death<br />
NSH 27 820 6/6 Yes 45:5 S Scimitar syndrome<br />
ACH 30 1995 6/8 Yes 53:18 S<br />
Noonan's syndrome, hypertrophic<br />
cardiomyopathy, PPHN<br />
Dunedin 34 2050 8/8 Yes 14:0 S TAPVD and PPHN<br />
ACH 34 2420 4/7 Yes 0:21 S Right diaphragmatic hernia<br />
ACH 38 2600 9/10 No 12:22 S VSD, coarctation (diagnosed PM).<br />
ACH 38 2735 9/9 Yes 2:21 S Heterotaxy syndrome<br />
ACH 39 3580 9/9 Yes 19:22 S HPLHS, Stage 1 Norwood.<br />
ACH 40 2690 9/10 Yes S HPLHS, Stage 1 Norwood. Home.<br />
Associated anomalies are those which had a significant influence on the outcome but for which active<br />
treatment was offered.
Table 187: Babies with lethal anomalies, neonatal and post-neonatal deaths (n = 13)<br />
Born at Gest<br />
age<br />
Birth<br />
Weight<br />
Apgar<br />
1/5<br />
Admit<br />
NICU<br />
Died<br />
dy:hr<br />
223<br />
Single/<br />
twin<br />
Cause of Death<br />
ACH 20 424 2/2 No 0:0 S CNS abnormality, induced.<br />
ACH 21 350 3/1 No 0:0 S Camptomelic dysplasia. Induced<br />
ACH 24 750 2/1 No 0:1 S Multiple anomalies. Induced. NR<br />
ACH 32 1555 6/7 Yes 3:18 T Multicystic dysplastic kidneys<br />
Wellington 33 1550 3/8 Yes 23:0 S Laryngeal cleft, duodenal atresia.<br />
ACH 35 2260 5/7 Yes 51:6 T Freedman Sheldon syndrome<br />
ACH 35 2510 / No 0:0 S Trisomy 13<br />
ACH 36 2086 4/6 Yes 15:18 S Zellweger's syndrome, PPHN<br />
ACH 36 3355 2/1 No 0:0 S Multiple anomalies<br />
MMH 38 2170 2/9 Yes 31:1 S<br />
Larsen's<br />
Syndrome/bronchomalacia<br />
ACH 38 3980 1/0 No 0:0 S Trisomy 21 + hydrops<br />
ACH 39 2565 9/10 Yes 2:5 S Hypoplastic L heart, inoperable.<br />
ACH 42 3970 1/0 No 0:1 S<br />
Pulmonary hypoplasia,<br />
pneumothorax, failed<br />
resuscitation
APPENDIX 8. PERINATAL MORTALITY<br />
Table 188: Postnatal transfer deaths (these are babies born elsewhere who transferred to<br />
NW for postnatal care)<br />
Early neonatal<br />
deaths<br />
Late neonatal<br />
deaths<br />
Total number of<br />
perinatal related<br />
losses<br />
2000 2001 2002 2003 2004 <strong>2005</strong><br />
< 7 days 6 1 3 3 3 3<br />
8 – 28 days 0 1 0 0 0 3<br />
Total deaths 6 2 3 3 3 6<br />
Table 189: Perinatal and perinatal- related losses 1992 - <strong>2005</strong><br />
1992 1993 1994 1995 1996 1997 1998 1999 2000 2001 2002 2003 2004 <strong>2005</strong><br />
168 133 147 131 165 128 133 105 136 94 116 105 124 111<br />
Fetal death 86 61 80 84 86 74 73 65 84 57 69 64 82 68<br />
Early neonatal death 65 60 49 39 63 45 50 31 43 32 40 34 33 38<br />
Late neonatal death 9 6 15 7 10 6 6 9 9 5 7 7 9 5<br />
Perinatal mortality<br />
rate /1000<br />
Perinatal related loss<br />
rate /1000<br />
11.6 9.4 9.3 7.6 10.1 9.4 9.8 12.5 15.8 11.6 13.6 12.6 15.0 14.4<br />
19.7 14.3 15.6 13.7 16.5 14.7 16.1 13.7 16.9 12.3 14.5 13.5 16.1 16.1<br />
Table 190: Perinatal mortality rate (per 1000 births) and perinatal-related loss rate (per<br />
1000 births) adjusted for termination for fetal abnormalities<br />
2000 2001 2002 2003 2004 <strong>2005</strong><br />
Rate Rate Rate Rate Rate n Rate/ 1000<br />
Perinatal mortality rate 15.8 11.6 13.6 12.6 15.0 106/ 7384 14.4<br />
Perinatal mortality rate (excluding<br />
lethal & terminated fetal abnormalities) 11.5 8.0 8.9 8.2 11.4<br />
224<br />
(106-35)<br />
/7349<br />
Perinatal related loss rate 16.9 12.3 14.5 13.5 16.2 111/ 7384 15.0<br />
Perinatal related loss rate (excluding<br />
lethal & terminated fetal abnormalities)<br />
12 8.4 9.4 8.9 12.4<br />
(111-38) /<br />
7346<br />
9.7<br />
9.9
Table 191: Maternal characteristics and perinatal related mortality<br />
Maternal Ethnicity<br />
Births<br />
n=7384<br />
n % n %<br />
Stillbirths<br />
n=68<br />
SB<br />
rate* n %<br />
225<br />
Neonatal<br />
deaths n=43<br />
NND<br />
rate ‡ n %<br />
Perinatal related<br />
deaths n=111<br />
Perinatal<br />
related<br />
death<br />
rate † RR (95%CI)§<br />
NZ European 2906 39.4 26 38 8.9 15 35 5.2 41 37 14.1 Ref<br />
Māori 558 7.5 7 10 12.5 11 26 20.0 18 16 32.3 2.3 (1.3-4.0)<br />
Pacific 999 13.5 16 24 16.0 9 21 9.2 25 23 25.0 1.8 (1.1-3.0)<br />
Asian 1138 15.4 7 10 6.2 1 2 0.9 8 7 7.0 0.5 (0.2-1.1)<br />
Indian 550 7.4 6 9 10.9 3 7 5.5 9 8 16.4 1.2 (0.6-2.4)<br />
Other European 695 9.4 3 4 4.3 3 7 4.3 6 5 8.6 0.6 (0.3-1.4)<br />
Other 535 7.2 3 4 5.6 1 2 1.9 4 3 7.5 0.5 (0.2-1.5)<br />
Maternal Age<br />
35 1711 23.2 13 19 7.6 9 21 5.3 22 20 12.9 1.2 (0.7-2.0)<br />
Maternal Smoking<br />
Current 611 8.3 4 6 6.5 9 21 14.8 13 12 21.3 1.9 (1.1-3.4)<br />
Not current 6281 85.1 43 63 6.8 28 65 4.5 71 64 11.3 Ref<br />
Stopped in<br />
pregnancy<br />
87 1.2 2 3 23.0 1 2 11.8 3 3 34.5 3.1 (1.0-9.5)<br />
Missing 405 5.5 19 28 46.9 5 12 13.0 24 22 59.3 5.2 (3.3-8.2)<br />
Maternal BMI<br />
30 702 9.5 8 12 11.4 10 23 14.4 18 16 25.6 2.0 (1.1-3.7)<br />
Missing 3579 48.5 34 50 9.5 18 42 5.1 52 47 14.5 1.2 (0.7-1.8)<br />
* Stillbirth rate = number of stillbirths per 1000 births<br />
‡ Neonatal Death rate = number of deaths per 1000 live births<br />
† Perinatal related death rate = number of perinatal related deaths per 1000 births<br />
§ Relative Risk of perinatal death for each category compared to referent category (ref)
Table 192: Cause of death 2000-<strong>2005</strong><br />
Classification*<br />
2000 2001 2002 2003 2004 <strong>2005</strong><br />
n % n % n % n % n % n %<br />
Congenital abnormality 37 25 28 30 42 36 36 34 36 34 38 34<br />
Perinatal infection 11 8 5 5 7 6 6 6 6 6 11 10<br />
Hypertension 5 4 3 3 3 3 4 4 4 4 3 3<br />
Antepartum haemorrhage 10 8 10 11 3 3 5 5 5 5 6 5<br />
Maternal conditions 5 4 3 3 8 7 8 7 8 7 8 7<br />
Specific perinatal conditions 22 17 16 17 18 16 5 5 5 5 10 9<br />
Hypoxic peripartum death 2 2 2 2 1 1 3 3 3 3 4 4<br />
Fetal growth restriction 10 8 6 6 4 3 6 6 6 6 1 1<br />
Spontaneous preterm 23 17 12 13 17 15 23 22 23 22 20 18<br />
Unexplained antepartum death 11 8 9 10 13 11 9 8 9 8 10 9<br />
Total 136 100 94 100 116 100 105 100 124 100 111 100<br />
* 2000-2004 ANZACPM <strong>2005</strong> PSANZ-PDC<br />
Table 193: Termination of pregnancy among causes of death <strong>2005</strong><br />
Classification<br />
Termination of pregnancy<br />
n=34<br />
226<br />
n %<br />
Congenital abnormality 22 65<br />
Maternal conditions 6 18<br />
Hypertension 3 9<br />
Specific perinatal conditions 2 6<br />
Fetal growth restriction 1 3<br />
Table 194: Perinatal deaths by cause (PSANZ-PDC) and gestational age<br />
Classification<br />
Total n=111 < 37 weeks n=93 > 37 weeks n=18<br />
n % n % n %<br />
Congenital abnormality 38 34.2 32 34.4 6 33.3<br />
Perinatal infection 11 9.9 8 8.6 3 16.7<br />
Hypertension 3 2.7 3 3.2 0 0<br />
Antepartum haemorrhage 6 5.4 6 6.5 0 0<br />
Maternal conditions 8 7.2 7 7.5 1 5.6<br />
Specific perinatal conditions 10 9.0 8 8.6 2 11.1<br />
Hypoxic peripartum death 4 3.6 1 1.1 3 16.6<br />
Fetal growth restriction 1 0.9 1 1.1 0 0<br />
Spontaneous preterm 20 18.0 20 21.5 0 0<br />
Unexplained antepartum death 10 18.0 7 7.5 3 16.7
Perinatal<br />
necropsy<br />
rates (%)<br />
Table 195: Necropsy rates 2001 – <strong>2005</strong><br />
2001<br />
Total<br />
Full<br />
necropsy<br />
227<br />
Incomplete<br />
necropsy<br />
No necropsy<br />
n % n % n %<br />
Fetal deaths 57 24 42.1 0 33 57.9<br />
Neonatal deaths 37 14 37.8 0 23 62.2<br />
2002<br />
Fetal deaths 69 37 53.6 3 4.3 29 42.0<br />
Neonatal deaths 47 10 21.3 0 0 37 78.7<br />
2003<br />
Fetal deaths 64 35 54.7 1 1.6 28 43.8<br />
Neonatal deaths 41 10 24.4 0 0 31 75.6<br />
2004<br />
Fetal deaths 82 50 61.0 3 3.7 29 35.4<br />
Neonatal deaths 42 15 35.7 2 4.8 25 59.5<br />
<strong>2005</strong><br />
Fetal deaths 68 40 58.8 0 28 41.2<br />
Neonatal deaths 43 13 30.2 1 29 67.4<br />
Table 196: Perinatal full necropsy rates (%)<br />
1991 1992 1993 1994 1995 1996 1997 1998 1999 2000 2001 2002 2003 2004 <strong>2005</strong><br />
58 56 65 68 57 48 50 38 50 40 40 41 43 52 48
APPENDIX 9. TERMINATION OF PREGNANCY<br />
Table 197: Demography and characteristics of women attending E.D.U<br />
2000 2001 2002 2003 2004 <strong>2005</strong><br />
Ethnicity % % % % % %<br />
Age<br />
Chinese 7 7 6.5 8 7.4 8.5<br />
Cook Island 4 3.5 3.5 3 3.2 3.5<br />
European 41 39.5 38.5 40 39.2 38.1<br />
Fijian 1 1 1 1 0.5 1.0<br />
Indian 6 6 6.5 7.6 8.7 8.6<br />
Maori 17 17.5 18.5 16.7 16.4 15.9<br />
Nuiean 1 1.5 1.5 2 1.4 1.6<br />
Other 7 7.5 7 8 7.7 7.4<br />
Pacific Island 0 0.5 0.5 0 0.2 0.1<br />
Samoan 13 13 13 11 12.6 11.9<br />
Tongan 3 3 3.5 2.7 2.7 3.4<br />
< 19 18 19 18 18 19.3 16.3<br />
20 – 24 29 29 29 31 28.9 41<br />
25 – 29 21 21 23 21 20.9 19.9<br />
30 – 34 17 17 16 17 16.1 13.1<br />
35 –39 11 11 10 10 10.9 6.6<br />
40+ 4 3 4 3 3.9 3.3<br />
Gestation (weeks) at<br />
termination<br />
7 4 2.5 1 0.8 1.0 0.4<br />
8 15 14 9 6.8 17.3 10.5<br />
9 21 19.5 20 18 23.9 20.9<br />
10 22 21.5 23 24 21.4 22.7<br />
11 20 21 22.5 25 20.8 24.0<br />
12 15 18.5 21 22.4 14.5 20.2<br />
13 3 3 3.5 3 1.2 1.3<br />
228
APPENDIX 10. GLOSSARY OF ABBREVIATIONS<br />
ABA American <strong>Board</strong> of Anaestheseologists IUD Intrauterine death<br />
ACL Anticardiolipin antibody IUGR Intrauterine growth retardation<br />
ADAPT Alcohol, Drugs and Pregnancy Team ICSI Intracytoplasmic sperm injection<br />
AMSIS <strong>Auckland</strong> Maternity Services Information System IVF In vitro fertilisation<br />
ANA Antinuclear antibody IVH Intraventricular haemorrhage<br />
ANZNN Australia and New Zealand Neonatal Network LB Live birth<br />
APH Antepartum haemorrhage Ligate Surgical ligation of PDA<br />
ARM Artificial rupture of membranes LMP Last menstrual period<br />
AUT <strong>Auckland</strong> University of Technology LNND Late neonatal death<br />
BBA (Baby) Born Before Arrival (not a planned home birth) LSCS Lower segment Caesarean section<br />
BP Blood Pressure LV Left ventricle<br />
BPD Bronchopulmonary dysplasia MAS Meconium aspiration syndrome<br />
CDU Child Development Unit MCDA Monochorionic diamniotic twin<br />
CHD Congenital Heart Disease MCMA Monochorionic monoamniotic<br />
CI Confidence Interval N/R Not resuscitated<br />
CLD Chronic lung disease NAS Neonatal abstinence syndrome<br />
CPAP Continuous positive airways pressure NEC Necrotising enterocolitis<br />
CRIS Clinical Records Information System NFD Not further defined<br />
CS Caesarean section NICU Neonatal Intensive Care Unit<br />
CVA Cerebro Vascular Accident NIDDM Non-insulin dependent diabetes mellitus<br />
CVS Chorionic villus sampling NVB Normal vaginal birth<br />
DCCM Department of Critical Care Medicine NWH <strong>National</strong> Women’s <strong>Hospital</strong><br />
DCDA Dichorionic diamniotic twin OP Occiput posterior<br />
DHB <strong>District</strong> <strong>Health</strong> <strong>Board</strong> OPU Oocyte pick up<br />
DIC Disseminated intravascular coagulopathy PDA Patent ductus arteriosis<br />
DORV Double outlet right ventricle PE/PET Pre-eclampsia<br />
DRG Diagnosis related groups PG Prostaglandin<br />
ECMO Extra Corporeal Membrane Oxygenation PIN Parent Infant Nursery<br />
EDU Epsom Day Unit PM Postmortem<br />
ENND Early neonatal death PMR Perinatal mortality rate<br />
FH Fetal heart PPHN Persistent pulmonary hypertension of the<br />
newborn<br />
FTE Fulltime equivalent PRLR Perinatal related loss rate<br />
GA General anaesthetic PROM Prolonged rupture of membranes<br />
GDM Gestational diabetes mellitus PVL Periventricular leukomalacia<br />
GH Gestational hypertension RDS Respiratory distress syndrome<br />
GLH Green Lane <strong>Hospital</strong> ROP Retinopathy of prematurity<br />
GP General Practitioner SCBU Special Care Baby Unit<br />
GPH Gestational proteinuric hypertension SGA Small for gestational age<br />
GTT Glucose tolerance test SLE Systemic Lupus Erythematosis<br />
Hb Haemoglobin SRM Spontaneous rupture of membranes<br />
HbAIc Glycosylated heamoglobin SVB Spontaneous vaginal birth<br />
HDU High Dependency Unit TCM Transcutaneous oxygen monitor<br />
HELLP Hemolysis, Elevated Liver, Low Platelet (syndrome) TGA Transposition of the great arteries<br />
HFOV High frequency oscillatory ventilation TIA Transient Ischaemic Attack<br />
HDU High Dependency Unit TOP Termination of pregnancy<br />
HIE Hypoxic ischaemic encephalopathy UAC Umbilical artery catheter<br />
HIV Human Immuno Deficiency Virus US/USS Ultrasound/ultrasound scan<br />
HMD Hyaline Membrane Disease VLBW Very low birth weight<br />
ICH Intracerebral haemorrhage VSD Ventricular septal defect<br />
IDDM Insulin dependent diabetes mellitus WAU Women’s Assessment Unit<br />
Indo Treated with indomethacin wks weeks<br />
iNO Inhaled nitrous oxide WHO World <strong>Health</strong> Organisation<br />
IPPV Intermittent positive pressure ventilation<br />
IOL Induction of labour<br />
229
APPENDIX 11. DEFINITIONS<br />
Antepartum Haemorrhage (APH)<br />
Vaginal bleeding at or beyond 20 weeks gestation.<br />
Augmentation<br />
Describes use of oxytocin or ARM to accelerate spontaneous labour.<br />
Breastfeeding (BF) Definitions<br />
The format of data collection was changed during 2001/02 to fit the Ministry of <strong>Health</strong><br />
definitions as adopted by the New Zealand Breastfeeding Authority.<br />
Exclusive breastfeeding: The infant has never, to the mother’s knowledge, had any water,<br />
formula or other liquid or solid food. Only breastmilk, from the breast or expressed, and<br />
prescribed* medicines have been given from birth.<br />
* Prescribed as per Medicines Act 1981<br />
Fully breastfeeding: The infant has taken breastmilk only, no other liquids or solids except a<br />
minimal amount of water or prescribed medicines, in the past 48 hours.<br />
Partial breastfeeding: The infant has taken some breastmilk and some infant formula or other<br />
solid food in the past 48 hours.<br />
Artificial feeding: The infant has had no breastmilk but has had alternative liquid such as infant<br />
formula with or without solid food in the past 48 hours.<br />
Chronic Hypertension (CH)<br />
Diastolic BP>90mmHg at booking or a medical history of essential hypertension.<br />
Early Neonatal Death (ENND)<br />
Death of a baby between birth and completion of 7 days of life.<br />
Elective Caesarean Section:<br />
An elective caesarean is defined as a caesarean which was scheduled in advance and scheduled<br />
prior to the onset of labour. Therefore, caesarean sections performed after the onset of labour<br />
but booked electively prior to labour are included with elective caesarean.<br />
Fetal Death<br />
Stillbirth of a baby of at least 20 weeks gestation at issue or at least 400 grams birth weight if<br />
gestation is unknown.<br />
Gestational Diabetes (GDM)<br />
This diagnosis is based on either a fasting glucose > 5.5mmol/L or a 2 hour glucose > 9.0mmol/L<br />
after a 75 gram oral glucose tolerance test.<br />
Gestational Hypertension (GH)<br />
Diastolic BP > 90mmHg without proteinuria, when diastolic BP < 90mmHg at booking.<br />
Infant Death<br />
Death of a baby after the 28th day and before completion of 1 year.<br />
Large for Gestational Age (>90th percentile)<br />
Birth weight greater than 90th percentile for gestation, gender, ethnicity, maternal height, weight,<br />
age and parity, calculated using a customised birth centile calculator (McCowan L et al, Aust N Z<br />
J Obstet Gynaecol 2004;44:428-31).<br />
Late Neonatal Death (LNND)<br />
Death of a baby after the 7th day and before completion of 28 days of life.<br />
230
Lead Maternity Carer (LMC)<br />
The Lead Maternity Carer is the practitioner or caregiver service selected by the woman to have<br />
the legal professional and practical responsibility for ensuring the woman and her baby are given<br />
clinically appropriate care.<br />
<strong>National</strong> Women’s LMC services<br />
Domino Midwives are the LMC for low risk women. Women self refer to this service.<br />
Domino midwives work in partnership with another midwife and provide continuity of all<br />
care.<br />
Community Midwives are the LMC for women who either self refer or are referred to<br />
this service. The midwives provide continuity of antenatal and postnatal care to woman<br />
who live in NW geographical boundary.<br />
Diabetic Midwives are the LMC for women who are referred to the Diabetic Service for<br />
secondary/tertiary care and LMC care. The midwives provide continuity of antenatal and<br />
postnatal care to woman who live in NW geographical boundary. The Diabetic Midwives<br />
are not the LMC for all women referred to this service as some women will have an<br />
Independent LMC.<br />
Medical Midwives are the LMC for women who are referred to the Medical Service for<br />
secondary/tertiary care and LMC care. These women have complex medical needs. The<br />
midwives provide continuity of antenatal and postnatal care to woman who live in NW<br />
geographical boundary. The Medical Midwives are not the LMC for all women referred to<br />
this service as some women will have an Independent LMC.<br />
Self-employed LMC Services<br />
Independent midwife<br />
General Practitioner (arranges private or hospital midwifery care)<br />
Private Specialist (arranges private or hospital midwifery care)<br />
Unbooked is assigned to those women who present at NW, usually in labour or pre-labour, and<br />
who do not have an LMC.<br />
Other Unspecified. These women are usually transferred to NW in late pregnancy, and remain<br />
with their original LMC. This LMC might be another <strong>District</strong> <strong>Health</strong> <strong>Board</strong> LMC or a non-NW<br />
access holder (e.g. a private obstetrician or independent midwife without access rights at NW or a<br />
homebirth midwife without access rights at NW).<br />
Neonatal Hypoglycaemia<br />
Blood glucose < 2.3mmol/L.<br />
Neonatal Death<br />
Death of liveborn babies of any gestation or weight.<br />
Neonatal Death Rate<br />
Early and late neonatal deaths of liveborn babies of any gestation or weight per 1000 total births.<br />
Parity<br />
The number of times a woman has given birth to a liveborn baby of any weight or gestation or to<br />
a stillborn infant after 20 weeks gestation or where the infant weighed 400gms or more and<br />
gestation is unknown. Multiple birth adds only one to parity total.<br />
Perinatal Mortality Rate (PMR)<br />
Fetal and early neonatal deaths per 1000 total births.<br />
Perinatal Related Loss Rate (PRLR)<br />
Fetal and early and late neonatal deaths per 1000 total births.<br />
231
Postnatally (or newly) Diagnosed Type 2 Diabetes<br />
Type 2 diabetes diagnosed by postnatal glucose tolerance test (GTT) in a woman diagnosed as a<br />
gestational diabetic (GDM) during pregnancy.<br />
Postpartum Haemorrhage (PPH)<br />
Primary PPH is 500mls than blood loss or more from the genital tract within the first 24 hours of<br />
delivery. Secondary PPH is excessive (>1000mls) blood loss from the genital tract 24 hours to 6<br />
weeks postpartum.<br />
Preeclampsia (PE or PET)<br />
Diastolic BP > 90mmHg with proteinuria > ‘+’ or 0.3g/24h, when diastolic BP < 90mmHg at<br />
booking.<br />
Small for Gestational Age (SGA)<br />
Birthweight less than 10th percentile for gestation, gender, ethnicity, maternal height, weight, age<br />
and parity, calculated using a customised birth centile calculator (McCowan L et al, Aust N Z J<br />
Obstet Gynaecol 2004;44:428-31)<br />
232