Recycling Treated Municipal Wastewater for Industrial Water Use
Recycling Treated Municipal Wastewater for Industrial Water Use Recycling Treated Municipal Wastewater for Industrial Water Use
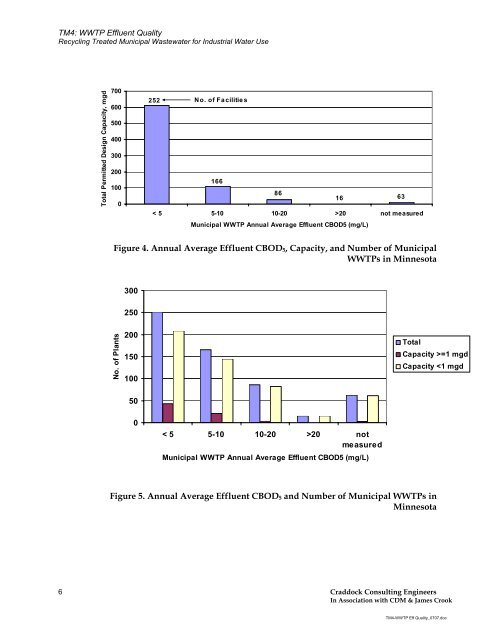
TM4: WWTP Effluent Quality Recycling Treated Municipal Wastewater for Industrial Water Use Total Permitted Design Capacity, mgd 700 600 500 400 300 200 100 0 Figure 4. Annual Average Effluent CBOD5, Capacity, and Number of Municipal WWTPs in Minnesota No. of Plants 300 250 200 150 100 50 0 252 No. of Facilities 166 < 5 5-10 10-20 >20 not measured Municipal WWTP Annual Average Effluent CBOD5 (mg/L) < 5 5-10 10-20 >20 not measured Municipal WWTP Annual Average Effluent CBOD5 (mg/L) Total Capacity >=1 mgd Capacity
TM4: WWTP Effluent Quality Recycling Treated Municipal Wastewater for Industrial Water Use Craddock Consulting Engineers 7 In Association with CDM & James Crook TM4-WWTP Eff Quality_0707.doc >20 mg/L, 16 WWTPs (2.7%) 10-20 mg/L, 86 WWTPs (14.8%) 20 mg/L, 1.2 mgd (0.2%) not measured, 11.1 mgd (1.5%)
- Page 495 and 496: Cost Curves as Basis for Tertiary 1
- Page 497 and 498: Cost Curves as Basis for Tertiary 1
- Page 499 and 500: Water Reuse System Estimated Cost o
- Page 501 and 502: Cost of Service, $/1000 gallon 10.0
- Page 503 and 504: Cost Curves as Basis for Tertiary 2
- Page 505 and 506: Appendix D-3 Water Reuse System Cos
- Page 507 and 508: Water Reuse System Estimates of Pro
- Page 509 and 510: Cost of Service, $/1000 gallon 5.00
- Page 511 and 512: Cost Curves as Basis for Tertiary 3
- Page 513 and 514: Water Reuse System Estimated Cost o
- Page 515 and 516: Cost of Service, $/1000 gallon 10.0
- Page 517 and 518: Cost Curves as Basis for Tertiary 4
- Page 519 and 520: Appendix D-5 Water Reuse System Cos
- Page 521 and 522: Water Reuse System Estimates of Pro
- Page 523 and 524: Cost of Service, $/1000 gallon 5.00
- Page 525 and 526: Appendix D-6 Water Reuse System Cos
- Page 527 and 528: Water Reuse System Estimates of Pro
- Page 529 and 530: Cost of Service, $/1000 gallon 5.00
- Page 531 and 532: Cost Curves as Basis for Tertiary 4
- Page 533 and 534: Secondary Treatment Assumptions Sus
- Page 535 and 536: Secondary Treatment Assumptions Sus
- Page 537 and 538: Secondary Treatment Assumptions Sus
- Page 539 and 540: Secondary Treatment Assumptions Sus
- Page 541 and 542: Craddock Consulting Engineers 1 In
- Page 543 and 544: TM4: WWTP Effluent Quality Recyclin
- Page 545: !( !( !( !( !( !( !( !( !( !( !( !(
- Page 549 and 550: Frequency of Occurrence, % Frequenc
- Page 551 and 552: No. of Plants Total Permitting Desi
- Page 553 and 554: TM4: WWTP Effluent Quality Recyclin
- Page 555 and 556: !( !( !( !( !( !( !( !( !( !( !( !(
- Page 557 and 558: TM4: WWTP Effluent Quality Recyclin
- Page 559 and 560: Frequency of Occurrence, % Frequenc
- Page 561 and 562: No. of Plants Total Permitting Desi
- Page 563 and 564: TM4: WWTP Effluent Quality Recyclin
- Page 565 and 566: !( !( !( !( !( !( !( !( !( !( !( !(
- Page 567 and 568: TM4: WWTP Effluent Quality Recyclin
- Page 569 and 570: Craddock Consulting Engineers 1 In
- Page 571 and 572: 1.0 Introduction This technical mem
- Page 573 and 574: Exhibit A Regulatory Stakeholder Me
- Page 575 and 576: MCES Recycling Treated Wastewater f
- Page 577 and 578: MCES Recycling Treated Wastewater f
- Page 579 and 580: Municipal Wastewater Reuse Regulato
- Page 581 and 582: MCES Recycling Treated Wastewater f
- Page 583 and 584: Exhibit B Industry Stakeholder Meet
- Page 585 and 586: Recycling Treated Wastewater For In
- Page 587 and 588: Institutional Issues Topic Discussi
- Page 589 and 590: Institutional Issues Topic Discussi
- Page 591 and 592: Recycling Treated Wastewater For In
- Page 593 and 594: Recycling Treated Wastewater For In
- Page 595 and 596: Recycling Treated Wastewater For In
TM4: WWTP Effluent Quality<br />
<strong>Recycling</strong> <strong>Treated</strong> <strong>Municipal</strong> <strong>Wastewater</strong> <strong>for</strong> <strong>Industrial</strong> <strong>Water</strong> <strong>Use</strong><br />
Total Permitted Design Capacity, mgd<br />
700<br />
600<br />
500<br />
400<br />
300<br />
200<br />
100<br />
0<br />
Figure 4. Annual Average Effluent CBOD5, Capacity, and Number of <strong>Municipal</strong><br />
WWTPs in Minnesota<br />
No. of Plants<br />
300<br />
250<br />
200<br />
150<br />
100<br />
50<br />
0<br />
252<br />
No. of Facilities<br />
166<br />
< 5 5-10 10-20 >20 not measured<br />
<strong>Municipal</strong> WWTP Annual Average Effluent CBOD5 (mg/L)<br />
< 5 5-10 10-20 >20 not<br />
measured<br />
<strong>Municipal</strong> WWTP Annual Average Effluent CBOD5 (mg/L)<br />
Total<br />
Capacity >=1 mgd<br />
Capacity


