17.08.2013
•
Views
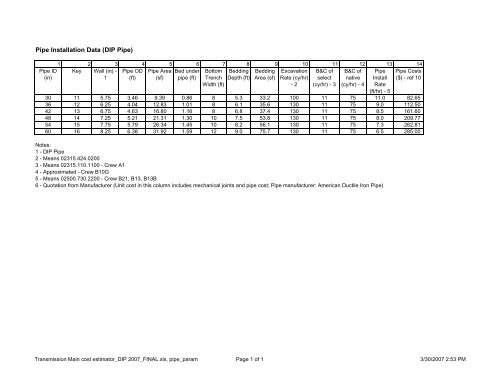
Pipe Installation Data (DIP Pipe) Pipe ID (in) 1 2 3 4 5 6 7 8 9 10 11 12 13 14 Key Wall (in) - 1 Pipe OD (ft) Pipe Area (sf) Bed under pipe (ft) Bottom Trench Width (ft) Bedding Depth (ft) Bedding Area (sf) Excavation Rate (cy/hr) - 2 B&C of select (cy/hr) - 3 B&C of native (cy/hr) - 4 Pipe Install Rate (ft/hr) - 5 Pipe Costs ($) - ref 10 30 11 5.75 3.46 9.39 0.86 8 5.3 33.2 100 11 75 11.0 82.65 36 12 6.25 4.04 12.83 1.01 8 6.1 35.6 130 11 75 9.0 112.50 42 13 6.75 4.63 16.80 1.16 8 6.8 37.4 130 11 75 8.5 161.60 48 14 7.25 5.21 21.31 1.30 10 7.5 53.8 130 11 75 8.0 209.77 54 15 7.75 5.79 26.34 1.45 10 8.2 56.1 130 11 75 7.3 262.81 60 16 8.25 6.38 31.92 1.59 12 9.0 75.7 130 11 75 6.5 285.00 Notes: 1 - DIP Pipe 2 - Means 02315.424.0200 3 - Means 02315.110.1100 - Crew A1 4 - Approximated - Crew B10G 5 - Means 02500.730.2200 - Crew B21, B13, B13B 6 - Quotation from Manufacturer (Unit cost in this column includes mechanical joints and pipe cost; Pipe manufacturer: American Ductile Iron Pipe) Transmission Main cost estimator_DIP 2007_FINAL.xls, pipe_param Page 1 of 1 3/30/2007 2:53 PM
Construction Unit Costs Item (2006 Means) Description Qty Power Production Costs St. Paul Present Cost Total Cost Source (Hp) (unit/hr) ($/unit) Index * Index ($/unit) Notes Select backfill (cy) 02315.110.0300 select backfill, no comp 1 18.21 98.5% 100.0% 17.94 Means 2006 includes O&P (material costs + 10%) Total 17.94 Pavement Removal and Replacement (sy) 02220.250.5050 4 - 6" bit pavement removal (sy) 1 420 6.75 98.5% 100.0% 6.65 Means 2006 includes O&P 02315.490.0550 Disposal - 10 mi rt haul - (cy) 0.167 15.00 98.5% 100.0% 2.47 Means 2003 includes O&P 02220.330.0100 Disposal - tipping fee (ton) 0.217 70.00 98.5% 100.0% 14.94 Means 2006 includes O&P 02315.110.0300 6" select backfill, no comp (cy) 0.167 18.21 98.5% 100.0% 2.99 Means 2006 includes O&P (material costs + 10%) 02300.432.2220 Dozer - 150 haul (cy) 0.167 4.82 98.5% 100.0% 0.80 Means 2006 includes O&P 02315.310.5000 Compaction - vibrating roller 2 pass (cy) 0.167 0.35 98.5% 100.0% 0.06 Means 2006 includes O&P 02740.310.0120 Binder course - 2" thick 1 6345 5.25 98.5% 100.0% 5.18 Means 2006 includes O&P 02740.310.0380 Wearing course - 2" thick 1 6325 5.70 98.5% 100.0% 5.62 Means 2006 includes O&P Sod (sy) Total 38.71 City Minneapolis allowance is 50$/sy 02910.710.2620 Rough grade prep (msf) 0.009 11.7 98.5% 100.0% 0.11 Means 2006 includes O&P 02910.710.3920 Spread topsoil, 4" (msf) 0.009 470 98.5% 100.0% 4.17 Means 2006 includes O&P, includes material 02920.400.0200 Sod, bluegrass, per MSF 0.009 22 390 98.5% 100.0% 3.46 Means 2006 includes O&P Seed (sy) Total 7.74 02910.710.2620 Rough grade prep (msf) 0.009 11.7 98.5% 100.0% 0.11 Means 2006 includes O&P 02910.710.3920 Spread topsoil, 4" (msf) 0.009 470 98.5% 100.0% 4.17 Means 2006 includes O&P, includes material 02920.320.320 Hydroseed w/ mulch&fert. - (msf) 0.009 80 46.5 98.5% 100.0% 0.42 Means 2006 includes O&P Trench Support (sf) Total 4.70 02250.400.1800 25' deep exc, drive, extract, salvage 1 553 20 103.4% 100.0% 20.68 Means 2006 includes O&P Dewatering (lf) Total 20.68 Months 1 Depth (ft) 25 Spacing (ft) 200 02240.700.0050 Wells 10-20' deep, ave 0.125 19.4 103.4% 100.0% 2.51 Means 2006 indludes O&P; lineal measure is well spacing/depth 01.54.33.40.4700 Subm pump, 2", 120 gpm -rent 0.005 192 101.8% 100.0% 0.98 Means 2006 includes O&P; qty is months rental 01.54.33.40.2700 Gen, elect, 100 kw -rent 0.005 7.2 98.5% 100.0% 0.04 Means 2006 includes O&P; qty is months-kw; cost is monthy rental per kw 01.54.33.40.2700 Gen, elect, 100 kw -operate 27.23 0.18 98.5% 100.0% 4.83 Means 2006 includes O&P; 10hp = 7.46 kw/hr, 5446 kw/mo; cost is per kw Total 8.36 Maintenance Structure (each) Base unit (10-ft) 1 0.00 Estimate for planning = $2000, See detailed estimate for structures Extension (ft) Concrete Curb Removal and Replacement (lf) 1 0.00 Estimate from special pipe costs is $150/ft, See detailed estimate for structures 02220.250.6100 Removal, Curbs, reinforced (lf) 1 420 4.94 98.5% 100.0% 4.87 Means 2006 includes O&P 02315.490.0550 10 mi rt haul (16.5 cy) - per yard 0.058 15.00 103.4% 100.0% 0.91 Means 2003 includes O&P 02220.330.0100 Disposal - tipping fee (ton) 0.084 70.00 98.5% 100.0% 5.82 Means 2006 includes O&P 02315.110.0300 6" select backfill, no comp (cy) 0.019 18.21 98.5% 100.0% 0.34 Means 2006 includes O&P (material costs + 10%) 02315.310.7000 Compaction, 18" vibrate plate (cy) 0.019 1.86 98.5% 100.0% 0.04 Means 2006 includes O&P 02770.300.0300 Curb, machine form straight (lf) 1 6345 8.25 98.5% 100.0% 8.13 Means 2006 includes O&P Total 20.11 Concrete Walk Removal and Replacement (ft-width) 02220.240.4100 Sidewalk removal, concrete, 4" reinf. (sy) 0.111 8.45 98.5% 100.0% 0.93 Means 2006 02315.490.0550 10 mi rt haul (16.5 cy) - per yard 0.016 15.00 103.4% 100.0% 0.25 Means 2003 includes O&P 02220.330.0100 Disposal - tipping fee (ton) 0.023 70.00 98.5% 100.0% 1.56 Means 2006 includes O&P 02315.110.0300 3" select backfill, no comp (cy) 0.009 18.21 98.5% 100.0% 0.17 Means 2006 includes O&P (material costs + 10%) 02315.310.7000 Compaction, 18" vibrate plate (cy) 0.019 1.86 98.5% 100.0% 0.04 Means 2006 includes O&P 02775.275.0310 Sidewalk, conc. 4" (sf) 1 3.58 98.5% 100.0% 3.53 Means 2006 includes O&P Total 6.48 * Total index except some items use intallation index. * Reference: RSMeans Heavy Construction Cost Data, 20th Annual Edition, 2006. Transmission Main cost estimator_DIP 2007_FINAL.xls, unit_costs Page 1 of 1 3/30/2007 2:53 PM
-
Page 2 and 3:
Acknowledgements This study was con
-
Page 4 and 5:
Contents Recycling Treated Municipa
-
Page 6 and 7:
Contents Recycling Treated Municipa
-
Page 8 and 9:
Executive Summary Vision Executive
-
Page 10 and 11:
Section 1: Introduction 1.1 Project
-
Page 12 and 13:
Table 1.2. Water Use in Minnesota,
-
Page 14 and 15:
Section 1: Introduction Recycling T
-
Page 16 and 17:
1.5 Summary Section 1: Introduction
-
Page 18 and 19:
Section 2: Recycled Wastewater Dema
-
Page 20 and 21:
Section 2: Recycled Wastewater Dema
-
Page 23 and 24:
Section 2: Recycled Wastewater Dema
-
Page 26 and 27:
Figure 2.9. Ground Water Contaminat
-
Page 28:
Section 2: Recycled Wastewater Dema
-
Page 31:
Section 2: Recycled Wastewater Dema
-
Page 35 and 36:
Section 2: Recycled Wastewater Dema
-
Page 38 and 39:
Table 2.8. Ethanol Plant Capacity a
-
Page 40 and 41:
Section 2: Recycled Wastewater Dema
-
Page 42 and 43:
2.7 References Section 2: Recycled
-
Page 44 and 45:
Section 3: Recycled Wastewater Syst
-
Page 46 and 47:
Water Quality Overview The total co
-
Page 48 and 49:
Industrial Water Quality Concerns S
-
Page 50 and 51:
Emerging Contaminants of Concern Se
-
Page 52 and 53:
Section 3: Recycled Wastewater Syst
-
Page 54 and 55:
Section 3: Recycled Wastewater Syst
-
Page 56 and 57:
3.4 Storage and Transmission Overvi
-
Page 58 and 59:
Section 3: Recycled Wastewater Syst
-
Page 60 and 61:
Cost by Standard Industry Categorie
-
Page 62 and 63:
Costs and Planning Considerations S
-
Page 64 and 65:
Section 4: Implementation Considera
-
Page 66 and 67:
Economic Incentives and Risk Assess
-
Page 68 and 69:
Section 5: Summary and Potential Ne
-
Page 70 and 71:
Long-Term Vision Section 5: Summary
-
Page 72:
Exhibit A: California Water Recycli
-
Page 75 and 76:
Metropolitan Council Recycling Trea
-
Page 77 and 78:
Contents Section 1 - Introduction C
-
Page 79 and 80:
Craddock Consulting Engineers In As
-
Page 81 and 82:
Section 1 Introduction Craddock Con
-
Page 83 and 84:
Section 1 Introduction Craddock Con
-
Page 85 and 86:
Section 1 Introduction Craddock Con
-
Page 87 and 88:
Craddock Consulting Engineers 2-1 I
-
Page 89 and 90:
Section 2 Implementation Considerat
-
Page 91 and 92:
Section 2 Implementation Considerat
-
Page 93 and 94:
Section 2 Implementation Considerat
-
Page 95 and 96:
Table 2.4. Examples of State Water
-
Page 97 and 98:
Section 2 Implementation Considerat
-
Page 99 and 100:
Section 2 Implementation Considerat
-
Page 101 and 102:
Section 2 Implementation Considerat
-
Page 103 and 104:
Section 2 Implementation Considerat
-
Page 105 and 106:
Section 2 Implementation Considerat
-
Page 107 and 108:
Section 2 Implementation Considerat
-
Page 109:
Section 2 Implementation Considerat
-
Page 112 and 113:
Section 2 Implementation Considerat
-
Page 114 and 115:
Section 2 Implementation Considerat
-
Page 116 and 117:
Section 2 Implementation Considerat
-
Page 118 and 119:
Craddock Consulting Engineers 3-1 I
-
Page 120 and 121:
Section 3 Inventory of Major WWTPs
-
Page 122 and 123:
Section 3 Inventory of Major WWTPs
-
Page 124 and 125:
Figure 3.6. Industrial Reuse Custom
-
Page 126 and 127:
Section 3 Inventory of Major WWTPs
-
Page 128 and 129:
Figure 3.7b. Ground Water Availabil
-
Page 130 and 131:
Section 3 Inventory of Major WWTPs
-
Page 132 and 133:
") Figure 3.8c. Cedar River Watersh
-
Page 134 and 135:
Section 3 Inventory of Major WWTPs
-
Page 136 and 137:
Section 3 Inventory of Major WWTPs
-
Page 138 and 139:
Section 3 Inventory of Major WWTPs
-
Page 140 and 141:
") ") ") ") Figure 3.10c. Lower Mis
-
Page 142 and 143:
Section 3 Inventory of Major WWTPs
-
Page 144 and 145:
Section 3 Inventory of Major WWTPs
-
Page 146 and 147:
Section 3 Inventory of Major WWTPs
-
Page 148 and 149:
Section 3 Inventory of Major WWTPs
-
Page 150 and 151:
Section 3 Inventory of Major WWTPs
-
Page 152 and 153:
Figure 3.12c. Mississippi River - H
-
Page 154 and 155:
Section 3 Inventory of Major WWTPs
-
Page 156 and 157:
Section 3 Inventory of Major WWTPs
-
Page 158 and 159:
Figure 3.14b. Rainy River Watershed
-
Page 160 and 161:
Section 3 Inventory of Major WWTPs
-
Page 162 and 163:
Section 3 Inventory of Major WWTPs
-
Page 164 and 165:
Section 3 Inventory of Major WWTPs
-
Page 166 and 167:
") Figure 3.16c. St. Croix River Wa
-
Page 168 and 169:
Section 3 Inventory of Major WWTPs
-
Page 170 and 171:
Section 3 Inventory of Major WWTPs
-
Page 172 and 173:
Section 3 Inventory of Major WWTPs
-
Page 174 and 175:
Figure 3.18 Metro Area Industrial R
-
Page 176 and 177:
Section 3 Inventory of Major WWTPs
-
Page 178 and 179:
G G Flying Cloud Dr !! G! G Figure
-
Page 180 and 181:
Section 3 Inventory of Major WWTPs
-
Page 182 and 183:
Figure 3.22. Rogers WWTP - Industri
-
Page 184 and 185:
Section 3 Inventory of Major WWTPs
-
Page 186 and 187:
G G G! Dodd Rd GG Figure 3.24. Rose
-
Page 188 and 189:
Section 3 Inventory of Major WWTPs
-
Page 190 and 191:
G Figure 3.26. Hastings WWTP - Indu
-
Page 192 and 193:
State Hwy 36 ! Figure 3.28. St. Cro
-
Page 194 and 195:
Section 3 Inventory of Major WWTPs
-
Page 196 and 197:
Section 3 Inventory of Major WWTPs
-
Page 198 and 199:
Craddock Consulting Engineers In As
-
Page 200 and 201:
Water Use Code Categories Minnesota
-
Page 202 and 203:
Minnesota Water Use for All Categor
-
Page 204 and 205:
Air Conditioning 0.2% Waterworks 15
-
Page 206 and 207:
Minnesota Water Use, 2000-2004 - St
-
Page 208 and 209:
Minnesota Water Use in 2004 (withou
-
Page 210 and 211:
Minnesota Water Use in 2000 (withou
-
Page 212 and 213:
UseCode by Year Minnesota Power Gen
-
Page 214 and 215:
Water Use (MGD) Water Use (MGD) 350
-
Page 216 and 217:
Minnesota Industrial Processing Fac
-
Page 218 and 219:
Minnesota Industrial Processing Fac
-
Page 220 and 221:
Water Use (MGD) Water Use (MGD) 120
-
Page 222 and 223:
Water Use (MGD) Water Use (MGD) 13.
-
Page 224 and 225:
Craddock Consulting Engineers In As
-
Page 226 and 227:
Overview There are no federal regul
-
Page 228 and 229:
Appendix B Status of Water Reuse Re
-
Page 230 and 231:
Appendix B Status of Water Reuse Re
-
Page 232 and 233:
Table 4. Examples of State Water Re
-
Page 234 and 235:
Appendix B Status of Water Reuse Re
-
Page 236 and 237:
Appendix B Status of Water Reuse Re
-
Page 238 and 239:
Setback Distances Appendix B Status
-
Page 240 and 241:
Appendix B Status of Water Reuse Re
-
Page 242 and 243:
Appendix B Status of Water Reuse Re
-
Page 244 and 245:
Appendix B Status of Water Reuse Re
-
Page 246 and 247:
Craddock Consulting Engineers In As
-
Page 248 and 249:
WATER USE (MGD) WATER USE (MGD) 3.5
-
Page 250 and 251:
Table 3.9a. Industrial Water Use in
-
Page 252 and 253:
Table 3.10a. Industrial Water Use i
-
Page 254 and 255:
Table 3.10d. Industries in the Lowe
-
Page 256 and 257:
WATER USE (MGD) WATER USE (MGD) 8 7
-
Page 258 and 259:
Table 3.11d. Industries in the Minn
-
Page 260 and 261:
Table 3.11d. Industries in the Minn
-
Page 262 and 263:
WATER USE (MGD) WATER USE (MGD) 12
-
Page 264 and 265:
Table 3.12c. Industries in the Miss
-
Page 266 and 267:
Table 3.12c. Industries in the Miss
-
Page 268 and 269:
Table 3.12c. Industries in the Miss
-
Page 270 and 271:
Table 3.12c. Industries in the Miss
-
Page 272 and 273:
Table 3.13a. Industrial Water Use i
-
Page 274 and 275:
Table 3.14a. Industrial Water Use i
-
Page 276 and 277:
Table 3.15a. Industrial Water Use i
-
Page 278 and 279:
WATER USE (MGD) WATER USE (MGD) 2.5
-
Page 280 and 281:
WATER USE (MGD) WATER USE (MGD) 0.8
-
Page 282 and 283:
Table 3.17c. Industries in the West
-
Page 284 and 285:
MN Permit No Facility Minnesota Mun
-
Page 286 and 287:
MN Permit No Facility Minnesota Mun
-
Page 288 and 289:
Craddock Consulting Engineers In As
-
Page 290:
Minnesota DNR Waters 2005 Ground-wa
-
Page 294 and 295:
Craddock Consulting Engineers In As
-
Page 296 and 297:
Permit No. Organization NAICS Code
-
Page 298 and 299:
Permit No. Organization NAICS Code
-
Page 300 and 301:
Permit No. Organization NAICS Code
-
Page 302 and 303:
Permit No. Organization NAICS Code
-
Page 304 and 305:
Permit No. Organization NAICS Code
-
Page 306 and 307:
Permit No. Organization NAICS Code
-
Page 308 and 309:
Permit No. Organization NAICS Code
-
Page 310 and 311:
Metropolitan Council Recycling Trea
-
Page 312 and 313:
TM2: Sampling Plan and Results Recy
-
Page 314 and 315:
TM2: Sampling Plan and Results Recy
-
Page 316 and 317:
TM2: Sampling Plan and Results Recy
-
Page 318 and 319:
TM2: Sampling Plan and Results Recy
-
Page 320 and 321:
TM2: Sampling Plan and Results Recy
-
Page 322 and 323:
TM2: Sampling Plan and Results Recy
-
Page 324 and 325:
TM2: Sampling Plan and Results Recy
-
Page 326 and 327:
Recommended Limits for Various Indu
-
Page 328:
Exhibit B Blue Lake WWTP Sampling R
-
Page 331 and 332:
MCES Blue Lake Plant Final Effluent
-
Page 333 and 334:
Date Day of Wk MCES Blue Lake Plant
-
Page 335 and 336:
Date Day of Wk MCES Blue Lake Plant
-
Page 337 and 338:
Date Day of Wk MCES Blue Lake Plant
-
Page 340 and 341:
MCES Empire Plant Final Effluent Sa
-
Page 342 and 343:
Date Day of Wk 10/24/06 Tuesday 10/
-
Page 344 and 345:
Date Day of Wk 10/24/06 Tuesday 10/
-
Page 346 and 347:
Date Day of Wk 10/24/06 Tuesday 10/
-
Page 348 and 349:
Exhibit D Metropolitan (Metro) WWTP
-
Page 350 and 351:
MCES Metropolitan Plant Final Efflu
-
Page 352 and 353:
Date Day of Wk 4/19/07 Thursday 4/2
-
Page 354 and 355:
Date Day of Wk 4/19/07 Thursday 4/2
-
Page 356 and 357:
Date Day of Wk 4/19/07 Thursday 4/2
-
Page 358 and 359:
MCES Seneca Plant Final Effluent Sa
-
Page 360 and 361:
Date Day of Wk 10/8/06 Sunday 10/9/
-
Page 362 and 363:
Date Day of Wk 10/8/06 Sunday 10/9/
-
Page 364 and 365:
Date Day of Wk 10/8/06 Sunday 10/9/
-
Page 366 and 367:
Metropolitan Council Recycling Trea
-
Page 368 and 369:
Section 5 - Costs Table of Contents
-
Page 370 and 371:
TM3: Recycled Wastewater System Com
-
Page 372 and 373:
TM3: Recycled Wastewater System Com
-
Page 374 and 375:
WWTP 1 - 2 - 3 - 4 - 5 - 1 Treatmen
-
Page 376 and 377:
TM3: Recycled Wastewater System Com
-
Page 378 and 379:
TM3: Recycled Wastewater System Com
-
Page 380 and 381:
TM3: Recycled Wastewater System Com
-
Page 382:
o Synthetic medium o Two-stage Surf
-
Page 385 and 386:
TM3: Recycled Wastewater System Com
-
Page 387 and 388:
TM3: Recycled Wastewater System Com
-
Page 389 and 390:
TM3: Recycled Wastewater System Com
-
Page 391 and 392:
TM3: Recycled Wastewater System Com
-
Page 393 and 394:
TM3: Recycled Wastewater System Com
-
Page 395 and 396:
TM3: Recycled Wastewater System Com
-
Page 397 and 398:
TM3: Recycled Wastewater System Com
-
Page 399 and 400:
TM3: Recycled Wastewater System Com
-
Page 401 and 402:
TM3: Recycled Wastewater System Com
-
Page 403 and 404:
Table 13 WATER REUSE SYSTEM COST OF
-
Page 405 and 406:
TM3: Recycled Wastewater System Com
-
Page 407 and 408:
TM3: Recycled Wastewater System Com
-
Page 409 and 410:
Cost of Service, $/1000 gallon 1.00
-
Page 411 and 412:
TM3: Recycled Wastewater System Com
-
Page 413 and 414:
TM3: Recycled Wastewater System Com
-
Page 415 and 416:
TM3: Recycled Wastewater System Com
-
Page 417 and 418:
TM3: Recycled Wastewater System Com
-
Page 419 and 420:
Cost of Service, $/1000 gallons 8.0
-
Page 421 and 422:
TM3: Recycled Wastewater System Com
-
Page 423 and 424:
Appendix A Water Reuse Regulatory E
-
Page 425 and 426:
Table A-1. 2000 California Water Re
-
Page 427 and 428:
California Department of Health Ser
-
Page 429 and 430:
Other Media Type Filters Fuzzy Filt
-
Page 431 and 432:
Appendix B TECHNICAL MEMORANDUM Rec
-
Page 433 and 434:
Appendix B Reclaimed Water Transmis
-
Page 435 and 436:
Exhibit 1 Transmission Main Cost To
-
Page 437 and 438:
Pipe Installation Data (DR 18 PVC P
-
Page 439 and 440:
Equipment Costs (with O&P) Item Des
-
Page 441:
Water Reuse Pipe Line Construction
-
Page 445 and 446:
Crew Costs (with O&P) St. Paul Pres
-
Page 447 and 448:
Capital PROJECT Cost Curves for Rec
-
Page 449 and 450:
Diam (in) Annual Average Day Flow A
-
Page 451 and 452:
Diam (in) Annual Average Day Flow A
-
Page 453 and 454:
Pipe Capital Project Cost, $ Millio
-
Page 455 and 456:
Pipe Capital Project Cost, $/1000 g
-
Page 457 and 458:
Capital PROJECT Cost Curves for Rec
-
Page 459 and 460:
Capital PROJECT Cost Curves for Rec
-
Page 461 and 462:
Annual Pipe Average Annual Velocity
-
Page 463 and 464:
Pipe Capital Project Cost, $ Millio
-
Page 465 and 466:
Exhibit 3 Water Reuse System O&M Co
-
Page 467 and 468:
Diam (in) Annual Average Day Flow (
-
Page 469 and 470:
Diam (in) Annual Average Day Flow (
-
Page 471 and 472:
Diam (in) Annual Average Day Flow (
-
Page 473 and 474:
Diam (in) Annual Average Day Flow (
-
Page 475 and 476:
Pumping Cost, $/1000 gallons 0.095
-
Page 477 and 478:
Water Reuse System Estimated Cost o
-
Page 479 and 480:
WATER REUSE SYSTEM COST OF SERVICE
-
Page 481 and 482:
WATER REUSE SYSTEM COST OF SERVICE
-
Page 483 and 484:
WATER REUSE SYSTEM COST OF SERVICE
-
Page 485 and 486:
WATER REUSE SYSTEM COST OF SERVICE
-
Page 487 and 488:
WATER REUSE SYSTEM COST OF SERVICE
-
Page 489 and 490:
Appendix D-1 Water Reuse System Cos
-
Page 491 and 492:
Water Reuse System Estimates of Pro
-
Page 493 and 494:
Cost of Service, $/1000 gallon 2.00
-
Page 495 and 496:
Cost Curves as Basis for Tertiary 1
-
Page 497 and 498:
Cost Curves as Basis for Tertiary 1
-
Page 499 and 500:
Water Reuse System Estimated Cost o
-
Page 501 and 502:
Cost of Service, $/1000 gallon 10.0
-
Page 503 and 504:
Cost Curves as Basis for Tertiary 2
-
Page 505 and 506:
Appendix D-3 Water Reuse System Cos
-
Page 507 and 508:
Water Reuse System Estimates of Pro
-
Page 509 and 510:
Cost of Service, $/1000 gallon 5.00
-
Page 511 and 512:
Cost Curves as Basis for Tertiary 3
-
Page 513 and 514:
Water Reuse System Estimated Cost o
-
Page 515 and 516:
Cost of Service, $/1000 gallon 10.0
-
Page 517 and 518:
Cost Curves as Basis for Tertiary 4
-
Page 519 and 520:
Appendix D-5 Water Reuse System Cos
-
Page 521 and 522:
Water Reuse System Estimates of Pro
-
Page 523 and 524:
Cost of Service, $/1000 gallon 5.00
-
Page 525 and 526:
Appendix D-6 Water Reuse System Cos
-
Page 527 and 528:
Water Reuse System Estimates of Pro
-
Page 529 and 530:
Cost of Service, $/1000 gallon 5.00
-
Page 531 and 532:
Cost Curves as Basis for Tertiary 4
-
Page 533 and 534:
Secondary Treatment Assumptions Sus
-
Page 535 and 536:
Secondary Treatment Assumptions Sus
-
Page 537 and 538:
Secondary Treatment Assumptions Sus
-
Page 539 and 540:
Secondary Treatment Assumptions Sus
-
Page 541 and 542:
Craddock Consulting Engineers 1 In
-
Page 543 and 544:
TM4: WWTP Effluent Quality Recyclin
-
Page 545 and 546:
!( !( !( !( !( !( !( !( !( !( !( !(
-
Page 547 and 548:
TM4: WWTP Effluent Quality Recyclin
-
Page 549 and 550:
Frequency of Occurrence, % Frequenc
-
Page 551 and 552:
No. of Plants Total Permitting Desi
-
Page 553 and 554:
TM4: WWTP Effluent Quality Recyclin
-
Page 555 and 556:
!( !( !( !( !( !( !( !( !( !( !( !(
-
Page 557 and 558:
TM4: WWTP Effluent Quality Recyclin
-
Page 559 and 560:
Frequency of Occurrence, % Frequenc
-
Page 561 and 562:
No. of Plants Total Permitting Desi
-
Page 563 and 564:
TM4: WWTP Effluent Quality Recyclin
-
Page 565 and 566:
!( !( !( !( !( !( !( !( !( !( !( !(
-
Page 567 and 568:
TM4: WWTP Effluent Quality Recyclin
-
Page 569 and 570:
Craddock Consulting Engineers 1 In
-
Page 571 and 572:
1.0 Introduction This technical mem
-
Page 573 and 574:
Exhibit A Regulatory Stakeholder Me
-
Page 575 and 576:
MCES Recycling Treated Wastewater f
-
Page 577 and 578:
MCES Recycling Treated Wastewater f
-
Page 579 and 580:
Municipal Wastewater Reuse Regulato
-
Page 581 and 582:
MCES Recycling Treated Wastewater f
-
Page 583 and 584:
Exhibit B Industry Stakeholder Meet
-
Page 585 and 586:
Recycling Treated Wastewater For In
-
Page 587 and 588:
Institutional Issues Topic Discussi
-
Page 589 and 590:
Institutional Issues Topic Discussi
-
Page 591 and 592:
Recycling Treated Wastewater For In
-
Page 593 and 594:
Recycling Treated Wastewater For In
-
Page 595 and 596:
Recycling Treated Wastewater For In
-
Page 597 and 598:
Recycling Treated Wastewater For In
-
Page 599 and 600:
Exhibit C Broader Base Stakeholder
-
Page 601 and 602:
Recycling Treated Wastewater For In
-
Page 603 and 604:
Recycling Treated Wastewater For In
-
Page 605 and 606:
Recycling Treated Wastewater For In
-
Page 607 and 608:
Recycling Treated Wastewater For In
-
Page 609 and 610:
Recycling Treated Wastewater For In
-
Page 611 and 612:
Recycling Treated Wastewater For In