Recycling Treated Municipal Wastewater for Industrial Water Use
Recycling Treated Municipal Wastewater for Industrial Water Use Recycling Treated Municipal Wastewater for Industrial Water Use
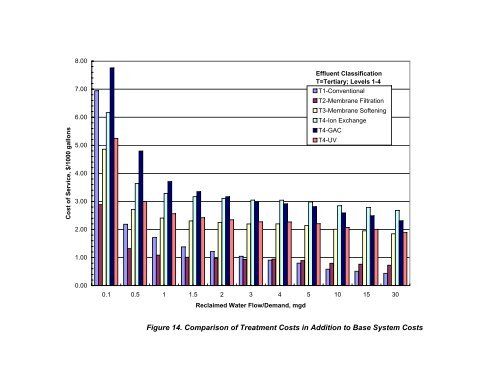
Cost of Service, $/1000 gallons 8.00 7.00 6.00 5.00 4.00 3.00 2.00 1.00 0.00 Effluent Classification T=Tertiary; Levels 1-4 T1-Conventional T2-Membrane Filtration T3-Membrane Softening T4-Ion Exchange T4-GAC T4-UV 0.1 0.5 1 1.5 2 3 4 5 10 15 30 Reclaimed Water Flow/Demand, mgd Figure 14. Comparison of Treatment Costs in Addition to Base System Costs
TM3: Recycled Wastewater System Components and Costs Recycling Treated Municipal Wastewater for Industrial Water Use Table 17. Comparison of Treatment Costs for Different Reclaimed Water Quality Supplies* Cost of Service for Treatment, $/1000 gallons Tertiary 1 Tertiary 2 Tertiary 3 Tertiary 4 Flow/ Conven- Membrane Membrane Ion Demand, mgd tional Filtration Softening Exchange GAC UV 0.1 6.94 2.89 4.86 6.16 7.76 5.25 0.5 2.19 1.32 2.71 3.64 4.79 3.00 1 1.71 1.09 2.41 3.29 3.71 2.56 1.5 1.38 1.01 2.30 3.17 3.35 2.42 2 1.21 0.97 2.25 3.11 3.17 2.35 3 1.05 0.94 2.20 3.05 2.98 2.27 4 0.91 0.95 2.20 3.04 2.92 2.27 5 0.80 0.90 2.14 2.98 2.81 2.20 10 0.58 0.80 2.01 2.85 2.59 2.08 15 0.51 0.76 1.95 2.79 2.49 2.01 30 0.44 0.73 1.85 2.68 2.31 1.89 *In addition to water reuse base system costs 5.7 Cost Summary The cost analysis indicates that there are economically viable applications to provide treated wastewater effluent as a water supply to industries. The technology is available and as competition increases in the membrane market, more economical solutions can be anticipated to meet the specific water quality needs for a spectrum of industries in Minnesota. Treatment costs were estimated to range from $0.50/1000 gallons for larger supplies (30 mgd) with water quality suitable for cooling water to over $7.00/1000 gallons for smaller supplies (0.1 mgd) treated to meet stringent industrial water requirements. To provide a comparison of total system costs, a 5-mile transmission system was evaluated as shown in Figure 15. The cost to deliver reclaimed water, inclusive of transmission costs, and administrative/laboratory costs ranges from about $0.80 - $16.50/1000 gallons. The potential costs for a reclaimed water supply are shown in Table 18 for the general industry categories. Costs are listed for the treatment and total system costs of a 5mile transmission system. Appendices C (base system) and D (alternative water supplies) provide the detailed cost curves to identify specific costs for different flows and transmission distances. As expected, the range of costs is broad given the diversity of industries in these general industry categories and the variable water quality of WWTP effluent. The higher costs reflect treatment to achieve water quality concentrations lower than in the incoming water supply of most industries. Most industries treat their own permitted supply or potable supply to achieve the higher quality of Tertiary-4 class Craddock Consulting Engineers 41 In Association with CDM & James Crook TM3-Component&Costs_0707
- Page 366 and 367: Metropolitan Council Recycling Trea
- Page 368 and 369: Section 5 - Costs Table of Contents
- Page 370 and 371: TM3: Recycled Wastewater System Com
- Page 372 and 373: TM3: Recycled Wastewater System Com
- Page 374 and 375: WWTP 1 - 2 - 3 - 4 - 5 - 1 Treatmen
- Page 376 and 377: TM3: Recycled Wastewater System Com
- Page 378 and 379: TM3: Recycled Wastewater System Com
- Page 380 and 381: TM3: Recycled Wastewater System Com
- Page 382: o Synthetic medium o Two-stage Surf
- Page 385 and 386: TM3: Recycled Wastewater System Com
- Page 387 and 388: TM3: Recycled Wastewater System Com
- Page 389 and 390: TM3: Recycled Wastewater System Com
- Page 391 and 392: TM3: Recycled Wastewater System Com
- Page 393 and 394: TM3: Recycled Wastewater System Com
- Page 395 and 396: TM3: Recycled Wastewater System Com
- Page 397 and 398: TM3: Recycled Wastewater System Com
- Page 399 and 400: TM3: Recycled Wastewater System Com
- Page 401 and 402: TM3: Recycled Wastewater System Com
- Page 403 and 404: Table 13 WATER REUSE SYSTEM COST OF
- Page 405 and 406: TM3: Recycled Wastewater System Com
- Page 407 and 408: TM3: Recycled Wastewater System Com
- Page 409 and 410: Cost of Service, $/1000 gallon 1.00
- Page 411 and 412: TM3: Recycled Wastewater System Com
- Page 413 and 414: TM3: Recycled Wastewater System Com
- Page 415: TM3: Recycled Wastewater System Com
- Page 419 and 420: Cost of Service, $/1000 gallons 8.0
- Page 421 and 422: TM3: Recycled Wastewater System Com
- Page 423 and 424: Appendix A Water Reuse Regulatory E
- Page 425 and 426: Table A-1. 2000 California Water Re
- Page 427 and 428: California Department of Health Ser
- Page 429 and 430: Other Media Type Filters Fuzzy Filt
- Page 431 and 432: Appendix B TECHNICAL MEMORANDUM Rec
- Page 433 and 434: Appendix B Reclaimed Water Transmis
- Page 435 and 436: Exhibit 1 Transmission Main Cost To
- Page 437 and 438: Pipe Installation Data (DR 18 PVC P
- Page 439 and 440: Equipment Costs (with O&P) Item Des
- Page 441 and 442: Water Reuse Pipe Line Construction
- Page 443 and 444: Construction Unit Costs Item (2006
- Page 445 and 446: Crew Costs (with O&P) St. Paul Pres
- Page 447 and 448: Capital PROJECT Cost Curves for Rec
- Page 449 and 450: Diam (in) Annual Average Day Flow A
- Page 451 and 452: Diam (in) Annual Average Day Flow A
- Page 453 and 454: Pipe Capital Project Cost, $ Millio
- Page 455 and 456: Pipe Capital Project Cost, $/1000 g
- Page 457 and 458: Capital PROJECT Cost Curves for Rec
- Page 459 and 460: Capital PROJECT Cost Curves for Rec
- Page 461 and 462: Annual Pipe Average Annual Velocity
- Page 463 and 464: Pipe Capital Project Cost, $ Millio
- Page 465 and 466: Exhibit 3 Water Reuse System O&M Co
Cost of Service, $/1000 gallons<br />
8.00<br />
7.00<br />
6.00<br />
5.00<br />
4.00<br />
3.00<br />
2.00<br />
1.00<br />
0.00<br />
Effluent Classification<br />
T=Tertiary; Levels 1-4<br />
T1-Conventional<br />
T2-Membrane Filtration<br />
T3-Membrane Softening<br />
T4-Ion Exchange<br />
T4-GAC<br />
T4-UV<br />
0.1 0.5 1 1.5 2 3 4 5 10 15 30<br />
Reclaimed <strong>Water</strong> Flow/Demand, mgd<br />
Figure 14. Comparison of Treatment Costs in Addition to Base System Costs


