Recycling Treated Municipal Wastewater for Industrial Water Use
Recycling Treated Municipal Wastewater for Industrial Water Use Recycling Treated Municipal Wastewater for Industrial Water Use
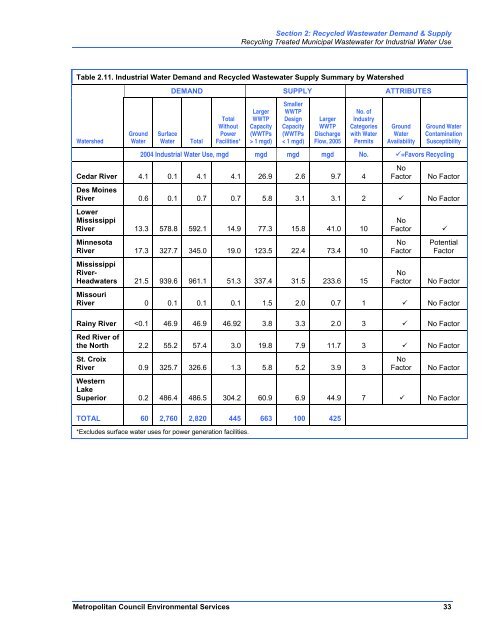
Section 2: Recycled Wastewater Demand & Supply Recycling Treated Municipal Wastewater for Industrial Water Use Table 2.11. Industrial Water Demand and Recycled Wastewater Supply Summary by Watershed Watershed Ground Water DEMAND SUPPLY ATTRIBUTES Surface Water Total Total Without Power Facilities* Larger WWTP Capacity (WWTPs > 1 mgd) Smaller WWTP Design Capacity (WWTPs < 1 mgd) Larger WWTP Discharge Flow, 2005 No. of Industry Categories with Water Permits Ground Water Availability Ground Water Contamination Susceptibility 2004 Industrial Water Use, mgd mgd mgd mgd No. =Favors Recycling Cedar River 4.1 0.1 4.1 4.1 26.9 2.6 9.7 4 No Factor No Factor Des Moines River 0.6 0.1 0.7 0.7 5.8 3.1 3.1 2 No Factor Lower Mississippi River 13.3 578.8 592.1 14.9 77.3 15.8 41.0 10 Minnesota River 17.3 327.7 345.0 19.0 123.5 22.4 73.4 10 Mississippi River- Headwaters 21.5 939.6 961.1 51.3 337.4 31.5 233.6 15 No Factor No Factor Potential Factor No Factor No Factor Missouri River 0 0.1 0.1 0.1 1.5 2.0 0.7 1 No Factor Rainy River
Section 2: Recycled Wastewater Demand & Supply Recycling Treated Municipal Wastewater for Industrial Water Use Factors Influencing Potential for Industrial Use of Recycled Wastewater The availability of higher quality ground water, typically sought first for municipal and industrial purposes, is a key factor in planning for growth in most of Minnesota. The summary of watershed inventories presented in Table 2.11 includes the assessment of indicators favoring recycled wastewater applications. This high level assessment indicates several areas of the state with limited ground water supplies. These areas are in the Des Moines River and Missouri River watersheds, in the southwest part of the state, northwestern Minnesota in parts of the Red River of the North watershed, and in the Rainy River and Western Lake Superior watersheds, in north central and northeastern Minnesota. The water requirements for ethanol facilities in the southwest part of the state have prompted agencies and industries to work together to meet immediate water demands while protecting the aquifer supplies for long-term use. There are also community-specific water supply limitations in quality and quantity. Ground water contamination is found throughout the state and certain aquifer characteristics make some aquifers a less reliable supply, as in the karst area of the Lower Mississippi River watershed. In general, the water quality of an area and susceptibility to contamination must be assessed on a site specific basis. Community-level planning has usually been used to assess water supply needs in Minnesota. Planning has moved to the watershed level as observed in the state’s water-limited areas of the Des Moines River, Missouri River, and Red River watersheds. Water supply planning, including identification of future water supply limitations, has encompassed a regional scale in the 7-county Twin Cities metro area, as directed under Minnesota Statutes, Section 473.1565. As the state moves forward with TMDL development and new WWTPs or existing ones are expanded, evaluations of wastewater recycling facilities to reduce pollutant discharges are expected to become more prevalent. However, municipalities will not be able to recycle without partners – industries and other wastewater recycle customers need to commit to meeting their water demands with this alternative supply. As observed in the expansion of the ethanol industry and the construction of the Mankato Energy Center – a limited water supply was the key factor that led to consideration of a recycled wastewater supply. While other drivers may lead to wastewater recycling partnerships between municipalities and industries, the most significant driver in the near-term is expected to be water supply limitations, principally ground water supplies limited by quantity or quality issues. 34 Metropolitan Council Environmental Services
- Page 2 and 3: Acknowledgements This study was con
- Page 4 and 5: Contents Recycling Treated Municipa
- Page 6 and 7: Contents Recycling Treated Municipa
- Page 8 and 9: Executive Summary Vision Executive
- Page 10 and 11: Section 1: Introduction 1.1 Project
- Page 12 and 13: Table 1.2. Water Use in Minnesota,
- Page 14 and 15: Section 1: Introduction Recycling T
- Page 16 and 17: 1.5 Summary Section 1: Introduction
- Page 18 and 19: Section 2: Recycled Wastewater Dema
- Page 20 and 21: Section 2: Recycled Wastewater Dema
- Page 23 and 24: Section 2: Recycled Wastewater Dema
- Page 26 and 27: Figure 2.9. Ground Water Contaminat
- Page 28: Section 2: Recycled Wastewater Dema
- Page 31: Section 2: Recycled Wastewater Dema
- Page 35 and 36: Section 2: Recycled Wastewater Dema
- Page 38 and 39: Table 2.8. Ethanol Plant Capacity a
- Page 42 and 43: 2.7 References Section 2: Recycled
- Page 44 and 45: Section 3: Recycled Wastewater Syst
- Page 46 and 47: Water Quality Overview The total co
- Page 48 and 49: Industrial Water Quality Concerns S
- Page 50 and 51: Emerging Contaminants of Concern Se
- Page 52 and 53: Section 3: Recycled Wastewater Syst
- Page 54 and 55: Section 3: Recycled Wastewater Syst
- Page 56 and 57: 3.4 Storage and Transmission Overvi
- Page 58 and 59: Section 3: Recycled Wastewater Syst
- Page 60 and 61: Cost by Standard Industry Categorie
- Page 62 and 63: Costs and Planning Considerations S
- Page 64 and 65: Section 4: Implementation Considera
- Page 66 and 67: Economic Incentives and Risk Assess
- Page 68 and 69: Section 5: Summary and Potential Ne
- Page 70 and 71: Long-Term Vision Section 5: Summary
- Page 72: Exhibit A: California Water Recycli
- Page 75 and 76: Metropolitan Council Recycling Trea
- Page 77 and 78: Contents Section 1 - Introduction C
- Page 79 and 80: Craddock Consulting Engineers In As
- Page 81 and 82: Section 1 Introduction Craddock Con
- Page 83 and 84: Section 1 Introduction Craddock Con
- Page 85 and 86: Section 1 Introduction Craddock Con
- Page 87 and 88: Craddock Consulting Engineers 2-1 I
- Page 89 and 90: Section 2 Implementation Considerat
Section 2: Recycled <strong>Wastewater</strong> Demand & Supply<br />
<strong>Recycling</strong> <strong>Treated</strong> <strong>Municipal</strong> <strong>Wastewater</strong> <strong>for</strong> <strong>Industrial</strong> <strong>Water</strong> <strong>Use</strong><br />
Table 2.11. <strong>Industrial</strong> <strong>Water</strong> Demand and Recycled <strong>Wastewater</strong> Supply Summary by <strong>Water</strong>shed<br />
<strong>Water</strong>shed<br />
Ground<br />
<strong>Water</strong><br />
DEMAND SUPPLY ATTRIBUTES<br />
Surface<br />
<strong>Water</strong> Total<br />
Total<br />
Without<br />
Power<br />
Facilities*<br />
Larger<br />
WWTP<br />
Capacity<br />
(WWTPs<br />
> 1 mgd)<br />
Smaller<br />
WWTP<br />
Design<br />
Capacity<br />
(WWTPs<br />
< 1 mgd)<br />
Larger<br />
WWTP<br />
Discharge<br />
Flow, 2005<br />
No. of<br />
Industry<br />
Categories<br />
with <strong>Water</strong><br />
Permits<br />
Ground<br />
<strong>Water</strong><br />
Availability<br />
Ground <strong>Water</strong><br />
Contamination<br />
Susceptibility<br />
2004 <strong>Industrial</strong> <strong>Water</strong> <strong>Use</strong>, mgd mgd mgd mgd No. =Favors <strong>Recycling</strong><br />
Cedar River 4.1 0.1 4.1 4.1 26.9 2.6 9.7 4<br />
No<br />
Factor No Factor<br />
Des Moines<br />
River 0.6 0.1 0.7 0.7 5.8 3.1 3.1 2 No Factor<br />
Lower<br />
Mississippi<br />
River 13.3 578.8 592.1 14.9 77.3 15.8 41.0 10<br />
Minnesota<br />
River 17.3 327.7 345.0 19.0 123.5 22.4 73.4 10<br />
Mississippi<br />
River-<br />
Headwaters 21.5 939.6 961.1 51.3 337.4 31.5 233.6 15<br />
No<br />
Factor <br />
No<br />
Factor<br />
Potential<br />
Factor<br />
No<br />
Factor No Factor<br />
Missouri<br />
River 0 0.1 0.1 0.1 1.5 2.0 0.7 1 No Factor<br />
Rainy River


