Recycling Treated Municipal Wastewater for Industrial Water Use
Recycling Treated Municipal Wastewater for Industrial Water Use Recycling Treated Municipal Wastewater for Industrial Water Use
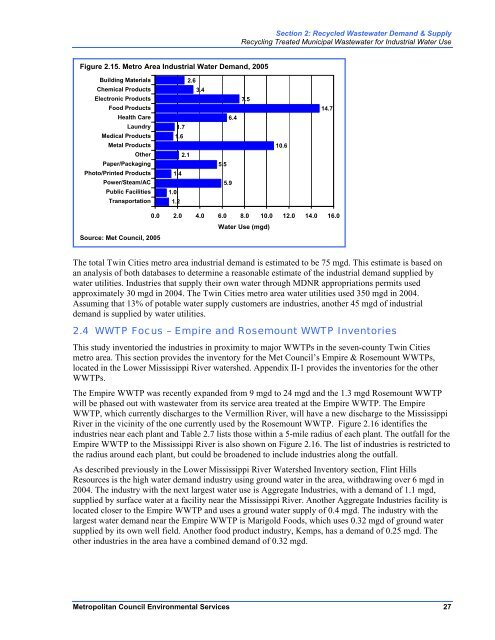
Figure 2.15. Metro Area Industrial Water Demand, 2005 Building Materials Chemical Products Electronic Products Food Products Health Care Laundry Medical Products Metal Products Other Paper/Packaging Photo/Printed Products Power/Steam/AC Public Facilities Transportation Source: Met Council, 2005 1.0 1.7 1.6 1.4 1.2 2.1 2.6 3.4 5.5 5.9 6.4 Section 2: Recycled Wastewater Demand & Supply Recycling Treated Municipal Wastewater for Industrial Water Use 7.5 0.0 2.0 4.0 6.0 8.0 10.0 12.0 14.0 16.0 Water Use (mgd) The total Twin Cities metro area industrial demand is estimated to be 75 mgd. This estimate is based on an analysis of both databases to determine a reasonable estimate of the industrial demand supplied by water utilities. Industries that supply their own water through MDNR appropriations permits used approximately 30 mgd in 2004. The Twin Cities metro area water utilities used 350 mgd in 2004. Assuming that 13% of potable water supply customers are industries, another 45 mgd of industrial demand is supplied by water utilities. 2.4 WWTP Focus – Empire and Rosemount WWTP Inventories This study inventoried the industries in proximity to major WWTPs in the seven-county Twin Cities metro area. This section provides the inventory for the Met Council’s Empire & Rosemount WWTPs, located in the Lower Mississippi River watershed. Appendix II-1 provides the inventories for the other WWTPs. The Empire WWTP was recently expanded from 9 mgd to 24 mgd and the 1.3 mgd Rosemount WWTP will be phased out with wastewater from its service area treated at the Empire WWTP. The Empire WWTP, which currently discharges to the Vermillion River, will have a new discharge to the Mississippi River in the vicinity of the one currently used by the Rosemount WWTP. Figure 2.16 identifies the industries near each plant and Table 2.7 lists those within a 5-mile radius of each plant. The outfall for the Empire WWTP to the Mississippi River is also shown on Figure 2.16. The list of industries is restricted to the radius around each plant, but could be broadened to include industries along the outfall. As described previously in the Lower Mississippi River Watershed Inventory section, Flint Hills Resources is the high water demand industry using ground water in the area, withdrawing over 6 mgd in 2004. The industry with the next largest water use is Aggregate Industries, with a demand of 1.1 mgd, supplied by surface water at a facility near the Mississippi River. Another Aggregate Industries facility is located closer to the Empire WWTP and uses a ground water supply of 0.4 mgd. The industry with the largest water demand near the Empire WWTP is Marigold Foods, which uses 0.32 mgd of ground water supplied by its own well field. Another food product industry, Kemps, has a demand of 0.25 mgd. The other industries in the area have a combined demand of 0.32 mgd. Metropolitan Council Environmental Services 27 10.6 14.7
Section 2: Recycled Wastewater Demand & Supply Recycling Treated Municipal Wastewater for Industrial Water Use Figure 2.16. Industries in Proximity to Empire & Rosemount WWTPs • • ••••, • • Ash St Rosemount W\MTb Empire Outfall (Construction Complet 220th 5t E 5-mlle Radius 10m'" RadIus • Agricultural Processing ... WWTP • • 0.00 - 0.50 mgd • Industrial Process Cooling Major Rivers + • 0.51 - 1.50 mgd Metal Processing Highway +. 1.51 - 5.00 mgd 0 Non-Metallic Processing • Ground Water +. • 5.01 - 10.00 mgd Petroleum-Chemical Processing Surface Water • +• • 10.01 - 25.00 mgd Power Generation + Municipal Water +. • 25.01 - 505.00 mgd Sand and Gravel Washing .. Municipality N D 2.5 SMiles A I I I Sources: Minnesota DNR Water Appropriation Permit Program, 2004 Metropolitan Councillnduslrial Dischargers Permit Program, 2005 28 Metropolitan Council Environmental Services
- Page 2 and 3: Acknowledgements This study was con
- Page 4 and 5: Contents Recycling Treated Municipa
- Page 6 and 7: Contents Recycling Treated Municipa
- Page 8 and 9: Executive Summary Vision Executive
- Page 10 and 11: Section 1: Introduction 1.1 Project
- Page 12 and 13: Table 1.2. Water Use in Minnesota,
- Page 14 and 15: Section 1: Introduction Recycling T
- Page 16 and 17: 1.5 Summary Section 1: Introduction
- Page 18 and 19: Section 2: Recycled Wastewater Dema
- Page 20 and 21: Section 2: Recycled Wastewater Dema
- Page 23 and 24: Section 2: Recycled Wastewater Dema
- Page 26 and 27: Figure 2.9. Ground Water Contaminat
- Page 28: Section 2: Recycled Wastewater Dema
- Page 31: Section 2: Recycled Wastewater Dema
- Page 38 and 39: Table 2.8. Ethanol Plant Capacity a
- Page 40 and 41: Section 2: Recycled Wastewater Dema
- Page 42 and 43: 2.7 References Section 2: Recycled
- Page 44 and 45: Section 3: Recycled Wastewater Syst
- Page 46 and 47: Water Quality Overview The total co
- Page 48 and 49: Industrial Water Quality Concerns S
- Page 50 and 51: Emerging Contaminants of Concern Se
- Page 52 and 53: Section 3: Recycled Wastewater Syst
- Page 54 and 55: Section 3: Recycled Wastewater Syst
- Page 56 and 57: 3.4 Storage and Transmission Overvi
- Page 58 and 59: Section 3: Recycled Wastewater Syst
- Page 60 and 61: Cost by Standard Industry Categorie
- Page 62 and 63: Costs and Planning Considerations S
- Page 64 and 65: Section 4: Implementation Considera
- Page 66 and 67: Economic Incentives and Risk Assess
- Page 68 and 69: Section 5: Summary and Potential Ne
- Page 70 and 71: Long-Term Vision Section 5: Summary
- Page 72: Exhibit A: California Water Recycli
- Page 75 and 76: Metropolitan Council Recycling Trea
- Page 77 and 78: Contents Section 1 - Introduction C
- Page 79 and 80: Craddock Consulting Engineers In As
- Page 81 and 82: Section 1 Introduction Craddock Con
Figure 2.15. Metro Area <strong>Industrial</strong> <strong>Water</strong> Demand, 2005<br />
Building Materials<br />
Chemical Products<br />
Electronic Products<br />
Food Products<br />
Health Care<br />
Laundry<br />
Medical Products<br />
Metal Products<br />
Other<br />
Paper/Packaging<br />
Photo/Printed Products<br />
Power/Steam/AC<br />
Public Facilities<br />
Transportation<br />
Source: Met Council, 2005<br />
1.0<br />
1.7<br />
1.6<br />
1.4<br />
1.2<br />
2.1<br />
2.6<br />
3.4<br />
5.5<br />
5.9<br />
6.4<br />
Section 2: Recycled <strong>Wastewater</strong> Demand & Supply<br />
<strong>Recycling</strong> <strong>Treated</strong> <strong>Municipal</strong> <strong>Wastewater</strong> <strong>for</strong> <strong>Industrial</strong> <strong>Water</strong> <strong>Use</strong><br />
7.5<br />
0.0 2.0 4.0 6.0 8.0 10.0 12.0 14.0 16.0<br />
<strong>Water</strong> <strong>Use</strong> (mgd)<br />
The total Twin Cities metro area industrial demand is estimated to be 75 mgd. This estimate is based on<br />
an analysis of both databases to determine a reasonable estimate of the industrial demand supplied by<br />
water utilities. Industries that supply their own water through MDNR appropriations permits used<br />
approximately 30 mgd in 2004. The Twin Cities metro area water utilities used 350 mgd in 2004.<br />
Assuming that 13% of potable water supply customers are industries, another 45 mgd of industrial<br />
demand is supplied by water utilities.<br />
2.4 WWTP Focus – Empire and Rosemount WWTP Inventories<br />
This study inventoried the industries in proximity to major WWTPs in the seven-county Twin Cities<br />
metro area. This section provides the inventory <strong>for</strong> the Met Council’s Empire & Rosemount WWTPs,<br />
located in the Lower Mississippi River watershed. Appendix II-1 provides the inventories <strong>for</strong> the other<br />
WWTPs.<br />
The Empire WWTP was recently expanded from 9 mgd to 24 mgd and the 1.3 mgd Rosemount WWTP<br />
will be phased out with wastewater from its service area treated at the Empire WWTP. The Empire<br />
WWTP, which currently discharges to the Vermillion River, will have a new discharge to the Mississippi<br />
River in the vicinity of the one currently used by the Rosemount WWTP. Figure 2.16 identifies the<br />
industries near each plant and Table 2.7 lists those within a 5-mile radius of each plant. The outfall <strong>for</strong> the<br />
Empire WWTP to the Mississippi River is also shown on Figure 2.16. The list of industries is restricted to<br />
the radius around each plant, but could be broadened to include industries along the outfall.<br />
As described previously in the Lower Mississippi River <strong>Water</strong>shed Inventory section, Flint Hills<br />
Resources is the high water demand industry using ground water in the area, withdrawing over 6 mgd in<br />
2004. The industry with the next largest water use is Aggregate Industries, with a demand of 1.1 mgd,<br />
supplied by surface water at a facility near the Mississippi River. Another Aggregate Industries facility is<br />
located closer to the Empire WWTP and uses a ground water supply of 0.4 mgd. The industry with the<br />
largest water demand near the Empire WWTP is Marigold Foods, which uses 0.32 mgd of ground water<br />
supplied by its own well field. Another food product industry, Kemps, has a demand of 0.25 mgd. The<br />
other industries in the area have a combined demand of 0.32 mgd.<br />
Metropolitan Council Environmental Services 27<br />
10.6<br />
14.7


