Recycling Treated Municipal Wastewater for Industrial Water Use
Recycling Treated Municipal Wastewater for Industrial Water Use Recycling Treated Municipal Wastewater for Industrial Water Use
Recommended Limits for Various Industrial Water Uses Constituent Unit Limit 1 Limit 2 Limit 3 Limit 4 Limit 5 Limit 6 Limit 7 Limit 8 Limit 9 Alkalinity (as CaCO3) mg/L 20-350 Limit 10 Limit 11 Limit 12 350 100 40 * * * 125 * * * 400 20 Aluminum (Al) mg/L 0.1 5 0.1 0.01 * * * * * * * * 0.5 Ammonia (NH3) mg/L 24 0.1 0.1 0.1 * * * * * * * * * Bicarbonate (HCO 3) mg/L 25-200 170 120 48 * * * 128 * * * * * Calcium (Ca) mg/L 50 * 0.4 0.01 * 20 20 68 75 * * * * Carbonaceous Biochemical Oxygen Demand (CBOD) mg/L * * * * * * * * * * * * * Chemical Oxygen Demand (COD) Chloride (Cl) mg/L * 5 5 1 * * * * * * * * * mg/L 500 * * * 1000 200 200 500 300 * * 250 2 Color * * * * 30 30 10 20 * 5 5 * * Copper (Cu) mg/L * * * * * * * * 0.05 0.01 * * * Dissolved Oxygen (DO) mg/L * 2.5 0.007 0.007 * * * * * * * * * E. Coli * * * * * * * * * * * * * Fecal Coliform * * * * * * * * * * * * * 130- Hardness (as CaCO3) mg/L 650 350 1 0.07 * 100 100 250 350 25 25 * 20 Iron (Fe) mg/L 0.5 1 0.3 0.05 0.3 1 0.1 0.1 1 0.3 0.1 2.5 0.05 Magnesium (Mg) mg/L * * 0.25 0.01 * 12 12 19 30 * * * * Manganese (Mn) mg/L 0.5 0.3 0.1 0.01 0.1 0.5 0.05 0.1 * 0.05 0.01 0.5 0.01 Nitrate (NO 3) mg/L * * * * * * * 5 * * * * * Orthophosphate (PO 4) mg/L * * * * * * * * * * * * * Phosphorus (total: TP) mg/L 1 * * * * * * * * * * * 1 pH * * * * 6-10 6-10 6-10 6.2-8.3 6-9 * * 6.5-8.5 6.5-8.5 Silicondioxide (SiO 2) or Silica mg/L 50 30 10 0.7 * 50 50 50 * * * 35 * Sulfate (SO 4) mg/L 200 * * * * * * 100 * * * 250 3 Total Coliform * * * * * * * * * * * * * Total Dissolved Solids (TDS) mg/L 500 700 500 200 * * * 1000 1000 100 100 600 * Total Organic Carbon (TOC) mg/L * * * * * * * * * * * * 6 Total Suspended Solids (TSS) mg/L 100 10 5 0.5 * 10 10 5 10 5 5 500 0.5 Turbidity * * * * * * * * * * * * * Zinc (Zn) mg/L * * 0.01 0.01 * * * * * * * * * 2 Cooling Water (USEPA, 2004); variable range related to amount of recycling and materials of construction; high range is typically maximum in blowdown/final water 2 Industrial Boiler Feed Water (low pressure) (Table 2-8, Technical Memorandum "Recycling Treated Wastewater for Industrial Water Use in Minneosta: Implementation Issues and Customer Inventory) 3 Industrial Boiler Feed Water (medium pressure) (Table 2-8, Technical Memorandum "Recycling Treated Wastewater for Industrial Water Use in Minneosta: Implementation Issues and Customer Invento 4 Industrial Boiler Feed Water (high pressure) (Table 2-8, Technical Memorandum "Recycling Treated Wastewater for Industrial Water Use in Minneosta: Implementation Issues and Customer Inventory) 5 Pulp & Paper (Mechanical Pulping) (USEPA, 2004) 6 Pulp & Paper (Chemical, Unbleached)(USEPA, 2004) 7 Pulp & Paper (bleached) (USEPA, 2004) 8 Chemical Processing (USEPA, 2004) 9 Petrochem & Coal (USEPA, 2004) 10 Textile (Sizing Suspension) (USEPA, 2004) 11 Textile (Scouring, Bleach & Dye) (USEPA, 2004) 12 Cement (USEPA, 2004) 13 Ethanol process water (personal communications with undisclosed ethanol plant developers) Reuse Sampling Data Summary_0707-for TM2.xls, Limits Page 1 of 1 7/7/2007 1:32 PM Limit 13
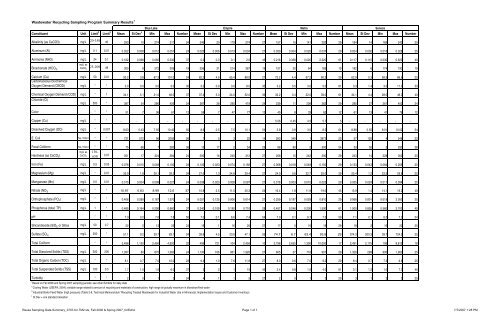
Wastewater Recycling Sampling Program Summary Results 1 Constituent Unit Limit 2 Limit 3 Mean St Dev 4 Min Max Number Mean St Dev Min Max Number Mean St Dev Min Max Number Mean St Dev Min Max Number Alkalinity (as CaCO3) mg/L 20-350 40 293 10 274 311 24 246 20 179 274 27 157 15 141 202 29 184 14 169 242 25 Aluminum (Al) mg/L 0.1 0.01 0.022 0.008 0.012 0.051 24 0.023 0.006 0.013 0.034 27 0.030 0.004 0.020 0.037 29 0.024 0.002 0.018 0.028 25 Ammonia (NH3) mg/L 24 0.1 0.182 0.068 0.060 0.330 37 0.2 0.3 0.1 2.0 43 0.216 0.338 0.020 2.320 61 0.117 0.110 0.030 0.620 40 Bicarbonate (HCO 3) mg/L as CaCO 3 25-200 48 300 8 272 309 19 256 31 214 367 19 157 20 84 185 19 182 6 174 193 19 Calcium (Ca) mg/L 50 0.01 93.2 3.8 87.3 101.0 24 82.2 4.5 65.4 88.0 27 72.2 4.4 67.2 80.2 29 62.9 5.3 58.5 86.6 25 Carbonaceous Biochemical Oxygen Demand (CBOD) mg/L * * 3.0 0.0 3.0 3.0 30 3.2 0.9 3.0 8.0 35 3.2 0.5 3.0 5.0 61 3.3 1.4 3.0 11.0 33 Chemical Oxygen Demand (COD) mg/L * 1 34.1 5.1 21.0 48.0 37 37.4 5.0 24.0 52.0 39 32.2 3.4 22.0 39.0 61 34.1 4.4 28.0 48.0 40 Chloride (Cl) mg/L 500 * 387 34 280 426 24 387 28 295 419 24 239 11 208 262 29 285 27 261 402 24 Color * * 51 7 36 61 12 58 7 47 77 12 45 8 33 62 12 61 13 41 78 12 Copper (Cu) mg/L * * - - - - - - - - - - 5.06 0.45 4.5 5.7 5 - - - - - Dissolved Oxygen (DO) mg/L * 0.007 8.63 0.43 7.50 10.40 50 8.6 0.5 7.5 10.1 54 5.8 0.9 3.0 8.5 61 8.88 0.55 8.01 10.02 54 E. Coli No./100ml * * 731 572 96 2092 26 7 5 3 22 14 283 349 1 3973 22 57 120 4 548 22 Fecal Coliform No./100ml * * 75 66 7 260 36 15 17 2 54 29 68 80 2 500 54 33 55 2 290 38 Hardness (as CaCO 3) mg/L as CaCO 3 130- 650 0.07 351 17 324 384 24 293 16 240 312 27 258 15 242 290 29 243 14 228 302 25 Iron (Fe) mg/L 0.5 0.05 0.076 0.015 0.048 0.100 24 0.105 0.023 0.074 0.192 27 0.068 0.018 0.049 0.150 29 0.133 0.043 0.084 0.256 25 Magnesium (Mg) mg/L * 0.01 35.9 1.8 30.1 39.3 24 27.6 1.3 24.8 29.4 27 24.0 0.6 22.7 25.0 29 25.4 1.2 23.5 29.8 25 Manganese (Mn) mg/L 0.5 0.01 0.015 0.004 0.009 0.027 24 0.038 0.023 0.008 0.097 27 0.016 0.003 0.010 0.023 29 0.035 0.024 0.011 0.094 25 Nitrate (NO 3) mg/L * * 10.97 0.83 8.99 12.6 37 15.8 2.5 11.5 20.3 24 16.4 1.8 11.9 19.0 45 15.9 1.4 14.1 19.2 40 Orthophosphate (PO 4) mg/L * * 0.406 0.289 0.167 1.370 24 0.057 0.125 0.006 0.614 27 0.259 0.197 0.093 0.810 29 0.968 0.801 0.019 3.050 25 Phosphorus (total: TP) mg/L 1 * 0.485 0.164 0.290 0.860 37 0.340 0.109 0.190 0.710 28 0.457 0.246 0.200 1.500 61 1.500 0.855 0.560 3.700 40 pH * * 7.3 0.2 7.0 7.8 50 7.0 0.1 6.6 7.4 54 7.0 0.1 6.7 7.3 59 7.1 0.1 6.5 7.3 54 Silicondioxide (SiO 2) or Silica mg/L 50 0.7 22 2 13 23 24 19 1 16 20 27 17 0 16 18 29 18 2 16 22 25 Sulfate (SO 4) mg/L 200 * 51.1 9.2 39.7 83.1 24 39.8 4.5 23.8 47.1 26 74.7 6.7 63.4 93.8 29 374.3 200.3 39.7 724.2 25 Total Coliform * * 3,496 1,150 2,450 4,920 22 499 721 104 2,450 10 3,798 2,655 1,300 10,000 17 2,491 2,175 106 8,812 18 Total Dissolved Solids (TDS) mg/L 500 200 1,097 80 875 1,260 24 1,130 166 961 1,920 27 805 37 716 907 29 1,326 299 900 1,960 25 Total Organic Carbon (TOC) mg/L * * 8.1 0.7 7.0 10.0 23 9.4 1.0 7.6 11.8 27 8.0 0.6 7.0 9.2 29 8.4 0.7 7.3 9.6 25 Total Suspended Solids (TSS) mg/L 100 0.5 1.7 1.0 1.0 6.0 37 3 2 1 15 43 2.4 0.8 1.0 4.0 61 3.1 1.2 1.0 7.0 40 Turbidity * * 2 0 1 3 24 4 1 1 5 27 2 0 1 3 29 3 1 2 5 25 1 Based on Fall 2006 and Spring 2007 sampling periods; see other Exhibits for daily data 2 Cooling Water (USEPA, 2004); variable range related to amount of recycling and materials of construction; high range is typically maximum in blowdown/final water 3 Industrial Boiler Feed Water (high pressure) (Table 2-8, Technical Memorandum "Recycling Treated Wastewater for Industrial Water Use in Minneosta: Implementation Issues and Customer Inventory) 4 St Dev = one standard deviation Blue Lake Empire Metro Reuse Sampling Data Summary_0707-for TM2.xls, Fall 2006 & Spring 2007_forExhA Page 1 of 1 7/7/2007 1:28 PM Seneca
- Page 276 and 277: Table 3.15a. Industrial Water Use i
- Page 278 and 279: WATER USE (MGD) WATER USE (MGD) 2.5
- Page 280 and 281: WATER USE (MGD) WATER USE (MGD) 0.8
- Page 282 and 283: Table 3.17c. Industries in the West
- Page 284 and 285: MN Permit No Facility Minnesota Mun
- Page 286 and 287: MN Permit No Facility Minnesota Mun
- Page 288 and 289: Craddock Consulting Engineers In As
- Page 290: Minnesota DNR Waters 2005 Ground-wa
- Page 294 and 295: Craddock Consulting Engineers In As
- Page 296 and 297: Permit No. Organization NAICS Code
- Page 298 and 299: Permit No. Organization NAICS Code
- Page 300 and 301: Permit No. Organization NAICS Code
- Page 302 and 303: Permit No. Organization NAICS Code
- Page 304 and 305: Permit No. Organization NAICS Code
- Page 306 and 307: Permit No. Organization NAICS Code
- Page 308 and 309: Permit No. Organization NAICS Code
- Page 310 and 311: Metropolitan Council Recycling Trea
- Page 312 and 313: TM2: Sampling Plan and Results Recy
- Page 314 and 315: TM2: Sampling Plan and Results Recy
- Page 316 and 317: TM2: Sampling Plan and Results Recy
- Page 318 and 319: TM2: Sampling Plan and Results Recy
- Page 320 and 321: TM2: Sampling Plan and Results Recy
- Page 322 and 323: TM2: Sampling Plan and Results Recy
- Page 324 and 325: TM2: Sampling Plan and Results Recy
- Page 328: Exhibit B Blue Lake WWTP Sampling R
- Page 331 and 332: MCES Blue Lake Plant Final Effluent
- Page 333 and 334: Date Day of Wk MCES Blue Lake Plant
- Page 335 and 336: Date Day of Wk MCES Blue Lake Plant
- Page 337 and 338: Date Day of Wk MCES Blue Lake Plant
- Page 340 and 341: MCES Empire Plant Final Effluent Sa
- Page 342 and 343: Date Day of Wk 10/24/06 Tuesday 10/
- Page 344 and 345: Date Day of Wk 10/24/06 Tuesday 10/
- Page 346 and 347: Date Day of Wk 10/24/06 Tuesday 10/
- Page 348 and 349: Exhibit D Metropolitan (Metro) WWTP
- Page 350 and 351: MCES Metropolitan Plant Final Efflu
- Page 352 and 353: Date Day of Wk 4/19/07 Thursday 4/2
- Page 354 and 355: Date Day of Wk 4/19/07 Thursday 4/2
- Page 356 and 357: Date Day of Wk 4/19/07 Thursday 4/2
- Page 358 and 359: MCES Seneca Plant Final Effluent Sa
- Page 360 and 361: Date Day of Wk 10/8/06 Sunday 10/9/
- Page 362 and 363: Date Day of Wk 10/8/06 Sunday 10/9/
- Page 364 and 365: Date Day of Wk 10/8/06 Sunday 10/9/
- Page 366 and 367: Metropolitan Council Recycling Trea
- Page 368 and 369: Section 5 - Costs Table of Contents
- Page 370 and 371: TM3: Recycled Wastewater System Com
- Page 372 and 373: TM3: Recycled Wastewater System Com
- Page 374 and 375: WWTP 1 - 2 - 3 - 4 - 5 - 1 Treatmen
<strong>Wastewater</strong> <strong>Recycling</strong> Sampling Program Summary Results 1<br />
Constituent Unit Limit 2 Limit 3<br />
Mean St Dev 4<br />
Min Max Number Mean St Dev Min Max Number Mean St Dev Min Max Number Mean St Dev Min Max Number<br />
Alkalinity (as CaCO3) mg/L 20-350 40 293 10 274 311 24 246 20 179 274 27 157 15 141 202 29 184 14 169 242 25<br />
Aluminum (Al) mg/L 0.1 0.01 0.022 0.008 0.012 0.051 24 0.023 0.006 0.013 0.034 27 0.030 0.004 0.020 0.037 29 0.024 0.002 0.018 0.028 25<br />
Ammonia (NH3) mg/L 24 0.1 0.182 0.068 0.060 0.330 37 0.2 0.3 0.1 2.0 43 0.216 0.338 0.020 2.320 61 0.117 0.110 0.030 0.620 40<br />
Bicarbonate (HCO 3)<br />
mg/L as<br />
CaCO 3 25-200 48 300 8 272 309 19 256 31 214 367 19 157 20 84 185 19 182 6 174 193 19<br />
Calcium (Ca) mg/L 50 0.01 93.2 3.8 87.3 101.0 24 82.2 4.5 65.4 88.0 27 72.2 4.4 67.2 80.2 29 62.9 5.3 58.5 86.6 25<br />
Carbonaceous Biochemical<br />
Oxygen Demand (CBOD) mg/L * * 3.0 0.0 3.0 3.0 30 3.2 0.9 3.0 8.0 35 3.2 0.5 3.0 5.0 61 3.3 1.4 3.0 11.0 33<br />
Chemical Oxygen Demand (COD) mg/L * 1 34.1 5.1 21.0 48.0 37 37.4 5.0 24.0 52.0 39 32.2 3.4 22.0 39.0 61 34.1 4.4 28.0 48.0 40<br />
Chloride (Cl)<br />
mg/L 500 * 387 34 280 426 24 387 28 295 419 24 239 11 208 262 29 285 27 261 402 24<br />
Color * * 51 7 36 61 12 58 7 47 77 12 45 8 33 62 12 61 13 41 78 12<br />
Copper (Cu) mg/L * * - - - - - - - - - - 5.06 0.45 4.5 5.7 5 - - - - -<br />
Dissolved Oxygen (DO) mg/L * 0.007 8.63 0.43 7.50 10.40 50 8.6 0.5 7.5 10.1 54 5.8 0.9 3.0 8.5 61 8.88 0.55 8.01 10.02 54<br />
E. Coli No./100ml * * 731 572 96 2092 26 7 5 3 22 14 283 349 1 3973 22 57 120 4 548 22<br />
Fecal Coli<strong>for</strong>m No./100ml * * 75 66 7 260 36 15 17 2 54 29 68 80 2 500 54 33 55 2 290 38<br />
Hardness (as CaCO 3)<br />
mg/L as<br />
CaCO 3<br />
130-<br />
650 0.07 351 17 324 384 24 293 16 240 312 27 258 15 242 290 29 243 14 228 302 25<br />
Iron (Fe) mg/L 0.5 0.05 0.076 0.015 0.048 0.100 24 0.105 0.023 0.074 0.192 27 0.068 0.018 0.049 0.150 29 0.133 0.043 0.084 0.256 25<br />
Magnesium (Mg) mg/L * 0.01 35.9 1.8 30.1 39.3 24 27.6 1.3 24.8 29.4 27 24.0 0.6 22.7 25.0 29 25.4 1.2 23.5 29.8 25<br />
Manganese (Mn) mg/L 0.5 0.01 0.015 0.004 0.009 0.027 24 0.038 0.023 0.008 0.097 27 0.016 0.003 0.010 0.023 29 0.035 0.024 0.011 0.094 25<br />
Nitrate (NO 3) mg/L * * 10.97 0.83 8.99 12.6 37 15.8 2.5 11.5 20.3 24 16.4 1.8 11.9 19.0 45 15.9 1.4 14.1 19.2 40<br />
Orthophosphate (PO 4) mg/L * * 0.406 0.289 0.167 1.370 24 0.057 0.125 0.006 0.614 27 0.259 0.197 0.093 0.810 29 0.968 0.801 0.019 3.050 25<br />
Phosphorus (total: TP) mg/L 1 * 0.485 0.164 0.290 0.860 37 0.340 0.109 0.190 0.710 28 0.457 0.246 0.200 1.500 61 1.500 0.855 0.560 3.700 40<br />
pH * * 7.3 0.2 7.0 7.8 50 7.0 0.1 6.6 7.4 54 7.0 0.1 6.7 7.3 59 7.1 0.1 6.5 7.3 54<br />
Silicondioxide (SiO 2) or Silica mg/L 50 0.7 22 2 13 23 24 19 1 16 20 27 17 0 16 18 29 18 2 16 22 25<br />
Sulfate (SO 4) mg/L 200 * 51.1 9.2 39.7 83.1 24 39.8 4.5 23.8 47.1 26 74.7 6.7 63.4 93.8 29 374.3 200.3 39.7 724.2 25<br />
Total Coli<strong>for</strong>m * * 3,496 1,150 2,450 4,920 22 499 721 104 2,450 10 3,798 2,655 1,300 10,000 17 2,491 2,175 106 8,812 18<br />
Total Dissolved Solids (TDS) mg/L 500 200 1,097 80 875 1,260 24 1,130 166 961 1,920 27 805 37 716 907 29 1,326 299 900 1,960 25<br />
Total Organic Carbon (TOC) mg/L * * 8.1 0.7 7.0 10.0 23 9.4 1.0 7.6 11.8 27 8.0 0.6 7.0 9.2 29 8.4 0.7 7.3 9.6 25<br />
Total Suspended Solids (TSS) mg/L 100 0.5 1.7 1.0 1.0 6.0 37 3 2 1 15 43 2.4 0.8 1.0 4.0 61 3.1 1.2 1.0 7.0 40<br />
Turbidity * * 2 0 1 3 24 4 1 1 5 27 2 0 1 3 29 3 1 2 5 25<br />
1<br />
Based on Fall 2006 and Spring 2007 sampling periods; see other Exhibits <strong>for</strong> daily data<br />
2<br />
Cooling <strong>Water</strong> (USEPA, 2004); variable range related to amount of recycling and materials of construction; high range is typically maximum in blowdown/final water<br />
3 <strong>Industrial</strong> Boiler Feed <strong>Water</strong> (high pressure) (Table 2-8, Technical Memorandum "<strong>Recycling</strong> <strong>Treated</strong> <strong>Wastewater</strong> <strong>for</strong> <strong>Industrial</strong> <strong>Water</strong> <strong>Use</strong> in Minneosta: Implementation Issues and Customer Inventory)<br />
4 St Dev = one standard deviation<br />
Blue Lake Empire Metro<br />
Reuse Sampling Data Summary_0707-<strong>for</strong> TM2.xls, Fall 2006 & Spring 2007_<strong>for</strong>ExhA Page 1 of 1 7/7/2007 1:28 PM<br />
Seneca


