Recycling Treated Municipal Wastewater for Industrial Water Use
Recycling Treated Municipal Wastewater for Industrial Water Use Recycling Treated Municipal Wastewater for Industrial Water Use
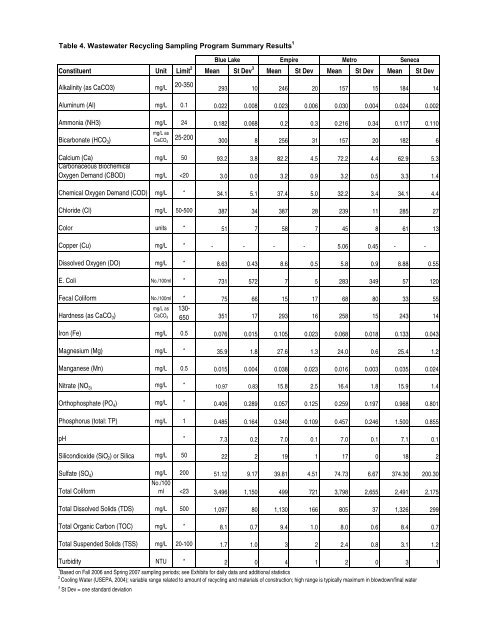
TM2: Sampling Plan and Results Recycling Treated Municipal Wastewater for Industrial Water Use Samples were collected at four Council WWTPs: Blue Lake Empire Metropolitan Seneca 3.0 Sampling Results The sampling program developed for this project provided an initial base of information that was used for various tasks in the project, including: general characterizations of effluent water quality for Minnesota WWTPs plant-specific information to compare the effluent quality of the Council’s four largest WWTPs This technical memorandum serves to document the data and provide summary information on the effluent quality of the four Council WWTPs evaluated. 3.1 General Summary The constituents analyzed in this project’s sampling program, indicate that hardness and salt concentrations occur at concentration thresholds of concern for a range of industrial water uses. Similar to the results of Technical Memorandum 5, Wastewater Treatment Plant Effluent Quality, which reviewed general water quality parameters for all of Minnesota’s WWTPs, the NPDES permitted constituents for the four WWTPs were well below required limits and had low variability in the samples measured. Table 4 provides the mean and standard deviation of the samples collected for the Fall 2006 and Spring 2007 sampling periods. The recommended limits for each constituent as it relates to cooling water uses, is provided in the third column. Exhibit A provides additional statistics for this table, such as minimum and maximum values, and the number of samples the statistics are based upon. It also contains recommended limits for various industrial water uses in a format similar to Table 4. Exhibits B-D provide data for each WWTP. The Fall 2006 sampling data were evaluated with time series plots to look for any outliers and see if any trends existed. Given that this is a small data set (8-28 samples), this effort was used more to screen and identify any gross trends. Additional data will need to be reviewed over a longer period of time to define any trends. 6 Craddock Consulting Engineers In Association with CDM & James Crook TM2-Sampling_0707.doc
Table 4. Wastewater Recycling Sampling Program Summary Results 1 Constituent Unit Limit 2 Alkalinity (as CaCO3) mg/L 20-350 Mean St Dev 3 Mean St Dev Mean St Dev Mean St Dev 293 10 246 20 157 15 184 14 Aluminum (Al) mg/L 0.1 0.022 0.008 0.023 0.006 0.030 0.004 0.024 0.002 Ammonia (NH3) mg/L 24 0.182 0.068 0.2 0.3 0.216 0.34 0.117 0.110 Bicarbonate (HCO 3) mg/L as CaCO 3 25-200 300 8 256 31 157 20 182 6 Calcium (Ca) mg/L 50 93.2 3.8 82.2 4.5 72.2 4.4 62.9 5.3 Carbonaceous Biochemical Oxygen Demand (CBOD) mg/L
- Page 266 and 267: Table 3.12c. Industries in the Miss
- Page 268 and 269: Table 3.12c. Industries in the Miss
- Page 270 and 271: Table 3.12c. Industries in the Miss
- Page 272 and 273: Table 3.13a. Industrial Water Use i
- Page 274 and 275: Table 3.14a. Industrial Water Use i
- Page 276 and 277: Table 3.15a. Industrial Water Use i
- Page 278 and 279: WATER USE (MGD) WATER USE (MGD) 2.5
- Page 280 and 281: WATER USE (MGD) WATER USE (MGD) 0.8
- Page 282 and 283: Table 3.17c. Industries in the West
- Page 284 and 285: MN Permit No Facility Minnesota Mun
- Page 286 and 287: MN Permit No Facility Minnesota Mun
- Page 288 and 289: Craddock Consulting Engineers In As
- Page 290: Minnesota DNR Waters 2005 Ground-wa
- Page 294 and 295: Craddock Consulting Engineers In As
- Page 296 and 297: Permit No. Organization NAICS Code
- Page 298 and 299: Permit No. Organization NAICS Code
- Page 300 and 301: Permit No. Organization NAICS Code
- Page 302 and 303: Permit No. Organization NAICS Code
- Page 304 and 305: Permit No. Organization NAICS Code
- Page 306 and 307: Permit No. Organization NAICS Code
- Page 308 and 309: Permit No. Organization NAICS Code
- Page 310 and 311: Metropolitan Council Recycling Trea
- Page 312 and 313: TM2: Sampling Plan and Results Recy
- Page 314 and 315: TM2: Sampling Plan and Results Recy
- Page 318 and 319: TM2: Sampling Plan and Results Recy
- Page 320 and 321: TM2: Sampling Plan and Results Recy
- Page 322 and 323: TM2: Sampling Plan and Results Recy
- Page 324 and 325: TM2: Sampling Plan and Results Recy
- Page 326 and 327: Recommended Limits for Various Indu
- Page 328: Exhibit B Blue Lake WWTP Sampling R
- Page 331 and 332: MCES Blue Lake Plant Final Effluent
- Page 333 and 334: Date Day of Wk MCES Blue Lake Plant
- Page 335 and 336: Date Day of Wk MCES Blue Lake Plant
- Page 337 and 338: Date Day of Wk MCES Blue Lake Plant
- Page 340 and 341: MCES Empire Plant Final Effluent Sa
- Page 342 and 343: Date Day of Wk 10/24/06 Tuesday 10/
- Page 344 and 345: Date Day of Wk 10/24/06 Tuesday 10/
- Page 346 and 347: Date Day of Wk 10/24/06 Tuesday 10/
- Page 348 and 349: Exhibit D Metropolitan (Metro) WWTP
- Page 350 and 351: MCES Metropolitan Plant Final Efflu
- Page 352 and 353: Date Day of Wk 4/19/07 Thursday 4/2
- Page 354 and 355: Date Day of Wk 4/19/07 Thursday 4/2
- Page 356 and 357: Date Day of Wk 4/19/07 Thursday 4/2
- Page 358 and 359: MCES Seneca Plant Final Effluent Sa
- Page 360 and 361: Date Day of Wk 10/8/06 Sunday 10/9/
- Page 362 and 363: Date Day of Wk 10/8/06 Sunday 10/9/
- Page 364 and 365: Date Day of Wk 10/8/06 Sunday 10/9/
Table 4. <strong>Wastewater</strong> <strong>Recycling</strong> Sampling Program Summary Results 1<br />
Constituent Unit Limit 2<br />
Alkalinity (as CaCO3) mg/L 20-350<br />
Mean St Dev 3<br />
Mean St Dev Mean St Dev Mean St Dev<br />
293 10 246 20 157 15 184 14<br />
Aluminum (Al) mg/L 0.1 0.022 0.008 0.023 0.006 0.030 0.004 0.024 0.002<br />
Ammonia (NH3) mg/L 24 0.182 0.068 0.2 0.3 0.216 0.34 0.117 0.110<br />
Bicarbonate (HCO 3)<br />
mg/L as<br />
CaCO 3<br />
25-200<br />
300 8 256 31 157 20 182 6<br />
Calcium (Ca) mg/L 50 93.2 3.8 82.2 4.5 72.2 4.4 62.9 5.3<br />
Carbonaceous Biochemical<br />
Oxygen Demand (CBOD) mg/L


