Recycling Treated Municipal Wastewater for Industrial Water Use
Recycling Treated Municipal Wastewater for Industrial Water Use Recycling Treated Municipal Wastewater for Industrial Water Use
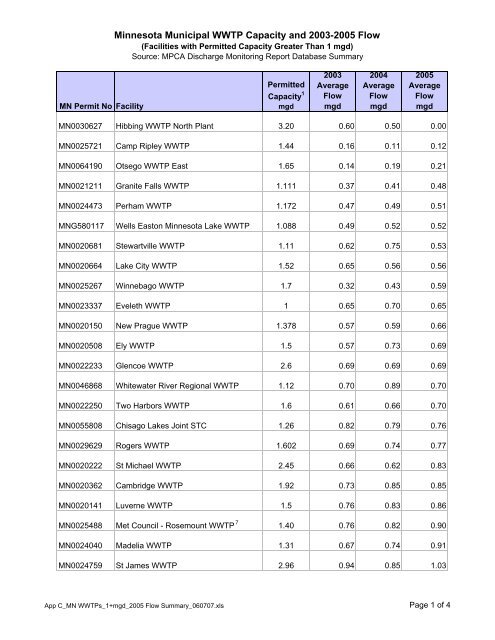
MN Permit No Facility Minnesota Municipal WWTP Capacity and 2003-2005 Flow (Facilities with Permitted Capacity Greater Than 1 mgd) Source: MPCA Discharge Monitoring Report Database Summary Permitted Capacity 1 mgd 2003 Average Flow mgd 2004 Average Flow mgd 2005 Average Flow mgd MN0030627 Hibbing WWTP North Plant 3.20 0.60 0.50 0.00 MN0025721 Camp Ripley WWTP 1.44 0.16 0.11 0.12 MN0064190 Otsego WWTP East 1.65 0.14 0.19 0.21 MN0021211 Granite Falls WWTP 1.111 0.37 0.41 0.48 MN0024473 Perham WWTP 1.172 0.47 0.49 0.51 MNG580117 Wells Easton Minnesota Lake WWTP 1.088 0.49 0.52 0.52 MN0020681 Stewartville WWTP 1.11 0.62 0.75 0.53 MN0020664 Lake City WWTP 1.52 0.65 0.56 0.56 MN0025267 Winnebago WWTP 1.7 0.32 0.43 0.59 MN0023337 Eveleth WWTP 1 0.65 0.70 0.65 MN0020150 New Prague WWTP 1.378 0.57 0.59 0.66 MN0020508 Ely WWTP 1.5 0.57 0.73 0.69 MN0022233 Glencoe WWTP 2.6 0.69 0.69 0.69 MN0046868 Whitewater River Regional WWTP 1.12 0.70 0.89 0.70 MN0022250 Two Harbors WWTP 1.6 0.61 0.66 0.70 MN0055808 Chisago Lakes Joint STC 1.26 0.82 0.79 0.76 MN0029629 Rogers WWTP 1.602 0.69 0.74 0.77 MN0020222 St Michael WWTP 2.45 0.66 0.62 0.83 MN0020362 Cambridge WWTP 1.92 0.73 0.85 0.85 MN0020141 Luverne WWTP 1.5 0.76 0.83 0.86 MN0025488 Met Council - Rosemount WWTP 7 1.40 0.76 0.82 0.90 MN0024040 Madelia WWTP 1.31 0.67 0.74 0.91 MN0024759 St James WWTP 2.96 0.94 0.85 1.03 App C_MN WWTPs_1+mgd_2005 Flow Summary_060707.xls Page 1 of 4
MN Permit No Facility Minnesota Municipal WWTP Capacity and 2003-2005 Flow (Facilities with Permitted Capacity Greater Than 1 mgd) Source: MPCA Discharge Monitoring Report Database Summary Permitted Capacity 1 mgd 2003 Average Flow mgd 2004 Average Flow mgd 2005 Average Flow mgd MN0055361 Plainview-Elgin Sanitary District WWTP 1.421 0.73 0.92 1.05 MN0022462 Bemidji WWTP 2.5 1.09 1.05 1.06 MN0022217 Windom WWTP 1.83 0.98 0.98 1.07 MN0020133 Montevideo WWTP 3 0.88 0.96 1.08 MN0021423 Crookston WWTP 1.4 0.94 1.23 1.12 MN0022535 St Peter WWTP 4.00 0.93 1.40 1.17 MN0020761 Little Falls WWTP 2.4 1.33 1.05 1.18 MN0020788 Elk River WWTP 2.2 1.08 1.14 1.19 MN0020567 Monticello WWTP 2.36 1.08 1.11 1.19 MN0021814 East Grand Forks WWTP 1.4 1.12 1.19 1.19 MN0020192 Detroit Lakes WWTP North Koochiching Area Sanitary District 3 1.07 1.21 1.26 MN0020257 (NKASD) WWTP 2.3 0.84 1.16 1.26 MN0021431 Thief River Falls WWTP 2.14 1.24 1.40 1.45 MN0023973 Litchfield WWTP 1.9 1.40 1.47 1.51 MN0020796 Waseca WWTP 3.5 1.16 1.56 1.58 MN0029955 Met Council - Hastings WWTP 5 2.69 1.62 1.61 1.59 MN0030112 Fairmont WWTP 3.9 1.10 1.36 1.60 MN0040649 Buffalo WWTP 3.6 1.39 1.40 1.63 MN0050628 Fergus Falls WWTP 2.81 1.73 1.82 1.91 MN0031186 Worthington WWTP 4 1.74 1.83 1.99 MN0020290 Melrose WWTP 2.5 2.10 2.01 2.00 MN0024571 Red Wing WWTP 4 2.51 2.49 2.06 MN0024368 Northfield WWTP 5.2 2.12 2.14 2.07 App C_MN WWTPs_1+mgd_2005 Flow Summary_060707.xls Page 2 of 4
- Page 234 and 235: Appendix B Status of Water Reuse Re
- Page 236 and 237: Appendix B Status of Water Reuse Re
- Page 238 and 239: Setback Distances Appendix B Status
- Page 240 and 241: Appendix B Status of Water Reuse Re
- Page 242 and 243: Appendix B Status of Water Reuse Re
- Page 244 and 245: Appendix B Status of Water Reuse Re
- Page 246 and 247: Craddock Consulting Engineers In As
- Page 248 and 249: WATER USE (MGD) WATER USE (MGD) 3.5
- Page 250 and 251: Table 3.9a. Industrial Water Use in
- Page 252 and 253: Table 3.10a. Industrial Water Use i
- Page 254 and 255: Table 3.10d. Industries in the Lowe
- Page 256 and 257: WATER USE (MGD) WATER USE (MGD) 8 7
- Page 258 and 259: Table 3.11d. Industries in the Minn
- Page 260 and 261: Table 3.11d. Industries in the Minn
- Page 262 and 263: WATER USE (MGD) WATER USE (MGD) 12
- Page 264 and 265: Table 3.12c. Industries in the Miss
- Page 266 and 267: Table 3.12c. Industries in the Miss
- Page 268 and 269: Table 3.12c. Industries in the Miss
- Page 270 and 271: Table 3.12c. Industries in the Miss
- Page 272 and 273: Table 3.13a. Industrial Water Use i
- Page 274 and 275: Table 3.14a. Industrial Water Use i
- Page 276 and 277: Table 3.15a. Industrial Water Use i
- Page 278 and 279: WATER USE (MGD) WATER USE (MGD) 2.5
- Page 280 and 281: WATER USE (MGD) WATER USE (MGD) 0.8
- Page 282 and 283: Table 3.17c. Industries in the West
- Page 286 and 287: MN Permit No Facility Minnesota Mun
- Page 288 and 289: Craddock Consulting Engineers In As
- Page 290: Minnesota DNR Waters 2005 Ground-wa
- Page 294 and 295: Craddock Consulting Engineers In As
- Page 296 and 297: Permit No. Organization NAICS Code
- Page 298 and 299: Permit No. Organization NAICS Code
- Page 300 and 301: Permit No. Organization NAICS Code
- Page 302 and 303: Permit No. Organization NAICS Code
- Page 304 and 305: Permit No. Organization NAICS Code
- Page 306 and 307: Permit No. Organization NAICS Code
- Page 308 and 309: Permit No. Organization NAICS Code
- Page 310 and 311: Metropolitan Council Recycling Trea
- Page 312 and 313: TM2: Sampling Plan and Results Recy
- Page 314 and 315: TM2: Sampling Plan and Results Recy
- Page 316 and 317: TM2: Sampling Plan and Results Recy
- Page 318 and 319: TM2: Sampling Plan and Results Recy
- Page 320 and 321: TM2: Sampling Plan and Results Recy
- Page 322 and 323: TM2: Sampling Plan and Results Recy
- Page 324 and 325: TM2: Sampling Plan and Results Recy
- Page 326 and 327: Recommended Limits for Various Indu
- Page 328: Exhibit B Blue Lake WWTP Sampling R
- Page 331 and 332: MCES Blue Lake Plant Final Effluent
- Page 333 and 334: Date Day of Wk MCES Blue Lake Plant
MN Permit No Facility<br />
Minnesota <strong>Municipal</strong> WWTP Capacity and 2003-2005 Flow<br />
(Facilities with Permitted Capacity Greater Than 1 mgd)<br />
Source: MPCA Discharge Monitoring Report Database Summary<br />
Permitted<br />
Capacity 1<br />
mgd<br />
2003<br />
Average<br />
Flow<br />
mgd<br />
2004<br />
Average<br />
Flow<br />
mgd<br />
2005<br />
Average<br />
Flow<br />
mgd<br />
MN0030627 Hibbing WWTP North Plant 3.20 0.60 0.50 0.00<br />
MN0025721 Camp Ripley WWTP 1.44 0.16 0.11 0.12<br />
MN0064190 Otsego WWTP East 1.65 0.14 0.19 0.21<br />
MN0021211 Granite Falls WWTP 1.111 0.37 0.41 0.48<br />
MN0024473 Perham WWTP 1.172 0.47 0.49 0.51<br />
MNG580117 Wells Easton Minnesota Lake WWTP 1.088 0.49 0.52 0.52<br />
MN0020681 Stewartville WWTP 1.11 0.62 0.75 0.53<br />
MN0020664 Lake City WWTP 1.52 0.65 0.56 0.56<br />
MN0025267 Winnebago WWTP 1.7 0.32 0.43 0.59<br />
MN0023337 Eveleth WWTP 1 0.65 0.70 0.65<br />
MN0020150 New Prague WWTP 1.378 0.57 0.59 0.66<br />
MN0020508 Ely WWTP 1.5 0.57 0.73 0.69<br />
MN0022233 Glencoe WWTP 2.6 0.69 0.69 0.69<br />
MN0046868 Whitewater River Regional WWTP 1.12 0.70 0.89 0.70<br />
MN0022250 Two Harbors WWTP 1.6 0.61 0.66 0.70<br />
MN0055808 Chisago Lakes Joint STC 1.26 0.82 0.79 0.76<br />
MN0029629 Rogers WWTP 1.602 0.69 0.74 0.77<br />
MN0020222 St Michael WWTP 2.45 0.66 0.62 0.83<br />
MN0020362 Cambridge WWTP 1.92 0.73 0.85 0.85<br />
MN0020141 Luverne WWTP 1.5 0.76 0.83 0.86<br />
MN0025488 Met Council - Rosemount WWTP 7<br />
1.40 0.76 0.82 0.90<br />
MN0024040 Madelia WWTP 1.31 0.67 0.74 0.91<br />
MN0024759 St James WWTP 2.96 0.94 0.85 1.03<br />
App C_MN WWTPs_1+mgd_2005 Flow Summary_060707.xls Page 1 of 4


