Recycling Treated Municipal Wastewater for Industrial Water Use
Recycling Treated Municipal Wastewater for Industrial Water Use Recycling Treated Municipal Wastewater for Industrial Water Use
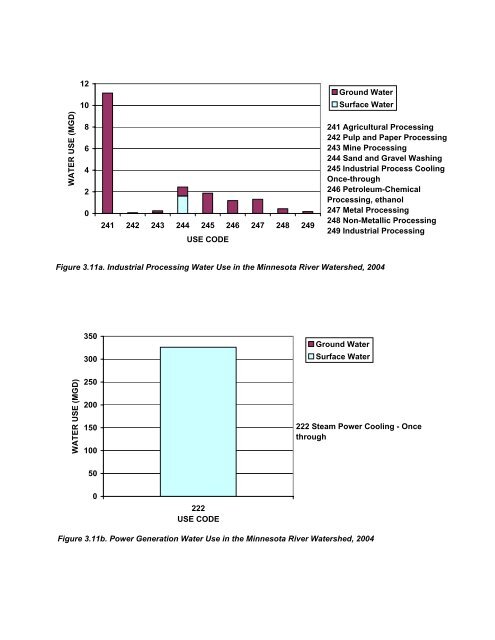
WATER USE (MGD) WATER USE (MGD) 12 10 8 6 4 2 0 350 300 250 200 150 100 50 0 241 242 243 244 245 246 247 248 249 USE CODE 222 USE CODE Ground Water Surface Water Figure 3.11a. Industrial Processing Water Use in the Minnesota River Watershed, 2004 241 Agricultural Processing 242 Pulp and Paper Processing 243 Mine Processing 244 Sand and Gravel Washing 245 Industrial Process Cooling Once-through 246 Petroleum-Chemical Processing, ethanol 247 Metal Processing 248 Non-Metallic Processing 249 Industrial Processing Ground Water Surface Water 222 Steam Power Cooling - Once through Figure 3.11b. Power Generation Water Use in the Minnesota River Watershed, 2004
Table 3.12a. Industrial Water Use in the Mississippi River Headwaters Watershed 2004 Water Use, mgd Industry Category Groundwater Surface Water Total Agricultural Processing 6.49 0.00 6.49 Hydropower 0.00 0.12 0.12 Industrial Process Cooling - Once Through 3.58 0.51 4.09 Industrial Processing 0.87 0.00 0.87 Metal Processing 1.88 0.00 1.88 Mine Processing 0.24 0.00 0.24 Non-Metallic Processing 0.95 0.00 0.95 Nuclear Power Plant 0.05 346.60 346.65 Petroleum - Chemical Processing, ethanol 2.13 0.00 2.13 Power Generation 0.31 0.01 0.32 Pulp and Paper Processing 2.17 26.84 29.01 Sand and Gravel Washing 1.13 2.56 3.69 Steam Power Cooling - Once Through 0.19 544.49 544.68 Steam Power Cooling - Wet Tower 0.18 18.47 18.65 Steam Power Other than Cooling 1.36 0.00 1.36 Total 21.53 939.60 961.13 Table 3.12b. WWTPs in the Mississippi River Headwaters Watershed Facility Name Design Capacity, mgd Ann Avg Flow, mgd Flow as % of Design Capacity 2003 2004 2005 2005 Alexandria Lake Area Sanitary District 3.750 2.906 77% Bemidji WWTP 2.500 1.056 42% Brainerd WWTP 3.130 2.438 78% Buffalo WWTP 3.600 1.628 45% Cambridge WWTP 1.920 0.847 44% Camp Ripley WWTP 1.440 0.115 8% Elk River WWTP 2.200 1.186 54% Glencoe WWTP 2.600 0.69 27% Grand Rapids WWTP 15.200 7.33 48% Hutchinson WWTP 4.270 2.574 60% Litchfield WWTP 1.900 1.513 80% Little Falls WWTP 2.400 1.182 49% Melrose WWTP 2.500 2.001 80% Met Council - Eagles Point WWTP* 10.000 2.34 23% Met Council - Hastings WWTP* 2.900 1.592 55% Met Council - Metropolitan WWTP 251.000 187.018 75% Monticello WWTP 2.360 1.189 50% Otsego WWTP East 1.650 0.206 12% Rogers WWTP 1.602 0.769 48% St Cloud WWTP 13.000 10.358 80% St Michael WWTP 2.445 0.834 34% Willmar WWTP 5.040 3.81 76% Total 337.407 233.582 69% * Design capacity changed per MCES instructions.
- Page 212 and 213: UseCode by Year Minnesota Power Gen
- Page 214 and 215: Water Use (MGD) Water Use (MGD) 350
- Page 216 and 217: Minnesota Industrial Processing Fac
- Page 218 and 219: Minnesota Industrial Processing Fac
- Page 220 and 221: Water Use (MGD) Water Use (MGD) 120
- Page 222 and 223: Water Use (MGD) Water Use (MGD) 13.
- Page 224 and 225: Craddock Consulting Engineers In As
- Page 226 and 227: Overview There are no federal regul
- Page 228 and 229: Appendix B Status of Water Reuse Re
- Page 230 and 231: Appendix B Status of Water Reuse Re
- Page 232 and 233: Table 4. Examples of State Water Re
- Page 234 and 235: Appendix B Status of Water Reuse Re
- Page 236 and 237: Appendix B Status of Water Reuse Re
- Page 238 and 239: Setback Distances Appendix B Status
- Page 240 and 241: Appendix B Status of Water Reuse Re
- Page 242 and 243: Appendix B Status of Water Reuse Re
- Page 244 and 245: Appendix B Status of Water Reuse Re
- Page 246 and 247: Craddock Consulting Engineers In As
- Page 248 and 249: WATER USE (MGD) WATER USE (MGD) 3.5
- Page 250 and 251: Table 3.9a. Industrial Water Use in
- Page 252 and 253: Table 3.10a. Industrial Water Use i
- Page 254 and 255: Table 3.10d. Industries in the Lowe
- Page 256 and 257: WATER USE (MGD) WATER USE (MGD) 8 7
- Page 258 and 259: Table 3.11d. Industries in the Minn
- Page 260 and 261: Table 3.11d. Industries in the Minn
- Page 264 and 265: Table 3.12c. Industries in the Miss
- Page 266 and 267: Table 3.12c. Industries in the Miss
- Page 268 and 269: Table 3.12c. Industries in the Miss
- Page 270 and 271: Table 3.12c. Industries in the Miss
- Page 272 and 273: Table 3.13a. Industrial Water Use i
- Page 274 and 275: Table 3.14a. Industrial Water Use i
- Page 276 and 277: Table 3.15a. Industrial Water Use i
- Page 278 and 279: WATER USE (MGD) WATER USE (MGD) 2.5
- Page 280 and 281: WATER USE (MGD) WATER USE (MGD) 0.8
- Page 282 and 283: Table 3.17c. Industries in the West
- Page 284 and 285: MN Permit No Facility Minnesota Mun
- Page 286 and 287: MN Permit No Facility Minnesota Mun
- Page 288 and 289: Craddock Consulting Engineers In As
- Page 290: Minnesota DNR Waters 2005 Ground-wa
- Page 294 and 295: Craddock Consulting Engineers In As
- Page 296 and 297: Permit No. Organization NAICS Code
- Page 298 and 299: Permit No. Organization NAICS Code
- Page 300 and 301: Permit No. Organization NAICS Code
- Page 302 and 303: Permit No. Organization NAICS Code
- Page 304 and 305: Permit No. Organization NAICS Code
- Page 306 and 307: Permit No. Organization NAICS Code
- Page 308 and 309: Permit No. Organization NAICS Code
- Page 310 and 311: Metropolitan Council Recycling Trea
WATER USE (MGD)<br />
WATER USE (MGD)<br />
12<br />
10<br />
8<br />
6<br />
4<br />
2<br />
0<br />
350<br />
300<br />
250<br />
200<br />
150<br />
100<br />
50<br />
0<br />
241 242 243 244 245 246 247 248 249<br />
USE CODE<br />
222<br />
USE CODE<br />
Ground <strong>Water</strong><br />
Surface <strong>Water</strong><br />
Figure 3.11a. <strong>Industrial</strong> Processing <strong>Water</strong> <strong>Use</strong> in the Minnesota River <strong>Water</strong>shed, 2004<br />
241 Agricultural Processing<br />
242 Pulp and Paper Processing<br />
243 Mine Processing<br />
244 Sand and Gravel Washing<br />
245 <strong>Industrial</strong> Process Cooling<br />
Once-through<br />
246 Petroleum-Chemical<br />
Processing, ethanol<br />
247 Metal Processing<br />
248 Non-Metallic Processing<br />
249 <strong>Industrial</strong> Processing<br />
Ground <strong>Water</strong><br />
Surface <strong>Water</strong><br />
222 Steam Power Cooling - Once<br />
through<br />
Figure 3.11b. Power Generation <strong>Water</strong> <strong>Use</strong> in the Minnesota River <strong>Water</strong>shed, 2004


