Recycling Treated Municipal Wastewater for Industrial Water Use
Recycling Treated Municipal Wastewater for Industrial Water Use Recycling Treated Municipal Wastewater for Industrial Water Use
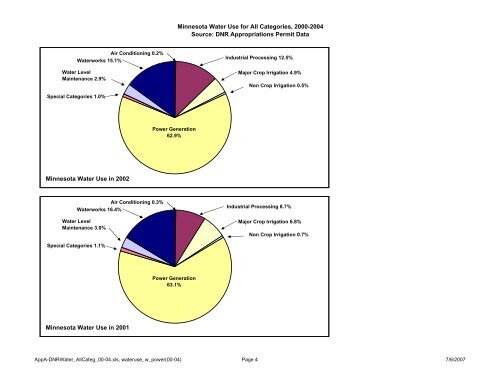
Air Conditioning 0.2% Waterworks 15.1% Water Level Maintenance 2.9% Special Categories 1.0% Minnesota Water Use in 2002 Air Conditioning 0.3% Waterworks 16.4% Water Level Maintenance 3.0% Special Categories 1.1% Minnesota Water Use in 2001 Power Generation 62.9% Power Generation 63.1% Minnesota Water Use for All Categories, 2000-2004 Source: DNR Appropriations Permit Data Industrial Processing 12.5% Major Crop Irrigation 4.9% Non Crop Irrigation 0.5% Industrial Processing 8.7% Major Crop Irrigation 6.8% Non Crop Irrigation 0.7% AppA-DNRWater_AllCateg_00-04.xls, wateruse_w_power(00-04) Page 4 7/6/2007
Waterworks 14.6% Water Level Maintenance 3.1% Special Categories 1.0% Minnesota Water Use in 2000 Air Conditioning 0.2% Power Generation 62.4% Minnesota Water Use for All Categories, 2000-2004 Source: DNR Appropriations Permit Data Industrial Processing 12.6% Major Crop Irrigation 5.4% Non Crop Irrigation 0.6% AppA-DNRWater_AllCateg_00-04.xls, wateruse_w_power(00-04) Page 5 7/6/2007
- Page 154 and 155: Section 3 Inventory of Major WWTPs
- Page 156 and 157: Section 3 Inventory of Major WWTPs
- Page 158 and 159: Figure 3.14b. Rainy River Watershed
- Page 160 and 161: Section 3 Inventory of Major WWTPs
- Page 162 and 163: Section 3 Inventory of Major WWTPs
- Page 164 and 165: Section 3 Inventory of Major WWTPs
- Page 166 and 167: ") Figure 3.16c. St. Croix River Wa
- Page 168 and 169: Section 3 Inventory of Major WWTPs
- Page 170 and 171: Section 3 Inventory of Major WWTPs
- Page 172 and 173: Section 3 Inventory of Major WWTPs
- Page 174 and 175: Figure 3.18 Metro Area Industrial R
- Page 176 and 177: Section 3 Inventory of Major WWTPs
- Page 178 and 179: G G Flying Cloud Dr !! G! G Figure
- Page 180 and 181: Section 3 Inventory of Major WWTPs
- Page 182 and 183: Figure 3.22. Rogers WWTP - Industri
- Page 184 and 185: Section 3 Inventory of Major WWTPs
- Page 186 and 187: G G G! Dodd Rd GG Figure 3.24. Rose
- Page 188 and 189: Section 3 Inventory of Major WWTPs
- Page 190 and 191: G Figure 3.26. Hastings WWTP - Indu
- Page 192 and 193: State Hwy 36 ! Figure 3.28. St. Cro
- Page 194 and 195: Section 3 Inventory of Major WWTPs
- Page 196 and 197: Section 3 Inventory of Major WWTPs
- Page 198 and 199: Craddock Consulting Engineers In As
- Page 200 and 201: Water Use Code Categories Minnesota
- Page 202 and 203: Minnesota Water Use for All Categor
- Page 206 and 207: Minnesota Water Use, 2000-2004 - St
- Page 208 and 209: Minnesota Water Use in 2004 (withou
- Page 210 and 211: Minnesota Water Use in 2000 (withou
- Page 212 and 213: UseCode by Year Minnesota Power Gen
- Page 214 and 215: Water Use (MGD) Water Use (MGD) 350
- Page 216 and 217: Minnesota Industrial Processing Fac
- Page 218 and 219: Minnesota Industrial Processing Fac
- Page 220 and 221: Water Use (MGD) Water Use (MGD) 120
- Page 222 and 223: Water Use (MGD) Water Use (MGD) 13.
- Page 224 and 225: Craddock Consulting Engineers In As
- Page 226 and 227: Overview There are no federal regul
- Page 228 and 229: Appendix B Status of Water Reuse Re
- Page 230 and 231: Appendix B Status of Water Reuse Re
- Page 232 and 233: Table 4. Examples of State Water Re
- Page 234 and 235: Appendix B Status of Water Reuse Re
- Page 236 and 237: Appendix B Status of Water Reuse Re
- Page 238 and 239: Setback Distances Appendix B Status
- Page 240 and 241: Appendix B Status of Water Reuse Re
- Page 242 and 243: Appendix B Status of Water Reuse Re
- Page 244 and 245: Appendix B Status of Water Reuse Re
- Page 246 and 247: Craddock Consulting Engineers In As
- Page 248 and 249: WATER USE (MGD) WATER USE (MGD) 3.5
- Page 250 and 251: Table 3.9a. Industrial Water Use in
- Page 252 and 253: Table 3.10a. Industrial Water Use i
Air Conditioning 0.2%<br />
<strong>Water</strong>works 15.1%<br />
<strong>Water</strong> Level<br />
Maintenance 2.9%<br />
Special Categories 1.0%<br />
Minnesota <strong>Water</strong> <strong>Use</strong> in 2002<br />
Air Conditioning 0.3%<br />
<strong>Water</strong>works 16.4%<br />
<strong>Water</strong> Level<br />
Maintenance 3.0%<br />
Special Categories 1.1%<br />
Minnesota <strong>Water</strong> <strong>Use</strong> in 2001<br />
Power Generation<br />
62.9%<br />
Power Generation<br />
63.1%<br />
Minnesota <strong>Water</strong> <strong>Use</strong> <strong>for</strong> All Categories, 2000-2004<br />
Source: DNR Appropriations Permit Data<br />
<strong>Industrial</strong> Processing 12.5%<br />
Major Crop Irrigation 4.9%<br />
Non Crop Irrigation 0.5%<br />
<strong>Industrial</strong> Processing 8.7%<br />
Major Crop Irrigation 6.8%<br />
Non Crop Irrigation 0.7%<br />
AppA-DNR<strong>Water</strong>_AllCateg_00-04.xls, wateruse_w_power(00-04) Page 4 7/6/2007


