Recycling Treated Municipal Wastewater for Industrial Water Use
Recycling Treated Municipal Wastewater for Industrial Water Use Recycling Treated Municipal Wastewater for Industrial Water Use
Section 3 Inventory of Major WWTPs and Potential Reuse Demands Table 3.27. Industrial Water Reuse Inventory Summary by Watershed Watershed Ground Water Surface Water Total Total Without Power Facilities* Larger WWTP Capacity (WWTPs > 1 mgd) Smaller WWTP Capacity (WWTPs < 1 mgd) Larger WWTP Discharge Flow, 2005 No. of Industry Categories with Water Permits Ground Water Availability 3-52 Craddock Consulting Engineers In Association with CDM & James Crook WWReuseTM1_Sec 3_final.doc Ground Water Contamination Susceptibility 2004 Industrial Water Use, mgd mgd mgd mgd No. =Favors Recycling Cedar River 4.1 0.1 4.1 4.1 26.9 2.6 9.7 4 No Factor No Factor Des Moines River 0.56 0.16 0.7 0.7 5.8 3.1 3.1 2 No Factor Lower Mississippi River 13.3 578.8 592.1 14.9 77.3 15.8 41.0 10 No Factor Minnesota River 17.3 327.7 345.0 19.0 123.5 22.4 73.4 10 No Factor Potential Factor Mississippi River- Headwaters 21.5 939.6 961.1 51.3 337.4 31.5 233.6 15 No Factor No Factor Missouri River 0 0.1 0.1 0.1 1.5 2.0 0.7 1 No Factor Rainy River
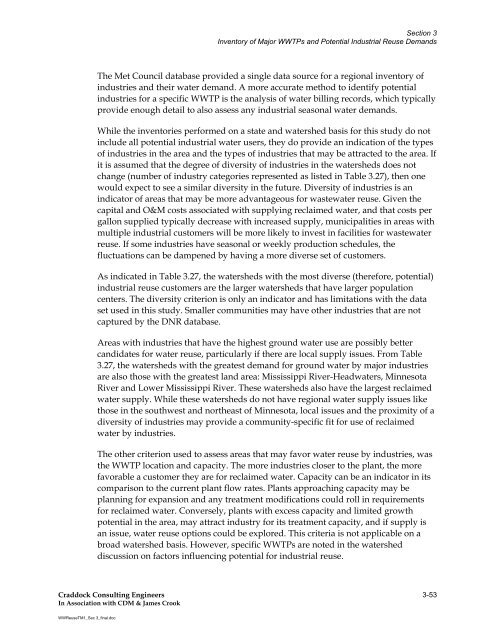
Section 3 Inventory of Major WWTPs and Potential Industrial Reuse Demands Craddock Consulting Engineers 3-53 In Association with CDM & James Crook WWReuseTM1_Sec 3_final.doc The Met Council database provided a single data source for a regional inventory of industries and their water demand. A more accurate method to identify potential industries for a specific WWTP is the analysis of water billing records, which typically provide enough detail to also assess any industrial seasonal water demands. While the inventories performed on a state and watershed basis for this study do not include all potential industrial water users, they do provide an indication of the types of industries in the area and the types of industries that may be attracted to the area. If it is assumed that the degree of diversity of industries in the watersheds does not change (number of industry categories represented as listed in Table 3.27), then one would expect to see a similar diversity in the future. Diversity of industries is an indicator of areas that may be more advantageous for wastewater reuse. Given the capital and O&M costs associated with supplying reclaimed water, and that costs per gallon supplied typically decrease with increased supply, municipalities in areas with multiple industrial customers will be more likely to invest in facilities for wastewater reuse. If some industries have seasonal or weekly production schedules, the fluctuations can be dampened by having a more diverse set of customers. As indicated in Table 3.27, the watersheds with the most diverse (therefore, potential) industrial reuse customers are the larger watersheds that have larger population centers. The diversity criterion is only an indicator and has limitations with the data set used in this study. Smaller communities may have other industries that are not captured by the DNR database. Areas with industries that have the highest ground water use are possibly better candidates for water reuse, particularly if there are local supply issues. From Table 3.27, the watersheds with the greatest demand for ground water by major industries are also those with the greatest land area: Mississippi River-Headwaters, Minnesota River and Lower Mississippi River. These watersheds also have the largest reclaimed water supply. While these watersheds do not have regional water supply issues like those in the southwest and northeast of Minnesota, local issues and the proximity of a diversity of industries may provide a community-specific fit for use of reclaimed water by industries. The other criterion used to assess areas that may favor water reuse by industries, was the WWTP location and capacity. The more industries closer to the plant, the more favorable a customer they are for reclaimed water. Capacity can be an indicator in its comparison to the current plant flow rates. Plants approaching capacity may be planning for expansion and any treatment modifications could roll in requirements for reclaimed water. Conversely, plants with excess capacity and limited growth potential in the area, may attract industry for its treatment capacity, and if supply is an issue, water reuse options could be explored. This criteria is not applicable on a broad watershed basis. However, specific WWTPs are noted in the watershed discussion on factors influencing potential for industrial reuse.
- Page 144 and 145: Section 3 Inventory of Major WWTPs
- Page 146 and 147: Section 3 Inventory of Major WWTPs
- Page 148 and 149: Section 3 Inventory of Major WWTPs
- Page 150 and 151: Section 3 Inventory of Major WWTPs
- Page 152 and 153: Figure 3.12c. Mississippi River - H
- Page 154 and 155: Section 3 Inventory of Major WWTPs
- Page 156 and 157: Section 3 Inventory of Major WWTPs
- Page 158 and 159: Figure 3.14b. Rainy River Watershed
- Page 160 and 161: Section 3 Inventory of Major WWTPs
- Page 162 and 163: Section 3 Inventory of Major WWTPs
- Page 164 and 165: Section 3 Inventory of Major WWTPs
- Page 166 and 167: ") Figure 3.16c. St. Croix River Wa
- Page 168 and 169: Section 3 Inventory of Major WWTPs
- Page 170 and 171: Section 3 Inventory of Major WWTPs
- Page 172 and 173: Section 3 Inventory of Major WWTPs
- Page 174 and 175: Figure 3.18 Metro Area Industrial R
- Page 176 and 177: Section 3 Inventory of Major WWTPs
- Page 178 and 179: G G Flying Cloud Dr !! G! G Figure
- Page 180 and 181: Section 3 Inventory of Major WWTPs
- Page 182 and 183: Figure 3.22. Rogers WWTP - Industri
- Page 184 and 185: Section 3 Inventory of Major WWTPs
- Page 186 and 187: G G G! Dodd Rd GG Figure 3.24. Rose
- Page 188 and 189: Section 3 Inventory of Major WWTPs
- Page 190 and 191: G Figure 3.26. Hastings WWTP - Indu
- Page 192 and 193: State Hwy 36 ! Figure 3.28. St. Cro
- Page 196 and 197: Section 3 Inventory of Major WWTPs
- Page 198 and 199: Craddock Consulting Engineers In As
- Page 200 and 201: Water Use Code Categories Minnesota
- Page 202 and 203: Minnesota Water Use for All Categor
- Page 204 and 205: Air Conditioning 0.2% Waterworks 15
- Page 206 and 207: Minnesota Water Use, 2000-2004 - St
- Page 208 and 209: Minnesota Water Use in 2004 (withou
- Page 210 and 211: Minnesota Water Use in 2000 (withou
- Page 212 and 213: UseCode by Year Minnesota Power Gen
- Page 214 and 215: Water Use (MGD) Water Use (MGD) 350
- Page 216 and 217: Minnesota Industrial Processing Fac
- Page 218 and 219: Minnesota Industrial Processing Fac
- Page 220 and 221: Water Use (MGD) Water Use (MGD) 120
- Page 222 and 223: Water Use (MGD) Water Use (MGD) 13.
- Page 224 and 225: Craddock Consulting Engineers In As
- Page 226 and 227: Overview There are no federal regul
- Page 228 and 229: Appendix B Status of Water Reuse Re
- Page 230 and 231: Appendix B Status of Water Reuse Re
- Page 232 and 233: Table 4. Examples of State Water Re
- Page 234 and 235: Appendix B Status of Water Reuse Re
- Page 236 and 237: Appendix B Status of Water Reuse Re
- Page 238 and 239: Setback Distances Appendix B Status
- Page 240 and 241: Appendix B Status of Water Reuse Re
- Page 242 and 243: Appendix B Status of Water Reuse Re
Section 3<br />
Inventory of Major WWTPs and Potential <strong>Industrial</strong> Reuse Demands<br />
Craddock Consulting Engineers 3-53<br />
In Association with CDM & James Crook<br />
WWReuseTM1_Sec 3_final.doc<br />
The Met Council database provided a single data source <strong>for</strong> a regional inventory of<br />
industries and their water demand. A more accurate method to identify potential<br />
industries <strong>for</strong> a specific WWTP is the analysis of water billing records, which typically<br />
provide enough detail to also assess any industrial seasonal water demands.<br />
While the inventories per<strong>for</strong>med on a state and watershed basis <strong>for</strong> this study do not<br />
include all potential industrial water users, they do provide an indication of the types<br />
of industries in the area and the types of industries that may be attracted to the area. If<br />
it is assumed that the degree of diversity of industries in the watersheds does not<br />
change (number of industry categories represented as listed in Table 3.27), then one<br />
would expect to see a similar diversity in the future. Diversity of industries is an<br />
indicator of areas that may be more advantageous <strong>for</strong> wastewater reuse. Given the<br />
capital and O&M costs associated with supplying reclaimed water, and that costs per<br />
gallon supplied typically decrease with increased supply, municipalities in areas with<br />
multiple industrial customers will be more likely to invest in facilities <strong>for</strong> wastewater<br />
reuse. If some industries have seasonal or weekly production schedules, the<br />
fluctuations can be dampened by having a more diverse set of customers.<br />
As indicated in Table 3.27, the watersheds with the most diverse (there<strong>for</strong>e, potential)<br />
industrial reuse customers are the larger watersheds that have larger population<br />
centers. The diversity criterion is only an indicator and has limitations with the data<br />
set used in this study. Smaller communities may have other industries that are not<br />
captured by the DNR database.<br />
Areas with industries that have the highest ground water use are possibly better<br />
candidates <strong>for</strong> water reuse, particularly if there are local supply issues. From Table<br />
3.27, the watersheds with the greatest demand <strong>for</strong> ground water by major industries<br />
are also those with the greatest land area: Mississippi River-Headwaters, Minnesota<br />
River and Lower Mississippi River. These watersheds also have the largest reclaimed<br />
water supply. While these watersheds do not have regional water supply issues like<br />
those in the southwest and northeast of Minnesota, local issues and the proximity of a<br />
diversity of industries may provide a community-specific fit <strong>for</strong> use of reclaimed<br />
water by industries.<br />
The other criterion used to assess areas that may favor water reuse by industries, was<br />
the WWTP location and capacity. The more industries closer to the plant, the more<br />
favorable a customer they are <strong>for</strong> reclaimed water. Capacity can be an indicator in its<br />
comparison to the current plant flow rates. Plants approaching capacity may be<br />
planning <strong>for</strong> expansion and any treatment modifications could roll in requirements<br />
<strong>for</strong> reclaimed water. Conversely, plants with excess capacity and limited growth<br />
potential in the area, may attract industry <strong>for</strong> its treatment capacity, and if supply is<br />
an issue, water reuse options could be explored. This criteria is not applicable on a<br />
broad watershed basis. However, specific WWTPs are noted in the watershed<br />
discussion on factors influencing potential <strong>for</strong> industrial reuse.


