Recycling Treated Municipal Wastewater for Industrial Water Use
Recycling Treated Municipal Wastewater for Industrial Water Use Recycling Treated Municipal Wastewater for Industrial Water Use
Section 3 Inventory of Major WWTPs and Potential Industrial Reuse Demands Table 3.9a. Industrial Water Use in the Des Moines River Watershed 2004 Water Use, mgd Industry Category Ground Water Surface Water Total Agricultural Processing 0.56 0.00 0.56 Sand & Gravel Washing 0.00 0.10 0.10 Total 0.56 0.10 0.66 Source: MDNR, 2004 Table 3.9b. WWTPs in the Des Moines River Watershed Design 2005 Ann Avg Flow as % of Facility Name Capacity, mgd Flow, mgd Design Capacity Windom WWTP 1.830 1.074 58.7% Worthington WWTP 4.000 1.992 49.8% Total Source: MPCA, 2005 5.830 3.066 52.6% WATER USE (MGD) 0.6 0.5 0.4 0.3 0.2 0.1 0 241 244 USE CODE Ground Water Surface Water 241 Agricultural Processing 244 Sand and Gravel Washing Figure 3.9a Industrial Processing Water Use in the Des Moines River Watershed, 2004 Source: MDNR, 2004 3-12 Craddock Consulting Engineers In Association with CDM & James Crook WWReuseTM1_Sec 3_final.doc
Section 3 Inventory of Major WWTPs and Potential Industrial Reuse Demands Craddock Consulting Engineers 3-13 In Association with CDM & James Crook WWReuseTM1_Sec 3_final.doc Industries and Proximity to WWTPs Figure 3.9b presents the location of the industries and WWTPs in the Des Moines River watershed. Table 3.9c lists the various industries and their distance from the closer of the two WWTPs. The agricultural processing industries are all located within 3 miles of a WWTP. The Heron Lake WWTP is not shown because its design capacity of 0.1 mgd is less than 1 mgd. The ethanol plant and wastewater treatment plant modifications for Heron Lake will be investigated further in Task 2. One sand and gravel business is located about 4 miles from the Windom WWTP, while the other businesses are located more than 10 miles from a WWTP. Table 3.9c. Industries in the Des Moines River Watershed 2004 Water Distance to WWTP, Closest Industry Name Source* Use, mgd miles WWTP Industry Category HERON LAKE, CITY OF G 0.089 9.6 Windom Agricultural Processing HERON LAKE, CITY OF G 0.098 9.6 Windom Agricultural Processing PM WINDOM G 0.200 6.5 Windom Agricultural Processing PM WINDOM G 0.077 6.5 Windom Agricultural Processing PM WINDOM G 0.098 6.5 Windom Agricultural Processing WORTHINGTON RENDERING S 0.003 1.7 Worthington Agricultural Processing WILLETT GRAVEL CO S 0.001 >10 Windom Non-Metallic Processing MUECKE SAND & GRAVEL, R A S 0.100 >10 Windom Sand and Gravel Washing WINDOM READY MIX INC S 0.000 3.3 Windom Sand and Gravel Washing WINDOM READY MIX INC * G=Ground Water; S=Surface Water Source: MDNR, 2004 S 0.000 7.1 Windom Sand and Gravel Washing Factors Influencing Potential for Industrial Reuse The Des Moines River watershed is in Ground Water Area 5, represented by limited bedrock and buried sand aquifers and moderate producing surficial sand aquifers. The water quality of the buried sand and gravel and Cretaceous aquifers often yield water of poor natural quality, typically high in sulfate and total dissolved solids. The highest yielding aquifers in this region are mostly narrow, channel outwash deposits which are susceptible to contamination, notably nitrates. Many residents rely on rural water supply systems because domestic wells are contaminated with nitrates. The area around Worthington and the central portion of the watershed is typically less susceptible to contamination than the other areas. Water quantity of appropriate quality has been an issue for potable water suppliers of this watershed. The cities of Luverne and Worthington, the Lincoln-Pipestone Rural Water System and Rock County Rural Water System are working with communities in South Dakota and Iowa to provide another source of water to the Des Moines and Missouri River watersheds in Minnesota’s borders: the Lewis and Clark Rural Water System.
- Page 83 and 84: Section 1 Introduction Craddock Con
- Page 85 and 86: Section 1 Introduction Craddock Con
- Page 87 and 88: Craddock Consulting Engineers 2-1 I
- Page 89 and 90: Section 2 Implementation Considerat
- Page 91 and 92: Section 2 Implementation Considerat
- Page 93 and 94: Section 2 Implementation Considerat
- Page 95 and 96: Table 2.4. Examples of State Water
- Page 97 and 98: Section 2 Implementation Considerat
- Page 99 and 100: Section 2 Implementation Considerat
- Page 101 and 102: Section 2 Implementation Considerat
- Page 103 and 104: Section 2 Implementation Considerat
- Page 105 and 106: Section 2 Implementation Considerat
- Page 107 and 108: Section 2 Implementation Considerat
- Page 109: Section 2 Implementation Considerat
- Page 112 and 113: Section 2 Implementation Considerat
- Page 114 and 115: Section 2 Implementation Considerat
- Page 116 and 117: Section 2 Implementation Considerat
- Page 118 and 119: Craddock Consulting Engineers 3-1 I
- Page 120 and 121: Section 3 Inventory of Major WWTPs
- Page 122 and 123: Section 3 Inventory of Major WWTPs
- Page 124 and 125: Figure 3.6. Industrial Reuse Custom
- Page 126 and 127: Section 3 Inventory of Major WWTPs
- Page 128 and 129: Figure 3.7b. Ground Water Availabil
- Page 130 and 131: Section 3 Inventory of Major WWTPs
- Page 132 and 133: ") Figure 3.8c. Cedar River Watersh
- Page 136 and 137: Section 3 Inventory of Major WWTPs
- Page 138 and 139: Section 3 Inventory of Major WWTPs
- Page 140 and 141: ") ") ") ") Figure 3.10c. Lower Mis
- Page 142 and 143: Section 3 Inventory of Major WWTPs
- Page 144 and 145: Section 3 Inventory of Major WWTPs
- Page 146 and 147: Section 3 Inventory of Major WWTPs
- Page 148 and 149: Section 3 Inventory of Major WWTPs
- Page 150 and 151: Section 3 Inventory of Major WWTPs
- Page 152 and 153: Figure 3.12c. Mississippi River - H
- Page 154 and 155: Section 3 Inventory of Major WWTPs
- Page 156 and 157: Section 3 Inventory of Major WWTPs
- Page 158 and 159: Figure 3.14b. Rainy River Watershed
- Page 160 and 161: Section 3 Inventory of Major WWTPs
- Page 162 and 163: Section 3 Inventory of Major WWTPs
- Page 164 and 165: Section 3 Inventory of Major WWTPs
- Page 166 and 167: ") Figure 3.16c. St. Croix River Wa
- Page 168 and 169: Section 3 Inventory of Major WWTPs
- Page 170 and 171: Section 3 Inventory of Major WWTPs
- Page 172 and 173: Section 3 Inventory of Major WWTPs
- Page 174 and 175: Figure 3.18 Metro Area Industrial R
- Page 176 and 177: Section 3 Inventory of Major WWTPs
- Page 178 and 179: G G Flying Cloud Dr !! G! G Figure
- Page 180 and 181: Section 3 Inventory of Major WWTPs
- Page 182 and 183: Figure 3.22. Rogers WWTP - Industri
Section 3<br />
Inventory of Major WWTPs and Potential <strong>Industrial</strong> Reuse Demands<br />
Table 3.9a. <strong>Industrial</strong> <strong>Water</strong> <strong>Use</strong> in the Des Moines River <strong>Water</strong>shed<br />
2004 <strong>Water</strong> <strong>Use</strong>, mgd<br />
Industry Category Ground <strong>Water</strong> Surface <strong>Water</strong> Total<br />
Agricultural Processing 0.56 0.00 0.56<br />
Sand & Gravel Washing 0.00 0.10 0.10<br />
Total 0.56 0.10 0.66<br />
Source: MDNR, 2004<br />
Table 3.9b. WWTPs in the Des Moines River <strong>Water</strong>shed<br />
Design 2005 Ann Avg Flow as % of<br />
Facility Name Capacity, mgd Flow, mgd Design Capacity<br />
Windom WWTP 1.830 1.074 58.7%<br />
Worthington WWTP 4.000 1.992 49.8%<br />
Total<br />
Source: MPCA, 2005<br />
5.830 3.066 52.6%<br />
WATER USE (MGD)<br />
0.6<br />
0.5<br />
0.4<br />
0.3<br />
0.2<br />
0.1<br />
0<br />
241 244<br />
USE CODE<br />
Ground <strong>Water</strong><br />
Surface <strong>Water</strong><br />
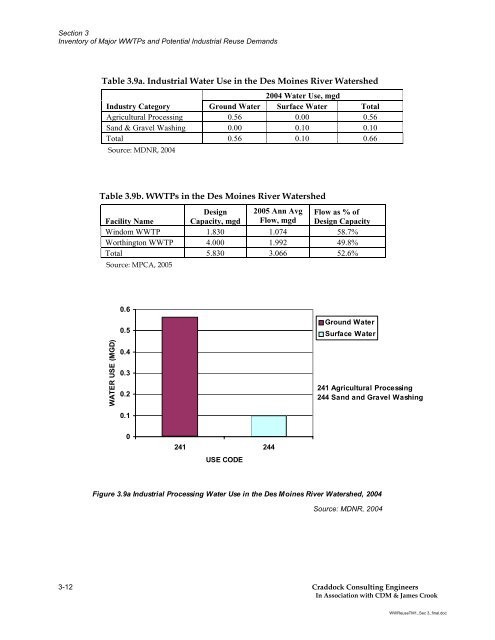
241 Agricultural Processing<br />
244 Sand and Gravel Washing<br />
Figure 3.9a <strong>Industrial</strong> Processing <strong>Water</strong> <strong>Use</strong> in the Des Moines River <strong>Water</strong>shed, 2004<br />
Source: MDNR, 2004<br />
3-12 Craddock Consulting Engineers<br />
In Association with CDM & James Crook<br />
WWReuseTM1_Sec 3_final.doc


