Recycling Treated Municipal Wastewater for Industrial Water Use
Recycling Treated Municipal Wastewater for Industrial Water Use Recycling Treated Municipal Wastewater for Industrial Water Use
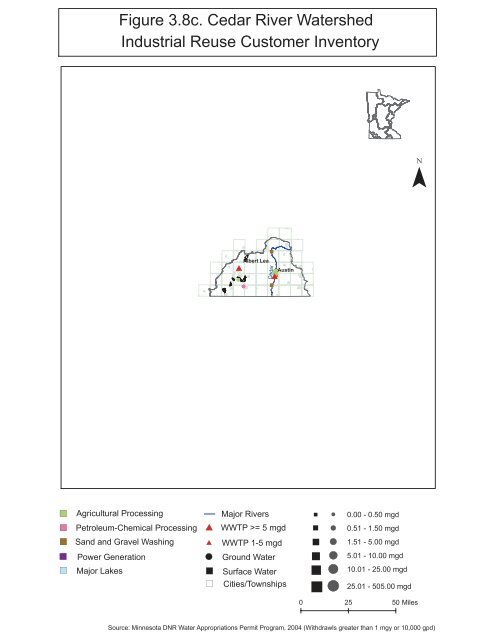
") Figure 3.8c. Cedar River Watershed Industrial Reuse Customer Inventory Agricultural Processing ") Petroleum-Chemical Processing ") Sand and Gravel Washing ") ") Power Generation Major Lakes #* #* !( ") ") # ! ! Albert Lea Major Rivers " Cedar ! Austin ! # " " WWTP >= 5 mgd WWTP 1-5 mgd Ground Water Surface Water Cities/Townships !( 0.51 - 1.50 mgd !( 1.51 - 5.00 mgd !( 5.01 - 10.00 mgd 0 25 50 Miles Source: Minnesota DNR Water Appropriations Permit Program, 2004 (Withdrawls greater than 1 mgy or 10,000 gpd) " " " " " " !( 0.00 - 0.50 mgd !( !( 10.01 - 25.00 mgd 25.01 - 505.00 mgd ¯
Section 3 Inventory of Major WWTPs and Potential Industrial Reuse Demands Craddock Consulting Engineers 3-11 In Association with CDM & James Crook WWReuseTM1_Sec 3_final.doc The Agra Resources Coop is within 2 miles of the Albert Lea WWTP. The Austin Utilities power facility location is within 5 miles of the WWTP and could be closer depending on its proximity to the permitted wells. Factors Influencing Potential for Industrial Reuse The majority of the Cedar River watershed is in Ground Water Area 2 of the state, which has a good bedrock aquifer supply and limited water bearing surficial sands and moderate availability of water in the buried sand aquifers. The southern edge of the watershed is part of the karst area of Ground Water Area 3, where ground water supplies are strongly linked to surface supplies. Contamination susceptibility varies over the watershed with a higher potential in the eastern sections and areas of lower susceptibility interspersed with areas rated with highest susceptibility in the mid- and western regions of the watershed. Occasional well interferences have been noted, but the public water supplies have had no problems. The agricultural practices of the area have led to nitrate contamination which could affect the Prairie du Chien-Jordan aquifer as well as surficial aquifers. Agricultural drainage wells have polluted deeper ground water. Des Moines River Industrial Water Use There is little permitted water used for industrial purposes in the Des Moines River watershed. Of the 0.66 mgd used in 2004, the majority was for agricultural processing industries, specifically PM Windom, Worthington Rendering, and the City of Heron Lake. Sand and gravel operations collectively withdrew 0.1 mgd from surface waters in 2004. Table 3.9a and Figure 3.9a summarize the industrial water use for the Des Moines River watershed. There were no water withdrawals related to power generator facilities. In Heron Lake, located southwest of Windom, a 50 million gallon capacity ethanol plant is under construction and scheduled for completion by April 2007. A wastewater treatment plant expansion has also been bid for construction. WWTPs There are two municipal WWTPs in this watershed with design capacities greater than 1 mgd: Windom WWTP and Worthington WWTP. Table 3.9b summarizes the design capacity and historic flows for the plants. These WWTPs, with a design capacity total of 5.8 mgd, discharged over 3 mgd in 2005. WWTPs in this watershed with design capacities less than 1 mgd have a combined design capacity of 3.1 mgd. As with Heron Lake discussed previously and below, smaller WWTPs in proximity to an industry may be a potential supplier of reclaimed water. With over 30% of the watershed’s wastewater treatment system capacity in facilities less than 1 mgd, and the agricultural industry potential in this area, smaller WWTPs should be evaluated more closely in Task 2.
- Page 81 and 82: Section 1 Introduction Craddock Con
- Page 83 and 84: Section 1 Introduction Craddock Con
- Page 85 and 86: Section 1 Introduction Craddock Con
- Page 87 and 88: Craddock Consulting Engineers 2-1 I
- Page 89 and 90: Section 2 Implementation Considerat
- Page 91 and 92: Section 2 Implementation Considerat
- Page 93 and 94: Section 2 Implementation Considerat
- Page 95 and 96: Table 2.4. Examples of State Water
- Page 97 and 98: Section 2 Implementation Considerat
- Page 99 and 100: Section 2 Implementation Considerat
- Page 101 and 102: Section 2 Implementation Considerat
- Page 103 and 104: Section 2 Implementation Considerat
- Page 105 and 106: Section 2 Implementation Considerat
- Page 107 and 108: Section 2 Implementation Considerat
- Page 109: Section 2 Implementation Considerat
- Page 112 and 113: Section 2 Implementation Considerat
- Page 114 and 115: Section 2 Implementation Considerat
- Page 116 and 117: Section 2 Implementation Considerat
- Page 118 and 119: Craddock Consulting Engineers 3-1 I
- Page 120 and 121: Section 3 Inventory of Major WWTPs
- Page 122 and 123: Section 3 Inventory of Major WWTPs
- Page 124 and 125: Figure 3.6. Industrial Reuse Custom
- Page 126 and 127: Section 3 Inventory of Major WWTPs
- Page 128 and 129: Figure 3.7b. Ground Water Availabil
- Page 130 and 131: Section 3 Inventory of Major WWTPs
- Page 134 and 135: Section 3 Inventory of Major WWTPs
- Page 136 and 137: Section 3 Inventory of Major WWTPs
- Page 138 and 139: Section 3 Inventory of Major WWTPs
- Page 140 and 141: ") ") ") ") Figure 3.10c. Lower Mis
- Page 142 and 143: Section 3 Inventory of Major WWTPs
- Page 144 and 145: Section 3 Inventory of Major WWTPs
- Page 146 and 147: Section 3 Inventory of Major WWTPs
- Page 148 and 149: Section 3 Inventory of Major WWTPs
- Page 150 and 151: Section 3 Inventory of Major WWTPs
- Page 152 and 153: Figure 3.12c. Mississippi River - H
- Page 154 and 155: Section 3 Inventory of Major WWTPs
- Page 156 and 157: Section 3 Inventory of Major WWTPs
- Page 158 and 159: Figure 3.14b. Rainy River Watershed
- Page 160 and 161: Section 3 Inventory of Major WWTPs
- Page 162 and 163: Section 3 Inventory of Major WWTPs
- Page 164 and 165: Section 3 Inventory of Major WWTPs
- Page 166 and 167: ") Figure 3.16c. St. Croix River Wa
- Page 168 and 169: Section 3 Inventory of Major WWTPs
- Page 170 and 171: Section 3 Inventory of Major WWTPs
- Page 172 and 173: Section 3 Inventory of Major WWTPs
- Page 174 and 175: Figure 3.18 Metro Area Industrial R
- Page 176 and 177: Section 3 Inventory of Major WWTPs
- Page 178 and 179: G G Flying Cloud Dr !! G! G Figure
- Page 180 and 181: Section 3 Inventory of Major WWTPs
")<br />
Figure 3.8c. Cedar River <strong>Water</strong>shed<br />
<strong>Industrial</strong> Reuse Customer Inventory<br />
Agricultural Processing<br />
") Petroleum-Chemical Processing<br />
") Sand and Gravel Washing<br />
")<br />
")<br />
Power Generation<br />
Major Lakes<br />
#*<br />
#*<br />
!(<br />
")<br />
")<br />
#<br />
!<br />
!<br />
Albert Lea<br />
Major Rivers<br />
"<br />
Cedar<br />
! Austin !<br />
# "<br />
"<br />
WWTP >= 5 mgd<br />
WWTP 1-5 mgd<br />
Ground <strong>Water</strong><br />
Surface <strong>Water</strong><br />
Cities/Townships<br />
!( 0.51 - 1.50 mgd<br />
!( 1.51 - 5.00 mgd<br />
!( 5.01 - 10.00 mgd<br />
0 25 50 Miles<br />
Source: Minnesota DNR <strong>Water</strong> Appropriations Permit Program, 2004 (Withdrawls greater than 1 mgy or 10,000 gpd)<br />
"<br />
"<br />
"<br />
"<br />
"<br />
"<br />
!( 0.00 - 0.50 mgd<br />
!(<br />
!(<br />
10.01 - 25.00 mgd<br />
25.01 - 505.00 mgd<br />
¯


