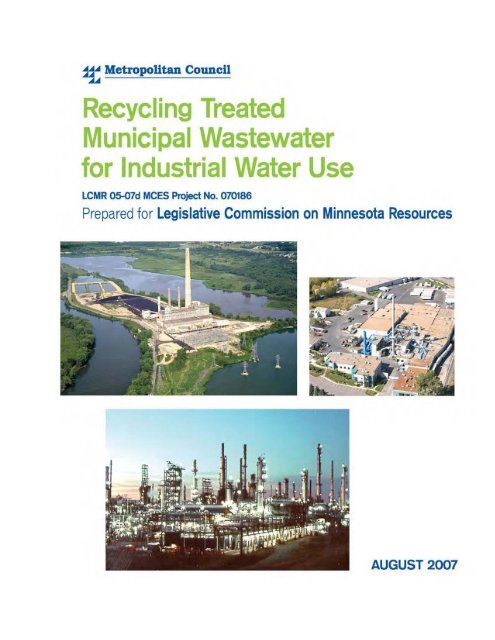
Recycling Treated Municipal Wastewater for Industrial Water Use
Recycling Treated Municipal Wastewater for Industrial Water Use
Recycling Treated Municipal Wastewater for Industrial Water Use

You also want an ePaper? Increase the reach of your titles
YUMPU automatically turns print PDFs into web optimized ePapers that Google loves.
Acknowledgements<br />
This study was conducted by Metropolitan Council Environmental Services through its lead consultant,<br />
Craddock Consulting Engineers. Craddock Consulting Engineers’ partners were Camp Dresser & McKee,<br />
James Crook, and Robert Molzahn. Pace Analytical, Inc. also provided laboratory analysis. Funding <strong>for</strong><br />
this project was recommended by the Legislative Commission on Minnesota Resources (LCMR) from the<br />
Environment and Natural Resources Trust Fund. Metropolitan Council Environmental Services provided<br />
in-kind contributions consisting of project management, technical resources, sampling and analytical<br />
services, and report production.<br />
Metropolitan Council wishes to acknowledge and thank the following organizations <strong>for</strong> participating as<br />
stakeholders in this study: Minnesota Department of Health; Minnesota Department of Natural Resources;<br />
Minnesota Environmental Initiative; Minnesota Pollution Control Agency; Dakota County; City of<br />
Mankato; the <strong>Water</strong> Utility Council of the American <strong>Water</strong> Works Association, Minnesota Section; ADC<br />
Telecommunications, Inc.; CertainTeed Corporation; Fagen Engineering, LLC; Flint Hills Resources, LP;<br />
Gopher Resources Corporation; Great River Energy; Kramer Mining and Materials, Inc.; Marathon<br />
Petroleum Company, LLC; Rock-Tenn Company; Twin City Tanning Company; SB Foot Tanning<br />
Company; and Xcel Energy.<br />
Metropolitan Council wishes to acknowledge and thank the following industries <strong>for</strong> providing survey<br />
in<strong>for</strong>mation about industry practices: 3M Company; ADC Telecommunications, Inc.; Ag Processing, Inc.;<br />
Aggregate Industries-NCR, Inc.; Andersen Corporation; Banta Catalog Group; District Energy of St.<br />
Paul, Inc.; Ecolab, Inc.; Federal Cartridge Company–ATK; FilmTec Corporation; Flint Hills Resources,<br />
LP: Georgia-Pacific Corporation; Gopher Resources Corporation; Honeywell International, Inc.; Kraemer<br />
Mining and Materials, Inc.; Marathon Petroleum Corporation, LLC; Midwest Coca Cola Bottling, Inc.;<br />
NRG Energy Center, LLC; Polar Semiconductor, Inc.; Rock-Tenn Company; S. B. Foot Tanning<br />
Company; Seagate Technology, LLC; Southern Minnesota Construction Company, Inc.; St. Paul<br />
Cogeneration, LLC; St. Paul Pioneer Press Dispatch; Stora Enso Duluth Mills; and Twin City Tanning<br />
Company.<br />
Metropolitan Council wishes to acknowledge and thank the following industries <strong>for</strong> providing photos<br />
used on the front and back cover: Flint Hills Resources, LP; Gopher Resources Corporation; the<br />
Shakopee Mdewankanton Sioux Community; Stora Enso Duluth Mills; and Xcel Energy.
Contents<br />
Volume I – Final Report<br />
Contents<br />
<strong>Recycling</strong> <strong>Treated</strong> <strong>Municipal</strong> <strong>Wastewater</strong> <strong>for</strong> <strong>Industrial</strong> <strong>Water</strong> <strong>Use</strong><br />
Executive Summary<br />
Vision ..................................................................................................................................................1<br />
Findings and Next Steps ......................................................................................................................1<br />
Section 1 – Introduction<br />
1.1 Project Vision .....................................................................................................................................3<br />
1.2 <strong>Water</strong> <strong>Use</strong> in Minnesota .....................................................................................................................4<br />
1.3 <strong>Wastewater</strong> <strong>Recycling</strong> Background ....................................................................................................6<br />
<strong>Industrial</strong> .......................................................................................................................................6<br />
Urban.............................................................................................................................................6<br />
Agricultural ...................................................................................................................................7<br />
Environmental and Recreational ...................................................................................................7<br />
Ground <strong>Water</strong> Recharge................................................................................................................7<br />
Augmentation of Potable Supplies................................................................................................7<br />
1.4 <strong>Wastewater</strong> <strong>Recycling</strong> in Minnesota ...................................................................................................7<br />
Setting and Drivers........................................................................................................................7<br />
<strong>Wastewater</strong> <strong>Recycling</strong> Applications in Minnesota .......................................................................8<br />
1.5 Summary..............................................................................................................................................9<br />
1.6 References ..........................................................................................................................................9<br />
Section 2 – Recycled <strong>Wastewater</strong> Demand and Supply<br />
2.1 Statewide Inventory ..........................................................................................................................11<br />
<strong>Industrial</strong> <strong>Water</strong> Demand ............................................................................................................11<br />
<strong>Treated</strong> <strong>Wastewater</strong> Supply ........................................................................................................13<br />
Proximity of Industries Relative to WWTPs...............................................................................14<br />
2.2 Regional Inventory ............................................................................................................................16<br />
<strong>Water</strong>shed Analysis Overview....................................................................................................16<br />
<strong>Industrial</strong> <strong>Water</strong> <strong>Use</strong> – Lower Mississippi River <strong>Water</strong>shed......................................................16<br />
<strong>Treated</strong> <strong>Wastewater</strong> Supply – Lower Mississippi River <strong>Water</strong>shed...........................................21<br />
Proximity of Industries Relative to WWTPs – Lower Mississippi River <strong>Water</strong>shed .................21<br />
Factors Influencing Potential <strong>for</strong> <strong>Industrial</strong> <strong>Use</strong> of Recycled <strong>Wastewater</strong> – Lower<br />
Mississippi River <strong>Water</strong>shed ................................................................................................24<br />
2.3 Twin Cities Metro Area Inventory ....................................................................................................24<br />
2.4 WWTP Focus – Empire and Rosemount WWTP Inventories...........................................................27<br />
2.5 Industry Focus – Ethanol Plant Inventory ........................................................................................29<br />
2.6 Summary ...........................................................................................................................................32<br />
Demand vs. Supply .....................................................................................................................32<br />
Factors Influencing Potential <strong>for</strong> <strong>Industrial</strong> <strong>Use</strong> of Recycled <strong>Wastewater</strong> .................................34<br />
2.7 References .........................................................................................................................................35<br />
Section 3 – Recycled <strong>Wastewater</strong> System Components and Costs<br />
3.1 Recycled <strong>Wastewater</strong> System Overview ...........................................................................................37<br />
3.2 <strong>Water</strong> Quality Requirements .............................................................................................................38<br />
<strong>Water</strong> Quality Overview..........................................................................................................39<br />
<strong>Industrial</strong> <strong>Water</strong> Quality Concerns ..........................................................................................41<br />
3.3 Recycled <strong>Wastewater</strong> Quality and Treatment Technologies.............................................................43<br />
Overview..................................................................................................................................43<br />
Recycled <strong>Wastewater</strong> Quality..................................................................................................44<br />
Recycled <strong>Wastewater</strong> Classifications ......................................................................................45<br />
Treatment Technologies...........................................................................................................46<br />
Metropolitan Council Environmental Services i
Contents<br />
<strong>Recycling</strong> <strong>Treated</strong> <strong>Municipal</strong> <strong>Wastewater</strong> <strong>for</strong> <strong>Industrial</strong> <strong>Water</strong> <strong>Use</strong><br />
Contents (continued)<br />
3.4 Storage and Transmission..................................................................................................................49<br />
Overview.....................................................................................................................................49<br />
Storage ........................................................................................................................................49<br />
Pumping ......................................................................................................................................49<br />
Transmission Pipelines................................................................................................................49<br />
3.5 Costs ..................................................................................................................................................50<br />
Basis and Assumptions ...............................................................................................................50<br />
Base Recycled <strong>Wastewater</strong> System Costs...................................................................................50<br />
Alternative Recycled <strong>Wastewater</strong> Treatment Costs....................................................................51<br />
Total System Costs......................................................................................................................52<br />
Cost by Standard Industry Category ...........................................................................................53<br />
Storage Costs...............................................................................................................................53<br />
Cost and Planning Considerations...............................................................................................55<br />
3.6 Summary............................................................................................................................................55<br />
3.7 References .........................................................................................................................................56<br />
Section 4 – Implementation Considerations<br />
4.1 Overview ..........................................................................................................................................57<br />
4.2 Stakeholder Input ..............................................................................................................................57<br />
Stakeholder Representation.........................................................................................................57<br />
Outcomes ....................................................................................................................................58<br />
“Demonstration” Projects............................................................................................................59<br />
4.3 Summary............................................................................................................................................60<br />
Section 5 – Summary and Potential Next Steps<br />
5.1 Summary ...........................................................................................................................................61<br />
Demand and Supply Analysis .....................................................................................................61<br />
<strong>Water</strong> Quality and Treatment Requirements...............................................................................61<br />
Costs and System Features..........................................................................................................62<br />
Implementation Issues.................................................................................................................62<br />
Long-Term Vision.......................................................................................................................63<br />
5.2 Potential Next Steps...........................................................................................................................63<br />
Exhibits<br />
Exhibit A: Cali<strong>for</strong>nia <strong>Water</strong> <strong>Recycling</strong> Criteria ................................................................................65<br />
Volume II – Appendices<br />
Appendix II-1: Technical Memorandum 1: Implementation Issues and Customer Inventory<br />
Appendix II-2: Technical Memorandum 2: Sampling Plan and Results<br />
Appendix II-3: Technical Memorandum 3: Recycled <strong>Wastewater</strong> System Components and Costs<br />
Appendix II-4: Technical Memorandum 4: Minnesota WWTP Effluent Quality<br />
Appendix II-5: Technical Memorandum 5: Stakeholder Input<br />
ii Metropolitan Council Environmental Services
List of Tables (Volume I)<br />
Contents<br />
<strong>Recycling</strong> <strong>Treated</strong> <strong>Municipal</strong> <strong>Wastewater</strong> <strong>for</strong> <strong>Industrial</strong> <strong>Water</strong> <strong>Use</strong><br />
Table 1.1. Project Areas..............................................................................................................................4<br />
Table 1.2. <strong>Water</strong> <strong>Use</strong> in Minnesota, 2004...................................................................................................5<br />
Table 1.3. <strong>Wastewater</strong> <strong>Recycling</strong> Facilities in Minnesota..........................................................................8<br />
Table 2.1. Power Generation Facilities <strong>Water</strong> <strong>Use</strong> in Minnesota, 2004 ...................................................11<br />
Table 2.2. <strong>Industrial</strong> Processing <strong>Water</strong> <strong>Use</strong> in Minnesota, 2004..............................................................12<br />
Table 2.3. Minnesota’s Available Recycled <strong>Wastewater</strong> Supply .............................................................14<br />
Table 2.4. <strong>Industrial</strong> <strong>Water</strong> <strong>Use</strong> in the Lower Mississippi River <strong>Water</strong>shed............................................16<br />
Table 2.5. Larger WWTPs in the Lower Mississippi River <strong>Water</strong>shed....................................................21<br />
Table 2.6. Industries in the Lower Mississippi River <strong>Water</strong>shed Within 4 Miles of a WWTP................23<br />
Table 2.7. Industries Within a 5-Mile Radius of Empire and Rosemount WWTPs .................................29<br />
Table 2.8. Ethanol Plant Capacity and <strong>Water</strong> <strong>Use</strong>....................................................................................31<br />
Table 2.9. Select Plants in Relation to Recycled <strong>Wastewater</strong> Supply ......................................................31<br />
Table 2.10. Annual Average Demand and Supply Summary .....................................................................32<br />
Table 2.11. <strong>Industrial</strong> <strong>Water</strong> Demand and Recycled <strong>Wastewater</strong> Supply Summary by <strong>Water</strong>shed...........33<br />
Table 3.1. Cali<strong>for</strong>nia <strong>Water</strong> <strong>Recycling</strong> Criteria (<strong>Industrial</strong> <strong>Use</strong>) ..............................................................39<br />
Table 3.2. Generalized <strong>Water</strong> Quality Criteria <strong>for</strong> Select <strong>Industrial</strong> <strong>Use</strong>s................................................40<br />
Table 3.3. Treatment Requirements and Technology Selection Factors ..................................................43<br />
Table 3.4. Recycled <strong>Wastewater</strong> Classifications ......................................................................................45<br />
Table 3.5. <strong>Water</strong> Quality <strong>for</strong> Recycled <strong>Wastewater</strong> Classifications.........................................................46<br />
Table 3.6. <strong>Water</strong> Quality and Treatment Requirements by Industry Category.........................................48<br />
Table 3.7. Select Industry Subcategories..................................................................................................48<br />
Table 3.8. Treatment Costs <strong>for</strong> Tertiary 1 through Tertiary 4 Systems ....................................................51<br />
Table 3.9. Estimated Costs <strong>for</strong> a 1 mgd Recycled <strong>Wastewater</strong> System....................................................52<br />
Table 3.10. Costs to Supply Recycled <strong>Wastewater</strong> to Minnesota Industries..............................................54<br />
Table 4.1. Industry Workshop Attendees..................................................................................................57<br />
Metropolitan Council Environmental Services iii
Contents<br />
<strong>Recycling</strong> <strong>Treated</strong> <strong>Municipal</strong> <strong>Wastewater</strong> <strong>for</strong> <strong>Industrial</strong> <strong>Water</strong> <strong>Use</strong><br />
List of Figures (Volume 1)<br />
Figure ES.1. Key Findings ............................................................................................................................1<br />
Figure ES.2. <strong>Water</strong> <strong>Use</strong> in Minnesota, 2004 .................................................................................................2<br />
Figure ES.3. Comparison of Treatment System Costs <strong>for</strong> 5-Mile Transmission ..........................................2<br />
Figure 1.1. <strong>Water</strong> <strong>Use</strong> in Minnesota, 2004 .................................................................................................4<br />
Figure 1.2. <strong>Water</strong> <strong>Use</strong> in Minnesota Without Power Generation, 2004 .....................................................5<br />
Figure 1.3. Mankato <strong>Water</strong> Reclamation Facility.......................................................................................8<br />
Figure 2.1. Power Generation Facilities Total <strong>Water</strong> <strong>Use</strong>, 2004 ..............................................................11<br />
Figure 2.2. <strong>Industrial</strong> Processing Total <strong>Water</strong> <strong>Use</strong>, 2004 .........................................................................12<br />
Figure 2.3. <strong>Industrial</strong> Processing Ground <strong>Water</strong> <strong>Use</strong>, 2004 .....................................................................13<br />
Figure 2.4. Capacity and Number of <strong>Municipal</strong> WWTPs in Minnesota...................................................13<br />
Figure 2.5. 2005 Annual Average Flows <strong>for</strong> WWTPs with Permitted Capacities >1 mgd in Minnesota 14<br />
Figure 2.6. State Demand and Supply Inventory ......................................................................................15<br />
Figure 2.7. Minnesota <strong>Water</strong>sheds............................................................................................................17<br />
Figure 2.8. Ground <strong>Water</strong> Availability in Minnesota ...............................................................................18<br />
Figure 2.9. Ground <strong>Water</strong> Contamination Susceptibility in Minnesota....................................................19<br />
Figure 2.10. <strong>Industrial</strong> Processing <strong>Water</strong> <strong>Use</strong> in the Lower Mississippi River <strong>Water</strong>shed, 2004 ..............20<br />
Figure 2.11. Power Generation <strong>Water</strong> <strong>Use</strong> in the Lower Mississippi River <strong>Water</strong>shed, 2004...................20<br />
Figure 2.12. Lower Mississippi River <strong>Water</strong>shed Inventory ......................................................................22<br />
Figure 2.13. Twin Cities Metro Area Demand & Supply Inventory – DNR <strong>Water</strong> Appropriations<br />
Permits....................................................................................................................................25<br />
Figure 2.14. Twin Cities Metro Area Demand & Supply Inventory – MCES <strong>Industrial</strong> Dischargers .......26<br />
Figure 2.15. Metro Area <strong>Industrial</strong> <strong>Water</strong> Demand, 2005 ..........................................................................27<br />
Figure 2.16. Industries in Proximity to Empire & Rosemount WWTPs.....................................................28<br />
Figure 2.17. Ethanol Plants in Minnesota ...................................................................................................30<br />
Figure 2.18. Comparison of <strong>Treated</strong> <strong>Wastewater</strong> Supply to <strong>Industrial</strong> Demands by <strong>Water</strong>shed................32<br />
Figure 3.1. Recycled <strong>Wastewater</strong> System Conceptual Model ..................................................................38<br />
Figure 3.2. Treatment Technologies by Recycled <strong>Wastewater</strong> Classification..........................................46<br />
Figure 3.3. Recycled <strong>Wastewater</strong> System Cost of Service <strong>for</strong> 0-5 mgd Capacity Base System ..............50<br />
Figure 3.4. Recycled <strong>Wastewater</strong> System Cost of Service <strong>for</strong> 5-30 mgd Capacity Base System ............50<br />
Figure 3.5. Treatment Costs <strong>for</strong> Tertiary 1 through Tertiary 4 Processes.................................................51<br />
Figure 3.6. Comparison of Base and Membrane Softening System Costs <strong>for</strong> 5-Mile Transmission .......52<br />
Figure 3.7. Range of Treatment Costs <strong>for</strong> a 1 mgd Supply by Industry Category....................................53<br />
Figure 4.1. Implementation Issue Focus Areas.........................................................................................58<br />
Figure 5.1. Steps on Implementation of Broad-Scale <strong>Wastewater</strong> <strong>Recycling</strong> Programs..........................63<br />
iv Metropolitan Council Environmental Services
List of Abbreviations<br />
Contents<br />
<strong>Recycling</strong> <strong>Treated</strong> <strong>Municipal</strong> <strong>Wastewater</strong> <strong>for</strong> <strong>Industrial</strong> <strong>Water</strong> <strong>Use</strong><br />
$/1000 gallons dollars per thousand gallons<br />
bgy billion gallons per year<br />
CBOD carbonaceous biochemical oxygen demand<br />
CBOD5 5-day carbonaceous biochemical oxygen demand<br />
COD chemical oxygen demand<br />
DBPs disinfection byproducts<br />
DIP ductile iron pipe<br />
ECOC emerging contaminants of concern<br />
ED electrodialysis<br />
EDCs endocrine disrupting compounds<br />
fps feet per second<br />
gpy gallons per year<br />
I&I infiltration and inflow<br />
LCMR Legislative Commission on Minnesota Resources<br />
MCES Metropolitan Council Environmental Services<br />
MDH Minnesota Department of Health<br />
MDNR Minnesota Department of Natural Resources<br />
MEC Mankato Energy Center<br />
Met Council Metropolitan Council<br />
mgd million gallons per day<br />
mgy million gallons per year<br />
MPCA Minnesota Pollution Control Agency<br />
MTBE methyl tertiary-butyl ether<br />
NDMA N-nitrosodimethylamine<br />
NH3 Ammonia<br />
NPDES National Pollutant Discharge Elimination System<br />
PhACs pharmaceutically active chemicals<br />
psi pounds per square inch<br />
PVC polyvinyl chloride pipe<br />
RO reverse osmosis<br />
SMSC Shakopee Mdewakanton Sioux Community<br />
TDS Total Dissolved Solids<br />
Title 22 Cali<strong>for</strong>nia <strong>Water</strong> <strong>Recycling</strong> Criteria, Title 22 Cali<strong>for</strong>nia Code of Regulations<br />
TMDL total maximum daily load<br />
TOC total organic carbon<br />
TP total phosphorus<br />
TSS total suspended solids<br />
UV ultraviolet radiation<br />
WWTP wastewater treatment plant<br />
Metropolitan Council Environmental Services v
Executive Summary<br />
Vision<br />
Executive Summary<br />
<strong>Recycling</strong> <strong>Treated</strong> <strong>Municipal</strong> <strong>Wastewater</strong> <strong>for</strong> <strong>Industrial</strong> <strong>Water</strong> <strong>Use</strong><br />
Conserving Minnesota’s water resources is important to the state’s long-term development. The potential<br />
to use treated municipal wastewater as a water supply <strong>for</strong> industrial use is of interest as a way to conserve<br />
water resources while supporting economic<br />
Guiding Goal: Conserve Minnesota’s water resources<br />
development.<br />
With interest in recycling treated municipal<br />
wastewater growing, the Metropolitan Council<br />
(Met Council) undertook this study titled,<br />
“<strong>Recycling</strong> <strong>Treated</strong> <strong>Municipal</strong> <strong>Wastewater</strong> <strong>for</strong><br />
<strong>Industrial</strong> <strong>Water</strong> <strong>Use</strong>.” Funding <strong>for</strong> this project<br />
Benefits:<br />
Reduce ground water depletion by providing an<br />
alternative supply <strong>for</strong> nonpotable water uses<br />
Provide a reliable and potentially lower cost water<br />
source <strong>for</strong> industries<br />
was recommended by the Legislative Commission on Minnesota Resources (LCMR) from the Minnesota<br />
Environment and Natural Resources Trust Fund. The Met Council and other agencies provided in-kind<br />
contributions of staff time and production services.<br />
The study’s objectives were: (1) Determine the feasibility of recycling treated municipal wastewater <strong>for</strong><br />
industrial water use in Minnesota, and (2) Identify implementation issues associated with this recycling.<br />
Findings and Next Steps<br />
<strong>Recycling</strong> treated municipal wastewater can conserve water resources and support industries and<br />
economic development. In coming to this conclusion, the study first evaluated the feasibility of<br />
wastewater recycling as an industrial water source and then identified implementation issues. Findings are<br />
summarized in Figure ES.1 and described below.<br />
Figure ES.1. Key Findings<br />
Demand & Supply<br />
Analysis<br />
Supply is adequate <strong>for</strong><br />
demand statewide:<br />
Supply=425 mgd*<br />
Demand=445 mgd** total,<br />
with 60 mgd <strong>for</strong> ground water<br />
Matching industries and<br />
wastewater treatment plants<br />
geographically can be an<br />
issue<br />
Most immediate benefit to<br />
water resources: industrial use<br />
of ground water to reserve<br />
aquifer <strong>for</strong> potable uses<br />
Objective 1<br />
Feasibility <strong>for</strong> <strong>Industrial</strong> <strong>Water</strong> <strong>Use</strong><br />
<strong>Water</strong> Quality and<br />
Treatment Requirements<br />
<strong>Industrial</strong> water quality<br />
requirements can be met by<br />
adding new treatment<br />
processes or upgrading<br />
existing ones at municipal<br />
wastewater treatment plants<br />
Removal of hardness and<br />
high salt levels likely<br />
required <strong>for</strong> significant uses<br />
Technology is available to<br />
protect public health and<br />
meet all industry<br />
requirements<br />
Recycled wastewater can<br />
be competitive with<br />
traditional supplies in<br />
some cases<br />
Removal of hardness and<br />
high salt levels<br />
significantly adds to the<br />
cost<br />
Cost efficiency improves<br />
as wastewater usage<br />
increases, which favors<br />
systems delivering over 1<br />
mgd<br />
Objective 2<br />
Implementation Issues<br />
Environmental Stewardship:<br />
– requires a positive image<br />
– industry view = “the right<br />
thing to do”<br />
Regulations: unknowns could<br />
deter some projects<br />
Incentives and Risk:<br />
– financial incentives to<br />
compete with low cost of<br />
traditional water source<br />
– liability issues to resolve<br />
Data and Research: studies to<br />
further gather technical<br />
in<strong>for</strong>mation<br />
Metropolitan Council Environmental Services 1<br />
Costs<br />
*mgd: million gallons per day<br />
**Excludes surface water use by power facilities; based only on permitted water users<br />
Implementation<br />
Issues
Executive Summary<br />
<strong>Recycling</strong> <strong>Treated</strong> <strong>Municipal</strong> <strong>Wastewater</strong> <strong>for</strong> <strong>Industrial</strong> <strong>Water</strong> <strong>Use</strong><br />
Figure ES.2 shows that non-power industries in Minnesota use 442 million gallons per day (mgd) of<br />
water from their own permitted supplies. The<br />
quantity of treated municipal wastewater<br />
available statewide, estimated at 425 mgd,<br />
could fill a portion of this industry water<br />
demand. However, industries and wastewater<br />
plants are not always close to each other. Over<br />
half of the treated municipal wastewater, 255<br />
mgd, is generated in the Twin Cities metro<br />
area while industrial water demand in the<br />
metro area is estimated at 75 mgd.<br />
<strong>Wastewater</strong> treatment technologies are<br />
available to meet the highest levels of water<br />
quality required by industries and protect<br />
public health. Treatment technologies are<br />
becoming more competitive. For some<br />
industry needs, only minimal changes to a<br />
Figure ES.2. <strong>Water</strong> <strong>Use</strong> in Minnesota, 2004<br />
Power<br />
Generation<br />
2,380 mgd<br />
(63%)<br />
<strong>Water</strong> Utility<br />
556 mgd<br />
(15%)<br />
<strong>Industrial</strong><br />
Processing<br />
442 mgd<br />
(12%)<br />
Special Categories 33 mgd (1%)<br />
Temporary 5 mgd (
Section 1: Introduction<br />
1.1 Project Vision<br />
Section 1: Introduction<br />
<strong>Recycling</strong> <strong>Treated</strong> <strong>Municipal</strong> <strong>Wastewater</strong> <strong>for</strong> <strong>Industrial</strong> <strong>Water</strong> <strong>Use</strong><br />
Conserving Minnesota’s ground water and surface water resources is important to all the state’s<br />
inhabitants and to the state’s long-term development. The economic vitality of Minnesota requires the<br />
business sector to grow with the population of the state. While water supply availability is not currently<br />
considered a limitation <strong>for</strong> industrial development in many Minnesota communities, there are numerous<br />
areas in the state that have a limited supply of high quality water. Even within the Minneapolis/St. Paul<br />
metropolitan area (Twin Cities metro area), development is now extending to regions with less productive<br />
aquifers and future growth will increase competition <strong>for</strong> a limited water supply. Industries requiring<br />
abundant or high quality water may find it difficult to locate in some areas unless other water supply<br />
options are made known and available to them.<br />
One potential supply in water-short areas is effluent from municipal wastewater treatment plants<br />
(WWTPs), also known as recycled wastewater or reclaimed water. <strong>Municipal</strong>ities may benefit by offering<br />
recycled wastewater as an alternative water source to industries and by <strong>for</strong>ging partnerships with<br />
industries to promote conservation of a limited potable water supply and improved protection of the<br />
state’s water resources.<br />
With interest in wastewater recycling growing in the state and water protection a consistent concern <strong>for</strong><br />
Minnesotans, the Legislative Commission on Minnesota Resources (LCMR) provided Metropolitan<br />
Council (Met Council) a grant <strong>for</strong> the project documented in this report, titled, <strong>Recycling</strong> <strong>Treated</strong><br />
<strong>Municipal</strong> <strong>Wastewater</strong> <strong>for</strong> <strong>Industrial</strong> <strong>Water</strong> <strong>Use</strong>. Funding <strong>for</strong> this project, conducted from July 2005<br />
through June 2007, was recommended by the LCMR from the Minnesota Environment and Natural<br />
Resources Trust Fund. The Met Council provided<br />
additional funding <strong>for</strong> the project through in-kind<br />
contributions of staff time. In addition, other state<br />
agencies such as the Minnesota Pollution Control<br />
Agency (MPCA), Minnesota Department of<br />
Natural Resources (MDNR) and the Minnesota<br />
Department of Health (MDH) participated via<br />
Guiding Goal: Conserve Minnesota’s water resources<br />
Benefits:<br />
Reduce ground water depletion by providing an<br />
alternative supply <strong>for</strong> nonpotable water uses<br />
Provide a reliable and potentially lower cost water<br />
source <strong>for</strong> industries<br />
stakeholder meetings and technical review and input. It is estimated that 20% of project funding was from<br />
these in-kind contributions of staff time and 80% from the Minnesota Environment and Natural Resources<br />
Trust Fund.<br />
The guiding goal <strong>for</strong> this project is to promote the conservation of Minnesota’s ground water and surface<br />
water resources by recycling treated municipal wastewater <strong>for</strong> industrial use. The project is applicable to<br />
communities throughout Minnesota. Benefits include: (1) Less ground water aquifer depletion due to onetime<br />
use and discharge to surface waters; (2) Lower demand on finite water resources to support business<br />
and growth; and (3) Reliable and potentially lower cost water sources <strong>for</strong> industries.<br />
Two basic objectives were established <strong>for</strong> the project: (1) Determine the feasibility of using treated<br />
municipal wastewater as an industrial water supply and (2) Identify implementation issues associated with<br />
recycling municipal wastewater in Minnesota <strong>for</strong> industrial use.<br />
Metropolitan Council Environmental Services 3
Section 1: Introduction<br />
<strong>Recycling</strong> <strong>Treated</strong> <strong>Municipal</strong> <strong>Wastewater</strong> <strong>for</strong> <strong>Industrial</strong> <strong>Water</strong> <strong>Use</strong><br />
The project activities were directed at four areas of inquiry, as listed in Table 1.1. The demand and<br />
supply analysis asks the questions: Is there a match in the quantity of wastewater generated to the water<br />
supply demand of industries in the state? What is the proximity of existing WWTPs to industries? The<br />
water quality and treatment requirements task evaluates the quality of treated wastewater and quality<br />
requirements <strong>for</strong> various industrial uses. Potential treatment processes are identified <strong>for</strong> those applications<br />
where the supply quality does not meet the industry’s needs. The evaluation of costs addresses the<br />
Table 1.1. Project Areas<br />
economic feasibility of wastewater<br />
recycling. These three project tasks address<br />
the first project objective – to determine the<br />
feasibility of wastewater recycling <strong>for</strong><br />
industrial water use.<br />
Demand & Supply Analysis<br />
Compare industrial water demands with the available treated<br />
municipal wastewater supply.<br />
<strong>Water</strong> Quality & Treatment Requirements<br />
Compare industry water quality requirements to treated The implementation issues inquiry asks:<br />
municipal wastewater quality and identify treatment processes What needs to be considered to implement<br />
<strong>for</strong> recycled wastewater use by industry.<br />
wastewater recycling and what are the<br />
Costs<br />
obstacles? The various considerations<br />
Estimate treatment and transmission costs.<br />
include technical, regulatory, legal, and<br />
institutional elements. The findings of the<br />
Implementation Issues<br />
first three project tasks and input from<br />
Identify implementation issues.<br />
various stakeholder meetings were used to<br />
address the second objective to identify implementation issues.<br />
The remainder of this section provides background in<strong>for</strong>mation on water use and wastewater recycling<br />
activities, with a focus on Minnesota. Sections 2-4 summarize the results of the four project areas of<br />
inquiry and Section 5 provides the project summary and recommended next steps. Volume II contains<br />
technical memoranda and related in<strong>for</strong>mation that support the results shown in this report volume and<br />
provides additional details and references.<br />
1.2 <strong>Water</strong> <strong>Use</strong> in Minnesota<br />
How much water do Minnesotans use and what is it used <strong>for</strong>? Permitted water use in Minnesota ranged<br />
from 3.4 to 3.7 billion gallons per day (gpd) during 2000-2004. <strong>Water</strong> permits in Minnesota are required<br />
<strong>for</strong> all water users that withdraw more than 1<br />
million gallons per year (mgy) and/or<br />
100,000 gpd of ground or surface water.<br />
Permitted water use does not account <strong>for</strong><br />
most domestic private well or surface<br />
withdrawals. The majority of the water use<br />
in<strong>for</strong>mation reported in this document is<br />
based on the records maintained by the<br />
MDNR Appropriation Permits program.<br />
<strong>Water</strong> use data should be assumed to be based<br />
on the permit records of the MDNR unless<br />
referenced otherwise.<br />
The MDNR tracks water use by nine<br />
industrial categories, shown in Figure 1.1 and<br />
listed in Table 1.2 on the following page.<br />
Over 60% of the water used in Minnesota is<br />
Figure 1.1. <strong>Water</strong> <strong>Use</strong> in Minnesota, 2004<br />
Power<br />
Generation<br />
2,380 mgd<br />
(63%)<br />
<strong>Water</strong> Utility<br />
556 mgd<br />
(15%)<br />
<strong>Industrial</strong><br />
Processing<br />
442 mgd<br />
(12%)<br />
Special Categories 33 mgd (1%)<br />
Temporary 5 mgd (
Table 1.2. <strong>Water</strong> <strong>Use</strong> in Minnesota, 2004<br />
Annual Average <strong>Water</strong> <strong>Use</strong>, mgd<br />
Ground Surface<br />
Category <strong>Water</strong> <strong>Water</strong> Total<br />
Air Conditioning 6 1<br />
7<br />
<strong>Industrial</strong> Processing 56 385 442<br />
Major Crop Irrigation 175 28 203<br />
Non-Crop Irrigation 20 6 26<br />
Power Generation 4 2,375 2,380<br />
Special Categories 19 15 33<br />
Temporary 4 1 5<br />
<strong>Water</strong> Level Maintenance 5 95 100<br />
<strong>Water</strong> Utilities 355 201 556<br />
Total 644 3,106 3,750<br />
Source: MDNR, 2004<br />
Section 1: Introduction<br />
<strong>Recycling</strong> <strong>Treated</strong> <strong>Municipal</strong> <strong>Wastewater</strong> <strong>for</strong> <strong>Industrial</strong> <strong>Water</strong> <strong>Use</strong><br />
Nearly two-thirds of the potable-quality<br />
water supply in Minnesota is from<br />
ground water, as depicted in Figure 1.2.<br />
<strong>Water</strong> withdrawn by industries (those not<br />
served by water utilities) <strong>for</strong> various<br />
processing needs accounts <strong>for</strong> about 12%<br />
of the total water used in Minnesota.<br />
In terms of 2004 daily average demands,<br />
nearly 2,500 million gallons per day<br />
(mgd) of water was used by the state’s<br />
power generation industry and over 500<br />
mgd served as a potable-quality supply<br />
<strong>for</strong> a variety of uses. Over 400 mgd was<br />
withdrawn directly by industries <strong>for</strong> use<br />
in their businesses.<br />
Figure 1.2. <strong>Water</strong> <strong>Use</strong> in Minnesota Without Power Generation, 2004<br />
<strong>Water</strong> <strong>Use</strong>, mgd<br />
600 Surface<br />
<strong>Water</strong><br />
500<br />
400<br />
300<br />
200<br />
100<br />
0<br />
Air<br />
Cond.<br />
Source: MDNR, 2004<br />
Industry Crop<br />
Irrig.<br />
<strong>Water</strong> use was analyzed with a focus on<br />
sources most vulnerable to water supply<br />
limitations. Because little water is consumed in once-through cooling processes, replacing surface water<br />
sources with recycled wastewater does little to conserve water. To benefit the state’s water resources,<br />
recycled wastewater typically should replace a water supply that is used and not returned to its source of<br />
origin. This applies to all uses of ground water, even <strong>for</strong> once-through cooling water uses because the<br />
water is typically discharged<br />
to a surface water and not<br />
back to the original aquifer. It<br />
also pertains to surface water<br />
sources where water is<br />
consumed, as through<br />
evaporation in cooling towers<br />
or in the production<br />
operations of an industry. For<br />
industries with little water<br />
consumption, such as those<br />
that use water primarily <strong>for</strong><br />
washing operations, the<br />
benefits of replacing a surface<br />
water source with recycled<br />
wastewater will be casespecific.<br />
Surface water<br />
Non-Crop Special Temp. <strong>Water</strong><br />
Irrig.<br />
Level<br />
Maint.<br />
<strong>Water</strong><br />
Utility<br />
Ground<br />
<strong>Water</strong><br />
sources could have quantity limitations that would require use of an alternative supply, particularly if the<br />
discharge of the water is not in proximity to the withdrawal or to a different watershed. To focus on water<br />
uses with the greatest benefit to Minnesota’s water resources, this study evaluated industrial water<br />
demand without power generation facilities and in more detail <strong>for</strong> ground water uses.<br />
The analysis of annual water use indicates that the various types of industrial water use represent a major<br />
component of the state’s overall water use. Recycled wastewater could potentially be used by power<br />
generation facilities using ground water or recirculating cooling water systems (which consume water)<br />
and a variety of industries represented by the industrial processing category in the MDNR water use<br />
database. Some industries also use municipal potable supplies. The potable water supply used by<br />
industries was not assessed in detail <strong>for</strong> this study. It varies considerably from community to community,<br />
but on a regional or state-basis is estimated to be 10-20% of the potable water demand.<br />
Metropolitan Council Environmental Services 5
Section 1: Introduction<br />
<strong>Recycling</strong> <strong>Treated</strong> <strong>Municipal</strong> <strong>Wastewater</strong> <strong>for</strong> <strong>Industrial</strong> <strong>Water</strong> <strong>Use</strong><br />
The total “industrial water use”, defined by the combined water use of the power generation and industrial<br />
processing categories, is nearly 3 billion gpd, which is roughly 75% of the total major water use in the<br />
state. Ground water supplies are used to meet approximately 60 mgd or 22,000 million gpy. If we assume<br />
that Minnesota’s water utilities have an industrial customer demand of 10% of their total supply, then an<br />
additional 40 mgd of ground water is used by industries. Under this assumption, the total industrial water<br />
demand <strong>for</strong> ground water is approximately 100 mgd. This equates to the typical, potable supply use of 1<br />
million people, given the standard residential use engineering estimate of 100 gallons/person-day.<br />
1.3 <strong>Wastewater</strong> <strong>Recycling</strong> Background<br />
In Minnesota, WWTP effluent is typically discharged to a receiving stream or a land application system.<br />
However, wastewater effluent can also be beneficially used <strong>for</strong> a variety of purposes. There are various<br />
terms used to describe the beneficial use of WWTP effluent: wastewater recycling, wastewater reuse,<br />
water reuse, water recycling, or water reclamation are often used interchangeably.<br />
While this project evaluates the beneficial reuse of wastewater effluent <strong>for</strong> industrial purposes, nonindustrial<br />
uses are briefly described to indicate the full range of wastewater recycling practices. From the<br />
perspective of the municipality, investment in capital to provide recycled wastewater will typically<br />
involve a review of all options; multiple users are commonly required <strong>for</strong> wastewater recycling to be a<br />
cost-effective practice <strong>for</strong> the municipal utility. <strong>Wastewater</strong> recycling in the U.S. is typically categorized<br />
under the following major categories:<br />
<strong>Industrial</strong><br />
Urban<br />
Agricultural<br />
Environmental and recreational<br />
Ground water recharge<br />
Augmentation of potable supplies<br />
<strong>Industrial</strong><br />
<strong>Industrial</strong> reuse applications in the U.S. have steadily increased over the past decade, with an increasing<br />
diversity of industrial uses. The largest use of recycled<br />
wastewater in the U.S. has been <strong>for</strong> cooling water. The large<br />
water demands of power facilities <strong>for</strong> cooling water and<br />
other needs makes them an ideal facility <strong>for</strong> reuse. Recycled<br />
wastewater is also used as process water <strong>for</strong> a variety of<br />
applications at petroleum refineries, chemical plants, metal<br />
working, pulp and paper mills, and other production<br />
facilities. Another larger use of water by industries is <strong>for</strong><br />
washing or wetting requirements <strong>for</strong> industries such as<br />
laundries, sand and gravel washing operations, or dust<br />
suppression.<br />
Urban<br />
Recycled wastewater is used <strong>for</strong> a variety of purposes in the urban setting. One common use, that is one<br />
of the few wastewater recycling applications in Minnesota, is <strong>for</strong> golf<br />
course irrigation. Other typical irrigation reuse applications include:<br />
public lands such as parks, athletic fields, highway medians and<br />
shoulders, landscaped areas <strong>for</strong> commercial properties, and<br />
landscaping <strong>for</strong> residential areas. Other examples of “urban” reuse<br />
applications include vehicle washing facilities, fire protection, toilet<br />
and urinal flushing in commercial buildings, decorative water features<br />
such as fountains and reflecting pools, street sweeping, and dust<br />
control and soil compaction <strong>for</strong> construction projects.<br />
6 Metropolitan Council Environmental Services
Section 1: Introduction<br />
<strong>Recycling</strong> <strong>Treated</strong> <strong>Municipal</strong> <strong>Wastewater</strong> <strong>for</strong> <strong>Industrial</strong> <strong>Water</strong> <strong>Use</strong><br />
Agricultural<br />
In many states, agricultural irrigation is a significant percent of the total water demand and is estimated to<br />
represent 40% of the total water demand nationwide [Solley et al, 1998]. Recycled wastewater has been<br />
used to irrigate a variety of agricultural applications including: pasture; orchards and vineyards; harvested<br />
feed, fiber and seed; food crops; processed food crops; and nursery and sod. Florida uses 19% of its<br />
recycled wastewater supply <strong>for</strong> agricultural irrigation [Florida Department of Environmental Protection,<br />
2002] and Cali<strong>for</strong>nia uses approximately 48% [Cali<strong>for</strong>nia State <strong>Water</strong> Resources Control Board, 2002].<br />
Environmental and Recreational<br />
Recycled wastewater has been used <strong>for</strong> environmental improvements and recreational uses.<br />
Environmental reuse includes wetland enhancement and restoration, creation<br />
of wetlands <strong>for</strong> wildlife habitat, and stream augmentation. Wetland reuse<br />
projects often include dual goals: to enhance downstream surface water<br />
quality and create additional wildlife habitat. Recreational applications <strong>for</strong><br />
recycled wastewater include water impoundments restricted to boating and<br />
fishing, smaller landscape impoundments, and golf course ponds.<br />
Ground <strong>Water</strong> Recharge<br />
Ground water recharge using recycled wastewater has been used to reduce<br />
saltwater intrusion in coastal aquifers, augment potable or nonpotable<br />
aquifers, provide storage and/or further treatment of recycled wastewater <strong>for</strong><br />
later use, and prevent ground subsidence. In areas with extensive agricultural<br />
irrigation, ground water recharge practices rely on the aquifers <strong>for</strong> storage, removing the need <strong>for</strong> storage<br />
facilities to meet seasonal demands.<br />
Augmentation of Potable Supplies<br />
Potable water supplies can be supplemented with treated wastewater by surface water augmentation,<br />
ground water recharge, and direct potable reuse. The first two applications are indirect potable reuse,<br />
which has been defined as the augmentation of a community’s raw water supply with treated wastewater<br />
followed by an environmental buffer [Crook, 2001]. In this case, the treated wastewater is mixed with<br />
surface and/or ground water and receives additional treatment prior to entering the potable water<br />
distribution system. Direct potable reuse is defined as the introduction of treated wastewater directly into<br />
a water distribution system without intervening storage (pipe-to-pipe) [Crook, 2001]. There are no direct<br />
potable reuse applications in the U.S.<br />
1.4 <strong>Wastewater</strong> <strong>Recycling</strong> in Minnesota<br />
Setting and Drivers<br />
Minnesota is known <strong>for</strong> its abundance of water, as the “Land of 10,000 Lakes.” A safe, cost-effective, and<br />
adequate water supply has been easily attained <strong>for</strong> many Minnesota industries and communities, but there<br />
are some regions where water quality is impaired or declining or where water supply is limited. Section 2<br />
provides additional in<strong>for</strong>mation about these areas. Minnesota’s environmental stewardship ethic has<br />
promoted the need to conserve water resources and programs have been implemented across the state.<br />
Conservation has gone hand-in-hand with improved water protection programs and more stringent<br />
regulations <strong>for</strong> surface water dischargers. In the future, residential and industrial growth in some areas of<br />
Minnesota could potentially be curtailed because of a limited water supply, even with more stringent<br />
conservation practices. Alternative supplies will be sought – and treated wastewater effluent is one<br />
potential supply.<br />
<strong>Water</strong> quality considerations may also drive more wastewater recycling in Minnesota. As growing<br />
communities generate additional wastewater, there will be a need to provide higher and higher levels of<br />
wastewater treatment to maintain or decrease the discharge loads to the state’s waterways. Finding other<br />
uses <strong>for</strong> the treated wastewater, through partnerships with industry, will decrease wastewater discharges.<br />
Metropolitan Council Environmental Services 7
Section 1: Introduction<br />
<strong>Recycling</strong> <strong>Treated</strong> <strong>Municipal</strong> <strong>Wastewater</strong> <strong>for</strong> <strong>Industrial</strong> <strong>Water</strong> <strong>Use</strong><br />
The development of Minnesota’s Total Maximum Daily Load (TMDL) program will affect the discharge<br />
allocations <strong>for</strong> many communities. For example, the Lake Pepin TMDL will affect nearly two-thirds of<br />
the state. With a potential reduction requirement of one-half the phosphorus and solids loads to Lake<br />
Pepin, and nonpoint source reduction practices still untested, it is likely that point source reductions will<br />
be part of the solution. <strong>Wastewater</strong> recycling may be a cost-effective solution <strong>for</strong> some communities,<br />
particularly when tertiary treatment processes are required to meet receiving stream discharge limits. If<br />
these communities are also experiencing water supply limitations, the benefits of a wastewater recycling<br />
option could be even more pronounced.<br />
<strong>Wastewater</strong> <strong>Recycling</strong> Applications in Minnesota<br />
Using recycled wastewater <strong>for</strong> irrigation has historically been practiced in Minnesota because surface<br />
discharges are not possible in some areas and land application is used. Many of Minnesota’s rural pond<br />
systems spray irrigate agricultural fields during the summer months when the ponds discharge. More<br />
recent reuse applications involve cooling water <strong>for</strong> power generation, golf course irrigation in urban and<br />
resort areas, and as toilet flush water <strong>for</strong> an institutional building. Table 1.3 provides a list of facilities that<br />
Table 1.3. <strong>Wastewater</strong> <strong>Recycling</strong> Facilities in Minnesota<br />
Facility Type of Reuse Flow, mgd<br />
Hennepin County Public Works Toilet flush water 0.0056<br />
Lake Allie Golf course irrigation 0.0056<br />
Turtle Run South Golf course irrigation 0.0168<br />
Izaty’s Golf and Yacht Club Golf course and alfalfa field irrigation 0.086<br />
City of Nisswa Golf course irrigation and other uses 0.038<br />
City of Montgomery Golf course irrigation and other uses 0.038<br />
Shakopee Mdewakanton Sioux Community Wetland enhancement 0.96<br />
City of Mankato <strong>Industrial</strong> – cooling water <strong>for</strong> power plant 6.2<br />
are using treated, municipal wastewater effluent in Minnesota <strong>for</strong> uses other than agricultural irrigation.<br />
The urban irrigation and toilet flush water systems used wastewater recycling because this was the<br />
optimum practice <strong>for</strong> their wastewater discharge.<br />
The Shakopee Mdewakanton Sioux Community (SMSC)’s 0.96 mgd WWTP is permitted to discharge to<br />
one of two wetlands with downstream ponded areas that provide water <strong>for</strong> their golf course irrigation<br />
system. State agencies are working with the SMSC to explore aquifer recharge to be used primarily in the<br />
winter when irrigation is not needed.<br />
The one industrial recycled wastewater application<br />
in Minnesota was developed because of water<br />
supply limitations. The Mankato Energy Center<br />
(MEC) uses 6.2 mgd of treated wastewater from the<br />
Mankato WWTP <strong>for</strong> its cooling water. Mankato<br />
expanded their WWTP, shown in Figure 1.3, to<br />
provide the water quality required <strong>for</strong> the cooling<br />
towers. The MEC cooling water discharge is<br />
returned to the plant as a permitted industrial user<br />
and commingled with treated effluent prior to<br />
dechlorination. The MEC uses an evaporative<br />
cooling process with an average loss of 75%. The<br />
MEC produces 365 megawatts with an ultimate<br />
capacity of 630 megawatts.<br />
Figure 1.3. Mankato <strong>Water</strong> Reclamation Facility<br />
8 Metropolitan Council Environmental Services
1.5 Summary<br />
Section 1: Introduction<br />
<strong>Recycling</strong> <strong>Treated</strong> <strong>Municipal</strong> <strong>Wastewater</strong> <strong>for</strong> <strong>Industrial</strong> <strong>Water</strong> <strong>Use</strong><br />
Interest in wastewater recycling is growing in Minnesota. Implementation of several projects over the past<br />
few years demonstrates that some non-drinking water supply needs in Minnesota can be met by<br />
municipally treated wastewater. These applications were driven by either a limitation in the water supply<br />
quantity available or the receiving stream discharge options of an area. Limitations on water supply and<br />
wastewater discharges are expected to increase with future growth across the state. Recycled wastewater<br />
is an alternative water supply to potable water sources and, if the water use is consumptive, can reduce<br />
discharges to receiving waters. Of particular interest to this study are the wastewater recycling<br />
opportunities available <strong>for</strong> the industrial sector of Minnesota – looking to meet the needs of industry<br />
while also conserving Minnesota’s water resources.<br />
Minnesota’s industries, represented by all power generation and industrial processing facilities, are the<br />
largest water users in the state – using about 75% of the 1,370 billion gallons of water withdrawn in 2004,<br />
or an equivalent 3,750 mgd. Over 60% of this supply is surface water used by power generation facilities<br />
<strong>for</strong> once-through cooling and is nearly all returned to the same surface water source in proximity to the<br />
withdrawal. Because little water is consumed in once-through cooling processes, replacing surface water<br />
sources with recycled wastewater does little to conserve water or reduce discharge loadings to state<br />
waterways. When power generation facilities using surface water are excluded, the industrial demand <strong>for</strong><br />
water in 2004 was 445 mgd. Of this amount, 60 mgd was supplied by ground water. Coupling this 60<br />
mgd with a conservative estimate of the amount of industrial water supply provided by a water utility, it is<br />
estimated that the total industrial water demand <strong>for</strong> ground water in the state in 2004 was 100 mgd.<br />
1.6 References<br />
Cali<strong>for</strong>nia State <strong>Water</strong> Resources Control Board. 2002. 2002 Statewide Recycled <strong>Water</strong> Survey.<br />
Cali<strong>for</strong>nia State <strong>Water</strong> Resources Control Board, Office of <strong>Water</strong> <strong>Recycling</strong>, Sacramento, Cali<strong>for</strong>nia.<br />
Available from http://www.swrcb.ca.gov/recycling/munirec.html.<br />
Crook, J. 2001. National Research Council Report on Potable Reuse. In: Proceedings of the 2001 Annual<br />
WateReuse Research Conference, June 4-5, 2001, Monterey, Cali<strong>for</strong>nia.<br />
Florida Department of Environmental Protection. 2002. 2001 Reuse Inventory. Florida Department of<br />
Environmental Protection. Tallahassee, Florida.<br />
Minnesota Department of Natural Resources (MDNR). 2004. Minnesota <strong>Water</strong> Appropriations Permit<br />
Program, State <strong>Water</strong> <strong>Use</strong> Data System. Data summarized through 2004 were obtained from the MDNR<br />
website in March 2006.<br />
Solley, Wayne B., R. R. Pierce, H. and A. Perlman. 1988. U.S. Geological Survey Circular 1200:<br />
Estimated <strong>Use</strong> of <strong>Water</strong> in the United States in 1995. Denver, Colorado.<br />
Metropolitan Council Environmental Services 9
Section 1: Introduction<br />
<strong>Recycling</strong> <strong>Treated</strong> <strong>Municipal</strong> <strong>Wastewater</strong> <strong>for</strong> <strong>Industrial</strong> <strong>Water</strong> <strong>Use</strong><br />
10 Metropolitan Council Environmental Services
Section 2: Recycled <strong>Wastewater</strong> Demand & Supply<br />
<strong>Recycling</strong> <strong>Treated</strong> <strong>Municipal</strong> <strong>Wastewater</strong> <strong>for</strong> <strong>Industrial</strong> <strong>Water</strong> <strong>Use</strong><br />
Section 2: Recycled <strong>Wastewater</strong> Demand and Supply<br />
This section answers the question: Is there a sufficient treated wastewater supply in Minnesota to meet the<br />
industrial water demand? Historical water use in the state <strong>for</strong> major industrial users is reviewed in context<br />
with the location and production capacity of municipal WWTPs. Data are summarized on a state and<br />
watershed basis. General characteristics of area water supplies are summarized to identify areas with a<br />
higher need <strong>for</strong> alternative water sources. The Twin Cities metro area is also examined focusing on<br />
industries located within a specified radius of each WWTP. Customer inventories were developed <strong>for</strong><br />
each watershed in Minnesota and <strong>for</strong> the areas tributary to each WWTP in the Twin Cities metro area.<br />
This section presents the customer inventory <strong>for</strong> the Lower Mississippi River watershed and the Empire<br />
WWTP as examples and summarizes demand and supply by watershed. Appendix II-1 provides the<br />
complete customer inventories <strong>for</strong> the other nine Minnesota watersheds and eight Twin Cities metro area<br />
WWTPs.<br />
2.1 Statewide Inventory<br />
<strong>Industrial</strong> <strong>Water</strong> Demand<br />
As discussed in Section 1, this study used the MDNR water<br />
appropriations permit database (MDNR, 2004) to quantify<br />
Minnesota’s industrial water demand. The MDNR categories of<br />
power generation and industrial processing are used to define<br />
the industrial demand. Subcategories further delineate the uses<br />
of industrial water supplies.<br />
The largest use of water in Minnesota is <strong>for</strong> once-through<br />
cooling at steam power generation plants. As shown in Figure<br />
2.1, these facilities use about half of the water used by the power<br />
generation industry. The next largest use of water <strong>for</strong> power<br />
generation is <strong>for</strong> nuclear plant cooling water, followed by other<br />
steam power non-cooling water uses. Almost all of the water<br />
used <strong>for</strong> power generation is supplied by surface waters, as<br />
Figure 2.1. Power Generation<br />
Facilities Total <strong>Water</strong> <strong>Use</strong>, 2004<br />
Nuclear Power Plant<br />
853 mgd<br />
(36%)<br />
Steam<br />
Power Other<br />
than Cooling<br />
327 mgd<br />
(14%)<br />
Steam Power Cooling:<br />
Once through<br />
1,180 mgd (50%)<br />
Steam Power Cooling: Wet Tower<br />
20 mgd (1%)<br />
indicated in Table 2.1. Source: MDNR, 2004<br />
Table 2.1. Power Generation Facilities <strong>Water</strong> <strong>Use</strong> in Minnesota, 2004<br />
<strong>Water</strong> <strong>Use</strong>, mgd<br />
Ground Surface<br />
Category <strong>Water</strong> <strong>Water</strong> Total<br />
Hydropower 0
Section 2: Recycled <strong>Wastewater</strong> Demand & Supply<br />
<strong>Recycling</strong> <strong>Treated</strong> <strong>Municipal</strong> <strong>Wastewater</strong> <strong>for</strong> <strong>Industrial</strong> <strong>Water</strong> <strong>Use</strong><br />
For the non-power related industries under the industrial processing category, the mining and pulp and<br />
paper industries are the largest water users, as listed in Table 2.2 and shown in Figure 2.2. These<br />
industries use mainly surface water supplies. The mining industry consumes very little water. Most of the<br />
withdrawals are <strong>for</strong> dewatering and the water is stored in mining pits. The pulp and paper industry has<br />
mixed uses of water, with some facilities consuming a significant portion of their incoming water supply.<br />
Facilities within this industry continue to decrease their water requirements with process upgrades. The<br />
total pulp and paper facility use decreased nearly 20 mgd from 2000 to 2004.<br />
Table 2.2. <strong>Industrial</strong> Processing <strong>Water</strong> <strong>Use</strong> in Minnesota, 2004<br />
<strong>Water</strong> <strong>Use</strong>, mgd<br />
Ground Surface<br />
Category <strong>Water</strong> <strong>Water</strong> Total<br />
Agricultural processing (food & livestock) 25
Section 2: Recycled <strong>Wastewater</strong> Demand & Supply<br />
<strong>Recycling</strong> <strong>Treated</strong> <strong>Municipal</strong> <strong>Wastewater</strong> <strong>for</strong> <strong>Industrial</strong> <strong>Water</strong> <strong>Use</strong><br />
shops, and facilities <strong>for</strong> electronic and computer production, electroplating, and other metal product<br />
fabrications. Sand and gravel operations located away from major rivers rely on ground water sources,<br />
Figure 2.3. <strong>Industrial</strong> Processing Ground <strong>Water</strong> <strong>Use</strong>, 2004<br />
Other<br />
1 mgd (2%)<br />
Non-Metals<br />
3 mgd (5%)<br />
Metals 4 mgd<br />
(7%)<br />
Agriculture<br />
25 mgd<br />
(45%)<br />
Cooling<br />
Petro, Chem., Once-thru<br />
Ethanol 6 mgd<br />
12 mgd 10%<br />
(19%)<br />
Pulp &<br />
Paper<br />
2 mgd (4%)<br />
Mining<br />
50<br />
8<br />
10<br />
1
Section 2: Recycled <strong>Wastewater</strong> Demand & Supply<br />
<strong>Recycling</strong> <strong>Treated</strong> <strong>Municipal</strong> <strong>Wastewater</strong> <strong>for</strong> <strong>Industrial</strong> <strong>Water</strong> <strong>Use</strong><br />
WWTPs. Larger WWTPs are defined in this study as WWTPs with permitted capacities greater than or<br />
equal to 1 mgd and smaller WWTPs have permitted capacities less than 1 mgd. The permitted capacity is<br />
the capacity defined in the National Pollutant Discharge Elimination (NPDES) Permit, and typically is the<br />
design average wet weather flow. The<br />
largest six WWTPs in the state treat over<br />
60% of the state’s wastewater, as<br />
represented by the plant flow ranges of 10-<br />
50 mgd and greater than 50 mgd in Figure<br />
2.5. Many smaller WWTPs, with permitted<br />
capacities less than 1 mgd (not included in<br />
Figure 2.5), discharge intermittently and<br />
use of annual average data can be<br />
misleading. An estimated range of annual<br />
average flows <strong>for</strong> smaller WWTPs is<br />
assumed in this study to be 75% of the<br />
permitted capacity. Given a combined<br />
design capacity of 100 mgd <strong>for</strong> the 517<br />
WWTPs with permitted capacities less than<br />
Figure 2.5. 2005 Annual Average Flows <strong>for</strong> WWTPs with<br />
Permitted Capacities >1 mgd in Minnesota<br />
Combined Annual Average Flow, mgd<br />
1 mgd, approximately 75 mgd of treated wastewater supply could be available from smaller facilities.<br />
Table 2.3 summarizes the capacity and historic state treated wastewater supply, based on the MPCA<br />
Discharge Monitoring Report database (MPCA, 2005).<br />
210<br />
180<br />
150<br />
120<br />
90<br />
60<br />
30<br />
0<br />
22<br />
Source: MPCA, 2005<br />
Table 2.3. Minnesota’s Available Recycled <strong>Wastewater</strong> Supply<br />
All<br />
WWTPs<br />
No. of Facilities<br />
22<br />
17<br />
0-1 1-2 2-5 5-10 10-50 >50<br />
Individual WWTP Annual Average Flow, mgd<br />
WWTPs with Permitted<br />
Capacities >1 mgd<br />
4<br />
5<br />
WWTPs with Permitted<br />
Capacities 1 mgd and an estimate <strong>for</strong> flow from smaller WWTPs<br />
2 WWTP flow <strong>for</strong> plants with permitted capacities
Section 2: Recycled <strong>Wastewater</strong> Demand & Supply<br />
<strong>Recycling</strong> <strong>Treated</strong> <strong>Municipal</strong> <strong>Wastewater</strong> <strong>for</strong> <strong>Industrial</strong> <strong>Water</strong> <strong>Use</strong><br />
2.2 Regional Inventory<br />
<strong>Water</strong>shed Analysis Overview<br />
Regional demand and supply were analyzed on a watershed basis to provide a more detailed account of<br />
industrial demand and proximity to a treated wastewater supply. Figure 2.7 identifies the ten major<br />
watersheds in Minnesota. This section of the report focuses on the Lower Mississippi River watershed as<br />
an example of the analysis provided <strong>for</strong> each watershed documented in Volume II-Appendix 1.<br />
Indices on the availability of ground water supplies and the susceptibility of these supplies to<br />
contamination were also applied regionally to determine areas <strong>for</strong> which wastewater recycling may help<br />
protect ground water resources. <strong>Water</strong> supply availability is reviewed on a regional level using the<br />
MDNR’s classification of Minnesota into six ground water areas (MDNR, 2005). The areas are<br />
categorized by the general availability of ground water in the bedrock and two overlying sediment layers<br />
classified as surficial sands and buried sands, shown in Figure 2.8. Appendix II-1 (Appendix D) contains<br />
the classification system and supporting documentation. Additional in<strong>for</strong>mation on quantity and quality of<br />
ground water is summarized from the MPCA’s regional ground water profiles (MPCA, 1995). The<br />
statewide assessment of susceptibility to ground water contamination (MPCA, 1989), as shown in Figure<br />
2.9, is also used to identify ground water supply issues. These assessments by MDNR and MPCA provide<br />
higher level indicators of ground water quantity and quality concerns that can be applied uni<strong>for</strong>mly across<br />
the state.<br />
<strong>Industrial</strong> <strong>Water</strong> <strong>Use</strong> – Lower Mississippi River <strong>Water</strong>shed<br />
The Lower Mississippi River watershed has a diverse base of industries, as summarized in Table 2.4 and<br />
Figures 2.10 and 2.11. The largest water use is related to power generation facilities (nuclear power plant,<br />
steam power cooling and miscellaneous power generation uses). Over 570 mgd of water was used <strong>for</strong><br />
power generation in 2004, of which all but 1 mgd was obtained from surface water supplies. The Prairie<br />
Island Nuclear Plant used over 500 mgd in 2004 and another 70 mgd was used <strong>for</strong> once-through cooling<br />
at the Xcel facility near Red Wing and the Rochester Public Utilities plant. There are several agricultural<br />
processing facilities in this watershed with a combined water use of 2.9 mgd in 2004. Flint Hills<br />
Resources withdrew 6.5 mgd from its set of wells <strong>for</strong> processing of petrochemical products.<br />
Table 2.4. <strong>Industrial</strong> <strong>Water</strong> <strong>Use</strong> in the Lower Mississippi River <strong>Water</strong>shed<br />
2004 <strong>Water</strong> <strong>Use</strong>, mgd<br />
Industry Category Ground <strong>Water</strong> Surface <strong>Water</strong> Total<br />
Agricultural Processing 3 0 3<br />
<strong>Industrial</strong> Process Cooling - Once Through
Figure 2.7. Minnesota <strong>Water</strong>sheds<br />
•<br />
Sand Hili<br />
"...<br />
e." 'I.<br />
•<br />
o Cedar River<br />
• Des Moines River<br />
[] Lower Mississippi River<br />
o Minnesota River<br />
o Mississippi River - Headwaters<br />
II Missouri River<br />
Rainy River<br />
• Red River of the North<br />
• 51. Croix River<br />
o Western lake Superior<br />
Section 2: Recycled <strong>Wastewater</strong> Demand & Supply<br />
<strong>Recycling</strong> <strong>Treated</strong> <strong>Municipal</strong> <strong>Wastewater</strong> <strong>for</strong> <strong>Industrial</strong> <strong>Water</strong> <strong>Use</strong><br />
"'.••'.,<br />
N<br />
A<br />
Metropolitan Council Environmental Services 17<br />
•<br />
•<br />
.6.. WWTP >= 5 mgd<br />
o I<br />
"" If'NITp 1-5 mgd<br />
50<br />
I<br />
Roo<br />
100 Miles<br />
I
Figure 2.9. Ground <strong>Water</strong> Contamination Susceptibility in Minnesota<br />
o <strong>Water</strong>sheds<br />
Section 2: Recycled <strong>Wastewater</strong> Demand & Supply<br />
<strong>Recycling</strong> <strong>Treated</strong> <strong>Municipal</strong> <strong>Wastewater</strong> <strong>for</strong> <strong>Industrial</strong> <strong>Water</strong> <strong>Use</strong><br />
-1-<br />
Legend<br />
Highest Susoeplibili!y<br />
MGdium Susc911libili1y<br />
low Susceptibility<br />
lowest SUscep1iblity<br />
Insufflciant Dala 10 Rank<br />
Source: MPCA, 1989 (updated in 2005)<br />
Metropolitan Council Environmental Services 19
Section 2: Recycled <strong>Wastewater</strong> Demand & Supply<br />
<strong>Recycling</strong> <strong>Treated</strong> <strong>Municipal</strong> <strong>Wastewater</strong> <strong>for</strong> <strong>Industrial</strong> <strong>Water</strong> <strong>Use</strong><br />
Figure 2.10. <strong>Industrial</strong> Processing <strong>Water</strong> <strong>Use</strong> in the Lower Mississippi<br />
River <strong>Water</strong>shed, 2004<br />
<strong>Water</strong> <strong>Use</strong>, mgd<br />
8<br />
7<br />
6<br />
5<br />
4<br />
3<br />
2<br />
1<br />
0<br />
Agriculture Sand<br />
&<br />
Gravel<br />
Source: MDNR, 2004<br />
Once-<br />
Through<br />
Cooling<br />
Petro/<br />
Chem/<br />
Ethanol<br />
Metals Non-<br />
Metal<br />
Ground <strong>Water</strong><br />
Surface <strong>Water</strong><br />
Figure 2.11. Power Generation <strong>Water</strong> <strong>Use</strong> in the Lower Mississippi River<br />
<strong>Water</strong>shed, 2004<br />
<strong>Water</strong> <strong>Use</strong>, mgd<br />
600<br />
500<br />
400<br />
300<br />
200<br />
100<br />
0<br />
71<br />
Steam<br />
Cooling:<br />
Once-<br />
Through<br />
Source: MDNR, 2004<br />
Steam<br />
Cooling:<br />
Wet<br />
Tower<br />
506<br />
Section 2: Recycled <strong>Wastewater</strong> Demand & Supply<br />
<strong>Recycling</strong> <strong>Treated</strong> <strong>Municipal</strong> <strong>Wastewater</strong> <strong>for</strong> <strong>Industrial</strong> <strong>Water</strong> <strong>Use</strong><br />
<strong>Treated</strong> <strong>Wastewater</strong> Supply – Lower Mississippi River <strong>Water</strong>shed<br />
There are 12 municipal WWTPs in the Lower Mississippi River watershed with design capacities greater<br />
than 1 mgd. Table 2.5 summarizes the design capacity and historic flows <strong>for</strong> the plants. There are three<br />
facilities within 70% of the design capacity: Owatonna, Plainview-Elgin, and Rochester. Rochester is<br />
nearing completion of construction <strong>for</strong> an expansion to 24 mgd. In 2005, approximately 40 mgd of treated<br />
wastewater was discharged into the Lower Mississippi River watershed from these 12 facilities. Smaller<br />
WWTPs account <strong>for</strong> 16% of the combined capacity of WWTPs discharging to surface waters in the<br />
Lower Mississippi River watershed. This would equate to an annual average flow of 15 mgd if these rural<br />
communities grew to use the full capacity of their WWTPs.<br />
Table 2.5. Larger WWTPs in the Lower Mississippi River <strong>Water</strong>shed<br />
Facility Name<br />
Permitted<br />
Capacity,<br />
mgd<br />
2005 Annual<br />
Average Flow,<br />
mgd<br />
Flow as % of<br />
Design Capacity<br />
Faribault WWTP 7.0 3.7 53%<br />
Lake City WWTP 1.5 0.6 37%<br />
Met Council - Empire WWTP* 24.0 8.5 35%<br />
Met Council - Rosemount WWTP* 1.3 0.9 70%<br />
Northfield WWTP 5.2 2.1 40%<br />
Owatonna WWTP 5.0 3.5 71%<br />
Plainview-Elgin Sanitary District WWTP 1.4 1.1 74%<br />
Red Wing WWTP 4.0 2.1 51%<br />
Rochester <strong>Water</strong> Reclamation Plant 19.1 13.5 71%<br />
Stewartville WWTP 1.1 0.5 48%<br />
Whitewater River Regional WWTP 1.1 0.7 63%<br />
Winona WWTP 6.5 4.0 61%<br />
Total 77 41 53%<br />
*The Rosemount WWTP is located in the Lower Mississippi River <strong>Water</strong>shed, but discharges into the Mississippi River-<br />
Headwaters watershed. In late 2007 the Empire WWTP will move its discharge near the Rosemount WWTP discharge and<br />
the Rosemount WWTP will be phased out. The Empire WWTP and Rosemount WWTP design capacities are used, instead<br />
of permitted capacities.<br />
Source: MPCA, 2005<br />
Proximity of Industries Relative to WWTPs – Lower Mississippi River <strong>Water</strong>shed<br />
A total of 56 industries are permitted to withdraw ground and/or surface water in the Lower Mississippi<br />
River watershed and 25 of these are located within 4 miles of a larger municipal WWTP. Figure 2.12<br />
presents the location of the industries and WWTPs in the Lower Mississippi River watershed. Table 2.6<br />
summarizes the industries within a 4-mile radius of a WWTP. Appendix II-1 (Appendix C) provides the<br />
full industry list.<br />
Winona has the largest number of industries in close proximity to its WWTP. <strong>Water</strong> is used <strong>for</strong> metal<br />
processing by Badger Foundry Company and Peerless Chain Company, non-metallic processing by RTP<br />
Company, industrial process cooling by Cytec Engineered Materials, and agricultural processing by<br />
International Malting Company. Red Wing and Faribault are two other cities with multiple industries<br />
within the proximity of their WWTP.<br />
There are several agricultural processing facilities within 4 miles of a WWTP. The larger agricultural<br />
processing water users are Associated Milk Producers (2.7 mgd) near the Rochester <strong>Water</strong> Reclamation<br />
Plant, International Malting Co. (1 mgd) in the Winona area, and Marigold Foods (0.3 mgd) near the Met<br />
Council’s Empire WWTP.<br />
Metropolitan Council Environmental Services 21
Section 2: Recycled <strong>Wastewater</strong> Demand & Supply<br />
<strong>Recycling</strong> <strong>Treated</strong> <strong>Municipal</strong> <strong>Wastewater</strong> <strong>for</strong> <strong>Industrial</strong> <strong>Water</strong> <strong>Use</strong><br />
Table 2.6. Industries in the Lower Mississippi River <strong>Water</strong>shed Within 4 Miles of a WWTP<br />
Industry Name by Category<br />
Agricultural Processing<br />
ID No.<br />
<strong>for</strong> Map Source*<br />
2004<br />
<strong>Water</strong><br />
<strong>Use</strong>, mgd<br />
Distance<br />
to WWTP,<br />
miles Closest WWTP<br />
ARCHER DANIELS MIDLAND CO 18 G 0.206 1.0 Red Wing<br />
ASSOCIATED MILK PRODUCERS 31 G 0.696 2.7 Rochester<br />
HORMEL FOODS CORP 41 G 0.272 1.0 Faribault<br />
IFP INC 5 G 0.012 1.0 Faribault<br />
INTERNATIONAL MALTING CO<br />
LLC<br />
28<br />
G 0.964 3.3 Winona<br />
LAKESIDE FOODS INC 42 G 0.075 3.0 Plainview - Elgin<br />
MARIGOLD FOODS INC 44 G 0.319 2.0 Met Council-Empire<br />
PLAINVIEW MILK PROD COOP 47 G 0.191 3.0 Plainview - Elgin<br />
PROTEIN INGREDIENT<br />
TECHNOLOGIES INC<br />
48<br />
G 0.052 2.0 Faribault<br />
SENECA FOODS CORP 49 G 0.049 4.0 Rochester<br />
<strong>Industrial</strong> Process Cooling – Once Through<br />
CYTEC ENGINEERED MATERIALS 21 G 0.077 3.3 Winona<br />
FARIBAULT WOOLEN MILL<br />
COMPANY<br />
38<br />
S 0.006 1.0 Faribault<br />
KERRY BIOFUNCTIONAL<br />
INGREDIENTS INC<br />
Metal Processing<br />
25<br />
G 0.298 2.5 Rochester<br />
BADGER FOUNTRY CO 34 G 0.425 1.0 Winona<br />
PEERLESS CHAIN COMPANY<br />
Non-Metallic Processing<br />
22 G 0.266 1.0 Winona<br />
8 TH AND JEFFERSON LLC 8 G 0.001 1.0 Winona<br />
GENOVA INC 27 G 0.139 1.0 Faribault<br />
RTP COMPANY 24 G 0.436 2.5 Winona<br />
S B FOOT TANNING CO 20 G 0.307 2.6 Red Wing<br />
USG INTERIORS INC<br />
Power Generation – Miscellaneous<br />
26 G 0.035 2.3 Red Wing<br />
FRANKLIN HEATING STATION<br />
Sand and Gravel Washing<br />
4 G 0.503 4.0 Rochester<br />
BARNESS CONSTRUCTION &<br />
EXCAVATION<br />
6<br />
S 0.000 2.3 Northfield<br />
CEMSTONE PRODUCTS<br />
Steam Power Cooling – Once Through<br />
36 G 0.011 3.8 Met Council-Empire<br />
NSP CO DBA XCEL ENERGY 2 S 44.763 1.0 Red Ring<br />
ROCHESTER PUBLIC UTILITIES<br />
Steam Power Cooling – Wet Tower<br />
3 S 26.622 3.0 Rochester<br />
ROCHESTER PUBLIC UTILITIES<br />
* G=Ground <strong>Water</strong>; S=Surface <strong>Water</strong><br />
Source: MDNR, 2004<br />
3 G 0.405 3.0 Rochester<br />
Flint Hills Resources is the largest non-power related industrial water user in this watershed.<br />
Approximately 6.5 mgd was pumped from its well field in 2004 <strong>for</strong> its total facility use. They are in the<br />
process of system modifications to reuse their process wastewater rather than add an additional well.<br />
<strong>Municipal</strong> WWTP effluent use at Flint Hills Resources was evaluated during the facility planning stages<br />
of the Met Council’s Empire WWTP expansion; the outfall <strong>for</strong> this plant will be moved to discharge into<br />
the Upper Mississippi River watershed and will be within 2 miles of Flint Hills Resources. While the use<br />
Metropolitan Council Environmental Services 23
Section 2: Recycled <strong>Wastewater</strong> Demand & Supply<br />
<strong>Recycling</strong> <strong>Treated</strong> <strong>Municipal</strong> <strong>Wastewater</strong> <strong>for</strong> <strong>Industrial</strong> <strong>Water</strong> <strong>Use</strong><br />
of recycled wastewater from Empire by Flint Hills Resources was not pursued because of water quality<br />
issues, notably high chlorides in the Empire WWTP effluent, it is possible that potential future Flint Hills<br />
Resources expansions could consider this source. Also, the industrial areas along the outfall could benefit<br />
from this potential 24 mgd source of recycled wastewater.<br />
Factors Influencing Potential <strong>for</strong> <strong>Industrial</strong> <strong>Use</strong> of Recycled <strong>Wastewater</strong> – Lower<br />
Mississippi River <strong>Water</strong>shed<br />
The majority of the Lower Mississippi River watershed has a good water supply from bedrock that most<br />
communities rely on as their primary water source. Most of the watershed is in Ground <strong>Water</strong> Area 3 of<br />
the state, with eastern regions in Area 2 and the northern reaches in Area 1 (refer to Figure 2.8). All three<br />
areas have a reliable and productive bedrock aquifer.<br />
Area 3 has extensive near-surface karst areas that result in its aquifers being vulnerable to contamination.<br />
There is wide-spread nitrate contamination in near-surface aquifers as well as occurrences of pesticides<br />
and other contaminants. The susceptibility to contamination index places this watershed in the medium to<br />
highest range (refer to Figure 2.9). Area 2 on the western edge of the watershed has a more productive<br />
buried sand aquifer, but still limited surficial sand aquifers. The northern watershed, in Area 1, has a<br />
reliable supply <strong>for</strong> all three general aquifer levels.<br />
Portions of the Lower Mississippi River watershed will be affected by the TMDL <strong>for</strong> Lake Pepin. The<br />
planning process <strong>for</strong> this TMDL has established preliminary targets of phosphorus and solids loading<br />
reductions of one-half into Lake Pepin. While nonpoint sources are significant contributions to this load,<br />
it is likely that loading reductions <strong>for</strong> most point sources will be considered.<br />
2.3 Twin Cities Metro Area Inventory<br />
The industrial inventory <strong>for</strong> the Twin Cities metro area indicates a diversity of industries and a prevalence<br />
of potential recycled wastewater customers along the river corridors. The industry inventory in the Twin<br />
Cities metro area was based on the same MDNR database as <strong>for</strong> the state and watershed analysis plus<br />
those industries discharging to the Met Council’s sewer system <strong>for</strong> treatment at one of eight WWTPs.<br />
Figure 2.13 presents the industries with water permits (MDNR appropriation permits) and Figure 2.14<br />
locates a larger set of industries in the Twin Cities metro area, based on Met Council’s <strong>Industrial</strong><br />
Dischargers permit program (Met Council, 2005).<br />
The Met Council database provides <strong>for</strong> a more detailed categorization of the industries, as shown in the<br />
legend of Figure 2.14. These industry categories are documented with subcategories in Appendix II-1<br />
(Appendix E). Figure 2.14 also identifies if the industry obtains its water from a municipal (potable)<br />
source or another source, which typically would be through a MDNR appropriations permit. The other<br />
source could be ground water (well), surface water or a combination of both. The municipal designation<br />
was rolled up to include any industry that uses a municipal supply.<br />
The Met Council (specifically, the Environmental Services division or MCES) <strong>Industrial</strong> Dischargers<br />
Permit database includes any discharger to the Met Council’s sewer system. It does not include all<br />
industries in the area, because some have their own treatment systems and discharge permits. Some<br />
dischargers use little water, such as landfill leachate systems, and mainly collect and treat water <strong>for</strong><br />
discharge. These industries were excluded from the evaluation.<br />
The industries in the Twin Cities metro area discharging to the sewer system, as shown in Figure 2.15,<br />
had a combined water demand of 65 mgd in 2005. The largest water users were food industries, at 15<br />
mgd, followed by the metal products industries at 10 mgd. <strong>Water</strong> used in the electronic products and<br />
paper/packaging industries and <strong>for</strong> power/steam/air conditioning and health care facilities, all had<br />
category totals over 5 mgd.<br />
24 Metropolitan Council Environmental Services
Figure 2.15. Metro Area <strong>Industrial</strong> <strong>Water</strong> Demand, 2005<br />
Building Materials<br />
Chemical Products<br />
Electronic Products<br />
Food Products<br />
Health Care<br />
Laundry<br />
Medical Products<br />
Metal Products<br />
Other<br />
Paper/Packaging<br />
Photo/Printed Products<br />
Power/Steam/AC<br />
Public Facilities<br />
Transportation<br />
Source: Met Council, 2005<br />
1.0<br />
1.7<br />
1.6<br />
1.4<br />
1.2<br />
2.1<br />
2.6<br />
3.4<br />
5.5<br />
5.9<br />
6.4<br />
Section 2: Recycled <strong>Wastewater</strong> Demand & Supply<br />
<strong>Recycling</strong> <strong>Treated</strong> <strong>Municipal</strong> <strong>Wastewater</strong> <strong>for</strong> <strong>Industrial</strong> <strong>Water</strong> <strong>Use</strong><br />
7.5<br />
0.0 2.0 4.0 6.0 8.0 10.0 12.0 14.0 16.0<br />
<strong>Water</strong> <strong>Use</strong> (mgd)<br />
The total Twin Cities metro area industrial demand is estimated to be 75 mgd. This estimate is based on<br />
an analysis of both databases to determine a reasonable estimate of the industrial demand supplied by<br />
water utilities. Industries that supply their own water through MDNR appropriations permits used<br />
approximately 30 mgd in 2004. The Twin Cities metro area water utilities used 350 mgd in 2004.<br />
Assuming that 13% of potable water supply customers are industries, another 45 mgd of industrial<br />
demand is supplied by water utilities.<br />
2.4 WWTP Focus – Empire and Rosemount WWTP Inventories<br />
This study inventoried the industries in proximity to major WWTPs in the seven-county Twin Cities<br />
metro area. This section provides the inventory <strong>for</strong> the Met Council’s Empire & Rosemount WWTPs,<br />
located in the Lower Mississippi River watershed. Appendix II-1 provides the inventories <strong>for</strong> the other<br />
WWTPs.<br />
The Empire WWTP was recently expanded from 9 mgd to 24 mgd and the 1.3 mgd Rosemount WWTP<br />
will be phased out with wastewater from its service area treated at the Empire WWTP. The Empire<br />
WWTP, which currently discharges to the Vermillion River, will have a new discharge to the Mississippi<br />
River in the vicinity of the one currently used by the Rosemount WWTP. Figure 2.16 identifies the<br />
industries near each plant and Table 2.7 lists those within a 5-mile radius of each plant. The outfall <strong>for</strong> the<br />
Empire WWTP to the Mississippi River is also shown on Figure 2.16. The list of industries is restricted to<br />
the radius around each plant, but could be broadened to include industries along the outfall.<br />
As described previously in the Lower Mississippi River <strong>Water</strong>shed Inventory section, Flint Hills<br />
Resources is the high water demand industry using ground water in the area, withdrawing over 6 mgd in<br />
2004. The industry with the next largest water use is Aggregate Industries, with a demand of 1.1 mgd,<br />
supplied by surface water at a facility near the Mississippi River. Another Aggregate Industries facility is<br />
located closer to the Empire WWTP and uses a ground water supply of 0.4 mgd. The industry with the<br />
largest water demand near the Empire WWTP is Marigold Foods, which uses 0.32 mgd of ground water<br />
supplied by its own well field. Another food product industry, Kemps, has a demand of 0.25 mgd. The<br />
other industries in the area have a combined demand of 0.32 mgd.<br />
Metropolitan Council Environmental Services 27<br />
10.6<br />
14.7
Section 2: Recycled <strong>Wastewater</strong> Demand & Supply<br />
<strong>Recycling</strong> <strong>Treated</strong> <strong>Municipal</strong> <strong>Wastewater</strong> <strong>for</strong> <strong>Industrial</strong> <strong>Water</strong> <strong>Use</strong><br />
Figure 2.16. Industries in Proximity to Empire & Rosemount WWTPs<br />
•<br />
• ••••,<br />
•<br />
•<br />
Ash St<br />
Rosemount W\MTb<br />
Empire Outfall<br />
(Construction Complet<br />
220th 5t E<br />
5-mlle Radius<br />
10m'" RadIus<br />
• Agricultural Processing ... WWTP • • 0.00 - 0.50 mgd<br />
•<br />
<strong>Industrial</strong> Process Cooling Major Rivers + • 0.51 - 1.50 mgd<br />
Metal Processing Highway +. 1.51 - 5.00 mgd<br />
0 Non-Metallic Processing • Ground <strong>Water</strong> +.<br />
•<br />
5.01 - 10.00 mgd<br />
Petroleum-Chemical Processing<br />
Surface <strong>Water</strong> • +•<br />
•<br />
10.01 - 25.00 mgd<br />
Power Generation + <strong>Municipal</strong> <strong>Water</strong> +.<br />
•<br />
25.01 - 505.00 mgd<br />
Sand and Gravel Washing .. <strong>Municipal</strong>ity<br />
N<br />
D 2.5 SMiles<br />
A I I I<br />
Sources:<br />
Minnesota DNR <strong>Water</strong> Appropriation Permit Program, 2004<br />
Metropolitan Councillnduslrial Dischargers Permit Program, 2005<br />
28 Metropolitan Council Environmental Services
Section 2: Recycled <strong>Wastewater</strong> Demand & Supply<br />
<strong>Recycling</strong> <strong>Treated</strong> <strong>Municipal</strong> <strong>Wastewater</strong> <strong>for</strong> <strong>Industrial</strong> <strong>Water</strong> <strong>Use</strong><br />
Table 2.7. Industries Within a 5-Mile Radius of Empire and Rosemount WWTPs<br />
Industry Name<br />
MDNR<br />
Permit<br />
<strong>Water</strong><br />
Source*<br />
Annual<br />
Average<br />
<strong>Water</strong> <strong>Use</strong>,<br />
mgd<br />
Industry Category<br />
(MDNR Appropriations Permit<br />
Database)<br />
Aggregate Industries-NCR Inc x G & S 1.462<br />
Sand & Gravel Washing; Non-Metallic<br />
Processing<br />
Bituminous Roadways Inc x S 0.004 Sand & Gravel Washing<br />
Cannon Equipment M 0.010 Metal Processing<br />
Cemstone Products x G 0.107 Sand & Gravel Washing<br />
Petroleum or Chemical Processing,<br />
Continental Nitrogen & Resources x G 0.085 Ethanol<br />
CF Industries Inc x G 0.010 Non-Metallic Processing<br />
Flint Hills Resources LP x G 6.531<br />
Petroleum or Chemical Processing,<br />
Ethanol<br />
Greif Bros Corp M 0.038 <strong>Industrial</strong> Processing<br />
J I T Powder Coating M 0.014 Metal Processing<br />
Kemps LLC M&G 0.256 Agricultural Processing<br />
Marigold Foods Inc x G 0.319 Agricultural Processing<br />
NRG Processing Solutions LLC x G 0 Non-Metallic Processing<br />
Per<strong>for</strong>mance <strong>Industrial</strong> Coating M 0.009 Metal Processing<br />
Spectro Alloys Corp x G 0.006 Metal Processing<br />
Valmont/Lexington M 0.004 Metal Processing<br />
Wayne Transports Inc M&G 0.030 Metal Processing<br />
* M: <strong>Municipal</strong>; G: Ground <strong>Water</strong>; M & G: <strong>Municipal</strong> and Ground <strong>Water</strong>: S: Surface <strong>Water</strong>.<br />
2.5 Industry Focus – Ethanol Plant Inventory<br />
The expansion of the ethanol industry in Minnesota has stimulated the exploration of wastewater<br />
recycling <strong>for</strong> this industry. Ethanol production is a fairly water intensive process, requiring on average 3-6<br />
gallons of water to produce 1 gallon of ethanol (gallons water/gallon ethanol). In Minnesota, the lowest<br />
water use rate in 2005 was 3.6 gallons water/gallon ethanol at the Chippewa Valley Ethanol Company<br />
(Institute <strong>for</strong> Agriculture and Trade Policy, 2006) and rates were greater than 7 gallons water/gallon<br />
ethanol <strong>for</strong> some facilities pre-2002. While improved practices have reduced water use in ethanol<br />
production, it still requires a significant allocation of water resources. In addition, most ethanol facilities<br />
are located in areas with limited water supplies. To properly address the water appropriations permitting<br />
and other permitting requirements <strong>for</strong> the ethanol industry, state agencies have <strong>for</strong>med teams to work<br />
specifically on the environmental issues of this industry sector. One action developed from these teams is<br />
to investigate the use of recycled wastewater as a water supply <strong>for</strong> ethanol facilities. State agencies are<br />
exploring funding options <strong>for</strong> specific application to wastewater recycling projects with ethanol facilities<br />
during the summer 2007 budget process.<br />
Facilities within the state have the capacity to produce over 550 million gallons of ethanol a year from<br />
sixteen locations across the middle and south part of the state (MDA, 2006). Assuming a higher end water<br />
use rate of 5 gallons water/gallon ethanol, the estimated water demand <strong>for</strong> the state’s ethanol production<br />
capacity is about 7.5 mgd. An inventory of ethanol facilities in conjunction with WWTPs in the state is<br />
shown in Figure 2.17. The facilities and water demands <strong>for</strong> facilities with their own permitted supply are<br />
listed in Table 2.8.<br />
Metropolitan Council Environmental Services 29
Table 2.8. Ethanol Plant Capacity and <strong>Water</strong> <strong>Use</strong><br />
Section 2: Recycled <strong>Wastewater</strong> Demand & Supply<br />
<strong>Recycling</strong> <strong>Treated</strong> <strong>Municipal</strong> <strong>Wastewater</strong> <strong>for</strong> <strong>Industrial</strong> <strong>Water</strong> <strong>Use</strong><br />
Ethanol Corn Production Start-up 2004 <strong>Water</strong> <strong>Use</strong><br />
Capacity Required<br />
Year (MDNR Permit Only)<br />
City (plant name) mgy million bushels/yr mgd 1<br />
Marshall (ADM) 40 14.8 2<br />
Morris (DENCO) 24 9 1991 0.368<br />
Winnebago (Corn Plus) 47 17.4 1994 0.272<br />
Winthrop (Heartland) 37 13.7 1995 0.278<br />
Benson (CVEC) 45 16.7 1996 0.401<br />
Claremont (Al-Corn) 34 12.6 1996 0.387<br />
Bingham Lake (Ethanol2000) 31 11.5 1997 --<br />
Buffalo Lake (MN Energy) 19 7 1997 0.239<br />
Melrose (Dairy Proteins) 3 Cheese whey 1986 --<br />
Preston (Pro-Corn) 42 15.6 1998 --<br />
Luverne (Corn-er Stone) 21 7.8 1998 --<br />
Little Falls (CMEC) 22 8.1 1999 --<br />
Albert Lea (Exol/Agra Resources) 41 15.2 1999 0.563<br />
Lake Crystal 50 18 2005 --<br />
Granite Falls Energy 50 18 2005 --<br />
Atwater (Bushmills Ethanol) 45 16.6 2005 --<br />
TOTAL 551 200<br />
Metropolitan Council Environmental Services 31<br />
1988<br />
Sources: MDA, 2006 (www.mda.state.mn.us/Ethanol) and MDNR <strong>Water</strong> Appropriations Permit Program, 2004.<br />
1 <strong>Water</strong> use data only available <strong>for</strong> those with MDNR permits in 2004.<br />
2 Refer to source: portion of plant processing used <strong>for</strong> ethanol.<br />
Table 2.9. Select Ethanol Plants in Relation to Recycled <strong>Wastewater</strong> Supply<br />
Ethanol Plant 1<br />
2<br />
Closest WWTPP<br />
Distance<br />
to the<br />
WWTP<br />
(miles)<br />
WWTP<br />
Permitted<br />
Capacity<br />
(mgd)<br />
WWTP<br />
2005<br />
Flow<br />
(mgd)<br />
2004<br />
<strong>Water</strong><br />
<strong>Use</strong><br />
(mgd)<br />
Assumed<br />
Cooling<br />
<strong>Water</strong><br />
Demand<br />
(mgd) 3<br />
Diversified Energy Co LLC Morris 1.7 0.964 0.60 0.37 0.22<br />
Chippewa Valley Ethanol Co Benson 1.7 0.985 0.43 0.40 0.24<br />
Minnesota Energy Hector 3.4 0.66 0.21 0.24 0.14<br />
Heartland Corn Products Gaylord 3.2 0.55 0.36 0.28 0.17<br />
Al-Corn Clean Fuel Blooming Prairie 8 0.899 0.51 0.39 0.23<br />
Corn Plus Winnebago 2 1.7 0.59 0.27 0.16<br />
Agra Resources Corp Albert Lea 10 18.38 4.23 0.56 0.34<br />
1 Ethanol plants with MDNR water appropriations permits in 2004; 2004 water use is the reported use to the MDNR <strong>Water</strong><br />
Appropriations Permit program – it is possible that some facilities used other sources of water and total water use is more than<br />
listed in this table.<br />
2 Selection criteria: closest WWTP with sufficient flow (based on 2005 flow data) <strong>for</strong> water use at the ethanol plants.<br />
3 Assumed 60% of total water use is <strong>for</strong> cooling water requirements.<br />
The proximity of several ethanol plants to a WWTP was investigated. As shown in Table 2.9 there are<br />
several ethanol plants a reasonable distance from a WWTP that may have an adequate supply to meet at<br />
least the cooling water demands <strong>for</strong> the facility, estimated at 60% of the total facility water use.<br />
Additional in<strong>for</strong>mation is needed on the diurnal variation of the WWTP flow and water quality to<br />
determine if these WWTPs could feasibly provide the water supply <strong>for</strong> these ethanol plants.
Section 2: Recycled <strong>Wastewater</strong> Demand & Supply<br />
<strong>Recycling</strong> <strong>Treated</strong> <strong>Municipal</strong> <strong>Wastewater</strong> <strong>for</strong> <strong>Industrial</strong> <strong>Water</strong> <strong>Use</strong><br />
2.6 Summary<br />
Demand vs. Supply<br />
The statewide and Twin Cities metro area demand and supply analysis, summarized in Table 2.10,<br />
determined that the recycled wastewater supply can fulfill 95% of the industrial water demand and that<br />
there is ample recycled wastewater in the Twin Cities metro area to provide industries a water supply.<br />
However, as the spatial analysis showed,<br />
the proximity of a WWTP to an industry is<br />
not always optimum.<br />
The average flow <strong>for</strong> larger WWTPs<br />
totaled 425 mgd (2005) and industrial<br />
demand totaled 2,760 mgd (2004). If the<br />
power plants using surface water supplies<br />
are not considered a customer <strong>for</strong> recycled<br />
wastewater, then the industrial demand is<br />
445 mgd. Of this demand, the majority is<br />
<strong>for</strong> the mining and pulp and paper<br />
Table 2.10. Annual Average Demand and Supply Summary<br />
Industry<br />
<strong>Water</strong> Demand*<br />
(mgd)<br />
Recycled<br />
<strong>Wastewater</strong><br />
Supply<br />
( mgd)<br />
State 445 425<br />
Twin Cities Metro Area 75 255<br />
*Excludes surface water supplies <strong>for</strong> power facilities<br />
Source: MDNR, 2004; MPCA, 2005<br />
industries in northern Minnesota. Demand <strong>for</strong> ground water supplies in 2004 was 60 mgd. Table 2.11<br />
summarizes the demand and supply by watershed <strong>for</strong> ground and surface water supplies and includes<br />
totals with and without the power generation industry sector. Figure 2.18 excludes the larger surface<br />
Figure 2.18. Comparison of <strong>Treated</strong> <strong>Wastewater</strong> Supply to <strong>Industrial</strong> Demands by<br />
<strong>Water</strong>shed<br />
Cedar River<br />
Des Moines River<br />
Lower Mississippi River<br />
Minnesota River<br />
Mississippi Headwaters<br />
Missouri River<br />
Rainy River<br />
Red River of the North<br />
St. Croix River<br />
Western Lake Superior<br />
<strong>Wastewater</strong> Supply<br />
Ground <strong>Water</strong> Demand<br />
Surface <strong>Water</strong> Demand*<br />
*Excludes surface water <strong>for</strong><br />
power generation<br />
0 10 20 30 40 50 60 70 80 90 100<br />
Annual Average Supply or Demand, mgd<br />
water demands of<br />
the power facilities<br />
and provides a more<br />
appropriate scale to<br />
compare recycled<br />
wastewater supply<br />
to industrial water<br />
demands that could<br />
be met with this<br />
alternative water<br />
supply.<br />
The comparison of<br />
historic ground<br />
water use by<br />
industries and<br />
WWTP effluent<br />
discharge flows<br />
indicates that each<br />
watershed currently<br />
processes enough<br />
wastewater to supply the industrial ground water demand, but the industries are not always in proximity<br />
to WWTPs. The larger surface water demands of the existing power generation, mining, and pulp and<br />
paper industries cannot be met by the state’s recycled wastewater supply. New power facilities that will<br />
likely use recirculating cooling systems and partial needs of other high water demand industries could be<br />
supplied by recycled wastewater. The proximity of some of these facilities to WWTPs will make recycled<br />
wastewater a more favorable water supply option.<br />
32 Metropolitan Council Environmental Services<br />
234<br />
mgd<br />
304<br />
mgd
Section 2: Recycled <strong>Wastewater</strong> Demand & Supply<br />
<strong>Recycling</strong> <strong>Treated</strong> <strong>Municipal</strong> <strong>Wastewater</strong> <strong>for</strong> <strong>Industrial</strong> <strong>Water</strong> <strong>Use</strong><br />
Table 2.11. <strong>Industrial</strong> <strong>Water</strong> Demand and Recycled <strong>Wastewater</strong> Supply Summary by <strong>Water</strong>shed<br />
<strong>Water</strong>shed<br />
Ground<br />
<strong>Water</strong><br />
DEMAND SUPPLY ATTRIBUTES<br />
Surface<br />
<strong>Water</strong> Total<br />
Total<br />
Without<br />
Power<br />
Facilities*<br />
Larger<br />
WWTP<br />
Capacity<br />
(WWTPs<br />
> 1 mgd)<br />
Smaller<br />
WWTP<br />
Design<br />
Capacity<br />
(WWTPs<br />
< 1 mgd)<br />
Larger<br />
WWTP<br />
Discharge<br />
Flow, 2005<br />
No. of<br />
Industry<br />
Categories<br />
with <strong>Water</strong><br />
Permits<br />
Ground<br />
<strong>Water</strong><br />
Availability<br />
Ground <strong>Water</strong><br />
Contamination<br />
Susceptibility<br />
2004 <strong>Industrial</strong> <strong>Water</strong> <strong>Use</strong>, mgd mgd mgd mgd No. =Favors <strong>Recycling</strong><br />
Cedar River 4.1 0.1 4.1 4.1 26.9 2.6 9.7 4<br />
No<br />
Factor No Factor<br />
Des Moines<br />
River 0.6 0.1 0.7 0.7 5.8 3.1 3.1 2 No Factor<br />
Lower<br />
Mississippi<br />
River 13.3 578.8 592.1 14.9 77.3 15.8 41.0 10<br />
Minnesota<br />
River 17.3 327.7 345.0 19.0 123.5 22.4 73.4 10<br />
Mississippi<br />
River-<br />
Headwaters 21.5 939.6 961.1 51.3 337.4 31.5 233.6 15<br />
No<br />
Factor <br />
No<br />
Factor<br />
Potential<br />
Factor<br />
No<br />
Factor No Factor<br />
Missouri<br />
River 0 0.1 0.1 0.1 1.5 2.0 0.7 1 No Factor<br />
Rainy River
Section 2: Recycled <strong>Wastewater</strong> Demand & Supply<br />
<strong>Recycling</strong> <strong>Treated</strong> <strong>Municipal</strong> <strong>Wastewater</strong> <strong>for</strong> <strong>Industrial</strong> <strong>Water</strong> <strong>Use</strong><br />
Factors Influencing Potential <strong>for</strong> <strong>Industrial</strong> <strong>Use</strong> of Recycled <strong>Wastewater</strong><br />
The availability of higher quality ground water, typically sought first <strong>for</strong> municipal and industrial<br />
purposes, is a key factor in planning <strong>for</strong> growth in most of Minnesota. The summary of watershed<br />
inventories presented in Table 2.11 includes the assessment of indicators favoring recycled wastewater<br />
applications. This high level assessment indicates several areas of the state with limited ground water<br />
supplies. These areas are in the Des Moines River and Missouri River watersheds, in the southwest part of<br />
the state, northwestern Minnesota in parts of the Red River of the North watershed, and in the Rainy<br />
River and Western Lake Superior watersheds, in north central and northeastern Minnesota. The water<br />
requirements <strong>for</strong> ethanol facilities in the southwest part of the state have prompted agencies and industries<br />
to work together to meet immediate water demands while protecting the aquifer supplies <strong>for</strong> long-term<br />
use.<br />
There are also community-specific water supply limitations in quality and quantity. Ground water<br />
contamination is found throughout the state and certain aquifer characteristics make some aquifers a less<br />
reliable supply, as in the karst area of the Lower Mississippi River watershed. In general, the water<br />
quality of an area and susceptibility to contamination must be assessed on a site specific basis.<br />
Community-level planning has usually been used to assess water supply needs in Minnesota. Planning has<br />
moved to the watershed level as observed in the state’s water-limited areas of the Des Moines River,<br />
Missouri River, and Red River watersheds. <strong>Water</strong> supply planning, including identification of future<br />
water supply limitations, has encompassed a regional scale in the 7-county Twin Cities metro area, as<br />
directed under Minnesota Statutes, Section 473.1565.<br />
As the state moves <strong>for</strong>ward with TMDL development and new WWTPs or existing ones are expanded,<br />
evaluations of wastewater recycling facilities to reduce pollutant discharges are expected to become more<br />
prevalent. However, municipalities will not be able to recycle without partners – industries and other<br />
wastewater recycle customers need to commit to meeting their water demands with this alternative<br />
supply. As observed in the expansion of the ethanol industry and the construction of the Mankato Energy<br />
Center – a limited water supply was the key factor that led to consideration of a recycled wastewater<br />
supply. While other drivers may lead to wastewater recycling partnerships between municipalities and<br />
industries, the most significant driver in the near-term is expected to be water supply limitations,<br />
principally ground water supplies limited by quantity or quality issues.<br />
34 Metropolitan Council Environmental Services
2.7 References<br />
Section 2: Recycled <strong>Wastewater</strong> Demand & Supply<br />
<strong>Recycling</strong> <strong>Treated</strong> <strong>Municipal</strong> <strong>Wastewater</strong> <strong>for</strong> <strong>Industrial</strong> <strong>Water</strong> <strong>Use</strong><br />
Institute <strong>for</strong> Agriculture and Trade Policy. 2006. <strong>Water</strong> <strong>Use</strong> by Ethanol Plants: Potential Challenges.<br />
Published October, Minneapolis, Minnesota.<br />
Metropolitan Council, 2005. Metropolitan Council <strong>Industrial</strong> Dischargers Permit Program. 2005 data<br />
summarized <strong>for</strong> dischargers to the Metropolitan Council sewer system, under the agency’s Pretreatment<br />
Program. Data obtained May 2006.<br />
Minnesota Department of Natural Resources (MDNR), 2005. Where is Ground <strong>Water</strong> and Is It Available<br />
<strong>for</strong> <strong>Use</strong>? MDNR Fact Sheet on Ground-<strong>Water</strong> Sustainability, 2 pages.<br />
Minnesota Department of Natural Resources (MDNR). 2004. Minnesota <strong>Water</strong> Appropriations Permit<br />
Program, State <strong>Water</strong> <strong>Use</strong> Data System. Data obtained March 2006 summarized <strong>for</strong> 2004.<br />
Minnesota Pollution Control Agency (MPCA), 2005. Minnesota Discharge Monitoring Report data<br />
obtained through the Environmental Data Access system. Refer to:<br />
http://www.pca.state.mn.us/data/eda<strong>Water</strong>/index.cfm.<br />
Minnesota Pollution Control Agency (MPCA), 1995. Regional Ground <strong>Water</strong> Profiles. Developed by the<br />
Interagency Ground <strong>Water</strong> Coordination Group. Available at:<br />
http://www.pca.state.mn.us/water/gwprofiles.html.<br />
Minnesota Pollution Control Agency (MPCA), 1989. Statewide Evaluation of Ground <strong>Water</strong><br />
Contamination Susceptibility. GIS files <strong>for</strong> map updated in 2005: metadata not complete <strong>for</strong> this<br />
publication.<br />
Metropolitan Council Environmental Services 35
Section 2: Recycled <strong>Wastewater</strong> Demand & Supply<br />
<strong>Recycling</strong> <strong>Treated</strong> <strong>Municipal</strong> <strong>Wastewater</strong> <strong>for</strong> <strong>Industrial</strong> <strong>Water</strong> <strong>Use</strong><br />
36 Metropolitan Council Environmental Services
Section 3: Recycled <strong>Wastewater</strong> System Components and Costs<br />
<strong>Recycling</strong> <strong>Treated</strong> <strong>Municipal</strong> <strong>Wastewater</strong> <strong>for</strong> <strong>Industrial</strong> <strong>Water</strong> <strong>Use</strong><br />
Section 3: Recycled <strong>Wastewater</strong> System Components and<br />
Costs<br />
This section presents the third area of inquiry into the feasibility of Minnesota’s industries using recycled<br />
wastewater by addressing the question: Is wastewater recycling an economical practice? The answer<br />
begins with identification of the system components which include treatment facilities <strong>for</strong> a range of<br />
treatment requirements and potential facilities to meet those requirements. After establishing a basis <strong>for</strong><br />
the system components, a system of cost curves was developed <strong>for</strong> varying system sizes and transmission<br />
distances. Costs are presented by industry category as cost of service, on a dollar per gallon basis, to<br />
compare a recycled wastewater supply to traditional supplies. Appendix II-3 provides background<br />
in<strong>for</strong>mation and more detail on the treatment requirements, treatment technologies, and cost assumptions<br />
used in the analysis.<br />
3.1 Recycled <strong>Wastewater</strong> System Overview<br />
Recycled wastewater systems can be configured in many ways. Commonly used components are shown<br />
in Figure 3.1 and are described below. This study assumed certain components, identified as (1) through<br />
(7) and attributes <strong>for</strong> those components to develop costs. These assumptions are also described below.<br />
Treatment of WWTP Effluent (1)<br />
— Additional processes to those currently used by an existing WWTP, if needed.<br />
— New WWTP processes to replace existing processes during a plant upgrade, such as membrane<br />
filtration to replace clarification.<br />
Additional Disinfection (2)<br />
— A residual disinfectant is often used in the transmission system to minimize bacterial growth.<br />
Liquid chlorine (sodium hypochlorite) is assumed <strong>for</strong> this study.<br />
— Additional disinfection is required <strong>for</strong> year-round disinfection and more stringent pathogen limits.<br />
The existing facilities may be able to achieve this, but it is assumed new equipment is required.<br />
Storage (3)<br />
— In some instances, storage will be required to balance the diurnal or other WWTP flow variations,<br />
with the requirements of a specific industrial demand <strong>for</strong> different peak hour, weekly or other<br />
dominant demand patterns.<br />
— Storage will likely be required <strong>for</strong> WWTPs that reclaim over 50 percent of their flow. Smaller<br />
facilities, with less equalization capacity, are more likely to need storage.<br />
— The cost curves developed assume no storage requirements. Appendix II-3 provides storage<br />
system cost in<strong>for</strong>mation.<br />
Pump Station (4)<br />
— A pump station located onsite at the WWTP.<br />
— For cost development purposes, this study assumes delivery of supply to industry at a pressure of<br />
40 pounds per square inch (psi) and the same elevation as the WWTP.<br />
Recycled <strong>Wastewater</strong> Transmission System (5)<br />
— Transmission main and branch transmission lines supplying water to industries.<br />
— Variable flows and distances. This study evaluated flows of 0 to 30 mgd and distances of 1 to 10<br />
miles.<br />
Booster Pumps (6)<br />
— Some industries may require booster pumps depending on their location and delivery pressure<br />
requirements.<br />
— Industries A-D shown on the schematic represent potential configurations <strong>for</strong> pumping and<br />
treatment facilities not located on the WWTP site (either at the industry or in the transmission<br />
system).<br />
Metropolitan Council Environmental Services 37
Section 3: Recycled <strong>Wastewater</strong> System Components and Costs<br />
<strong>Recycling</strong> <strong>Treated</strong> <strong>Municipal</strong> <strong>Wastewater</strong> <strong>for</strong> <strong>Industrial</strong> <strong>Water</strong> <strong>Use</strong><br />
<strong>Industrial</strong> Site Treatment (7)<br />
— Some industries already treat their existing water supply. These same processes or modifications<br />
may be required with a recycled supply.<br />
— Some industries may require new treatment processes with a recycled supply. It may be a costeffective<br />
option to locate the treatment system at the industry site.<br />
Figure 3.1. Recycled <strong>Wastewater</strong> System Conceptual Model<br />
WWTP<br />
1 -<br />
2 -<br />
3 -<br />
4 -<br />
5 -<br />
1<br />
Treatment<br />
Existing Facilities<br />
Potential New Facilities<br />
New or Refurbished Facilities<br />
2<br />
Additional<br />
Disinfection<br />
Storage<br />
Additional treatment processes to meet industrial<br />
water supply requirements<br />
Additional disinfection <strong>for</strong> reclaimed regulatory limits<br />
and residual in the transmission system<br />
Storage <strong>for</strong> smaller WWTPs and where industrial<br />
demand does not match wastewater flow<br />
Pump station to supply industries<br />
Recycled wastewater transmission main and branch<br />
transmission lines<br />
3<br />
Pump Station<br />
Industry A<br />
Industry C<br />
Industry B<br />
Treatment<br />
WWTP Site Transmission<br />
Area/Industry Site<br />
Treatment<br />
Industry D<br />
38 Metropolitan Council Environmental Services<br />
4<br />
5<br />
6 -<br />
7 -<br />
6<br />
7<br />
Booster pump <strong>for</strong> transmission<br />
to some industries<br />
Industry on-site treatment<br />
Schematic shows possible<br />
combination of facilities <strong>for</strong><br />
Industries A-D supplied from<br />
recycled wastewater transmission<br />
main line<br />
Many industries have their own wastewater treatment systems. Some industries treat their wastewater and<br />
recycle the water <strong>for</strong> traditional water supply uses. For many industrial facilities, treatment of their own<br />
WWTP effluent <strong>for</strong> reuse is the cost-effective alternative, given adequate space, facilities and staff to<br />
operate the treatment systems. The technologies presented in this memorandum can also be applied to<br />
wastewater recycling within an industrial facility, recognizing that industrial wastewater effluent<br />
characteristics are industry-specific and different from domestic wastewater effluent.<br />
3.2 <strong>Water</strong> Quality Requirements<br />
The suitability of a treated wastewater supply <strong>for</strong> industrial water use will depend on the effluent quality<br />
from the specific WWTP and the requirements of a particular industry. Some industrial water uses will<br />
require no additional treatment of wastewater effluent, except <strong>for</strong> modifications to disinfection facilities.<br />
Modifications to disinfection facilities and/or practices are usually needed to meet more stringent<br />
requirements <strong>for</strong> destruction of pathogenic organisms in a recycled wastewater supply than is typically<br />
required <strong>for</strong> discharge to surface waters. Other industrial water uses will require additional treatment<br />
beyond the conventional and advanced secondary treatment system processes used at most Minnesota<br />
WWTPs. This subsection identifies the regulatory and industry-specific constituents of concern to<br />
consider in assessing the suitability and selection of treatment processes to provide a recycled wastewater<br />
supply to an industry.
<strong>Water</strong> Quality Overview<br />
The total coli<strong>for</strong>m<br />
limits and<br />
treatment process<br />
requirements<br />
imposed by the<br />
Title 22<br />
regulations are the<br />
only regulatory<br />
criteria that must<br />
be met <strong>for</strong> all<br />
Minnesota<br />
Section 3: Recycled <strong>Wastewater</strong> System Components and Costs<br />
<strong>Recycling</strong> <strong>Treated</strong> <strong>Municipal</strong> <strong>Wastewater</strong> <strong>for</strong> <strong>Industrial</strong> <strong>Water</strong> <strong>Use</strong><br />
There are two water quality drivers that affect the treatment requirements <strong>for</strong> a specific recycled<br />
wastewater supply:<br />
Regulatory requirements: typically <strong>for</strong> the protection of public health and the environment, with a<br />
focus on microbiological parameters.<br />
<strong>Use</strong>r-specific requirements: specific water supply uses, which in the case of industries is a very<br />
specific set of water quality criteria <strong>for</strong> a given facility.<br />
Recycled wastewater <strong>for</strong> industrial use in Minnesota is currently required to meet regulatory limits based<br />
on the Cali<strong>for</strong>nia <strong>Water</strong> <strong>Recycling</strong> Criteria, Title 22 Cali<strong>for</strong>nia Code of Regulations (Title 22). The<br />
complete list of criteria is included in Appendix A. The criteria specific to industrial applications<br />
(excluding any irrigation uses) are listed in Table 3.1. The MPCA handles permitting recycled wastewater<br />
as part of the NPDES permit process. The MPCA establishes recycled wastewater water quality criteria<br />
on a case-by-case basis and bases its assessment on the Title 22 criteria. There<strong>for</strong>e, the Title 22 criteria<br />
will serve as the<br />
basis <strong>for</strong> selection<br />
of treatment<br />
technologies to<br />
meet regulatory<br />
requirements in<br />
this study.<br />
Table 3.1. Cali<strong>for</strong>nia <strong>Water</strong> <strong>Recycling</strong> Criteria (<strong>Industrial</strong> <strong>Use</strong>s)<br />
Type of <strong>Use</strong><br />
Cooling water where no mist created<br />
Process water with no worker contact<br />
Boiler feed<br />
Mixing concrete<br />
Cooling water where mist created 2<br />
Process water where worker contact likely<br />
Total Coli<strong>for</strong>m<br />
Limits<br />
≤ 23/100 ml 1<br />
≤ 240/100 ml<br />
(max in any 30day<br />
period)<br />
≤ 2.2/100 ml 1<br />
≤ 23/100 ml<br />
(max in any 30day<br />
period)<br />
Treatment<br />
Required<br />
Secondary<br />
Disinfection<br />
Source: Adapted from State of Cali<strong>for</strong>nia [2000].<br />
1<br />
Based on running 7-day median; daily sampling is required.<br />
2<br />
Drift eliminator required; chlorine or other biocide required to treat cooling water to control<br />
Legionella and other microorganisms.<br />
3<br />
Not required under certain conditions.<br />
Secondary<br />
Coagulation 3<br />
Filtration<br />
Disinfection<br />
industrial recycled wastewater uses. The other water quality criteria that will drive the treatment process<br />
selection will vary with the specific use of the water. These use-specific criteria do not need to meet a<br />
regulatory permit limit, but would likely be listed as concentration requirements in an agreement between<br />
a municipality and industry <strong>for</strong> supply of recycled wastewater. Generalized water quality limits <strong>for</strong><br />
various industrial uses are provided in Table 3.2 and several constituents are discussed below.<br />
Metropolitan Council Environmental Services 39
Section 3: Recycled <strong>Wastewater</strong> System Components and Costs<br />
<strong>Recycling</strong> <strong>Treated</strong> <strong>Municipal</strong> <strong>Wastewater</strong> <strong>for</strong> <strong>Industrial</strong> <strong>Water</strong> <strong>Use</strong><br />
Figure 3.2. Generalized <strong>Water</strong> Quality Criteria <strong>for</strong> Select <strong>Industrial</strong> <strong>Use</strong>s<br />
Constituent (in mg/l)<br />
Cooling<br />
<strong>Water</strong> Boiler Feed <strong>Water</strong> Pulp & Paper Textiles<br />
(Makeup <strong>for</strong><br />
Recirculating<br />
Systems)*<br />
Low<br />
Pressure<br />
(700<br />
psig)<br />
Mechanical<br />
Piping<br />
Chemical,<br />
Unbleached<br />
Pulp &<br />
Paper,<br />
Bleached Chemical<br />
Petrochem<br />
& Coal<br />
Sizing<br />
Suspension<br />
Scouring,<br />
Bleach &<br />
Dye Cement<br />
Alkalinity (as CaCO3) 20-350 350 100 40 -- -- -- 125 -- -- -- 400<br />
Aluminum (Al) 0.1 5 0.1 0.01 -- -- -- -- -- -- -- --<br />
Calcium (Ca) 50 -- 0.4 0.01 -- 20 20 70 75 -- -- --<br />
Chemical Oxygen Demand<br />
(COD) 45<br />
5 5 1 -- -- -- -- -- -- -- --<br />
Chloride (Cl) 100-500 -- -- -- 1,000 200 200 500 300 -- -- 250<br />
Color (units -- 30 30 10 20 25 5 5 --<br />
Copper (Cu) -- 0.5 0.05 0.05 -- -- -- -- 0.05 0.01 -- --<br />
Dissolved Oxygen (DO) -- 2.5 0.007 0.007 -- -- -- -- -- -- -- --<br />
Iron (Fe) 0.5 1 0.3 0.05 0.3 1 0.1 0.1 1 0.3 0.1 2.5<br />
Hardness as CaCO3) 130-650 350 1 0.07 -- 100 100 250 350 25 25 --<br />
Bicarbonate (HCO3) 25-200 170 120 48 -- -- -- 130 450 -- -- --<br />
Magnesium (Mg) -- -- 0.25 0.01 -- 12 12 20 30 -- -- --<br />
Manganese (Mn) 0.5 0.3 0.1 0.01 0.1 0.5 0.05 0.1 -- 0.05 0.01 0.5<br />
Ammonia (NH3) 24 0.1 0.1 0.1 -- -- -- -- 40 -- -- --<br />
Nitrate (NO3) -- -- -- -- -- -- -- 5 10 -- -- --<br />
Phosphorus (Total: TP) 1 -- -- -- -- -- -- -- -- -- -- --<br />
pH (units) -- -- -- -- 6 – 10 6 – 10 6 – 10 5.5-9.0 6 – 9 -- -- 6.5 – 8.5<br />
Silicondioxide (SiO2) 50 30 10 0.7 -- 50 50 50 60 -- -- 35<br />
Sulfate (SO4) 200 -- -- -- -- -- -- 100 600 -- -- 250<br />
Total Dissolved Solids (TDS) 500 700 500 200 -- -- -- 1,000 1,000 100 100 600<br />
Total Suspended Solids (TSS) 100 10 5 0.5 -- 10 10 5 10 5 5 500<br />
Zinc (Zn) -- -- 0.01 0.01 -- -- -- -- -- -- -- --<br />
*Maximum of value range refers to concentration in final cooing stream discharge.<br />
Source: Adapted from <strong>Water</strong> Pollution Control Federation, 1989; Goldstein et al, 1970; Metcalf & Eddy, 2007<br />
40 Metropolitan Council Environmental Services
<strong>Industrial</strong> <strong>Water</strong> Quality Concerns<br />
Section 3: Recycled <strong>Wastewater</strong> System Components and Costs<br />
<strong>Recycling</strong> <strong>Treated</strong> <strong>Municipal</strong> <strong>Wastewater</strong> <strong>for</strong> <strong>Industrial</strong> <strong>Water</strong> <strong>Use</strong><br />
<strong>Industrial</strong> uses of recycled wastewater include cooling, process water, stack scrubbing, boiler feed,<br />
washing, transport of material, and as an ingredient in a product. Cooling is the predominant recycled<br />
wastewater application, accounting <strong>for</strong> more than 90 percent of the total volume of recycled wastewater in<br />
the U.S. used <strong>for</strong> industrial purposes. As shown in the demand analysis of Section 2, cooling water is also<br />
the predominant industrial water use in Minnesota. Cooling and boiler feed water are water uses<br />
applicable to multiple industry categories. The constituents of concern <strong>for</strong> these water uses and some<br />
process water uses are listed in Table 3.2 and are discussed in more detail below.<br />
Cooling <strong>Water</strong><br />
The constituents of concern <strong>for</strong> cooling water uses include: pathogenic microorganisms, inorganic matter<br />
that leads to scale <strong>for</strong>mation, dissolved solids that can cause corrosion, and organic matter and nutrients<br />
that promote biological growth and the <strong>for</strong>mation of slimes. These problems are caused by constituents in<br />
ground or surface waters and potable water, as well as recycled wastewater, but the concentrations of<br />
some constituents in recycled wastewater may be higher. These constituents need to be controlled in the<br />
supply to the cooling systems and may also have to be removed from the blowdown prior to discharge,<br />
depending on the cycles of concentration and discharge option (surface water, land application, or sewer<br />
system) and the corresponding limits.<br />
Pathogenic microorganisms in water supplied to cooling towers must be eliminated prior to use so there is<br />
no hazard to workers and to the public in the vicinity of cooling towers from aerosols and windblown<br />
spray. Biocides are added to all cooling waters onsite to prevent slimes and otherwise inhibit<br />
microbiological activity, which has the secondary effect of eliminating or greatly diminishing the<br />
potential health hazard associated with aerosols or windblown spray. Biocide addition is required <strong>for</strong><br />
recycled wastewater and traditional water supplies. Aerosols produced in the workplace or from cooling<br />
towers also may present hazards from the inhalation of VOCs. This same hazard exists with traditional<br />
water supplies that could have VOCs present. There has been no indication that VOCs have created health<br />
problems at any existing recycled wastewater site. Closed-loop cooling systems using recycled<br />
wastewater present minimal health concerns unless there is inadvertent or intentional misuse of the water.<br />
All cooling water systems should be operated and maintained to reduce the Legionella threat, regardless of<br />
the origin of the source water. There have been no reported cases to show that recycled wastewater is more<br />
likely to contain Legionella pneumophila bacteria than waters of non-sewage origin.<br />
Cooling water should not lead to the <strong>for</strong>mation of scale, i.e. hard deposits in the cooling system. Such<br />
deposits reduce the efficiency of the heat exchange. The principal causes of scaling are calcium (as<br />
carbonate, sulfate, and phosphate) and magnesium (as carbonate and phosphate) deposits. Scale control<br />
through chemical addition or other treatment processes is common <strong>for</strong> facilities using potable, supplies or<br />
their own permitted ground or surface supply with naturally hard water. The higher concentrations of<br />
these inorganic constituents in recycled wastewater may require more extensive treatment than with an<br />
existing supply.<br />
High levels of dissolved solids, ammonia, and heavy metals in cooling water can cause serious corrosion<br />
problems. Corrosion potential is higher in recycled wastewater where total dissolved solids (TDS)<br />
concentrations are between 100-400 mg/L more than in traditional water supplies [Puckorius and Hess,<br />
1991; Tchobanoglous et al., 2003]. Of particular concern in Minnesota are high chloride levels. Many of<br />
Minnesota’s recycled wastewater supplies may have high chloride levels as a result of softening system<br />
salt brine disposal from homes and commercial and industrial businesses. This was evident in the<br />
sampling of Twin Cities metro area WWTPs that identified higher levels of chlorides in communities<br />
served by potable ground water supplies without centralized softening treatment. Chloride concentration<br />
in WWTP effluent has also been linked to the influence of infiltration and inflow (I&I) and chlorides<br />
imparted from road salt used <strong>for</strong> winter deicing.<br />
Metropolitan Council Environmental Services 41
Section 3: Recycled <strong>Wastewater</strong> System Components and Costs<br />
<strong>Recycling</strong> <strong>Treated</strong> <strong>Municipal</strong> <strong>Wastewater</strong> <strong>for</strong> <strong>Industrial</strong> <strong>Water</strong> <strong>Use</strong><br />
Ammonia can induce corrosion in copper-based alloys. Ammonia is present at high concentrations in the<br />
treated wastewater effluent of plants without advanced secondary treatment processes. Dissolved gases<br />
and certain metals with high oxidation states also promote corrosion. For example, heavy metals,<br />
particularly copper, can plate out on mild steel, causing severe pitting. Corrosion also may occur when<br />
acidic conditions develop in the cooling water.<br />
The moist environment in a cooling tower is conducive to biological growth. Microorganisms can<br />
significantly reduce the heat transfer efficiency, reduce water flow, and in some cases generate corrosive<br />
by-products [Cali<strong>for</strong>nia State <strong>Water</strong> Resources Control Board, 1980]. Recycled wastewater used in<br />
cooling systems may require treatment to control the nutrients, ammonia and phosphorus, and/or organic<br />
matter which promote the growth of slime-<strong>for</strong>ming organisms. Organic matter is measured by surrogate<br />
parameters such as carbonaceous biochemical oxygen demand (CBOD) or total organic carbon (TOC).<br />
Sulfide-producing bacteria and sulfate-reducing bacteria are the most common corrosion-causing<br />
organisms in cooling systems using recycled wastewater. These anaerobic sulfide producers occur<br />
beneath deposits and cause pitting corrosion that is most severe on mild and stainless steels. Serious<br />
corrosion is caused by thiobaccillus bacteria, an acid-producer that converts sulfides to sulfuric acid.<br />
Similarly, nitrifying bacteria can convert ammonia to nitric acid, thus causing pH depression, which<br />
increases corrosion on most metals.<br />
Boiler Feed <strong>Water</strong><br />
Boiler feed water has very stringent water quality requirements that typically requires a treatment system<br />
even with potable water supplies. Boiler feed water must be treated to remove hardness. Calcium and<br />
magnesium salts are the principal contributors to scale <strong>for</strong>mation and deposits in boilers. Excessive<br />
alkalinity contributes to foaming and results in deposits in heater, reheater, and turbine units. Bicarbonate<br />
alkalinity, under the influence of boiler heat, may lead to the release of carbon dioxide, which is a source<br />
of corrosion in steam-using equipment. Silica and aluminum <strong>for</strong>m a hard scale on heat-exchanger<br />
surfaces, while high concentrations of potassium and sodium can cause excessive foaming in the boiler.<br />
Process <strong>Water</strong><br />
The suitability of recycled wastewater <strong>for</strong> use in industrial<br />
processes depends on the particular use and is highly variable. For<br />
example, the electronics industry requires a very high water<br />
quality <strong>for</strong> washing circuit boards and other electronic<br />
components. On the other hand, the tanning industry can use<br />
relatively low-quality water. Requirements <strong>for</strong> textiles, pulp and<br />
paper, and metal fabricating are intermediate. The constituents of<br />
concern <strong>for</strong> the pulp and paper industry are discussed in more<br />
detail to provide an example of the variety of water quality<br />
parameters that must be considered <strong>for</strong> any process water use.<br />
<strong>Use</strong> of recycled wastewater in the paper and pulp industry is a<br />
function of the grade of paper produced. The higher the quality of<br />
the paper, the more sensitive it is to water quality. Impurities<br />
found in water, particularly certain metal ions and color bodies,<br />
can cause the paper to change color with age. Biological growth<br />
can cause clogging of equipment and odors and can affect the<br />
texture and uni<strong>for</strong>mity of the paper. Corrosion and scaling of equipment may result from the presence of<br />
silica, aluminum, and hardness. Discoloration of paper may occur due to iron, manganese, or microorganisms.<br />
Suspended solids may decrease the brightness of the paper.<br />
42 Metropolitan Council Environmental Services
Emerging Contaminants of Concern<br />
Section 3: Recycled <strong>Wastewater</strong> System Components and Costs<br />
<strong>Recycling</strong> <strong>Treated</strong> <strong>Municipal</strong> <strong>Wastewater</strong> <strong>for</strong> <strong>Industrial</strong> <strong>Water</strong> <strong>Use</strong><br />
Several emerging contaminants of concern (ECOC) are under evaluation <strong>for</strong> recycled wastewater<br />
applications that could affect potable water supplies, such as aquifer recharge. They are likely not an issue<br />
<strong>for</strong> industrial applications with recycled wastewater because water uses are all non-potable, but are<br />
mentioned because it is a concern <strong>for</strong> potable water treatment and recycled wastewater practices in<br />
general and could affect future regulations and the direction <strong>for</strong> best management practices that would<br />
impact the entire recycled wastewater industry. The ECOCs gaining attention in recycled wastewater<br />
practices with direct or indirect aquifer recharge include:<br />
pharmaceutically active chemicals (PhACs)<br />
endocrine disrupting compounds (EDCs)<br />
disinfection by products (DBPs) such as N-nitrosodimethylamine (NDMA)<br />
a host of ground water supply contaminants such as 1,4-dioxane and methyl tertiary-butyl ether<br />
(MTBE)<br />
new and reemerging pathogenic microorganisms such as Legionella pneumophilia, Cryptosporidium,<br />
and Giardia<br />
Several ECOCs occur in trace amounts and are of concern to humans <strong>for</strong> toxicity to the chemicals with<br />
repeated exposure through consumption of the source water. There are also reemerging microorganisms,<br />
thought to be essentially eliminated, linked to disease outbreaks. ECOCs, such as endocrine disruptors,<br />
are also being evaluated <strong>for</strong> their environmental impact on aquatic communities. Endocrine disruptors and<br />
several of the ECOCs are of domestic, commercial or industrial origins and can concentrate in a<br />
wastewater system. These compounds are not removed with typical WWTP processes and are discharged<br />
with the effluent. The evaluation of the risks associated with these compounds, whether discharged to<br />
surface water, applied to the land with an irrigation recycled wastewater practice, or to aquifers with<br />
recharge practices is just beginning. With improved laboratory analytical equipment that provides<br />
measurement at much smaller concentrations, and increased monitoring <strong>for</strong> these compounds, the<br />
technical base of in<strong>for</strong>mation is growing – ECOCs are expected to be a topic <strong>for</strong> consideration of all<br />
future water supplies, including recycled wastewater.<br />
3.3 Recycled <strong>Wastewater</strong> Quality and Treatment Technologies<br />
Overview<br />
The treatment requirements and technologies selected <strong>for</strong> specific industrial reuse applications are based<br />
on a variety of factors summarized in Table 3.3. With all these variables, the treatment process and<br />
transmission system selected is a site and case-specific one. For the purposes of planning and assessing<br />
the feasibility of recycled wastewater systems, some general assumptions were made to define classes of<br />
treated wastewater to meet various industrial uses. A technology-based approach is used to establish the<br />
treatment system and costs <strong>for</strong> each class of recycled wastewater.<br />
Table 3.3. Treatment Requirements and Technology Selection Factors<br />
Treatment Requirement Factors:<br />
recycled wastewater regulations<br />
the intended use of the water by the industry<br />
the WWTP effluent quality, which is characterized by the<br />
specific:<br />
— quality of the source water used by a community<br />
— industrial, commercial, and domestic discharges to<br />
the WWTP<br />
— treatment processes used at the WWTP<br />
Technology Selection Factors:<br />
the WWTP’s existing process train<br />
the quantity of wastewater recycled at a given<br />
location (there are more cost-effective<br />
technologies <strong>for</strong> smaller or larger treatment<br />
systems)<br />
whether treatment is incorporated at the WWTP,<br />
at the industry, or at a satellite facility<br />
if storage is required because additional<br />
treatment may be required<br />
Metropolitan Council Environmental Services 43
Section 3: Recycled <strong>Wastewater</strong> System Components and Costs<br />
<strong>Recycling</strong> <strong>Treated</strong> <strong>Municipal</strong> <strong>Wastewater</strong> <strong>for</strong> <strong>Industrial</strong> <strong>Water</strong> <strong>Use</strong><br />
The regulatory requirements impose two basic treatment process modifications or additions <strong>for</strong> all<br />
Minnesota WWTPs providing recycled wastewater:<br />
Disinfection – higher levels of disinfection, year-round disinfection (currently required only from<br />
April – October in Minnesota), and <strong>for</strong> transmission system residual<br />
Filtration and possibly coagulation processes (or membrane processes), <strong>for</strong> industrial water uses where<br />
worker contact is likely<br />
Recycled <strong>Wastewater</strong> Quality<br />
<strong>Municipal</strong> wastewater treatment processes generally include pretreatment, primary and secondary<br />
treatment processes. The secondary treatment processes per<strong>for</strong>m the dissolved organic removal and final<br />
solids removal step in what is typically referred to as a secondary treatment system. In some WWTPs, the<br />
secondary process also removes ammonia, through the process of nitrification. Complete nitrogen<br />
removal, which includes removal of the nitrates produced through nitrification, is less common at<br />
Minnesota WWTPs, but several facilities are equipped <strong>for</strong> it. Phosphorus removal is also per<strong>for</strong>med at<br />
many facilities in Minnesota. For this study, the term advanced secondary treatment, is used to define a<br />
secondary wastewater treatment plant that removes ammonia and phosphorus.<br />
The historic water quality record of WWTP effluent is extensive <strong>for</strong> constituents of concern to the<br />
receiving waters. These constituents include carbonaceous or total biochemical oxygen demand (CBOD,<br />
TBOD, or BOD), total suspended solids (TSS), ammonia (NH3), total phosphorus (TP), and fecal<br />
coli<strong>for</strong>m. Many WWTPs also have a historic record of heavy metals and priority pollutant compounds<br />
collected on a less frequent basis. These parameters are also important in characterizing the effluent<br />
quality and applicability <strong>for</strong> industrial use. However, there are many other constituents of concern <strong>for</strong><br />
industrial applications, as discussed previously, and the majority of these are not commonly characterized<br />
in municipal WWTP effluent. Sampling per<strong>for</strong>med <strong>for</strong> this project, reported in Appendix II-2, and<br />
literature values provide a general basis <strong>for</strong> establishing wastewater effluent quality assumptions <strong>for</strong> these<br />
parameters.<br />
Historic records of Minnesota’s municipal WWTP effluent quality (MPCA, 2005) were evaluated <strong>for</strong> this<br />
project and are summarized in Appendix II-4. The results from the 2005 analysis indicate that larger<br />
facilities (greater than 1 mgd in capacity) produce a high quality effluent with organic, solids, and<br />
microbiological concentrations at levels acceptable <strong>for</strong> many industrial uses. Over 90% of the larger<br />
WWTPs produced effluent with annual average CBOD and TSS concentrations less than 10 mg/L. Most<br />
smaller WWTPs also produced high quality effluent, with over 250 facilities reporting TSS<br />
concentrations under 10 mg/L and over 400 facilities reporting CBOD concentrations less than 10 mg/L.<br />
Phosphorus was shown to meet a 1 mg/L limit at over 40% of the larger WWTPs, or approximately 30<br />
facilities.<br />
Sampling conducted <strong>for</strong> this study characterized water quality constituents not routinely analyzed by<br />
WWTPs, many of which are listed in Table 3.2. The results of the monitoring of four of the Met Council<br />
WWTPs, review of Minnesota surface and water supply data, and literature values were used to define a<br />
standard quality of recycled wastewater to assess use of this water by industries. Recognizing that water<br />
quality varies over the state, a broad assumption was made that Minnesota’s waters tend to be harder than<br />
other regions of the country, and higher in dissolved solids in many regions of the state. The constituents<br />
associated with hardness and dissolved solids are generally not removed by advanced secondary treatment<br />
processes.<br />
The identification of treatment technologies and estimation of system costs required that a standard<br />
WWTP effluent water quality be identified. This study uses an advanced secondary treatment WWTP to<br />
define a “base” WWTP effluent quality or a “base” supply. The reason <strong>for</strong> this selection is based on the<br />
future expectations <strong>for</strong> WWTP process requirements and the water quality requirements <strong>for</strong> Minnesota’s<br />
larger industrial water uses.<br />
44 Metropolitan Council Environmental Services
Section 3: Recycled <strong>Wastewater</strong> System Components and Costs<br />
<strong>Recycling</strong> <strong>Treated</strong> <strong>Municipal</strong> <strong>Wastewater</strong> <strong>for</strong> <strong>Industrial</strong> <strong>Water</strong> <strong>Use</strong><br />
As more restrictions are being placed on loadings to our waterways, the removal of the nutrients, nitrogen<br />
and phosphorus, will be implemented at more WWTPs and limits could be lowered <strong>for</strong> those already<br />
removing nutrients. New facilities and major expansions permitted in the state are anticipated to have<br />
nutrient limits that would dictate the use of an advanced secondary treatment process train. In addition,<br />
because one of the largest and most likely industrial uses of recycled wastewater is <strong>for</strong> cooling water,<br />
which requires minimal levels of phosphorus and ammonia, use of an advanced secondary treatment<br />
system effluent is an optimum starting point. This assumption does not exclude consideration of other<br />
types of wastewater treatment facilities <strong>for</strong> water reclamation, such as fixed film systems (trickling filters<br />
and rotating biological contactors), stabilization ponds, chemical/physical package systems, or natural<br />
systems (wetland treatment). However, it is likely that these facilities would require additional treatment<br />
processes to meet the water quality requirements of a specific industry and the regulatory requirements.<br />
Recycled <strong>Wastewater</strong> Classifications<br />
Five types of recycled wastewater, listed in Table 3.4, are used to categorize the recycled wastewater<br />
options available <strong>for</strong> specific industrial water supply requirements. The classification is based on a train<br />
of treatment technologies to meet a set of water quality goals. All classifications provide a safe supply<br />
from a public health perspective – the different water quality goals relate to the specific requirements <strong>for</strong><br />
the industrial water use. All classifications assume an initial WWTP effluent quality typical of a<br />
secondary activated sludge system with ammonia and phosphorus removal, defined as the “base” supply.<br />
Additional treatment processes following secondary treatment are required to produce the other four<br />
classes of recycled wastewater. The term ‘tertiary’ is used to define these classifications because the<br />
treatment process generally follows the secondary treatment process at a WWTP.<br />
Table 3.4. Recycled <strong>Wastewater</strong> Classifications<br />
Classification Characteristics<br />
Base<br />
For non-contact industrial uses with low concern <strong>for</strong> hardness and dissolved solids<br />
Advanced Base WWTP process train – a secondary treatment system with ammonia and phosphorus<br />
Secondary removal<br />
Tertiary 1 For industrial uses with human contact potential and/or industries that require partial hardness<br />
Conventional<br />
or phosphorus removal<br />
Requires a coagulation/flocculation/sedimentation process with filtration; chemical used<br />
depends on target constituent<br />
Removes hardness (with lime) and some dissolved salts; provides some soluble organic<br />
removal and color removal<br />
Tertiary 2 For industrial uses with human contact potential and/or industries that can use hard/high salt<br />
Membrane<br />
water<br />
Filtration Provides soluble organic removal and color removal<br />
Provides pathogen removal and reduces disinfection requirements<br />
Tertiary 3<br />
Membrane<br />
Softening<br />
Tertiary 4<br />
Advanced<br />
Processes<br />
For industries requiring low dissolved salts<br />
Requires Tertiary 2 water followed by softening with reverse osmosis (RO) or electrodialysis<br />
(ED) depending on the target constituents<br />
For industries requiring low dissolved salts and removal of trace constituents<br />
Requires Tertiary 3 water with RO and either ion exchange, carbon adsorption or advanced<br />
oxidation processes, depending on the target constituent.<br />
Metropolitan Council Environmental Services 45
Section 3: Recycled <strong>Wastewater</strong> System Components and Costs<br />
<strong>Recycling</strong> <strong>Treated</strong> <strong>Municipal</strong> <strong>Wastewater</strong> <strong>for</strong> <strong>Industrial</strong> <strong>Water</strong> <strong>Use</strong><br />
Table 3.5 identifies the typical water quality constituent concentrations <strong>for</strong> the five classes of recycled<br />
wastewater.<br />
Table 3.5. <strong>Water</strong> Quality <strong>for</strong> Recycled <strong>Wastewater</strong> Classifications 1<br />
Constituent<br />
Recycled <strong>Wastewater</strong> Concentration 2<br />
Base Tertiary 1 Tertiary 2 Tertiary 3 Tertiary 4<br />
Advanced<br />
Secondary<br />
Conventional<br />
Membrane<br />
Filtration<br />
Membrane<br />
Softening<br />
Advanced<br />
Processes<br />
BOD, mg/L 5-10 < 5
Section 3: Recycled <strong>Wastewater</strong> System Components and Costs<br />
<strong>Recycling</strong> <strong>Treated</strong> <strong>Municipal</strong> <strong>Wastewater</strong> <strong>for</strong> <strong>Industrial</strong> <strong>Water</strong> <strong>Use</strong><br />
The tertiary supplies are required <strong>for</strong> water uses where human contact is likely. Tertiary 1 treatment<br />
processes would be applicable to WWTPs that need to remove phosphorus or hardness and do not need to<br />
remove a significant amount of dissolved salts. The process train consists of conventional chemical<br />
addition, coagulation, flocculation and sedimentation processes, followed by filtration.<br />
The Tertiary 2 supply is based on the use of membrane microfiltration. This technology meets the<br />
regulatory filtration requirements and provides higher pathogen removals than the Base or Tertiary 1<br />
supplies. However, it does not remove hardness as Tertiary 1 treatment does. Similar to Tertiary 1<br />
treatment, Tertiary 2 treatment does not remove dissolved salts. Membrane softening, the key Tertiary 3<br />
treatment process, is required to reduce the dissolved solids, which includes chlorides. For this study,<br />
reverse osmosis was selected as the membrane softening process <strong>for</strong> the cost analysis. In addition to<br />
removing hardness, reverse osmosis also removes nearly all pathogens, organic and inorganic<br />
compounds. Nanofiltration and electrodialysis are two other potential technologies that could be used to<br />
meet hardness goals, but provide <strong>for</strong> lower removals and, in the case of electrodialysis, no additional<br />
pathogen removal.<br />
For waters that require very low levels of constituents, advanced processes such as granular activated<br />
carbon, ion exchange, ultraviolet radiation (UV), and UV in combination with oxidants can be used.<br />
These are processes that could be used to treat emerging contaminants of concern that are present at very<br />
low levels. The Tertiary 4 treatment processes are ones that would likely be used by an onsite industry<br />
with its existing water supply. For example, a Tertiary 4 treatment process with ion exchange is a typical<br />
technology used to treat boiler feed water. In this case, the level of treatment provided by a Tertiary 4<br />
process would exceed that provided by a traditional water supply. In some instances, there could be<br />
constituents needing removal that are related to discharges into the sewer system, such as heavy metals<br />
from industry or pharmaceutical-compounds. Tertiary 4 treatment processes could be located at either the<br />
WWTP or industry site depending on the specific attributes of the recycled wastewater application.<br />
An industry sector assessment of treatment needs, presented in Table 3.6, shows the range of options that<br />
an industry would need to evaluate. The variability in WWTP effluent quality and industry water quality<br />
requirements dictates a site-specific evaluation to determine the treatment alternatives. Table 3.6 also lists<br />
the dominant water uses within an industry category and Table 3.7 provides the subcategories <strong>for</strong> major<br />
industry categories that have a wide range of industry types.<br />
Metropolitan Council Environmental Services 47
Section 3: Recycled <strong>Wastewater</strong> System Components and Costs<br />
<strong>Recycling</strong> <strong>Treated</strong> <strong>Municipal</strong> <strong>Wastewater</strong> <strong>for</strong> <strong>Industrial</strong> <strong>Water</strong> <strong>Use</strong><br />
Table 3.6. <strong>Water</strong> Quality and Treatment Requirements by Industry Category<br />
Industry Category Type of <strong>Water</strong> <strong>Use</strong><br />
Recycled <strong>Wastewater</strong> Quality Classification Required<br />
Base Tertiary 1 Tertiary 2 Tertiary 3 Tertiary 4<br />
Advanced<br />
Secondary<br />
Conventional<br />
Membrane<br />
Filtration<br />
Membrane<br />
Softening<br />
Advanced<br />
Processes<br />
Agricultural Cooling, Boiler Feed x x x<br />
Pulp & Paper<br />
Mining<br />
Cooling, Process,<br />
Boiler Feed<br />
Process, Boiler<br />
Feed<br />
Sand & Gravel Washing Process x<br />
<strong>Industrial</strong> Cooling-Once-<br />
Through<br />
Petroleum, Chemical &<br />
Ethanol<br />
Metals<br />
Non-Metals<br />
x x x x<br />
x x x x<br />
Cooling x x x<br />
Cooling, Process,<br />
Boiler Feed<br />
Process, Cooling,<br />
Boiler Feed<br />
Process, Cooling,<br />
Boiler Feed<br />
x x x<br />
x x x<br />
x x x x x<br />
Other Process x x x x x<br />
Power Cooling-Once<br />
Through/Other<br />
Power Cooling-<br />
Recirculating<br />
Table 3.7. Select Industry Subcategories<br />
Cooling, Boiler Feed x x x x<br />
Cooling, Boiler Feed x x x x<br />
Agricultural Pulp and Paper<br />
Food Production Mills<br />
Beverage Production Paper and Packaging<br />
Non-Metals Printed Products<br />
Other<br />
Building Materials Metals<br />
Glass Products Foundries<br />
Leather Products Metal Product Fabrication<br />
Plastics Machine and Tool Shops<br />
Rubber Products Electronic and Computer Products<br />
Miscellaneous Non-Metal Products Electroplating<br />
Other Industries (not defined above)<br />
48 Metropolitan Council Environmental Services
3.4 Storage and Transmission<br />
Overview<br />
Section 3: Recycled <strong>Wastewater</strong> System Components and Costs<br />
<strong>Recycling</strong> <strong>Treated</strong> <strong>Municipal</strong> <strong>Wastewater</strong> <strong>for</strong> <strong>Industrial</strong> <strong>Water</strong> <strong>Use</strong><br />
An integral part of the planning, operation, and maintenance of recycled wastewater systems is the<br />
transmission of the recycled wastewater to the customer. Transmission costs, both capital and O&M, are a<br />
significant cost component of recycled wastewater projects. Transmission systems typically include onsite<br />
storage, pump station(s), piping, off-site storage, diversion structures to off-site storage ponds, service<br />
connections, and metering. <strong>Wastewater</strong> recycling regulations and guidelines generally include standards<br />
<strong>for</strong> the design, installation, operation, and maintenance of the transmission systems. In addition, there are<br />
very specific guidelines and requirements <strong>for</strong> any cross-connections to other systems, use of backflow<br />
preventions devices and other plumbing features.<br />
Storage<br />
The conceptual recycled wastewater system, presented previously in Figure 3.1, provides <strong>for</strong> storage<br />
facilities on the WWTP site to meet a range of storage volumes. The base recycled wastewater system<br />
assumes that no storage is required, which is valid <strong>for</strong> a larger WWTP serving smaller industrial demands.<br />
The cost curves developed <strong>for</strong> this study do not include storage requirements, but cost in<strong>for</strong>mation was<br />
developed to asses the impact of storage on system costs and is detailed in Section 5.5 of Appendix II-3.<br />
For purposes of this study, it is assumed that where storage is needed, it is <strong>for</strong> diurnal, daily, or weekly<br />
industrial demand patterns that the WWTP cannot meet with their continuous supply. Storage<br />
requirements <strong>for</strong> industrial applications can vary widely. Some industries may have adequate storage to<br />
meet peak hour requirements, but most would not have storage to handle significant volumes. Storage<br />
would likely be needed with smaller WWTPs where the diurnal flows could drop below the required<br />
demand of an industry or group of industries. Weekly demand patterns of industry could also change and<br />
should be accounted <strong>for</strong> when establishing storage requirements.<br />
This study does not consider any seasonal storage requirements <strong>for</strong> a reclaimed supply. Seasonal storage<br />
would be required <strong>for</strong> WWTPs that incorporate reuse practices to reduce their discharges to waterways<br />
and supply seasonal customers. These facilities would need to store and/or dampen peak flows to meet<br />
NPDES limits during periods when the seasonal recycled wastewater customers do not use water.<br />
Seasonal storage may also be required to meet a seasonal water demand, where peak demands cannot be<br />
consistently matched by the WWTP flow. The majority of Minnesota’s industries have year-round water<br />
demands. Some exceptions include: agricultural processing industries, which may depend on seasonal<br />
crops; industries that use recycled wastewater <strong>for</strong> landscape irrigation; and some cooling water<br />
applications. Seasonal storage facilities are common in recycled wastewater systems <strong>for</strong> irrigation<br />
practices.<br />
Recycled wastewater storage can also provide system reliability with a short-term supply if there is a<br />
process disruption as well as additional contact time <strong>for</strong> chlorine disinfection.<br />
Pumping<br />
This study assumes a pump station is located on the WWTP site and is owned by the municipality. The<br />
pump station is assumed to include standby and reliability features consistent with state water supply<br />
requirements. The pump station is sized <strong>for</strong> peak flow and a residual pressure at the end of the pipe line of<br />
40 psi, assuming delivery at the same elevation as the WWTP.<br />
Transmission Pipelines<br />
The majority of recycled wastewater transmission piping is polyvinyl chloride pipe (PVC) or ductile iron<br />
pipe (DIP) meeting specific industry standards. For this study, the transmission system is assumed to be<br />
all <strong>for</strong>ce main with the following characteristics: pipe with a diameter of 24 inches or less is PVC, DR 18,<br />
Class 150 and greater than 24 inch diameter pipe is DIP, Class 51 with push-on joints. Pipelines are sized<br />
to carry the peak hour demand of a given industry at a target velocity of 5 to 7 feet per second (fps).<br />
Details assumed <strong>for</strong> the cost analysis are provided in Appendix II-3.<br />
Metropolitan Council Environmental Services 49
Section 3: Recycled <strong>Wastewater</strong> System Components and Costs<br />
<strong>Recycling</strong> <strong>Treated</strong> <strong>Municipal</strong> <strong>Wastewater</strong> <strong>for</strong> <strong>Industrial</strong> <strong>Water</strong> <strong>Use</strong><br />
3.5 Costs<br />
Basis and Assumptions<br />
Costs were developed as a cost of service in dollars per 1000 gallons ($/1000 gallons), assuming a 20year<br />
debt service. Cost curves are used to provide the cost of service to supply a range of demands from<br />
0.1 to 30 mgd <strong>for</strong> a 10-mile range from the WWTP. The financial assumptions and detailed basis of cost<br />
are presented in Appendix II-3.<br />
Costs were estimated <strong>for</strong> the Base and Tertiary 1 through Tertiary 4 water treatment processes described<br />
previously. The base level quality is defined as a hard water that meets regulatory standards <strong>for</strong> noncontact<br />
industrial water uses. The “base recycled wastewater system” includes treatment processes and<br />
the transmission system <strong>for</strong> delivery from the WWTP to the industry. “Alternative recycled wastewater<br />
systems” differ from the base system in the treatment processes used to produce a prescribed set of water<br />
quality goals, presented previously in Table 3.5. The recycled wastewater system costs are based on a<br />
wastewater quality typical of a WWTP with secondary treatment and ammonia and phosphorus removal.<br />
Base Recycled <strong>Wastewater</strong> System Costs<br />
The cost curves developed <strong>for</strong> the base system indicate that, <strong>for</strong> some industries, a recycled wastewater<br />
Figure 3.3 Recycled <strong>Wastewater</strong> System Cost of Service <strong>for</strong><br />
0-5 mgd Capacity Base System<br />
Cost of Service, $/1000 gallon<br />
5.00<br />
4.50<br />
4.00<br />
3.50<br />
3.00<br />
2.50<br />
2.00<br />
1.50<br />
1.00<br />
0.50<br />
0.00<br />
$2/1000 gallons - Typical Potable <strong>Water</strong> Supply Cost<br />
0 1 2 3 4 5<br />
Recycled <strong>Wastewater</strong> Flow/Demand, mgd<br />
supply system can be cost<br />
competitive with potable water<br />
supplies in Minnesota. This assumes<br />
that an advanced secondary<br />
wastewater treatment plant effluent<br />
water quality is suitable <strong>for</strong> that<br />
industry, or that the industry already<br />
has a treatment system in place <strong>for</strong> its<br />
existing supply that can be used or<br />
upgraded <strong>for</strong> a recycled supply. As<br />
shown in Figure 3.3 and tabulated in<br />
Appendix II-3 (Appendix C), a<br />
reclaimed water system designed <strong>for</strong><br />
an annual average flow of less than<br />
0.5 mgd is not expected to be<br />
competitive with most potable water<br />
supplies. As the system capacity<br />
increases above 1 mgd, a 10-mile system shows a comparable potable water supply cost of $2/1000<br />
gallons. For flows greater than 5 mgd,<br />
as shown in Figure 3.4, costs drop to<br />
less than $0.60/1000 gallons, even at a<br />
distance of 10 miles <strong>for</strong> 30 mgd.<br />
Potable water supplies in the<br />
Minneapolis/St. Paul area range from<br />
$1-$3/1000 gallons and fluctuate<br />
around that cost in other areas of<br />
Minnesota. Some rural water systems<br />
have costs over $5.00/1000 gallon.<br />
The base system provides a water<br />
quality that could possibly be suitable<br />
<strong>for</strong> a once-through cooling process or<br />
sand and gravel washing. It would also<br />
be sufficient <strong>for</strong> irrigation of restricted<br />
areas on industrial site grounds. To<br />
Transmission Distance, miles<br />
1<br />
2<br />
3<br />
4<br />
5<br />
10<br />
Figure 3.4. Recycled <strong>Wastewater</strong> System Cost of Service <strong>for</strong><br />
5-30 mgd Capacity Base System<br />
Cost of Service, $/1000 gallon<br />
1.00<br />
0.90<br />
0.80<br />
0.70<br />
0.60<br />
0.50<br />
0.40<br />
0.30<br />
0.20<br />
0.10<br />
0.00<br />
$2/1000 gallons - Typical Potable <strong>Water</strong> Supply Cost<br />
5 10 15 20 25<br />
Recycled <strong>Wastewater</strong> Flow/Demand, mgd<br />
Transmission Distance, miles<br />
50 Metropolitan Council Environmental Services<br />
1<br />
2<br />
3<br />
4<br />
5<br />
10<br />
30
Section 3: Recycled <strong>Wastewater</strong> System Components and Costs<br />
<strong>Recycling</strong> <strong>Treated</strong> <strong>Municipal</strong> <strong>Wastewater</strong> <strong>for</strong> <strong>Industrial</strong> <strong>Water</strong> <strong>Use</strong><br />
meet the anticipated water requirements <strong>for</strong> much of Minnesota’s industrial water demand, additional<br />
treatment at the WWTP or the industry site will be required. For example, some cooling water<br />
applications will require a softening process to reduce hardness and dissolved salts.<br />
Alternative Recycled <strong>Wastewater</strong> Treatment Costs<br />
The cost to treat WWTP effluent water beyond the base level processes is estimated to be $1.25 -<br />
$5.00/1000 gallons <strong>for</strong> a 0.5 mgd<br />
supply, $1 - $4.00/1000 gallons <strong>for</strong> a 1<br />
mgd supply, and in the range of $0.50<br />
- $3.00/1000 gallons <strong>for</strong> a 30 mgd<br />
supply. Table 3.8 and Figure 3.5<br />
summarize the costs <strong>for</strong> flows from<br />
0.1 to 30 mgd <strong>for</strong> each of the tertiary<br />
reclaimed water classifications. These<br />
costs are <strong>for</strong> treatment in addition to<br />
the base system treatment,<br />
transmission, and other system costs.<br />
In comparing conventional treatment<br />
to membrane systems to soften the<br />
water and remove dissolved solids, the<br />
membrane process is more expensive<br />
except when treating smaller supplies.<br />
However, additional credit in<br />
microbial removal with membranes<br />
could offset disinfection costs. Blended supplies and treatment streams could also be considered to<br />
optimize treatment costs and meet multiple water supply needs. The lower costs of conventional treatment<br />
<strong>for</strong> larger supplies may be underestimated because it is assumed that a WWTP has adequate land <strong>for</strong> the<br />
treatment facilities and uses a less costly solids disposal practice, such as land application of lime sludge.<br />
This may not be an option <strong>for</strong> some municipalities or industries.<br />
Table 3.8. Treatment Costs <strong>for</strong> Tertiary 1 through Tertiary 4 Systems*<br />
Cost of Service <strong>for</strong> Treatment, $/1000 gallons<br />
Tertiary 1 Tertiary 2 Tertiary 3 Tertiary 4<br />
Flow/<br />
Conven- Membrane Membrane Ion<br />
Demand, mgd tional Filtration Softening Exchange GAC UV<br />
0.1 6.90 2.90 4.85 6.15 7.75 5.25<br />
0.5 2.20 1.30 2.70 3.65 4.80 3.00<br />
1 1.70 1.10 2.40 3.30 3.70 2.55<br />
1.5 1.40 1.00 2.30 3.15 3.35 2.40<br />
2 1.20 0.95 2.25 3.10 3.15 2.35<br />
3 1.05 0.95 2.20 3.05 3.00 2.25<br />
4 0.90 0.95 2.20 3.05 2.90 2.25<br />
5 0.80 0.90 2.15 3.00 2.80 2.20<br />
10 0.60 0.80 2.00 2.85 2.60 2.10<br />
15 0.50 0.75 1.95 2.80 2.50 2.00<br />
30 0.45 0.70 1.85 2.70 2.30 1.90<br />
*In addition to recycled wastewater base system costs<br />
Figure 3.5. Treatment Costs <strong>for</strong> Tertiary 1 through Tertiary 4<br />
Processes<br />
Cost of Service, $/1000 gallons<br />
8.00<br />
7.00<br />
6.00<br />
5.00<br />
4.00<br />
3.00<br />
2.00<br />
1.00<br />
0.00<br />
Treatment Systems<br />
T=Tertiary; Levels 1-4<br />
T1-Conventional<br />
T2-Membrane Filtration<br />
T3-Membrane Softening<br />
T4-Ion Exchange<br />
0.1 0.5 1 1.5 2 3 4 5 10 15 30<br />
Recycled <strong>Wastewater</strong> Flow/Demand, mgd<br />
Metropolitan Council Environmental Services 51<br />
T4-GAC<br />
T4-UV
Section 3: Recycled <strong>Wastewater</strong> System Components and Costs<br />
<strong>Recycling</strong> <strong>Treated</strong> <strong>Municipal</strong> <strong>Wastewater</strong> <strong>for</strong> <strong>Industrial</strong> <strong>Water</strong> <strong>Use</strong><br />
The cost analysis indicates that there are economically viable applications to provide treated wastewater<br />
effluent as a water supply to industries. The technology is available and as competition increases in the<br />
membrane market, more economical solutions can be anticipated to meet the specific water quality needs<br />
<strong>for</strong> a spectrum of industries in Minnesota. Treatment costs were estimated to range from $0.50/1000<br />
gallons <strong>for</strong> larger supplies (30 mgd) with water quality suitable <strong>for</strong> cooling water to over $7.00/1000<br />
gallons <strong>for</strong> smaller supplies (0.1 mgd) treated to meet stringent industrial water requirements.<br />
Total System Costs<br />
To provide a comparison of total system costs to treatment costs, a 5-mile transmission system was<br />
evaluated as shown in Figure 3.6. The cost to deliver a base supply, inclusive of transmission costs,<br />
disinfection system costs (assumed<br />
as part of the base system) and<br />
administrative/laboratory costs<br />
ranged from $0.40/1000 gallons<br />
<strong>for</strong> 30 mgd to $8.88/1000 gallons<br />
<strong>for</strong> a 0.1 mgd supply. For<br />
membrane softening, the costs<br />
range from $2.20/1000 gallons to<br />
$13.73/1000 gallons. Both<br />
transmission and treatment system<br />
costs on a per gallon basis become<br />
more economical as the system<br />
capacity exceeds 1 mgd.<br />
Figure 3.6. Comparison of Base and Membrane Softening System<br />
Costs <strong>for</strong> 5-Mile Transmission<br />
Cost of Service, $/1000 gallons<br />
8.00<br />
7.00<br />
6.00<br />
5.00<br />
4.00<br />
3.00<br />
2.00<br />
$8.88 - Base<br />
$13.73 - Tertiary 3<br />
Base Tertiary 3 - Membrane Softening<br />
$2/1000 gallons<br />
Typical Potable <strong>Water</strong> Supply Cost<br />
The evaluation of a 1 mgd<br />
1.00<br />
recycled wastewater supply<br />
transmitted 5 miles was estimated<br />
0.00<br />
0.1 0.5 1 1.5 2 3 4 5 10 15 30<br />
to have a cost of service ranging<br />
Recycled <strong>Wastewater</strong> Flow/Demand, mgd<br />
from $1.35/1000 gallons to<br />
$3.75/1000 gallons, depending on the water quality delivered. As summarized in Table 3.9, industrial<br />
water uses that are non-contact and have little concern with higher salts and hard water (base supply) are<br />
very competitive, at $1.35/1000 gallons, with potable water supplies assumed at a typical cost of<br />
$2.00/1000 gallons. For industries that may have similar water quality requirements to the base supply,<br />
but may have human contact with the supply water, the cost is $2.45/1000 gallons. Cooling water and<br />
process water requirements <strong>for</strong> many industries will likely require softened water and removal of<br />
dissolved solids, as provided by Tertiary 3 treatment processes, which is estimated to cost $3.75/1000<br />
gallons. The treatment requirements <strong>for</strong> Tertiary 3 processes place these system costs above typical<br />
potable supply costs, but it is not out of the range of some rural system water utility costs. While system<br />
costs <strong>for</strong> ground water supplies would likely be less than this, <strong>for</strong> areas with water shortages or watershed<br />
discharge limitations, recycled wastewater could be a cost-effective water supply.<br />
Table 3.9. Estimated Costs <strong>for</strong> a 1 mgd Recycled <strong>Wastewater</strong> System*<br />
<strong>Water</strong> Quality Classification Characteristics<br />
System Cost of<br />
Service, $/1000<br />
gallons<br />
Base Non-contact uses<br />
No concern <strong>for</strong> hardness or high dissolved solids 1.35<br />
Tertiary 2 – Membrane Filtration Potential contact uses<br />
No concern <strong>for</strong> hardness or high dissolved solids 2.45<br />
Tertiary 3 – Membrane Softening Potential contact uses<br />
*<br />
Based on a 5-mile transmission system<br />
Require soft water with lower dissolved solids 3.75<br />
52 Metropolitan Council Environmental Services
Cost by Standard Industry Categories<br />
Section 3: Recycled <strong>Wastewater</strong> System Components and Costs<br />
<strong>Recycling</strong> <strong>Treated</strong> <strong>Municipal</strong> <strong>Wastewater</strong> <strong>for</strong> <strong>Industrial</strong> <strong>Water</strong> <strong>Use</strong><br />
The potential costs <strong>for</strong> a recycled wastewater supply are shown in Figure 3.7 and listed in Table 3.10 <strong>for</strong><br />
the general industry categories. Costs listed in Table 3.10 are <strong>for</strong> both the treatment and total system costs<br />
of a 5-mile transmission system, while Figure 3.7 displays only the treatment costs. As expected, the<br />
range of costs is high given the diversity of industries in these general industry categories and the variable<br />
Figure 3.7. Range of Treatment Costs <strong>for</strong> a 1 mgd Supply by Industry Category<br />
<strong>Water</strong> Utility Costs ---------------------------<br />
Power Cooling-Recirculating<br />
Power Cooling-OnceThrough<br />
Other (Miscellaneous)<br />
Non-Metals<br />
Metals<br />
Petroleum/Chemical/Ethanol<br />
<strong>Industrial</strong> Cooling-OnceThrough<br />
Sand & Gravel Washing $0<br />
Mining<br />
Pulp & Paper<br />
Agricultural<br />
0 0.5 1 1.5 2 2.5 3 3.5 4<br />
Recycled <strong>Wastewater</strong> Supply Treatment Cost Range*<br />
($/1000 gallons)<br />
*Costs in addition to recycled wastewater base system costs<br />
water quality of<br />
WWTP effluent.<br />
However, the values<br />
indicate that, <strong>for</strong> a 1<br />
mgd supply<br />
transmitted 5 miles,<br />
the cost of service <strong>for</strong><br />
lower levels of<br />
treatment can<br />
compete with potable<br />
water supplies. Most<br />
industries with a<br />
water demand of 1<br />
mgd or less are more<br />
likely to use a potable<br />
source, depending on<br />
their water quality requirements. For these industries, reclaimed water could provide an alternative to a<br />
potable source, assuming multiple industries are supplied from one WWTP <strong>for</strong> a combined demand of 1<br />
mgd or higher.<br />
Storage Costs<br />
While most WWTPs have a consistent diurnal pattern that varies during the weekdays and weekend,<br />
recycled wastewater demand will vary with the customer or set of customers. For this study, storage costs<br />
were estimated based on the assumption that 50% of the water volume produced per day could be stored.<br />
Additional storage that may be required by individual customers and located at the customer’s sites was<br />
not considered in this analysis.<br />
Storage was assumed to be provided in an underground concrete tank, <strong>for</strong> which the unit cost of<br />
construction is estimated to be $1.70/gallon of the storage. The capital cost of storage was estimated to be<br />
$850,000 per mgd of the annual average recycled wastewater demand. When included in the cost of<br />
service, storage is estimated to add approximately 20 cents to the total system cost to produce 1000<br />
gallons. Storage costs equate to about 13% of the cost of service <strong>for</strong> a 1 mgd supply with a 5-mile<br />
transmission system. For a 1 mgd recycled wastewater system supplying a “base” quality water, storage<br />
was estimated to increase costs from $1.35/1000 gallons to $1.55/1000 gallons.<br />
Metropolitan Council Environmental Services 53
Section 3: Recycled <strong>Wastewater</strong> System Components and Costs<br />
<strong>Recycling</strong> <strong>Treated</strong> <strong>Municipal</strong> <strong>Wastewater</strong> <strong>for</strong> <strong>Industrial</strong> <strong>Water</strong> <strong>Use</strong><br />
Table 3.10. Costs to Supply Recycled <strong>Wastewater</strong> to Minnesota Industries<br />
Industry Category Type of <strong>Water</strong> <strong>Use</strong><br />
Cost of Service, $1000 gallons 1<br />
of Recycled <strong>Wastewater</strong> Quality Classification 2<br />
Base Tertiary-1 Tertiary-2 Tertiary-3 Tertiary-4<br />
Advanced<br />
Secondary<br />
Conven-<br />
tional<br />
Membrane<br />
Filtration<br />
Membrane<br />
Softening<br />
Advanced<br />
Processes<br />
Range of Costs,<br />
$/1000 gallons<br />
Treatment<br />
Above<br />
Base<br />
System<br />
Total<br />
System<br />
Agricultural Cooling, Boiler Feed – $1.70/$3.05 – $2.40/$3.75 $3.70/$5.00 $1.70-$3.70 $2.40-$5.00<br />
Pulp & Paper Process, Boiler Feed – $1.70/$3.05 $1.10/$2.45 $2.40/$3.75 $3.70/$5.00 $1.70-$3.70 $2.40-$5.00<br />
Mining Process, Boiler Feed $0/$1.35 $1.70/$3.05 – $2.40/$3.75 $3.70/$5.00 $0-$3.70 $1.35-$5.00<br />
Sand & Gravel Washing Process $0/$1.35 – – – – $0 $1.35<br />
<strong>Industrial</strong> Cooling-Once-<br />
Through Cooling <strong>Water</strong><br />
Cooling, Process, Boiler<br />
$0/$1.35 $1.70/$3.05 – $2.40/$3.75 – $0-$2.40 $1.35-$3.75<br />
Petroleum, Chemical & Ethanol Feed<br />
Process, Cooling, Boiler<br />
– $1.70/$3.05 – $2.40/$3.75 $3.70/$5.00 $1.70-$3.70 $2.40-$5.00<br />
Metals<br />
Feed – $1.70/$3.05 – $2.40/$3.75 $3.70/$5.00 $1.70-$3.70 $2.40-$5.00<br />
Non-Metals Process $0/$1.35 $1.70/$3.05 $1.10/$2.45 $2.40/$3.75 $3.70/$5.00 $0-$3.70 $1.35-$5.00<br />
Other (Miscellaneous)<br />
Power Cooling-Once-<br />
Process $0/$1.35 $1.70/$3.05 $1.10/$2.45 $2.40/$3.75 $3.70/$5.00 $0-$3.70 $1.35-$5.00<br />
Through/Other Cooling, Boiler Feed $0/$1.35 $1.70/$3.05 $1.10/$2.45 $2.40/$3.75 $3.70/$5.00 $0-$3.70 $1.35-$5.00<br />
Power Cooling-Recirculating Cooling, Boiler Feed – $1.70/$3.05 $1.10/$2.45 $2.40/$3.75 $3.70/$5.00 $1.70-$3.70 $2.40-$5.00<br />
1<br />
Represent the costs to provide 1 mgd of recycled wastewater a distance of 5 miles. First value is the treatment cost and the second value is the total system cost in $/1000 gallons.<br />
(e.g. For Metals industries: the treatment costs are estimated to range from $1.70-$3.70/1000 gallons and the total system costs are estimated to range from $3.05-$5.00/1000<br />
gallons).<br />
2<br />
Refer to Table 3.6 <strong>for</strong> relationship of recycled wastewater classification to industry categories.<br />
54 Metropolitan Council Environmental Services
Costs and Planning Considerations<br />
Section 3: Recycled <strong>Wastewater</strong> System Components and Costs<br />
<strong>Recycling</strong> <strong>Treated</strong> <strong>Municipal</strong> <strong>Wastewater</strong> <strong>for</strong> <strong>Industrial</strong> <strong>Water</strong> <strong>Use</strong><br />
The generalized costs <strong>for</strong> recycled wastewater systems developed in this study confines costs to discreet<br />
projects <strong>for</strong> a set of basic assumptions. As municipalities and industries evaluate recycling opportunities,<br />
an integrated approach to handling water infrastructure needs <strong>for</strong> the community can be used to evaluate<br />
the impacts on other system costs. Some considerations are provided below.<br />
An accurate comparison of costs <strong>for</strong> the higher quality water must include the industry’s onsite treatment<br />
cost and cannot be compared solely to the incoming water supply cost. Most industries requiring Tertiary<br />
4 reclaimed water have their own onsite treatment systems to provide this water quality. In many cases,<br />
the industry provides this additional treatment to potable supplies. Some industries also have treatment<br />
processes to provide water of similar quality to Tertiary 1-3 recycled wastewater. With water<br />
conservation practices promoting cooling systems with higher levels of recirculation there will be the<br />
need to use a higher quality of incoming water so that the concentrations of the recycle do not cause<br />
corrosion or scaling problems.<br />
Specific facility planning activities should evaluate the relationship of recycled wastewater system with<br />
potable water system infrastructure. For some communities, recycled wastewater systems provide an<br />
alternative to potable water supply system capital expenditures. Increased domestic demand can be met<br />
without expansion of the potable water distribution system if a portion of the industrial sector uses<br />
recycled wastewater and the total demand <strong>for</strong> the potable water system is kept constant. A complete<br />
analysis of a recycled wastewater system needs to integrate the entire water resources planning of<br />
communities and regions.<br />
This cost analysis was based on treating WWTP effluent from an advanced secondary treatment process.<br />
<strong>Wastewater</strong> recycling practices can also be integrated into the design and construction of new WWTPs. It<br />
may be more cost-effective to implement appropriate treatment technologies into the main WWTP<br />
process train and construct new pipelines and facilities, rather than retrofit existing ones. Also, with new<br />
WWTP construction, a recycled wastewater pipeline can be integrated into the potable and collection<br />
system infrastructure, resulting in total system cost reductions. New WWTP site selection can also<br />
include comprehensive planning to integrate industrial parks in close proximity to wastewater facilities.<br />
3.6 Summary<br />
The economic viability of wastewater recycling in Minnesota will depend on the specific match of<br />
WWTP effluent quality to an industry’s water quality requirements, the system capacity, transmission<br />
distance, and the availability of traditional water supplies in the area. The major conclusions from this<br />
study’s assessment of recycled wastewater quality and system costs include the following:<br />
Recycled wastewater can be competitive with traditional water supplies in some cases.<br />
Removal of hardness and high salt levels significantly adds to the cost.<br />
Cost efficiency improves as recycled wastewater usage increases and favors systems delivering more<br />
than 1 mgd.<br />
Emerging contaminants of concern will likely be a future issue <strong>for</strong> wastewater recycling applications<br />
as it will <strong>for</strong> all water supplies.<br />
Historic records of important constituents of concern <strong>for</strong> industrial water uses are not usually available<br />
<strong>for</strong> WWTP effluent and are needed to fully evaluate alternative water supplies.<br />
This study provided a high-level assessment that estimated a range of costs <strong>for</strong> low to high quality<br />
water supplies. WWTP-specific water quality and specific industrial treatment requirements must be<br />
thoroughly assessed in the evaluation of recycled wastewater system costs.<br />
Metropolitan Council Environmental Services 55
Section 3: Recycled <strong>Wastewater</strong> System Components and Costs<br />
<strong>Recycling</strong> <strong>Treated</strong> <strong>Municipal</strong> <strong>Wastewater</strong> <strong>for</strong> <strong>Industrial</strong> <strong>Water</strong> <strong>Use</strong><br />
3.7 References<br />
Cali<strong>for</strong>nia State <strong>Water</strong> Resources Control Board. 1980. Evaluation of <strong>Industrial</strong> Cooling Systems Using<br />
Reclaimed <strong>Municipal</strong> <strong>Wastewater</strong>. Cali<strong>for</strong>nia State <strong>Water</strong> Resources Control Board, Office of <strong>Water</strong><br />
<strong>Recycling</strong>, Sacramento, Cali<strong>for</strong>nia.<br />
Goldstein, D.J., I. Wei, and R.E. Hicks. 1979. “Reuse of <strong>Municipal</strong> <strong>Wastewater</strong> as Make-Up to Circulating<br />
Cooling Systems”. In: Proceedings of the <strong>Water</strong> Reuse Symposium, Vol. 1. pp. 371-397, March 25-30,<br />
1979, Washington, D.C. Published by the AWWA Research Foundation, Denver, Colorado.<br />
Metcalf & Eddy, Inc. 2007. <strong>Water</strong> Reuse: Issues, Technologies, and Applications. McGraw Hill, New<br />
York.<br />
Minnesota Pollution Control Agency (MPCA). 2005. Minnesota Discharge Monitoring Report data<br />
obtained through the Environmental Data Access system. Refer to:<br />
http://www.pca.state.mn.us/data/eda<strong>Water</strong>/index.cfm.<br />
Puckorius, P.R. and R.T. Hess. 1991. “<strong>Wastewater</strong> Reuse <strong>for</strong> <strong>Industrial</strong> Cooling <strong>Water</strong> Systems”. Ind.<br />
<strong>Water</strong> Treatment, 23(5):43-48.<br />
State of Cali<strong>for</strong>nia. 2000. <strong>Water</strong> <strong>Recycling</strong> Criteria. Title 22, Division 4, Chapter 3, Cali<strong>for</strong>nia Code of<br />
Regulations. Cali<strong>for</strong>nia Department of Health Services, Drinking <strong>Water</strong> Program, Sacramento, Cali<strong>for</strong>nia.<br />
Tchobanoglous, G., F.L Burton, and H.D. Stensel. 2003. <strong>Wastewater</strong> Engineering: Treatment and Reuse,<br />
4 th ed. McGraw-Hill, New York.<br />
<strong>Water</strong> Pollution Control Federation. 1989. <strong>Water</strong> Reuse (Second Edition). Manual of Practice SM-3.<br />
<strong>Water</strong> Pollution Control Federation, Alexandria, Virginia.<br />
56 Metropolitan Council Environmental Services
Section 4: Implementation Considerations<br />
Section 4: Implementation Considerations<br />
<strong>Recycling</strong> <strong>Treated</strong> <strong>Municipal</strong> <strong>Wastewater</strong> <strong>for</strong> <strong>Industrial</strong> <strong>Water</strong> <strong>Use</strong><br />
Minnesota’s industrial water demand can be supplied in many areas by recycled municipal wastewater.<br />
Treatment technologies are available to meet the highest levels of water quality required by industries and<br />
protect public health. In some cases, recycled wastewater is a cost-competitive supply to traditional water<br />
sources. A remaining area to consider is what issues need to be addressed to implement recycled<br />
wastewater projects in Minnesota.<br />
4.1 Overview<br />
In addition to technical issues, there are regulatory, legal, and institutional issues such as funding and<br />
fees, agency jurisdictions, ordinances, and public involvement that must be addressed to successfully<br />
implement wastewater recycling programs. Implementation issues associated with the development of<br />
wastewater recycling programs in other states and specific research on the topic has provided a base of<br />
knowledge <strong>for</strong> Minnesota to draw upon. However, because each state has its own regulatory program <strong>for</strong><br />
recycled wastewater, as well as other environmental permitting practices and government structures, a<br />
complete list of issues will contain some that are state-specific. To begin to address the many facets of<br />
implementing wastewater recycled projects in Minnesota, a series of stakeholder meetings were held.<br />
4.2 Stakeholder Input<br />
Stakeholder Representation<br />
Three stakeholder <strong>for</strong>ums were held:<br />
Regulatory<br />
<strong>Industrial</strong><br />
Broader-Base<br />
Two regulatory meetings held early in the project included representatives of the MPCA, MDNR, MDH,<br />
Dakota County, and Met Council staff from water supply and wastewater services. These meetings were<br />
used to gain input on the state agency setting <strong>for</strong> wastewater recycling, how these practices are handled<br />
now, and any plans <strong>for</strong> the future.<br />
Two meetings were held with industrial representatives. A total of 11 industries participated in the<br />
workshops with 15 representatives attending. A range of industry sectors and business sizes were<br />
represented. Table 4.1 lists the industries attending the two workshops.<br />
Table 4.1. Industry Workshop Attendees<br />
March 8, 2007 March 15, 2007<br />
Great River Energy ADC Telecommunications Inc<br />
Kraemer Mining & Materials, Inc CertainTeed Corporation<br />
Marathon Ashland Petroleum LLC Fagen Engineering LLC<br />
Rock-Tenn Company Flint Hills Resources LP<br />
Twin City Tanning Co/SB Foot Tanning Co Gopher Resources Corporation<br />
Xcel Energy<br />
The main question addressed was: What issues/concerns does your industry have with using a recycled<br />
wastewater supply? Followup discussions focused on project elements <strong>for</strong> demonstration projects and any<br />
issues the industry might have if looking to site a new facility. The discussion of issues was segmented<br />
into technical issues and institutional issues. In some cases, issues overlapped these general categories.<br />
Metropolitan Council Environmental Services 57
Section 4: Implementation Considerations<br />
<strong>Recycling</strong> <strong>Treated</strong> <strong>Municipal</strong> <strong>Wastewater</strong> <strong>for</strong> <strong>Industrial</strong> <strong>Water</strong> <strong>Use</strong><br />
The third <strong>for</strong>um brought together a full spectrum of stakeholders:<br />
the same regulatory agencies, two industries from the previous<br />
meetings (CertainTeed Corporation and Marathon Petroleum), a<br />
cross-sector group (Minnesota Environmental Initiative), wastewater<br />
utilities (Mankato and Met Council), and water utilities (represented<br />
by the <strong>Water</strong> Utility Council of Minnesota). This group reviewed the<br />
outcomes of the previous stakeholder meetings and discussed next<br />
steps to promote wastewater recycling on a broader scale in<br />
Minnesota.<br />
Outcomes<br />
The implementation issues identified in the stakeholder meetings<br />
generally fit into one of the four focus areas listed in Figure 4.1.<br />
Key points <strong>for</strong> each focus area are presented below.<br />
Environmental Need & Stewardship<br />
Minnesota’s commitment to<br />
natural resources protection<br />
can serve as a catalyst <strong>for</strong><br />
recycling treated municipal<br />
wastewater practices.<br />
Regulations<br />
The regulatory<br />
requirements and<br />
permitting process should<br />
encourage industries and<br />
municipalities to pursue<br />
recycling treated municipal<br />
wastewater.<br />
Figure 4.1. Implementation<br />
Issue Focus Areas<br />
Environmental<br />
Stewartship<br />
Incentives<br />
& Risk<br />
Regulations<br />
Data<br />
Collection<br />
& Research<br />
Need<br />
<strong>Water</strong> supply shortages and watershed water quality issues occur in Minnesota<br />
and have been the driver <strong>for</strong> recycling treated municipal wastewater applications<br />
in areas where thresholds were reached with few options. The state needs to be<br />
prepared <strong>for</strong> an increase in water issues that can be solved with recycling<br />
treated municipal wastewater applications.<br />
A vision <strong>for</strong> wastewater and water supply systems in Minnesota beyond the<br />
typical 20-year planning cycle is needed – looking to Minnesota’s long-term<br />
economic vitality and quality of life.<br />
Stewardship<br />
<strong>Water</strong> conservation awareness in Minnesota is increasing and many industries<br />
are adopting water protection measures. Industries recognize that recycling<br />
treated municipal wastewater can be of benefit to their business and the<br />
community. <strong>Recycling</strong> treated municipal wastewater practices can build on this<br />
awareness.<br />
A positive image <strong>for</strong> recycling treated municipal wastewater needs to be<br />
established: it protects Minnesota’s water resources and it is a safe supply.<br />
Customers and suppliers will be less likely to engage in recycling treated<br />
municipal wastewater projects if there will be resistance from the community.<br />
<strong>Wastewater</strong> recycling needs to move from an unknown to a positive image.<br />
Current regulations: MN handles recycling treated municipal wastewater<br />
applications on a case-by-case basis using the Cali<strong>for</strong>nia <strong>Water</strong> <strong>Recycling</strong><br />
Criteria. This approach matches the demand.<br />
<strong>Municipal</strong>ities and industries identified several permit-related issues that without<br />
resolution early in the planning process would deter them from recycling treated<br />
municipal wastewater.<br />
Existing regulatory requirements <strong>for</strong> wastewater facility planning to include<br />
wastewater recycling alternatives needs to be en<strong>for</strong>ced and linked to water<br />
supply studies.<br />
There currently is not a demand <strong>for</strong> recycled wastewater that requires investment<br />
in water regulation development. However, without resolution of some issues, it<br />
may inhibit the planning <strong>for</strong> recycling treated municipal wastewater practices that<br />
should be occurring <strong>for</strong> long-term sustainability of Minnesota’s water resources.<br />
58 Metropolitan Council Environmental Services
Economic Incentives and Risk Assessment<br />
Economic incentives<br />
and assessment/<br />
resolution of risks will<br />
attract industries to use<br />
recycled wastewater<br />
and municipalities to<br />
incorporate recycling in<br />
their WWTP practices.<br />
Data Collection and Research<br />
In<strong>for</strong>mation on-hand<br />
related to treatment<br />
requirements <strong>for</strong><br />
recycled wastewater<br />
would expedite the<br />
planning process <strong>for</strong><br />
recycling treated<br />
municipal wastewater<br />
projects.<br />
“Demonstration” Projects<br />
Section 4: Implementation Considerations<br />
<strong>Recycling</strong> <strong>Treated</strong> <strong>Municipal</strong> <strong>Wastewater</strong> <strong>for</strong> <strong>Industrial</strong> <strong>Water</strong> <strong>Use</strong><br />
Establishing partnerships to foster recycling of treated municipal wastewater will<br />
provide examples to evaluate reuse practices in Minnesota and the in<strong>for</strong>mation to<br />
develop potential, future regulatory infrastructure, address concerns with risk and<br />
legal language <strong>for</strong> user agreements, and other institutional elements. There are<br />
unresolved industrial concerns with risk and liability.<br />
To gain acceptance and to recognize the benefits of recycling treated municipal<br />
wastewater, particularly when economics are perceived to be in favor of current<br />
practices, economic incentives will attract suppliers and customers – and can<br />
jumpstart a broader recycling wastewater practice in Minnesota.<br />
The cost of water currently does not factor in the benefits of conservation and<br />
recycled wastewater competes against a low cost supply in many areas.<br />
In<strong>for</strong>mation related to the treatment and distribution of recycled wastewater <strong>for</strong><br />
Minnesota-specific applications is lacking, specifically <strong>for</strong> cold weather and hard,<br />
high salt concentration waters.<br />
Site-specific water quality and customer-specific uses require water sampling and<br />
analysis. Many of the parameters of interest in planning treatment of a water supply<br />
are not analyzed by WWTPs discharging to receiving streams. If water quality data<br />
were readily available, wastewater recycling may be evaluated more in the planning<br />
stages <strong>for</strong> new or expansions/improvements or existing industries and WWTPs.<br />
One of the questions addressed at the industrial and broad-base stakeholder meetings was what type of<br />
demonstration projects would address the issues and concerns that were identified. The overall goal of the<br />
project(s) would be to provide industries and municipalities in<strong>for</strong>mation to better assess the costs and<br />
implementation hurdles – resulting in better in<strong>for</strong>med suppliers and users of recycled wastewater with an<br />
understanding of the issues be<strong>for</strong>e they take on a project. Project results are also a useful part of a public<br />
in<strong>for</strong>mation program, showing that the recycling practice is meeting all the regulations and health indices.<br />
Project elements and features considered important include:<br />
Project with Established Partners. Identify regulatory, industry, municipal wastewater utility, water<br />
utility, and other partners to <strong>for</strong>m a working group that is involved with the project(s). This group would<br />
walk “hand-in-hand” through the project and provide review and assessment of the project upon<br />
completion.<br />
Complete Project Process. Project partners would be involved in the complete project process: the initial<br />
conceptual plan, facility plan, design, and construction.<br />
Regulatory Process. As part of the complete project process, the regulatory steps <strong>for</strong> wastewater<br />
recycling can be explored and documented. A separate subgroup could be <strong>for</strong>med to evaluate specific<br />
regulatory elements and development of guides or fact sheets <strong>for</strong> permittees.<br />
Public In<strong>for</strong>mation. A public in<strong>for</strong>mation program integrated at the initial project stages is critical to the<br />
success of a wastewater recycling project. This includes educating the personnel at the facility, the local<br />
community, and those along the transmission route. This could be part of a complete project process, a<br />
special project with more of a focus on public education methods, or a state-wide campaign to enhance<br />
the ‘image’ <strong>for</strong> wastewater recycling in Minnesota.<br />
Specific Technologies. Some projects can have a more technical focus to improve cost in<strong>for</strong>mation and a<br />
better understanding of the operation and maintenance issues <strong>for</strong> certain wastewater recycling practices.<br />
Metropolitan Council Environmental Services 59
Section 4: Implementation Considerations<br />
<strong>Recycling</strong> <strong>Treated</strong> <strong>Municipal</strong> <strong>Wastewater</strong> <strong>for</strong> <strong>Industrial</strong> <strong>Water</strong> <strong>Use</strong><br />
The demonstration projects could also be per<strong>for</strong>med by one entity or other approaches, rather than a<br />
partnered group. For example, a municipality may unilaterally make treated wastewater available at a<br />
quality useable by various industries. In the case of specific treatment technology evaluations, a fullpartnered<br />
process may not be required.<br />
4.3 Summary<br />
Stakeholders were encouraged by the interest expressed in the topic of wastewater recycling. The general<br />
outlook carried from the workshops is that the institutional issues are addressable and need to be solved or<br />
in the evaluation process be<strong>for</strong>e significant consideration is given to a recycled wastewater project. While<br />
there are certainly some technical issues that must be resolved and better understood, the meeting<br />
participants were confident that technical solutions could be found. It would be a matter of cost and<br />
related benefits that would dictate the feasibility - if the institutional issues are first addressed.<br />
60 Metropolitan Council Environmental Services
Section 5: Summary and Potential Next Steps<br />
<strong>Recycling</strong> <strong>Treated</strong> <strong>Municipal</strong> <strong>Wastewater</strong> <strong>for</strong> <strong>Industrial</strong> <strong>Water</strong> <strong>Use</strong><br />
Section 5: Summary and Potential Next Steps<br />
5.1 Summary<br />
This study directed its inquiry into four project areas to address the project objectives.<br />
Project Objectives<br />
Determine the feasibility of recycling treated municipal wastewater <strong>for</strong> industrial water use in Minnesota.<br />
Identify implementation issues associated with recycling municipal wastewater <strong>for</strong> industrial water use in<br />
Minnesota.<br />
Demand and Supply Analysis<br />
There is adequate treated wastewater supply to meet industrial water demand in some regions of the<br />
state. The Twin Cities metro area has more supply than demand and some larger industries in smaller<br />
communities cannot fulfill their demand with<br />
Project Areas<br />
the available treated wastewater supply.<br />
The largest industrial water users are power<br />
plants with once-through cooling systems.<br />
River water provides over 2,000 mgd of<br />
water <strong>for</strong> once-through cooling, while ground<br />
water provides 4 mgd <strong>for</strong> power generation<br />
uses and 6 mgd <strong>for</strong> other industrial facility<br />
once-through cooling water systems.<br />
Replacing river water with recycled<br />
wastewater does little to preserve water<br />
supplies because the once-through cooling<br />
process consumes little water and over 98%<br />
Demand & Supply Analysis<br />
Compare industrial water demands with the available<br />
treated municipal wastewater supply.<br />
<strong>Water</strong> Quality & Treatment Requirements<br />
Compare industry water quality requirements to treated<br />
municipal wastewater quality and identify treatment<br />
processes <strong>for</strong> recycled wastewater use by industry.<br />
Costs<br />
Estimate treatment and transmission costs.<br />
Implementation Issues<br />
Identify implementation issues.<br />
is returned back to the river. There is also no added benefit to the receiving stream from reduced<br />
pollutant loadings, because the recycled wastewater is discharged back to the watershed. In addition,<br />
these facilities typically require more water than can be supplied by WWTPs.<br />
Statewide in 2004/2005, municipal WWTPs produced 425 mgd on average, and the non-power<br />
industrial water demand, excluding power plant surface water demand, was an estimated 445 mgd.<br />
<strong>Industrial</strong> demand <strong>for</strong> ground water was 60 mgd.<br />
The largest industry use of ground water is <strong>for</strong> the industry sectors of food, petroleum, chemical, and<br />
ethanol processing, along with once-through cooling systems <strong>for</strong> a range of industries. These<br />
industry/use categories use over 40 mgd of water and it is estimated that at least half of this total, or 20<br />
mgd, is <strong>for</strong> cooling water use.<br />
<strong>Water</strong> Quality & Treatment Requirements<br />
<strong>Wastewater</strong> recycling treatment technologies are available to protect public health and meet all<br />
industry water quality requirements.<br />
<strong>Industrial</strong> water quality requirements can be met by adding new treatment processes or upgrading<br />
existing ones at municipal WWTPs.<br />
The constituents of concern with the broadest implications <strong>for</strong> Minnesota industrial water uses are<br />
hardness and dissolved salts. Minnesota waters tend to be hard and high in dissolved salts and<br />
concentrations increase in the wastewater through domestic, commercial and industrial practices.<br />
Advanced secondary wastewater treatment processes do not remove hardness and dissolved salts;<br />
tertiary treatment processes will be required if these constituents are to be removed.<br />
The data routinely monitored by WWTPs do not provide all the water quality data <strong>for</strong> a complete<br />
assessment of WWTP effluent as an industrial water supply without new monitoring being per<strong>for</strong>med.<br />
Metropolitan Council Environmental Services 61
Section 5: Summary and Potential Next Steps<br />
<strong>Recycling</strong> <strong>Treated</strong> <strong>Municipal</strong> <strong>Wastewater</strong> <strong>for</strong> <strong>Industrial</strong> <strong>Water</strong> <strong>Use</strong><br />
The continued advances in wastewater and water treatment technology, including reductions in cost,<br />
will benefit the wastewater recycling market.<br />
Costs and System Features<br />
<strong>Wastewater</strong> recycling is competitive with traditional water supplies in some situations.<br />
Removal of hardness and high salt levels significantly adds to the cost of a recycled wastewater<br />
system.<br />
Cost efficiency improves as wastewater usages increases, favoring systems delivering more than 1<br />
mgd.<br />
The two recycling configurations likely to emerge within the framework of existing WWTPs and<br />
industries in Minnesota are <strong>for</strong> either one large industrial demand to be met with a dedicated pipeline<br />
or <strong>for</strong> a cluster of industries to be served from a transmission main. In both configurations, a program<br />
of mixed use that also provides <strong>for</strong> other uses such as irrigation along the transmission main would<br />
provide additional benefits and cost sharing.<br />
As water resources become limited because of drought or aquifer depletion with excessive<br />
withdrawals, or because supplies become contaminated, the cost difference with traditional supplies<br />
will narrow.<br />
Implementation Issues<br />
Stakeholder workshops successfully defined key issues <strong>for</strong> Minnesota to consider as the state looks to<br />
wastewater recycling as part of its water conservation program. The stakeholders deemed the issues<br />
addressable.<br />
Environmental Stewardship<br />
— <strong>Wastewater</strong> recycling is seen as the “right thing to do” and industries are responsive to learning<br />
more and considering this new water supply.<br />
— The wastewater recycling public image needs to move from unknown to positive. Industries are<br />
hesitant to embark in recycling without the public’s perception that this is a positive action.<br />
Regulations<br />
— The case-by-case regulatory approach matches the current permit demand and it is difficult to<br />
justify investment at this time in a new approach to regulating this practice.<br />
— However, the case-by-case approach may deter some recycling projects because there are too<br />
many uncertainties. There are also many unknowns related to the TMDL process or how<br />
recycling will affect NPDES permitted constituents and conditions.<br />
Incentives & Risk<br />
— Without economic incentives it will be difficult <strong>for</strong> recycled wastewater to compete with the cost<br />
of the traditional water sources until it is a proven water supply in Minnesota.<br />
— There are unresolved industry concerns with risk and liability that need to be addressed be<strong>for</strong>e<br />
many industries will consider a recycled wastewater supply.<br />
Data Collection & Research<br />
— Additional municipal WWTP effluent data with specific constituents of concern to industries are<br />
needed to more completely assess wastewater recycling <strong>for</strong> specific applications and accurately<br />
compare system costs to traditional supplies.<br />
— Colder weather and site-specific water quality concerns need to be explored by testing treatment<br />
technologies. This will also assist in a better assessment of treatment costs.<br />
62 Metropolitan Council Environmental Services
Long-Term Vision<br />
Section 5: Summary and Potential Next Steps<br />
<strong>Recycling</strong> <strong>Treated</strong> <strong>Municipal</strong> <strong>Wastewater</strong> <strong>for</strong> <strong>Industrial</strong> <strong>Water</strong> <strong>Use</strong><br />
The Land of 10,000 Lakes is experiencing regional and localized water supply limitations that will drive<br />
the search <strong>for</strong> alternative supplies. As water demand continues to grow, recycled wastewater can be an<br />
emerging water supply to counter those limitations in Minnesota. Growth in the development of the<br />
ethanol industry is a prime example of the limitations new industries might face and the benefits of<br />
promoting wastewater recycling as an<br />
alternative water supply.<br />
While the state does have experience<br />
with wastewater recycling, it is still an<br />
unknown concept to most<br />
Minnesotans. The implementation<br />
issues identified in this study indicate<br />
the range of items to address as<br />
wastewater recycling becomes more<br />
common in Minnesota. A review of<br />
wastewater recycling program<br />
development in other states identified<br />
three phases to consider in planning a<br />
program, as shown in Figure 5.1.<br />
Minnesota will start in the Near-Term<br />
phase if it is to pursue and promote<br />
development of wastewater recycling throughout the state.<br />
5.2 Potential Next Steps<br />
Figure 5.1. Steps in Implementation of Broad-Scale <strong>Wastewater</strong><br />
<strong>Recycling</strong> Programs<br />
Conduct activities and<br />
document outcomes to<br />
prepare <strong>for</strong> wastewater<br />
recycling on a broader<br />
scale.<br />
Establish a strategy to<br />
promote wastewater<br />
recycling and an<br />
integrated plan <strong>for</strong> longterm<br />
water resources<br />
protection.<br />
Near-Term<br />
<strong>Wastewater</strong><br />
recycling is an<br />
integral part of<br />
community and<br />
state water resource<br />
planning.<br />
State-specific<br />
regulations and<br />
construction<br />
standards are<br />
implemented.<br />
Mid-Term<br />
<strong>Wastewater</strong><br />
recycling is a<br />
familiar<br />
concept<br />
and an<br />
established<br />
practice.<br />
Long-Term<br />
Potential next steps to carry on the development of wastewater recycling in Minnesota include engaging<br />
in demonstration projects to address the various issues that were brought <strong>for</strong>th by stakeholders. These<br />
projects can take a variety of <strong>for</strong>ms, but the one that was considered to be of the most value to industries<br />
is a project with an established group that walks “hand-in-hand” through the planning, design, and<br />
construction phases of a project. This would include all regulatory agencies, community groups, water<br />
utilities, and the wastewater utility and industry involved in the project. The purpose is to identify and<br />
resolve implementation issues associated with successfully launching recycled wastewater projects whose<br />
underlying goal is the protection of Minnesota’s water resources.<br />
Metropolitan Council Environmental Services 63
Section<br />
5: Summary and Potential Next Steps<br />
<strong>Recycling</strong><br />
<strong>Treated</strong> <strong>Municipal</strong> <strong>Wastewater</strong> <strong>for</strong> <strong>Industrial</strong> <strong>Water</strong> <strong>Use</strong><br />
64 Metropolitan Council Environmental Services
Exhibit A: Cali<strong>for</strong>nia <strong>Water</strong> <strong>Recycling</strong> Criteria<br />
<strong>Recycling</strong> <strong>Treated</strong> <strong>Municipal</strong> <strong>Wastewater</strong> <strong>for</strong> <strong>Industrial</strong> <strong>Water</strong> <strong>Use</strong><br />
Exhibit A: Cali<strong>for</strong>nia <strong>Water</strong> <strong>Recycling</strong> Criteria<br />
Type of <strong>Use</strong><br />
Irrigation of fodder, fiber, and seed crops, orchards b and<br />
vineyards b , processed food crops c , nonfood-bearing<br />
trees, ornamental nursery stock d , and sod farms d ;<br />
flushing sanitary sewers<br />
Irrigation of pasture <strong>for</strong> milking animals, landscape<br />
areas e , ornamental nursery stock and sod farms where<br />
public access is not restricted; landscape impoundments;<br />
industrial or commercial cooling water where no mist is<br />
created; nonstructural fire fighting; industrial boiler feed;<br />
soil compaction; dust control; cleaning roads, sidewalks,<br />
and outdoor areas<br />
Irrigation of food crops b ; restricted recreational<br />
impoundments; fish hatcheries<br />
Irrigation of food crops f and open access landscape<br />
areas g ; toilet and urinal flushing; industrial process water;<br />
decorative fountains; commercial laundries and car<br />
washes; snow-making; structural fire fighting; industrial<br />
or commercial cooling where mist is created<br />
Total Coli<strong>for</strong>m<br />
Limits a<br />
Treatment<br />
Required<br />
None required Oxidation<br />
≤23/100 ml a<br />
≤240/100 ml in more than<br />
one sample in any 30-day<br />
Nonrestricted recreational impoundments ≤2.2/100 ml a<br />
≤2.2/100 ml a<br />
≤23/100 ml in more than one<br />
sample in any 30-day period<br />
≤2.2/100 ml a<br />
≤23/100 ml in more than one<br />
sample in any 30-day period<br />
240/100 ml (maximum)<br />
≤23/100 ml in more than one<br />
sample in any 30-day period<br />
240/100 ml (maximum)<br />
Oxidation<br />
Disinfection<br />
Oxidation<br />
Disinfection<br />
Oxidation<br />
Coagulation h<br />
Filtration i<br />
Disinfection<br />
Oxidation<br />
Coagulation<br />
Clarification j<br />
Filtration i<br />
Disinfection<br />
Groundwater recharge by spreading Case-by-case evaluation Case-by-case<br />
evaluation<br />
a<br />
Based on running 7-day median; daily sampling is required.<br />
b<br />
No contact between reclaimed water and edible portion of crop.<br />
c<br />
Food crops that undergo commercial pathogen-destroying prior to human consumption.<br />
d<br />
No irrigation <strong>for</strong> at least 14 days prior to harvesting, sale, or allowing public access.<br />
e<br />
Cemeteries, freeway landscaping, restricted access golf courses, and other controlled access areas.<br />
f<br />
Contact between reclaimed water and edible portion of crop; includes edible root crops.<br />
g<br />
Parks, playgrounds, schoolyards, residential landscaping, unrestricted access golf courses, and other uncontrolled access<br />
irrigation areas.<br />
h<br />
Not required if the turbidity of influent to the filters is continuously measured, does not exceed 5 NTU <strong>for</strong> more than 15 minutes<br />
and never exceeds 10 NTU, and there is capability to automatically activate chemical addition or divert wastewater if the filter<br />
influent turbidity exceeds 5 NTU <strong>for</strong> more than 15 minutes.<br />
i<br />
The turbidity after filtration through filter media cannot exceed an average of 2 nephelometric turbidity units (NTU) within any<br />
24-hour period, 5 NTU more than 5 percent of the time within a 24-hour period, and 10 NTU at any time. The turbidity after<br />
filtration through a membrane process cannot exceed 0.2 NTU more than 5 percent of the time within any 24-hour period and<br />
0.5 NTU at any time.<br />
j<br />
Not required if reclaimed water is monitored <strong>for</strong> enteric viruses, Giardia, and Cryptosporidium.<br />
Source: Adapted from State of Cali<strong>for</strong>nia. 2000. <strong>Water</strong> <strong>Recycling</strong> Criteria. Title 22, Division 4, Chapter 3, Cali<strong>for</strong>nia Code of<br />
Regulations. Cali<strong>for</strong>nia Department of Health Services, Drinking <strong>Water</strong> Program, Sacramento, Cali<strong>for</strong>nia.<br />
Metropolitan Council Environmental Services 65
Metropolitan Council<br />
<strong>Recycling</strong> <strong>Treated</strong> <strong>Municipal</strong><br />
<strong>Wastewater</strong> <strong>for</strong> <strong>Industrial</strong> <strong>Water</strong> <strong>Use</strong><br />
LCMR05-07d<br />
MCES Project Number 070186<br />
VOLUME II<br />
Craddock Consulting Engineers<br />
In Association with<br />
CDM and James Crook
Metropolitan Council<br />
<strong>Recycling</strong> <strong>Treated</strong> <strong>Wastewater</strong> <strong>for</strong><br />
<strong>Industrial</strong> <strong>Water</strong> <strong>Use</strong> Project<br />
LCMR05-07d<br />
MCES Project Number 070186<br />
TECHNICAL MEMORANDUM 1<br />
<strong>Recycling</strong> <strong>Treated</strong> <strong>Wastewater</strong> <strong>for</strong><br />
<strong>Industrial</strong> <strong>Water</strong> <strong>Use</strong> in Minnesota:<br />
Implementation Issues and<br />
Customer Inventory<br />
June 29, 2006<br />
Craddock Consulting Engineers<br />
In Association with<br />
CDM and James Crook
TECHNICAL MEMORANDUM 1<br />
<strong>Recycling</strong> <strong>Treated</strong> <strong>Wastewater</strong> <strong>for</strong><br />
<strong>Industrial</strong> <strong>Water</strong> <strong>Use</strong> in Minnesota:<br />
Implementation Issues and<br />
Customer Inventory<br />
June 29, 2006<br />
Prepared <strong>for</strong>:<br />
Metropolitan Council<br />
St. Paul, Minnesota<br />
Project Number 070186<br />
LCMR05-07d<br />
Prepared by:<br />
Craddock Consulting Engineers<br />
1720 Stan<strong>for</strong>d Avenue<br />
Saint Paul, MN 55106<br />
CDM<br />
445 Etna Street, Suite 65<br />
Saint Paul, MN 55106<br />
James Crook<br />
17 Woods Road<br />
Norwell, MA 02061<br />
Produced on recycled paper
Contents<br />
Section 1 – Introduction<br />
Craddock Consulting Engineers i<br />
In Association with CDM & James Crook<br />
TM1-Table of Contents_0707.doc<br />
1.1 Project Vision ............................................................................................................1-1<br />
1.2 <strong>Water</strong> <strong>Use</strong> in Minnesota .........................................................................................1-2<br />
1.3 <strong>Water</strong> Reuse Background .......................................................................................1-5<br />
<strong>Industrial</strong> ..............................................................................................................1-5<br />
Urban ....................................................................................................................1-6<br />
Agricultural..........................................................................................................1-6<br />
Environmental and Recreational ......................................................................1-6<br />
Ground <strong>Water</strong> Recharge.....................................................................................1-6<br />
Augmentation of Potable Supplies...................................................................1-6<br />
1.4 <strong>Wastewater</strong> Reuse in Minnesota ............................................................................1-7<br />
1.5 Document Contents .................................................................................................1-8<br />
1.6 References ..................................................................................................................1-8<br />
Section 2 – Implementation Considerations<br />
2.1 Drivers <strong>for</strong> Reuse .....................................................................................................2-1<br />
2.2 Regulatory Requirements .......................................................................................2-2<br />
Current <strong>Water</strong> Reuse Practice in Minnesota ...................................................2-2<br />
Comparison to Other State Regulatory Practices ...........................................2-4<br />
<strong>Water</strong> Reuse Criteria <strong>for</strong> <strong>Industrial</strong> <strong>Use</strong>s.......................................................2-12<br />
Implications of No <strong>Water</strong> Reuse Guidelines or Regulations ......................2-13<br />
2.3 Technical Considerations .....................................................................................2-14<br />
<strong>Water</strong> Quality ....................................................................................................2-14<br />
Recommended <strong>Water</strong> Quality.........................................................................2-17<br />
Treatment Requirements and Technologies..................................................2-20<br />
2.4 Institutional Considerations .................................................................................2-26<br />
2.5 Examples of Reuse in Minnesota and <strong>Industrial</strong> Reuse ...................................2-26<br />
Minnesota Reuse Applications........................................................................2-26<br />
Cooling <strong>Water</strong>....................................................................................................2-27<br />
2.6 References ...............................................................................................................2-29<br />
Section 3 – Inventory of Major WWTPs and Potential <strong>Industrial</strong> Reuse Demands<br />
3.1 Statewide Inventory ................................................................................................3-1<br />
Industry <strong>Water</strong> <strong>Use</strong>.............................................................................................3-1<br />
<strong>Wastewater</strong> Treatment Plants ...........................................................................3-5<br />
Proximity of Industries to WWTPs...................................................................3-5<br />
3.2 <strong>Water</strong>sheds Inventories ...........................................................................................3-6<br />
Overview ..............................................................................................................3-6<br />
Cedar River ..........................................................................................................3-8<br />
Des Moines River ..............................................................................................3-11
Table of Contents<br />
Technical Memorandum 1<br />
<strong>Recycling</strong> <strong>Treated</strong> <strong>Wastewater</strong> <strong>for</strong> <strong>Industrial</strong> <strong>Water</strong> <strong>Use</strong> in Minnesota<br />
Craddock Consulting Engineers ii<br />
In Association with CDM & James Crook<br />
TM1-Table of Contents_0707.doc<br />
Lower Mississippi River...................................................................................3-14<br />
Minnesota River ................................................................................................3-18<br />
Mississippi River-Headwaters (Upper) .........................................................3-21<br />
Missouri River ...................................................................................................3-27<br />
Rainy River <strong>Water</strong>shed.....................................................................................3-28<br />
Red River of the North .....................................................................................3-31<br />
St. Croix River....................................................................................................3-34<br />
Western Lake Superior <strong>Water</strong>shed.................................................................3-37<br />
3.3 Metro Area Inventory ............................................................................................3-41<br />
Metro Area Overview.......................................................................................3-41<br />
Minnesota River <strong>Water</strong>shed WWTPs.............................................................3-43<br />
Mississippi River <strong>Water</strong>shed WWTPs ...........................................................3-46<br />
St. Croix River <strong>Water</strong>shed WWTP..................................................................3-50<br />
3.4 Inventory Summary ..............................................................................................3-51<br />
Groundwater Supply........................................................................................3-51<br />
Supply vs. Demand...........................................................................................3-51<br />
3.5 References ................................................................................................................3-54<br />
Appendices<br />
Appendix A: DNR Appropriations Permit Data Analysis Documentation<br />
Appendix B: Status of <strong>Water</strong> Reuse Regulations and Guidelines<br />
Appendix C: <strong>Water</strong>shed Inventory Data<br />
Appendix D: Reference Documents<br />
Appendix E: Metropolitan Council <strong>Industrial</strong> Dischargers – <strong>Water</strong> Demand
Craddock Consulting Engineers<br />
In Association with CDM & James Crook 1-1<br />
TM1-Sec1_0707.doc<br />
Section 1<br />
Introduction<br />
1.1 Project Vision<br />
Conserving Minnesota’s ground water and surface water resources is important to all<br />
sectors in the state and is key to the state’s long-term economic development. The<br />
economic vitality of Minnesota requires the business sector to grow with the<br />
population of the state. While water supply availability is not presently considered a<br />
limitation <strong>for</strong> industrial development in many Minnesota communities, there are<br />
numerous areas in the state that have a limited supply of high quality water. Even<br />
within the metro area of the Twin Cities, development is now extending to areas with<br />
less productive aquifers and future growth will increase competition <strong>for</strong> a limited<br />
water supply. Industries requiring abundant or high quality water could be restricted<br />
from locating in some areas unless other water supply options are made known and<br />
available to them.<br />
One potential supply in these water-short areas is effluent from municipal wastewater<br />
treatment plants (WWTPs), also known as reclaimed water. <strong>Municipal</strong>ities may<br />
benefit by offering ”water reuse” as an alternative water source to industries and by<br />
<strong>for</strong>ging partnerships with industries to promote conservation of a limited potable<br />
water supply and improved protection of the state’s water resources.<br />
In July 2005, the Metropolitan Council (Met Council) was awarded a $300,000 grant<br />
from the Legislative Commission on Minnesota Resources <strong>for</strong> this project titled,<br />
“<strong>Recycling</strong> <strong>Treated</strong> <strong>Municipal</strong> <strong>Wastewater</strong> <strong>for</strong> <strong>Industrial</strong> <strong>Water</strong> <strong>Use</strong>.” The timeframe<br />
<strong>for</strong> the project is July 1, 2005 to June 30, 2007. Funding <strong>for</strong> this project was<br />
recommended by the Legislative Commission on Minnesota Resources from the<br />
Minnesota Environment and Natural Resources Trust Fund. The Met Council is<br />
providing additional funding <strong>for</strong> the project through in-kind contributions of staff<br />
time. In addition, other state agencies such as the Minnesota Pollution Control<br />
Agency (MPCA), Minnesota Department of Natural Resources (MDNR) and the<br />
Minnesota Department of Health (MDH) are participating via stakeholder meetings<br />
and technical review and input. It is estimated that 20% of project funding is from<br />
these in-kind contributions of staff time and 80% from the Minnesota Environment<br />
and Natural Resources Trust Fund.<br />
The guiding goal <strong>for</strong> this project is to promote the conservation of Minnesota’s<br />
ground water and surface water resources by recycling treated municipal wastewater<br />
<strong>for</strong> industrial use. The project is applicable to communities throughout Minnesota.<br />
Benefits include: (1) Less ground water aquifer depletion due to one-time use and<br />
discharge from surface waters; (2) Lower demand on finite water resources to support<br />
business and growth; and (3) Reliable and potentially lower cost water sources <strong>for</strong><br />
industry in the long-term.
Section 1<br />
Introduction<br />
This project will provide a statewide and Minneapolis/St. Paul metro area inventory<br />
of industries and assess their potential as wastewater reuse customers. It will also<br />
outline an implementation plan that addresses the technical, regulatory, institutional,<br />
and financial elements of an industrial water reuse strategy.<br />
The project is comprised of two main tasks:<br />
Task 1: <strong>Industrial</strong> <strong>Water</strong> <strong>Use</strong> (Demand Assessment) to be completed by June 30,<br />
2006<br />
Task 2: <strong>Municipal</strong> <strong>Wastewater</strong> Treatment (Supply Assessment) to be completed by<br />
June 30, 2007<br />
The main purpose of this project is to identify whether and how water reuse can<br />
reduce the potential <strong>for</strong> water supply to be a limiting factor to future industrial<br />
development in Minnesota. Because the state of Minnesota currently has few water<br />
reuse applications, the implementation plan in Task 2 will highlight reuse practices in<br />
other states and the various factors that must be considered <strong>for</strong> Minnesota to have a<br />
viable water reuse program.<br />
This technical memorandum documents the work completed under Task 1. The main<br />
products of Task 1 include:<br />
an inventory of major industrial water use and users (i.e., potential candidates <strong>for</strong><br />
industrial reuse)<br />
identification of regulatory, technical, and institutional elements that are usually<br />
considered in establishing a water reuse program/project<br />
In Task 2, the industrial reuse customer inventory will be evaluated to rank candidate<br />
industrial customers <strong>for</strong> reuse projects. Costs associated with conveyance and<br />
additional treatment facilities will be estimated <strong>for</strong> candidate industrial customers.<br />
Costs and non-monetary factors will be evaluated in an implementation analysis and<br />
presented to stakeholders. With stakeholder input, an implementation plan will be<br />
developed that identifies steps the State and/or Met Council could initiate to promote<br />
industrial water reuse projects.<br />
1.2 <strong>Water</strong> <strong>Use</strong> in Minnesota<br />
How much water do Minnesotans use and what is it used <strong>for</strong>? Major water use in<br />
Minnesota ranged from 3.4 to 3.7 billion gallons per day (gpd) during 2000-2004. This<br />
represents all permitted water users that withdraw more than 1 million gallons per<br />
year (mgy) and/or 100,000 gpd of ground or surface water, and there<strong>for</strong>e, does not<br />
account <strong>for</strong> most domestic private well or surface withdrawals. The majority of the<br />
water use in<strong>for</strong>mation reported in this document is based on the records maintained<br />
by the MDNR Appropriation Permits program. While the water use in<strong>for</strong>mation<br />
presented in this document does not include all uses since it excludes private, low<br />
1-2 Craddock Consulting Engineers<br />
In Association with CDM & James Crook<br />
TM1-Sec1_0707.doc
Section 1<br />
Introduction<br />
Craddock Consulting Engineers<br />
In Association with CDM & James Crook 1-3<br />
TM1-Sec1_0707.doc<br />
volume users, it is based on a well-maintained data record that provides an accurate<br />
accounting of the users that are monitored.<br />
The MDNR tracks water use by nine industrial categories, listed in Figure 1.1 and<br />
Table 1.1. Over 60% of the water used in Minnesota is <strong>for</strong> power generation facilities,<br />
mainly <strong>for</strong> once-through cooling, supplied mostly by surface waters (as indicated in<br />
Table 1.1 and Figure 1.2). The next largest use of water, about 15% of the total, is as a<br />
potable-quality water supply (waterworks), distributed by municipalities <strong>for</strong><br />
domestic, commercial and industrial uses. Nearly two-thirds of the potable-quality<br />
water in Minnesota is supplied by ground water. <strong>Water</strong> withdrawn by industries<br />
(those not served by waterworks) <strong>for</strong> various processing needs accounts <strong>for</strong> about<br />
12% of the total water used in Minnesota.<br />
In terms of 2004 daily average demands, nearly 2,500 mgd of water was used by the<br />
state’s power generation industry and over 500 mgd served as a potable-quality<br />
supply <strong>for</strong> a variety of uses. Over 400 mgd was withdrawn by industries <strong>for</strong> direct use<br />
in their business. Year 2004 water records were used <strong>for</strong> this study <strong>for</strong> analysis of<br />
industrial water demands on a state-wide basis because it was representative of the<br />
previous four years of record, as documented in Appendix A, and was the last year of<br />
reported data available.<br />
Clearly, the various types of industrial water use represent a major demand on the<br />
state’s water resources. For purposes of this project, the MDNR categories of power<br />
generation and industrial processing represent demands that in theory could use<br />
reclaimed water. Some industries also use municipal potable supplies, but there are<br />
insufficient data on a state basis to identify this portion of the industrial sector.<br />
Recognizing these limitations, the total “industrial water use” (power generation and<br />
industrial processing) in Minnesota is nearly 3 billion gpd, which is roughly 75% of<br />
the total major water use in the state.<br />
Table 1.1. <strong>Water</strong> <strong>Use</strong> in Minnesota, 2004<br />
Category Ground <strong>Water</strong><br />
<strong>Water</strong> <strong>Use</strong>, mgd<br />
Surface <strong>Water</strong> Total<br />
Air Conditioning 6.0 0.9 6.8<br />
<strong>Industrial</strong> Processing 56.3 385.4 441.7<br />
Major Crop Irrigation 174.9 27.6 202.5<br />
Non-Crop Irrigation 20.3 5.5 25.8<br />
Power Generation 3.6 2,375.1 2,378.8<br />
Special Categories 18.9 14.5 33.3<br />
Temporary 4.2 0.7 4.9<br />
<strong>Water</strong> Level Maintenance 4.8 95.4 100.2<br />
<strong>Water</strong>works 354.6 201.3 555.9<br />
Total 643.6 3,106.3 3,749.8<br />
Source: MNDR, 2004
Section 1<br />
Introduction<br />
<strong>Water</strong> <strong>Use</strong> (mgd)<br />
<strong>Water</strong>works 15%<br />
<strong>Water</strong> Level<br />
Maintenance 2.7%<br />
Special Categories<br />
1%<br />
2,500<br />
2,000<br />
1,500<br />
1,000<br />
Temporary 0.1%<br />
500<br />
0<br />
Surface <strong>Water</strong><br />
Ground <strong>Water</strong><br />
Air Conditioning 0.2%<br />
Power<br />
Generation<br />
63%<br />
<strong>Industrial</strong> Processing 12%<br />
Major Crop Irrigation 5%<br />
Non Crop Irrigation 1%<br />
Figure 1.1. <strong>Water</strong> <strong>Use</strong> in Minnesota, 2004<br />
Source: MDNR, 2004<br />
Catergories:<br />
1 Air Conditioning<br />
2 <strong>Industrial</strong> Processing<br />
3 Major Crop Irrigation<br />
4 Non-Crop Irrigation<br />
5 Power Generation<br />
6 Special Catergories<br />
7 Temporary<br />
8 <strong>Water</strong> Level Maintenance<br />
9 <strong>Water</strong>works<br />
1 2 3 4 5<br />
Catergory Code<br />
6 7 8 9<br />
Figure 1.2. <strong>Water</strong> <strong>Use</strong> in Minnesota by Source, 2004<br />
Source: MNDR, 2004<br />
1-4 Craddock Consulting Engineers<br />
In Association with CDM & James Crook<br />
TM1-Sec1_0707.doc
Section 1<br />
Introduction<br />
Craddock Consulting Engineers<br />
In Association with CDM & James Crook 1-5<br />
TM1-Sec1_0707.doc<br />
1.3 <strong>Wastewater</strong> Reuse Background<br />
In Minnesota, WWTP effluent is typically discharged to a receiving stream or a land<br />
application system. However, wastewater effluent can also be beneficially used <strong>for</strong> a<br />
variety of purposes. There are various terms used to describe the beneficial use of<br />
WWTP effluent: water reuse, wastewater reuse, water recycling, or water reclamation<br />
are often used interchangeably.<br />
While this project is to evaluate the beneficial reuse of wastewater effluent <strong>for</strong><br />
industrial purposes, non-industrial uses are briefly described to indicate the potential<br />
competition <strong>for</strong> use of reclaimed water as is commonly practiced around the globe.<br />
From the perspective of the municipality, investment in capital to provide reclaimed<br />
water will typically involve a review of all options; multiple users are commonly<br />
required <strong>for</strong> water reclamation to be a cost-effective practice <strong>for</strong> the municipal utility.<br />
Many U.S. communities use WWTP effluent <strong>for</strong> a variety of nonpotable purposes,<br />
typically categorized under the following major types:<br />
<strong>Industrial</strong><br />
Urban<br />
Agricultural<br />
Environmental and recreational<br />
Ground water recharge<br />
Augmentation of potable supplies<br />
<strong>Industrial</strong><br />
<strong>Industrial</strong> reuse applications in the U.S. have steadily increased over the past decade,<br />
with an increasing diversity of industrial uses. The largest use of reclaimed water in<br />
the U.S. has been <strong>for</strong> cooling water. Because recirculating evaporative cooling water<br />
systems consume water (versus the once-through cooling water system that has no<br />
evaporation), they are the most common industrial system using reclaimed water. The<br />
large water demands of power facilities <strong>for</strong> cooling water and other needs makes<br />
them an ideal facility <strong>for</strong> reuse. Reclaimed water is also used as process water <strong>for</strong> a<br />
variety of applications at petroleum refineries, chemical plants, metal working, pulp<br />
and paper mills, and other production facilities. Other industries with a potential to<br />
use reclaimed water are industries using water <strong>for</strong> washing or wetting requirements,<br />
such as laundries and sand and gravel washing operations.
Section 1<br />
Introduction<br />
Urban<br />
Reclaimed water is used <strong>for</strong> a variety of purposes in the urban setting. One common<br />
use, that is one of the few applications in Minnesota, is <strong>for</strong> golf course irrigation.<br />
Other typical irrigation reuse applications include: public lands such as parks, athletic<br />
fields, highway medians and shoulders, landscaped areas <strong>for</strong> commercial properties,<br />
and landscaping <strong>for</strong> residential areas. Other examples of “urban” reuse applications<br />
include vehicle washing facilities, laundry facilities, fire protection, toilet and urinal<br />
flushing in commercial buildings, decorative water features such as fountains and<br />
reflecting pools, street sweeping, and dust control and soil compaction <strong>for</strong><br />
construction projects.<br />
Agricultural<br />
In many states, agricultural irrigation is a significant percent of the total demand <strong>for</strong><br />
freshwater and is estimated to represent 40% of the total water demand nationwide<br />
[Soley et al, 1998]. Reclaimed water has been used to irrigate a variety of agricultural<br />
applications including: pasture; orchards and vineyards; harvested feed, fiber and<br />
seed; food crops; processed food crops; and nursery and sod. Florida uses 19% of its<br />
reclaimed water supply <strong>for</strong> agricultural irrigation [Florida Department of<br />
Environmental Protection, 2002] and Cali<strong>for</strong>nia uses approximately 48% [Cali<strong>for</strong>nia<br />
State <strong>Water</strong> Resources Control Board, 2002].<br />
Environmental and Recreational<br />
Reclaimed water has been used <strong>for</strong> environmental improvements and recreational<br />
uses. Environmental reuse includes wetland enhancement and restoration, creation of<br />
wetlands <strong>for</strong> wildlife habitat, and stream augmentation. Wetland reuse projects often<br />
include dual goals: to enhance downstream surface water quality and create<br />
additional wildlife habitat. Recreational applications <strong>for</strong> reclaimed water include<br />
water impoundments restricted to boating and fishing or <strong>for</strong> full body contact<br />
activities such as swimming, smaller landscape impoundments, and golf course<br />
ponds. Lubbock, Texas uses 4 mgd of reclaimed water <strong>for</strong> recreational lakes (fishing<br />
and boating) in the Yellowhouse Canyon Lakes Park (<strong>Water</strong> Pollution Control<br />
Federation, 1989].<br />
Ground <strong>Water</strong> Recharge<br />
Ground water recharge using reclaimed water has been used to reduce saltwater<br />
intrusion in coastal aquifers, augment potable or nonpotable aquifers, provide storage<br />
and/or further treatment of reclaimed water <strong>for</strong> later use, and prevent ground<br />
subsidence. In areas with extensive agricultural irrigation, ground water recharge<br />
practices rely on the aquifers <strong>for</strong> storage, removing the need <strong>for</strong> storage facilities to<br />
meet seasonal demands.<br />
Augmentation of Potable Supplies<br />
Potable water supplies can be supplemented with treated wastewater by surface<br />
water augmentation, ground water recharge, and direct potable reuse. The first two<br />
1-6 Craddock Consulting Engineers<br />
In Association with CDM & James Crook<br />
TM1-Sec1_0707.doc
Section 1<br />
Introduction<br />
Craddock Consulting Engineers<br />
In Association with CDM & James Crook 1-7<br />
TM1-Sec1_0707.doc<br />
applications are indirect potable reuse, which has been defined as the augmentation<br />
of a community’s raw water supply with treated wastewater followed by an<br />
environmental buffer [Crook, 2001]. In this case, the treated wastewater is mixed with<br />
surface and/or ground water and receives additional treatment prior to entering the<br />
potable water distribution system. Direct potable reuse is defined as the introduction<br />
of treated wastewater directly into a water distribution system without intervening<br />
storage (pipe-to-pipe) [Crook, 2001]. There are no direct potable reuse applications in<br />
the U.S..<br />
1.4 <strong>Wastewater</strong> Reuse in Minnesota<br />
Minnesota is known <strong>for</strong> its abundance of water, as the “Land of 10,000 Lakes.” A safe,<br />
cost-effective, and adequate water supply has been easily attained <strong>for</strong> many<br />
Minnesota industries and communities, but there are some regions with an<br />
abundance of poor quality water or a limited supply of high quality water. Section 3<br />
highlights these areas in the watershed inventories. Over the past two decades,<br />
Minnesota’s environmental stewardship has promoted the need to conserve water<br />
resources and programs have been implemented across the state. Conservation has<br />
gone hand-in-hand with improved water protection programs and more stringent<br />
regulations <strong>for</strong> surface water dischargers. As we look to the future, residential and<br />
industrial growth in some areas of Minnesota could potentially be curtailed because<br />
of a limited water supply, even with more stringent conservation practices.<br />
Alternative supplies will be sought – and treated wastewater effluent is one potential<br />
supply <strong>for</strong> a specific area, industry, or group of industries.<br />
<strong>Water</strong> quality considerations may also drive an increased role <strong>for</strong> reuse in Minnesota.<br />
As growing communities generate additional wastewater, there will be a need to<br />
provide higher and higher levels of wastewater treatment to maintain or decrease the<br />
discharge loads to the state’s waterways. Finding other uses <strong>for</strong> the treated<br />
wastewater, through partnerships with industry, will decrease wastewater<br />
discharges.<br />
The urgency <strong>for</strong> the water quality consideration is driven by the development of the<br />
Total Maximum Daily Load (TMDL) program in Minnesota which will affect the<br />
discharge allocations <strong>for</strong> many communities. For example, the Lake Pepin TMDL will<br />
affect nearly two-thirds of the state. With a potential reduction requirement of onehalf<br />
the phosphorus and solids loads to Lake Pepin, and nonpoint source reduction<br />
practices still untested, it is likely that point source reductions will be part of the<br />
solution. <strong>Wastewater</strong> reuse may be a cost-effective solution <strong>for</strong> some communities,<br />
particularly when tertiary treatment processes are required to meet receiving stream<br />
discharge limits. If these communities are also experiencing water supply limitations,<br />
the benefits of a wastewater reuse option could be even more pronounced.
Section 1<br />
Introduction<br />
1.5 Document Contents<br />
This technical memorandum presents background in<strong>for</strong>mation on the project and<br />
water reuse in general, implementation considerations, and an inventory of the<br />
industrial water demand and supply of treated wastewater.<br />
Section 1: Presents the project vision, drivers <strong>for</strong> water reuse in Minnesota, general<br />
water use in Minnesota in context with water used by industries, and an overview of<br />
reuse practices and specific wastewater reuse issues <strong>for</strong> Minnesota.<br />
Section 2: Provides an overview of considerations <strong>for</strong> the industry and municipal<br />
supplier that affect the implementation of a water reuse project. Regulatory, technical<br />
and institutional issues are identified to educate the stakeholders on the diversity of<br />
issues that must be addressed <strong>for</strong> successful implementation and operation of<br />
wastewater reuse facilities.<br />
Section 3: Reviews the historical water use in the state <strong>for</strong> major industrial users in<br />
context with municipal WWTPs’ location and production capacity. A more in-depth<br />
review of industry water demand and municipal WWTP supply is provided <strong>for</strong> each<br />
individual watershed. General in<strong>for</strong>mation on the existing water sources in the<br />
watersheds and areas that may be prone to water supply problems is also provided.<br />
The Minneapolis/St. Paul metro area is examined on a WWTP basis, where industries<br />
located within a one- and five-mile radius of each existing metro-area WWTP are<br />
identified. The section concludes with a summary of industrial water use demand in<br />
context with the supply of reclaimed water.<br />
1.6 References<br />
Cali<strong>for</strong>nia State <strong>Water</strong> Resources Control Board. 2002. 2002 Statewide Recycled <strong>Water</strong> Survey.<br />
Cali<strong>for</strong>nia State <strong>Water</strong> Resources Control Board, Office of <strong>Water</strong> <strong>Recycling</strong>, Sacramento,<br />
Cali<strong>for</strong>nia. Available from http://www.swrcb.ca.gov/recycling/munirec.html.<br />
Crook, J. 2001. National Research Council Report on Potable Reuse. In: Proceedings of the 2001<br />
Annual WateReuse Research Conference, June 4-5, 2001, Monterey, Cali<strong>for</strong>nia.<br />
Florida Department of Environmental Protection. 2002b. 2001 Reuse Inventory. Florida<br />
Department of Environmental Protection. Tallahassee, Florida.<br />
Minnesota Department of Natural Resources (MDNR), 2004. Minnesota <strong>Water</strong> Appropriations<br />
Permit Program. Data summarized through 2004 was obtained from the MDNR website in<br />
March 2006. (This Technical Memorandum uses the 2004 annual volume reported, presented<br />
as the average annual water use in million gallons per day (mgd)). The Permit In<strong>for</strong>mation<br />
Report (MS Excel) was created 6/23/2005 and the ArcView shape files were created<br />
12/19/2005.<br />
Solley, Wayne B., R. R. Pierce, H. and A. Perlman. 1988. “U.S. Geological Survey Circular 1200:<br />
Estimated <strong>Use</strong> of <strong>Water</strong> in the United States in 1995.” Denver, Colorado.<br />
<strong>Water</strong> Pollution Control Federation. 1989. <strong>Water</strong> Reuse Manual of Practice, Second Edition. <strong>Water</strong><br />
Pollution Control Federation, Alexandria, Virginia.<br />
1-8 Craddock Consulting Engineers<br />
In Association with CDM & James Crook<br />
TM1-Sec1_0707.doc
Craddock Consulting Engineers 2-1<br />
In Association with CDM & James Crook<br />
TM1-Sec2_0707.doc<br />
Section 2<br />
Implementation Considerations<br />
The decision to implement an industrial water reuse program depends heavily on sitespecific<br />
and area-specific conditions. For a wastewater treatment provider to partner<br />
with one or more industries in developing an industrial reuse program usually requires<br />
one or more economic and/or non-economic drivers. Several key drivers <strong>for</strong> industrial<br />
reuse are discussed in Section 2.1.<br />
Even with the proper incentives, implementation of an industrial reuse program is<br />
contingent on successfully addressing a number of implementation challenges, such as:<br />
development and application of reuse regulations<br />
technical considerations such as industrial water quality requirements, wastewater<br />
treatment needs to achieve the users’ water quality requirements, and fee structures<br />
institutional considerations such as local ordinances, public perception, and legal<br />
agreements<br />
Each of these subjects is discussed in this section. Section 2 concludes with example case<br />
studies of industrial reuse projects throughout the U.S.<br />
2.1 Drivers <strong>for</strong> Reuse<br />
Industry considers use of reclaimed water ‘reuse’ if there is a reason (driver) to seek an<br />
alternative to use of municipal potable supplies or direct use of ground or surface<br />
water. Usually, the driver is the lack of sufficient water of the appropriate quality. In<br />
some cases, financial incentives associated with the use of reclaimed water (e.g., rates<br />
lower than potable water) make it economically attractive.<br />
<strong>Use</strong> of reclaimed water is not uncommon in those states that have state-wide or large<br />
regional water supply issues. In Minnesota, some areas have had similar supply<br />
limitations. In the case of the southwestern portion of the state, a reliable supply was<br />
found outside Minnesota’s border. One power plant has found reclaimed water a better<br />
option than treating the poor quality water from the Minnesota River. As population<br />
growth continues to put pressure on metro area and larger community aquifers, some<br />
areas in Minnesota will have water supply limitations and use of reclaimed water will<br />
be a viable option.<br />
Drivers <strong>for</strong> reclaimed water use <strong>for</strong> industrial purposes on a national level include the<br />
following:<br />
Need <strong>for</strong> water – lack of adequate local supply of appropriate quality or quantity
Section 2<br />
Implementation Considerations<br />
Conservation – conserves natural waters <strong>for</strong> potable supplies<br />
Reliable supply – reclaimed water is nearly always available, not affected by<br />
droughts<br />
Pollution abatement – alternative to discharge to environmentally sensitive waters<br />
Economically attractive supply – may be less costly than treatment needed <strong>for</strong><br />
discharge or alternative sources of supply<br />
Regulatory or statutory mandates – regulatory or statutory requirement to use or<br />
consider reclaimed water <strong>for</strong> certain water demands under certain conditions<br />
In Minnesota, a key driver <strong>for</strong> industrial reuse of treated wastewater will be the lack of<br />
an adequate local water supply of appropriate quality or quantity. If sufficient supply is<br />
available, but of a poorer quality than reclaimed water, the treatment costs might favor<br />
reuse. Similarly, if an appropriate quality water is available, but at a significant distance<br />
and requires conveyance and annual pumping costs, then reuse may be more costeffective.<br />
While Minnesotans are embracing conservation measures and water supply<br />
plans emphasize reliability in supply, conservation and reliability most likely will be<br />
added benefits, not the main driver to spur industrial water reuse. <strong>Municipal</strong>ities in<br />
Minnesota, particularly in developing areas, may seek to foster relationships with reuse<br />
customers because of increased pressures to reduce the discharge of pollutants to the<br />
state’s waterways. Minnesota’s industries, particularly if located or planned <strong>for</strong> location<br />
in proximity to a WWTP, could be sought as partners in the continued conservation and<br />
protection of Minnesota’s water resources.<br />
2.2 Regulatory Requirements<br />
Current <strong>Water</strong> Reuse Practice in Minnesota<br />
Minnesota is one of several states that have not developed state water reuse criteria.<br />
Currently, Minnesota uses Cali<strong>for</strong>nia’s <strong>Water</strong> <strong>Recycling</strong> Criteria [State of Cali<strong>for</strong>nia,<br />
2000a], as summarized in Table 2.1, to evaluate water reuse projects on a case-by-case<br />
basis.<br />
In Minnesota, water reuse requirements are included in NPDES permits administered<br />
by the Minnesota Pollution Control Agency. A change in the location of a wastewater<br />
treatment facility’s discharge (as would be required <strong>for</strong> a reuse application) or any<br />
modifications to a facility to provide treatment and conveyance <strong>for</strong> a reuse application<br />
requires an NPDES permit modification.<br />
There are several rural Minnesota facilities that discharge their effluent <strong>for</strong> agricultural<br />
irrigation purposes, typically because there is not a receiving stream with available load<br />
capacity. Small systems are also being installed <strong>for</strong> golf course irrigation. The largest<br />
water reuse application in Minnesota will be implemented in 2006 as the City of<br />
Mankato provides treated wastewater effluent to the Mankato Energy Center. Over 6<br />
mgd of water will be provided <strong>for</strong> cooling and process water needs. Section 2.5<br />
provides additional in<strong>for</strong>mation on the Mankato industrial reuse project and other<br />
reuse applications in Minnesota.<br />
2-2 Craddock Consulting Engineers<br />
In Association with CDM & James Crook<br />
TM1-Sec2_0707.doc
Section 2<br />
Implementation Considerations<br />
Craddock Consulting Engineers 2-3<br />
In Association with CDM & James Crook<br />
TM1-Sec2_0707.doc<br />
Table 2.1. 2000 Cali<strong>for</strong>nia <strong>Water</strong> <strong>Recycling</strong> Criteria<br />
Type of <strong>Use</strong><br />
Irrigation of fodder, fiber, and seed crops, orchards b and<br />
vineyards b , processed food crops c , nonfood-bearing<br />
trees, ornamental nursery stock d , and sod farms d ;<br />
flushing sanitary sewers<br />
Irrigation of pasture <strong>for</strong> milking animals, landscape<br />
areas e , ornamental nursery stock and sod farms where<br />
public access is not restricted; landscape impoundments;<br />
industrial or commercial cooling water where no mist is<br />
created; nonstructural fire fighting; industrial boiler<br />
feed; soil compaction; dust control; cleaning roads,<br />
sidewalks, and outdoor areas<br />
Irrigation of food crops b ; restricted recreational<br />
impoundments; fish hatcheries<br />
Irrigation of food crops f and open access landscape<br />
areas g ; toilet and urinal flushing; industrial process<br />
water; decorative fountains; commercial laundries and<br />
car washes; snow-making; structural fire fighting;<br />
industrial or commercial cooling where mist is created<br />
Nonrestricted recreational impoundments<br />
Total Coli<strong>for</strong>m<br />
Limits a<br />
Treatment<br />
Required<br />
None required Oxidation<br />
≤23/100 ml a<br />
≤240/100 ml in more than<br />
one sample in any 30-day<br />
≤2.2/100 ml a<br />
≤23/100 ml in more than one<br />
sample in any 30-day period<br />
≤2.2/100 ml a<br />
≤23/100 ml in more than one<br />
sample in any 30-day period<br />
240/100 ml (maximum)<br />
≤2.2/100 ml a<br />
≤23/100 ml in more than one<br />
sample in any 30-day period<br />
240/100 ml (maximum)<br />
Groundwater recharge by spreading Case-by-case evaluation<br />
Oxidation<br />
Disinfection<br />
Oxidation<br />
Disinfection<br />
Oxidation<br />
Coagulation h<br />
Filtration i<br />
Disinfection<br />
Oxidation<br />
Coagulation<br />
Clarification j<br />
Filtration i<br />
Disinfection<br />
Case-by-case<br />
evaluation<br />
a<br />
Based on running 7-day median; daily sampling is required.<br />
b<br />
No contact between reclaimed water and edible portion of crop.<br />
c<br />
Food crops that undergo commercial pathogen-destroying prior to human consumption.<br />
d<br />
No irrigation <strong>for</strong> at least 14 days prior to harvesting, sale, or allowing public access.<br />
e<br />
Cemeteries, freeway landscaping, restricted access golf courses, and other controlled access areas.<br />
f<br />
Contact between reclaimed water and edible portion of crop; includes edible root crops.<br />
g<br />
Parks, playgrounds, schoolyards, residential landscaping, unrestricted access golf courses, and other<br />
uncontrolled access irrigation areas.<br />
h<br />
Not required if the turbidity of influent to the filters is continuously measured, does not exceed 5 NTU<br />
<strong>for</strong> more than 15 minutes and never exceeds 10 NTU, and there is capability to automatically activate<br />
chemical addition or divert wastewater if the filter influent turbidity exceeds 5 NTU <strong>for</strong> more than 15<br />
minutes.<br />
i<br />
The turbidity after filtration through filter media cannot exceed an average of 2 nephelometric turbidity<br />
units (NTU) within any 24-hour period, 5 NTU more than 5 percent of the time within a 24-hour period,<br />
and 10 NTU at any time. The turbidity after filtration through a membrane process cannot exceed 0.2<br />
NTU more than 5 percent of the time within any 24-hour period and 0.5 NTU at any time.<br />
j<br />
Not required if reclaimed water is monitored <strong>for</strong> enteric viruses, Giardia, and Cryptosporidium.<br />
Source: Adapted from State of Cali<strong>for</strong>nia [2000a].
Section 2<br />
Implementation Considerations<br />
Comparison to Other State Regulatory Practices<br />
There are no federal regulations governing water reclamation and reuse in the United<br />
States; regulations are developed and implemented at the state government level. The<br />
lack of federal regulations has resulted in differing standards among states that have<br />
developed water reuse regulations. In the 1990s, several states adopted or revised their<br />
respective regulations, and it was common practice to base reuse criteria on those of states<br />
that had comprehensive regulations, guidelines, and background in<strong>for</strong>mation to support<br />
them. The Guidelines <strong>for</strong> <strong>Water</strong> Reuse [U.S. Environmental Protection Agency, 1992], which<br />
were published in 1992 (revised in 2004), were also used as a resource by states that had<br />
limited or no regulations or guidelines. Since then, there has been increased interest in<br />
water reuse in several states that previously did not have water reuse regulations.<br />
At present, no states have regulations that cover all potential uses of reclaimed water,<br />
but several states have extensive regulations that prescribe requirements <strong>for</strong> a wide<br />
range of end uses of the reclaimed water. Other states have regulations or guidelines<br />
that focus on land treatment of wastewater effluent, emphasizing additional treatment<br />
or effluent disposal rather than beneficial reuse, even though the effluent may be used<br />
<strong>for</strong> irrigation of agricultural sites or public access lands.<br />
Status of <strong>Water</strong> Reuse Regulations and Guidelines<br />
The status and summary of water reuse regulations and guidelines in the United States<br />
as of 2004 have been documented in the EPA Guidelines <strong>for</strong> <strong>Water</strong> Reuse [U.S.<br />
Environmental Protection Agency, 2004] and are provided in Table 2.2. The absence of<br />
state regulations and guidelines <strong>for</strong> specific reuse applications does not necessarily<br />
prohibit those applications; many states evaluate specific types of water reuse on a caseby-case<br />
basis. Based on the data in Table 2.2, 25 states have adopted regulations<br />
regarding the use of reclaimed water, 16 states have guidelines or design standards, and<br />
9 states have no regulations or guidelines. These data are somewhat misleading, as they<br />
include regulations and guidelines directed at land disposal of effluent or land<br />
application of wastewater intended primarily as a disposal mechanism rather than<br />
beneficial reuse.<br />
The number of states with regulations or guidelines <strong>for</strong> each type of reuse is<br />
summarized in Table 2.3. As indicated in Table 2.3, agricultural and landscape<br />
irrigation represent the reclaimed water uses most commonly regulated, and many<br />
states have implemented regulations that apply only to those types of use. As noted<br />
above, these data include state regulations that pertain to land disposal of effluent or<br />
land application of wastewater intended primarily as a disposal mechanism rather than<br />
beneficial reuse.<br />
The standards in states having the most reuse experience tend to be more stringent than<br />
those in states with fewer reuse projects. States that have water reuse regulations or<br />
guidelines typically set standards <strong>for</strong> reclaimed water quality and specify minimum<br />
treatment requirements, although a few states, such as Texas and New Mexico, do not<br />
prescribe treatment processes and rely solely on water quality limits.<br />
2-4 Craddock Consulting Engineers<br />
In Association with CDM & James Crook<br />
TM1-Sec2_0707.doc
Section 2<br />
Implementation Considerations<br />
Craddock Consulting Engineers 2-5<br />
In Association with CDM & James Crook<br />
TM1-Sec2_0707.doc<br />
Table 2.2. Summary of State Reuse Regulations and Guidelines <strong>for</strong><br />
Nonpotable Reuse Applications<br />
State<br />
Regulations<br />
Guidelines<br />
No Regulations<br />
or Guidelines<br />
Unrestricted<br />
Nonpotable<br />
Urban <strong>Use</strong>s<br />
Restricted<br />
Nonpotable<br />
Urban <strong>Use</strong>s<br />
Agricultural<br />
Irrigation of Food<br />
Crops<br />
Agricultural<br />
Irrigation of Non-<br />
Food Crops<br />
Unrestricted<br />
Recreational<br />
Impoundments<br />
Restricted<br />
Recreational<br />
Impoundments<br />
Alabama <br />
Alaska <br />
Arizona <br />
Arkansas <br />
Cali<strong>for</strong>nia <br />
Colorado <br />
Connecticut <br />
Delaware <br />
Florida <br />
Georgia <br />
Hawaii <br />
Idaho <br />
Illinois <br />
Indiana <br />
Iowa <br />
Kansas <br />
Kentucky <br />
Louisiana <br />
Maine <br />
Maryland <br />
Massachusetts <br />
Michigan <br />
Minnesota <br />
Mississippi <br />
Missouri <br />
Montana <br />
Nebraska <br />
Nevada <br />
New Hampshire <br />
New Jersey <br />
New Mexico <br />
New York <br />
North Carolina <br />
North Dakota <br />
Ohio <br />
Oklahoma <br />
Oregon <br />
Pennsylvania <br />
Rhode Island <br />
South Carolina <br />
South Dakota <br />
Tennessee <br />
Texas <br />
Utah <br />
Vermont <br />
Virginia <br />
Washington <br />
West Virginia <br />
Wisconsin <br />
Wyoming <br />
Source: Adapted from U.S. Environmental Protection Agency [2004].<br />
Environmental<br />
<strong>Use</strong>s<br />
<strong>Industrial</strong> <strong>Use</strong>s
Section 2<br />
Implementation Considerations<br />
Table 2.3. Number of States with Reuse Regulations or Guidelines <strong>for</strong><br />
Different Types of <strong>Use</strong><br />
Type of <strong>Use</strong><br />
Unrestricted urban water reuse<br />
Irrigation<br />
Toilet flushing<br />
Fire protection<br />
Construction<br />
Landscape impoundment<br />
Street cleaning<br />
Restricted urban water reuse<br />
Number of<br />
States with<br />
Regulations or<br />
Guidelines<br />
28<br />
28<br />
10<br />
9<br />
9<br />
11<br />
6<br />
Agricultural irrigation of food crops 21<br />
Agricultural irrigation of nonfood<br />
crops<br />
Unrestricted recreational water reuse 7<br />
Restricted recreational water reuse 9<br />
Environmental water reuse 3<br />
<strong>Industrial</strong> water reuse<br />
Groundwater Recharge<br />
Indirect Potable Reuse<br />
Adapted from U.S. Environmental Protection Agency [2004].<br />
34<br />
40<br />
9<br />
5<br />
5<br />
Description<br />
Irrigation of areas in which public access is not<br />
restricted, such as parks, playgrounds, school yards,<br />
and residences.<br />
Toilet flushing, air conditioning, fire protection,<br />
construction, cleansing, ornamental fountains, and<br />
aesthetic impoundments.<br />
Irrigation of areas in which public access can be<br />
controlled, such as golf courses, cemeteries, and<br />
highway medians.<br />
Irrigation of food crops which are intended <strong>for</strong><br />
human consumption.<br />
Food crop is to be processed.<br />
Food crop is consumed uncooked.<br />
Irrigation of fodder, fiber, and seed crops, pasture<br />
land, commercial nurseries, and sod farms.<br />
An impoundment of water in which no limitations<br />
are imposed on body-contact water recreation<br />
activities.<br />
An impoundment of reclaimed water in which<br />
recreation is limited to fishing, boating, and other<br />
non-contact recreational activities.<br />
Reclaimed water used to create manmade wetlands,<br />
enhance natural wetlands, and to sustain stream<br />
flows.<br />
Reclaimed water used in industrial facilities<br />
primarily <strong>for</strong> cooling system makeup water, boilerfeed<br />
water, process water, and general washdown<br />
and cleansing.<br />
<strong>Use</strong>d via infiltration basins, percolation ponds or<br />
injection wells, reclaimed water is used to recharge<br />
groundwater aquifers.<br />
The intentional discharge of highly treated reclaimed<br />
water into surface waters or groundwater that will be<br />
used as a source of potable water supply.<br />
2-6 Craddock Consulting Engineers<br />
In Association with CDM & James Crook<br />
TM1-Sec2_0707.doc
Section 2<br />
Implementation Considerations<br />
Craddock Consulting Engineers 2-7<br />
In Association with CDM & James Crook<br />
TM1-Sec2_0707.doc<br />
Regulatory Requirements <strong>for</strong> Nonpotable <strong>Use</strong>s of Reclaimed <strong>Water</strong><br />
In the past, most state water reuse regulations were developed in response to a need to<br />
regulate a growing number of water reuse projects in the particular state. Recently,<br />
some states that currently have few reuse projects have taken a proactive approach and<br />
have adopted criteria, which tend to encourage implementation of projects. Arizona,<br />
Cali<strong>for</strong>nia, Florida, and Texas, which have had comprehensive criteria <strong>for</strong> a number of<br />
years, have revised their water reuse regulations within the last ten years to reflect<br />
additional reclaimed water uses, advances in wastewater treatment technology, and<br />
increased knowledge in the areas of microbiology and public health protection.<br />
State water reuse regulations typically include one or more of the following elements:<br />
Treatment Process Requirements<br />
Biochemical Oxygen Demand (BOD)/Total Suspended Solids (TSS), and Turbidity<br />
Requirements<br />
Coli<strong>for</strong>m Bacteria Limits<br />
Limits and Monitoring <strong>for</strong> Pathogenic Organisms<br />
Disinfection Requirements<br />
Treatment Reliability<br />
Storage Requirements<br />
Cross Connection Control<br />
Irrigation-Specific Requirements<br />
Appendix B defines these regulatory requirements and provides state-specific examples.<br />
State regulations <strong>for</strong> indirect potable reuse are also summarized in Appendix B.<br />
The variations and inconsistencies among state regulations are illustrated in Table 2.4,<br />
which includes examples of several states’ reclaimed water standards <strong>for</strong> uses ranging<br />
from fodder crop irrigation to toilet and urinal flushing in buildings.
Section 2<br />
Implementation Considerations<br />
Table 2.4. Examples of State <strong>Water</strong> Reuse Criteria <strong>for</strong> Selected Nonpotable Applications<br />
Fodder Crop Irrigation 1<br />
Processed Food Crop Irrigation 2<br />
Food Crop Irrigation 3<br />
Restricted Recreational<br />
Impoundments 4<br />
State<br />
Treatment<br />
Quality Limits<br />
Required<br />
Treatment<br />
Quality Limits<br />
Required<br />
Treatment<br />
Quality Limits<br />
Required<br />
Treatment<br />
Quality Limits<br />
Required<br />
No detect. fecal Secondary No detect. fecal Secondary<br />
Arizona 1,000 fecal coli/100 ml Secondary Not covered Not covered coli/100 ml Filtration coli/100 ml<br />
Filtration<br />
2 NTU<br />
Disinfection 2 NTU<br />
Disinfection<br />
Cali<strong>for</strong>nia Not specified Oxidation Not specified Oxidation<br />
2.2 total coli/100<br />
ml<br />
2 NTU<br />
Oxidation<br />
Coagulation 5<br />
Filtration<br />
Disinfection<br />
2.2 total coli/100 ml<br />
Oxidation<br />
Disinfection<br />
Colorado Not covered Not covered Not covered Not covered Not covered Not covered Not covered Not covered<br />
Florida<br />
200 fecal coli/100 ml<br />
20 mg/L CBOD 6<br />
20 mg/l TSS 7<br />
Secondary<br />
Disinfection<br />
No detect. fecal<br />
coli/100 ml<br />
20 mg/L CBOD<br />
5 mg/L TSS<br />
Secondary<br />
Filtration<br />
Disinfection<br />
<strong>Use</strong> prohibited <strong>Use</strong> prohibited<br />
No detect. fecal<br />
coli/100 ml<br />
20 mg/L CBOD<br />
5 mg/L TSS<br />
Secondary<br />
Filtration<br />
Disinfection<br />
New Mexico<br />
(Policy)<br />
1,000 fecal coli/100 ml<br />
75 mg/L TSS<br />
30 mg/L BOD<br />
Not specified Not covered Not covered <strong>Use</strong> Prohibited <strong>Use</strong> Prohibited<br />
100 fecal coli/100 ml<br />
30 mg/L BOD<br />
30 mg/L TSS<br />
Not specified<br />
Utah<br />
200 fecal coli/100 ml<br />
25 mg/L BOD<br />
25 mg/L TSS<br />
Secondary<br />
Disinfection<br />
No detect. fecal<br />
coli/100 ml<br />
10 mg/L BOD<br />
2 NTU<br />
Secondary<br />
Filtration<br />
Disinfection<br />
No detect. fecal<br />
coli/100 ml<br />
10 mg/L BOD<br />
2 NTU<br />
Secondary<br />
Filtration<br />
Disinfection<br />
200 fecal coli/100 ml<br />
25 mg/L BOD<br />
25 mg/L TSS<br />
Secondary<br />
Disinfection<br />
Texas<br />
200 fecal coli/100 ml<br />
20 mg/L BOD<br />
15 mg/L CBOD<br />
Not specified<br />
200 fecal coli/100 ml<br />
20 mg/L BOD<br />
15 mg/L CBOD<br />
Not specified <strong>Use</strong> prohibited <strong>Use</strong> prohibited<br />
20 fecal coli/100 ml<br />
3 NTU<br />
5 mg/L BOD or<br />
CBOD<br />
Not specified<br />
Washington 240 total coli/100 ml<br />
Oxidation<br />
Disinfection<br />
240 total coli/100 ml<br />
Oxidation<br />
Disinfection<br />
2.2 total coli/100<br />
ml<br />
2 NTU<br />
Oxidation<br />
Coagulation<br />
Filtration<br />
Disinfection<br />
Oxidation<br />
2.2 total coli/100 ml<br />
Disinfection<br />
1<br />
In some states more restrictive requirements apply where milking animals are allowed to graze on pasture irrigated with reclaimed water.<br />
2<br />
Physical or chemical processing sufficient to destroy pathogenic microorganisms. Less restrictive requirements may apply where there is no direct contact between reclaimed<br />
water and the edible portion of the crop.<br />
3<br />
Food crops eaten raw where there is direct contact between reclaimed water and the edible portion of the crop.<br />
4<br />
Recreation is limited to fishing, boating, and other nonbody contact activities.<br />
5<br />
Not needed if filter effluent turbidity does not exceed 2 NTU, the turbidity of the influent to the filters is continually measured, the influent turbidity does not exceed 5 NTU <strong>for</strong><br />
more than 15 minutes and never exceeds 10 NTU, and there is capability to automatically activate chemical addition or divert the wastewater should the filter influent turbidity<br />
exceed 5 NTU <strong>for</strong> more than 15 minutes.<br />
6<br />
CBOD – Carbonaceous biochemical oxygen demand; where BOD is the same as Total BOD<br />
7 TSS – total suspended solids<br />
2-8 Craddock Consulting Engineers<br />
In Association with CDM & James Crook<br />
TM1-Sec2_0707.doc
Table 2.4. Examples of State <strong>Water</strong> Reuse Criteria <strong>for</strong> Selected Nonpotable Applications (cont’d)<br />
State<br />
Arizona<br />
Section 2<br />
Implementation Considerations<br />
Craddock Consulting Engineers 2-9<br />
In Association with CDM & James Crook<br />
TM1-Sec2_0707.doc<br />
Restricted Access Irrigation 1<br />
Quality Limits<br />
200 fecal<br />
coli/100 ml<br />
Cali<strong>for</strong>nia 23 total coli/100 ml<br />
Colorado<br />
Florida<br />
New Mexico<br />
(Policy)<br />
Utah<br />
Texas<br />
126 E.coli/100 ml<br />
30 mg/L TSS<br />
200 fecal coli/100 ml<br />
20 mg/L CBOD 6<br />
20 mg/l TSS 7<br />
200 fecal coli/100 ml<br />
30 mg/L BOD<br />
30 mg/L TSS<br />
200 fecal coli/100 ml<br />
25 mg/L BOD<br />
25 mg/L TSS<br />
200 fecal coli/100 ml<br />
20 mg/L BOD<br />
15 mg/L CBOD<br />
Washington 23 total coli/100 ml<br />
Treatment<br />
Required<br />
Secondary<br />
Disinfection<br />
Oxidation<br />
Disinfection<br />
Secondary<br />
Disinfection<br />
Secondary<br />
Disinfection<br />
Not specified<br />
Secondary<br />
Disinfection<br />
Not specified<br />
Oxidation<br />
Disinfection<br />
Unrestricted Access Irrigation 2<br />
Quality Limits<br />
No detect. fecal<br />
coli/100 ml<br />
2 NTU<br />
2.2 total coli/100 ml<br />
2 NTU<br />
126 E.coli/100 ml<br />
3 NTU<br />
No detect. fecal<br />
coli/100 ml<br />
20 mg/L CBOD<br />
5 mg/L TSS<br />
If within 100 ft of<br />
dwelling:<br />
5 fecal coli/100 ml<br />
10 mg/L BOD<br />
3 NTU<br />
No detect. fecal<br />
coli/100 ml<br />
10 mg/L BOD<br />
2 NTU<br />
20 fecal coli/100 ml<br />
3 NTU<br />
5 mg/L BOD or<br />
CBOD<br />
2.2 total coli/100 ml<br />
2 NTU<br />
Treatment<br />
Required<br />
Oxidation<br />
Filtration<br />
Disinfection<br />
Secondary<br />
Coagulation 4<br />
Filtration<br />
Disinfection<br />
Secondary<br />
Filtration<br />
Disinfection<br />
Secondary<br />
Filtration<br />
Disinfection<br />
Not specified<br />
Secondary<br />
Filtration<br />
Disinfection<br />
Not specified<br />
Oxidation<br />
Coagulation<br />
Filtration<br />
Disinfection<br />
Toilet Flushing 3 <strong>Industrial</strong> Cooling <strong>Water</strong> 4<br />
Quality Limits<br />
No detect. fecal<br />
coli/100 ml<br />
2 NTU<br />
2.2 total coli/100<br />
ml<br />
2 NTU<br />
Treatment<br />
Required<br />
Oxidation<br />
Filtration<br />
Disinfection<br />
Oxidation<br />
Coagulation 4<br />
Filtration<br />
Disinfection<br />
Not covered Not covered<br />
No detect. fecal<br />
coli/100 ml<br />
20 mg/L CBOD<br />
5 mg/L TSS<br />
100 fecal coli/100<br />
ml<br />
30 mg/L BOD<br />
30 mg/L TSS<br />
No detect. fecal<br />
coli/100 ml<br />
10 mg/L BOD<br />
2 NTU<br />
20 fecal coli/100<br />
ml<br />
3 NTU<br />
5 mg/L BOD or<br />
CBOD<br />
2.2 total coli/100<br />
ml<br />
2 NTU<br />
Secondary<br />
Filtration<br />
Disinfection<br />
Quality Limits<br />
Treatment<br />
Required<br />
Not covered Not covered<br />
2.2 total coli/100 ml<br />
2 NTU<br />
126 E.coli/100 ml<br />
30 mg/L TSS<br />
No detect. fecal<br />
coli/100 ml<br />
20 mg/L CBOD<br />
5 mg/L TSS<br />
Oxidation<br />
Coagulation 4<br />
Filtration<br />
Disinfection<br />
Secondary<br />
Disinfection<br />
Secondary<br />
Filtration<br />
Disinfection<br />
Not specified Not covered Not covered<br />
Secondary<br />
Filtration<br />
Disinfection<br />
Not specified<br />
Oxidation<br />
Coagulation<br />
Filtration<br />
Disinfection<br />
200 fecal coli/100 ml<br />
25 mg/L BOD<br />
25 mg/TSS<br />
200 fecal coli/100 ml<br />
20 mg/L BOD<br />
15 mg/L CBOD<br />
2.2 total coli/100 ml<br />
2 NTU<br />
1 Classification varies by state; generally includes irrigation of cemeteries, freeway medians, restricted access golf courses, and similar restricted access areas.<br />
2 Includes irrigation of parks, playgrounds, schoolyards, residential lawns, and similar unrestricted access areas.<br />
Secondary<br />
Disinfection<br />
Not specified<br />
Oxidation<br />
Coagulation<br />
Filtration<br />
Disinfection<br />
3 Not allowed in single-family residential dwelling units.<br />
4 Cooling towers where a mist is created that may reach populated areas.<br />
5 Not needed if filter effluent turbidity does not exceed 2 NTU, the turbidity of the influent to the filters is continually measured, the influent turbidity does not exceed 5 NTU <strong>for</strong><br />
more than 15 minutes and never exceeds 10 NTU, and there is capability to automatically activate chemical addition or divert the wastewater should the filter influent turbidity<br />
exceed 5 NTU <strong>for</strong> more than 15 minutes.<br />
6 CBOD – Carbonaceous biochemical oxygen demand; where BOD is the same as Total BOD<br />
7 TSS – total suspended solids
Section 2<br />
Implementation Considerations<br />
Craddock Consulting Engineers 2-10<br />
In Association with CDM & James Crook<br />
TM1-Sec2_0707.doc<br />
Common <strong>Use</strong>s. <strong>Water</strong> reuse regulations focus on public health implications of using<br />
the water, and water quality criteria not related to health protection usually are not<br />
included in water reuse regulations. Most states with extensive water reuse<br />
experience have comparable, conservatively-based water quality criteria or<br />
guidelines. Arguments <strong>for</strong> less restrictive standards are most often predicated upon a<br />
lack of documented health hazards rather than upon any certainty that hazards are<br />
small or nonexistent. In the absence of definitive epidemiological data and a unified<br />
interpretation of scientific and technical data on pathogen exposures, selection of<br />
water quality limits will continue to be somewhat subjective and inconsistent among<br />
the states. Regulatory requirements <strong>for</strong> some nonpotable uses of reclaimed water not<br />
included in Table 2.4 are summarized below and detailed in Appendix B.<br />
Wetlands. In most cases, the primary intent in applying reclaimed water to wetlands<br />
is to provide additional treatment of effluent prior to discharge or reuse, although<br />
wetlands are sometimes created solely <strong>for</strong> environmental enhancement. In such<br />
cases, secondary treatment is usually acceptable as influent to the wetland system.<br />
Very few states have regulations that specifically address the use of reclaimed water<br />
<strong>for</strong> creation of artificial wetlands or the restoration or enhancement of natural<br />
wetlands. Where there are no regulations, regulatory agencies prescribe requirements<br />
on a case-by-case basis. In addition to state requirements, natural wetlands, which are<br />
considered waters of the United States, are protected under EPA's NPDES Permit and<br />
<strong>Water</strong> Quality Standards programs. Constructed wetlands built and operated <strong>for</strong> the<br />
purpose of wastewater treatment generally are not considered waters of the United<br />
States.<br />
<strong>Industrial</strong> <strong>Use</strong>s Other than Cooling. Due to the myriad of industrial processes that<br />
use water, regulatory agencies generally prescribe water reuse requirements <strong>for</strong><br />
industrial applications other than cooling on an individual case basis. In many cases,<br />
the specific industrial reuse customer will have additional criteria (or more stringent<br />
criteria) than those imposed by the regulatory agency.<br />
Reclaimed water from conventional wastewater treatment processes is of adequate<br />
quality <strong>for</strong> many industrial applications that can tolerate water of less than potable<br />
quality. <strong>Industrial</strong> uses of reclaimed water include cooling, process water, stack<br />
scrubbing, boiler feed, wash water, transport of material, and as an ingredient in a<br />
nonfood-related product. Regulatory considerations <strong>for</strong> reuse of water in industrial<br />
applications include generation of aerosols, safety of manufactured products, and<br />
associated food and beverage production.<br />
For example, Florida regulations address the use of reclaimed water <strong>for</strong> food processing<br />
at industrial facilities. Florida’s reuse rule specifically prohibits the use of reclaimed<br />
water in the manufacture or processing of food or beverage <strong>for</strong> human consumption<br />
where the reclaimed water will be incorporated into or come in contact with the food<br />
or beverage product. Similarly, Washington standards do not allow the use of<br />
reclaimed water <strong>for</strong> food preparation and prohibit its use in food or drink <strong>for</strong> humans.
Section 2<br />
Implementation Considerations<br />
Craddock Consulting Engineers 2-11<br />
In Association with CDM & James Crook<br />
TM1-Sec2_0707.doc<br />
While many industrial uses require water of higher chemical quality than that<br />
typically present in reclaimed water (e.g., computer chip manufacturing requires<br />
reverse osmosis treatment to produce ultra-pure wash water), water reuse regulations<br />
are intended to provide health protection and only include requirements to attain that<br />
end.<br />
Miscellaneous Nonpotable <strong>Use</strong>s. While all states that have water reuse regulations<br />
or guidelines include criteria <strong>for</strong> crop and/or landscape irrigation, some include<br />
requirements <strong>for</strong> less common uses of reclaimed water, such as flushing sanitary<br />
sewers, street cleaning, dust control, soil compaction, making concrete, snowmaking,<br />
decorative fountains, commercial laundries, commercial car washes, equipment<br />
washing, and fire protection systems. For these and similar uses, the various state<br />
standards impose wastewater treatment process requirements, reclaimed water<br />
quality limits, and design and operational requirements reflective of the degree of<br />
human exposure to the water that are in concert with other more common uses of<br />
reclaimed water.<br />
For example, secondary treatment with a minimal level of disinfection is acceptable<br />
<strong>for</strong> uses where there is little or no expected human contact with the water, such as<br />
flushing sanitary sewers or making concrete. Conversely, uses such as snowmaking<br />
and vehicle washing are likely to result in contact with the reclaimed water, and<br />
tertiary treatment with a high level of disinfection is usually required.<br />
Regulatory Mandates<br />
States such as Cali<strong>for</strong>nia and Florida have regulations that mandate water reuse<br />
under certain conditions. The Florida <strong>Water</strong> Policy [Florida Department of<br />
Environmental Protection, 1995] establishes a mandatory reuse program that is<br />
actively en<strong>for</strong>ced. The policy requires that the state’s water management districts<br />
identify water resource caution areas that have water supply problems that have<br />
become critical or are anticipated to become critical within the next 20 years. State<br />
legislation requires preparation of water reuse feasibility studies <strong>for</strong> treatment<br />
facilities located within the water resource caution areas, and a “reasonable” amount<br />
of reclaimed water use from municipal wastewater treatment facilities is required<br />
within the designated water resource caution areas unless reuse is not economically,<br />
environmentally, or technically feasible. <strong>Water</strong> reuse also may be required outside of<br />
designated water resource caution areas if reclaimed water is readily available, reuse<br />
is economically, environmentally, and technologically feasible, and rules governing<br />
the imposition of requirements <strong>for</strong> reuse have been adopted in those areas by the<br />
water management district having jurisdiction.<br />
In Cali<strong>for</strong>nia, laws and regulations exist that mandate water reuse under certain<br />
conditions. Section 13550 of the Cali<strong>for</strong>nia <strong>Water</strong> Code states that the use of potable<br />
domestic water <strong>for</strong> nonpotable uses, including, but not limited to, cemeteries, golf<br />
courses, highway landscaped areas, and industrial and irrigation uses, is a waste or<br />
an unreasonable use of the water if reclaimed water is available which meets certain<br />
conditions [Cali<strong>for</strong>nia State <strong>Water</strong> Resources Control Board, 2000]. The conditions
Section 2<br />
Implementation Considerations<br />
are: the source of reclaimed water is of adequate quality <strong>for</strong> these uses and is<br />
available <strong>for</strong> these uses; reclaimed water may be furnished <strong>for</strong> these uses at a<br />
reasonable cost to the user; after concurrence with the State Department of Health<br />
Services, the use of reclaimed water from the proposed source will not be detrimental<br />
to public health; and use of reclaimed water <strong>for</strong> these uses will not adversely affect<br />
downstream water rights, will not degrade water quality, and is determined not to be<br />
injurious to plant life, fish and wildlife.<br />
The <strong>Water</strong> Code mandates that no person or public agency shall use water from any<br />
source or quality suitable <strong>for</strong> potable domestic use <strong>for</strong> nonpotable uses if suitable<br />
reclaimed water is available and meets the conditions stated above. Other sections of<br />
the code allow <strong>for</strong> mandating reclaimed water use <strong>for</strong> irrigation of residential<br />
landscaping, industrial cooling applications, and toilet and urinal flushing in<br />
nonresidential buildings. Some local jurisdictions in the state have taken action to<br />
require the use of reclaimed water in certain situations.<br />
U.S. EPA Guidelines <strong>for</strong> <strong>Water</strong> Reuse<br />
In recognition of the increasing role of water reuse as an integral component of the<br />
nation's water resources management – and to facilitate the orderly planning, design,<br />
and implementation of water reuse projects – the U.S. Environmental Protection<br />
Agency (EPA), in conjunction with the U.S. Agency <strong>for</strong> International Development,<br />
published Guidelines <strong>for</strong> <strong>Water</strong> Reuse in 1992 [U.S. Environmental Protection Agency,<br />
1992]. The U.S. EPA took the position that national water reuse standards were not<br />
necessary and comprehensive guidelines, coupled with flexible state regulations, would<br />
foster increased consideration and implementation of water reuse projects.<br />
The guidelines were updated in 2004 [U.S. Environmental Protection Agency, 2004] to<br />
include technological advances, research data, and other in<strong>for</strong>mation generated in the<br />
last decade. The guidelines address various aspects of water reuse and include<br />
recommended treatment processes, reclaimed water quality limits, monitoring<br />
frequencies, setback distances, and other controls <strong>for</strong> various water reuse<br />
applications. The suggested guidelines <strong>for</strong> wastewater treatment and reclaimed water<br />
quality are presented in Appendix B.<br />
It is explicitly stated in the Guidelines <strong>for</strong> <strong>Water</strong> Reuse that the recommended treatment<br />
unit processes and water quality limits presented in the guidelines “are not intended<br />
to be used as definitive water reclamation and reuse criteria. They are intended to<br />
provide reasonable guidance <strong>for</strong> water reuse opportunities, particularly in states that<br />
have not developed their own criteria or guidelines.” [U.S. Environmental Protection<br />
Agency, 2004].<br />
<strong>Water</strong> Reuse Criteria <strong>for</strong> <strong>Industrial</strong> <strong>Use</strong>s<br />
<strong>Water</strong> reuse criteria are principally directed at health and environmental protection<br />
and do not typically include water quality requirements that are unrelated to health<br />
and environmental protection. Examples of reclaimed water quality requirements <strong>for</strong><br />
2-12 Craddock Consulting Engineers<br />
In Association with CDM & James Crook<br />
TM1-Sec2_0707.doc
Section 2<br />
Implementation Considerations<br />
Craddock Consulting Engineers 2-13<br />
In Association with CDM & James Crook<br />
TM1-Sec2_0707.doc<br />
industrial applications <strong>for</strong> Cali<strong>for</strong>nia and Florida are provided in Tables 2.5 and 2.6,<br />
respectively.<br />
Table 2.5. Cali<strong>for</strong>nia <strong>Water</strong> <strong>Recycling</strong> Criteria (<strong>Industrial</strong> <strong>Use</strong>s)<br />
Total Coli<strong>for</strong>m<br />
Type of <strong>Use</strong><br />
Limits<br />
Cooling water where no mist created<br />
Process water where no worker contact<br />
Boiler feed<br />
Mixing concrete<br />
Cooling water where mist created 1<br />
Process water where worker contact likely<br />
≤ 23/100 ml<br />
≤ 2.2/100 ml<br />
1 Drift eliminator required; chlorine or other biocide required to treat cooling water to control<br />
Legionella and other microorganisms.<br />
2 Not required under certain conditions.<br />
Source: Adapted from State of Cali<strong>for</strong>nia [2000a].<br />
Table 2.6. Florida Reuse Rule (<strong>Industrial</strong> <strong>Use</strong>s)<br />
Wash water 1<br />
Process water 1<br />
Type of <strong>Use</strong> Total Coli<strong>for</strong>m Limits<br />
Once through cooling in closed<br />
system<br />
Once through cooling where mist<br />
created (alternative requirements<br />
acceptable if certain conditions<br />
met)<br />
≤ 200 fecal coli/100 ml<br />
≤ 30 mg/L BOD<br />
≤ 30 mg/L TSS<br />
≤ 30 mg/L BOD<br />
≤ 30 mg/L TSS<br />
No detectable fecal<br />
coli/100 ml<br />
≤ 20 mg/L BOD<br />
≤ 5 mg/L TSS<br />
Treatment<br />
Required<br />
Secondary<br />
Disinfection<br />
Secondary<br />
Coagulation 2<br />
Filtration<br />
Disinfection<br />
Treatment<br />
Required<br />
Secondary<br />
Disinfection<br />
Secondary<br />
Secondary<br />
Filtration<br />
Disinfection 2<br />
1<br />
Manufacture or processing of food or beverage where the water will be incorporated into or come in<br />
contact with the product is prohibited.<br />
2<br />
Reclaimed water must be sampled at least once every two years <strong>for</strong> Giardia and Cryptosporidium.<br />
Source: Adapted from Florida Department of Environmental Protection [1999].<br />
Implications of No <strong>Water</strong> Reuse Guidelines or Regulations<br />
Minnesota has not developed water reuse criteria and currently considers each water<br />
reuse project on a case-by-case basis, using Cali<strong>for</strong>nia’s <strong>Water</strong> <strong>Recycling</strong> Criteria as a<br />
guideline <strong>for</strong> imposition of standards. Case-by-case determination of reclaimed water
Section 2<br />
Implementation Considerations<br />
requirements can lead to inconsistencies in permit requirements across the state and<br />
may result in requirements that represent “moving targets,” leaving proponents<br />
unsure (and perhaps unable) to determine the requirements that may be placed on<br />
them. A statewide set of comprehensive water reuse regulations would provide<br />
definitive in<strong>for</strong>mation to assist industries and municipalities in the planning and<br />
implementation of projects. On the other hand, a case-by-case system can allow <strong>for</strong><br />
greater flexibility in developing reuse projects.<br />
2.3 Technical Considerations<br />
The main technical issues that must be addressed with water reuse involve water<br />
quality and conveyance of water from the WWTP to the industry. The most costeffective<br />
source would be one where the wastewater effluent water quality meets all<br />
the industrial water quality criteria and conveyance requirements are minor. In most<br />
cases, some additional treatment is required to meet the industrial process<br />
requirements or health-related criteria. This section will provide some general<br />
industry water quality requirements and issues with reclaimed water use. Treatment<br />
requirements and technologies are summarized <strong>for</strong> several industrial uses.<br />
Conveyance considerations are very site specific and are not discussed in this<br />
Technical Memorandum. However, an assessment of conveyance requirements will<br />
be conducted as part of Task 2 of this project.<br />
<strong>Water</strong> Quality<br />
<strong>Industrial</strong> <strong>Water</strong> Quality Concerns<br />
Due to the myriad of industrial processes that use water and site-specific conditions,<br />
regulatory agencies generally prescribe water reuse requirements on an individual<br />
case basis, except <strong>for</strong> some common widespread uses such as cooling water.<br />
Reclaimed water from conventional wastewater treatment processes is of adequate<br />
quality <strong>for</strong> many industrial applications that can tolerate water of less than potable<br />
quality, and it has the important advantage of being a reliable supply. Industries are<br />
often located near populated areas that generate large volumes of wastewater.<br />
<strong>Industrial</strong> uses of reclaimed water include cooling, process water, stack scrubbing,<br />
boiler feed, washing, transport of material, and as an ingredient in a product. Cooling<br />
is the predominant reuse application, accounting <strong>for</strong> more than 90 percent of the total<br />
volume of reclaimed water used <strong>for</strong> industrial purposes.<br />
Cooling <strong>Water</strong>. Pathogenic microorganisms in reclaimed water used in cooling<br />
towers present potential hazards to workers and to the public in the vicinity of<br />
cooling towers from aerosols and windblown spray. In practice, however, biocides<br />
are usually added to all cooling waters onsite to prevent slimes and otherwise inhibit<br />
microbiological activity, which has the secondary effect of eliminating or greatly<br />
diminishing the potential health hazard associated with aerosols or windblown spray.<br />
Aerosols produced in the workplace or from cooling towers also may present hazards<br />
from the inhalation of VOCs, and although little definitive research has been done in<br />
this area, there has been no indication that VOCs have created health problems at any<br />
existing water reuse site. Closed-loop cooling systems using reclaimed water present<br />
2-14 Craddock Consulting Engineers<br />
In Association with CDM & James Crook<br />
TM1-Sec2_0707.doc
Section 2<br />
Implementation Considerations<br />
Craddock Consulting Engineers 2-15<br />
In Association with CDM & James Crook<br />
TM1-Sec2_0707.doc<br />
minimal health concerns unless there is inadvertent or intentional misuse of the<br />
water.<br />
There is no indication that reclaimed water is more likely to contain Legionella<br />
pneumophila bacteria than waters of non-sewage origin. All cooling water systems<br />
should be operated and maintained to reduce the Legionella threat, regardless of the<br />
origin of the source water.<br />
In general, the major problems related to power plants employing municipal effluents<br />
as makeup water are scale <strong>for</strong>mation, corrosion, foaming, and biological fouling due<br />
to high residual organic substrate and nutrient concentrations in the wastewater.<br />
These problems are caused by contaminants in potable water as well as reclaimed<br />
water, but the concentrations of some contaminants in reclaimed water may be<br />
higher.<br />
Cooling water should not lead to the <strong>for</strong>mation of scale, i.e. hard deposits in the<br />
cooling system. Such deposits reduce the efficiency of the heat exchange. The<br />
principal causes of scaling are calcium (as carbonate, sulfate, and phosphate) and<br />
magnesium (as carbonate and phosphate) deposits. Scale control <strong>for</strong> reclaimed water<br />
is achieved through chemical means and sedimentation. Acidification or addition of<br />
scale inhibitors can control scaling. Acids (sulfuric, hydrochloric, and citric acids and<br />
acid gases such as carbon dioxide and sulfur dioxide) and other chemicals (chelants<br />
such as EDTA and polymeric inorganic phosphates) are often added <strong>for</strong> pH and<br />
alkalinity control to increase the water solubility of scale-<strong>for</strong>ming constituents, such as<br />
calcium and magnesium. Lime softening removes carbonate hardness and soda ash<br />
removes noncarbonate hardness. Other methods used to control scaling are alum<br />
treatment and sodium ion exchange.<br />
High levels of dissolved solids, ammonia, and heavy metals in reclaimed water can<br />
cause serious increased corrosion rates [Puckorius and Hess, 1991]. The<br />
concentrations of TDS in municipally treated reclaimed water can increase electrical<br />
conductivity and promote corrosion. Ammonia can induce corrosion in copper-based<br />
alloys. Dissolved gases and certain metals with high oxidation states also promote<br />
corrosion. For example, heavy metals, particularly copper, can plate out on mild<br />
steel, causing severe pitting. Corrosion also may occur when acidic conditions<br />
develop in the cooling water. Corrosion inhibitors such as chromates,<br />
polyphosphates, zinc, and polysilicates can be used to reduce the corrosion potential<br />
of the cooling water. These substances may have to be removed from the blowdown<br />
prior to discharge. An alternative to chemical addition is ion exchange or reverse<br />
osmosis.<br />
Reclaimed water used in cooling systems should not supply nutrients or organic<br />
matter that promote the growth of slime-<strong>for</strong>ming organisms. The moist environment<br />
in the cooling tower is conducive to biological growth. Microorganisms can<br />
significantly reduce the heat transfer efficiency, reduce water flow, and in some cases
Section 2<br />
Implementation Considerations<br />
generate corrosive by-products [Cali<strong>for</strong>nia State <strong>Water</strong> Resources Control Board,<br />
1980].<br />
Sulfide-producing bacteria and sulfate-reducing bacteria are the most common<br />
corrosion-causing organisms in cooling systems using reclaimed water. These<br />
anaerobic sulfide producers occur beneath deposits and cause pitting corrosion that is<br />
most severe on mild and stainless steels. Serious corrosion is caused by thiobaccillus<br />
bacteria, an acid-producer that converts sulfides to sulfuric acid. Similarly, nitrifying<br />
bacteria can convert ammonia to nitric acid, thus causing pH depression, which<br />
increases corrosion on most metals.<br />
Removal of BOD and nutrients during treatment reduces the potential of the<br />
reclaimed water to sustain microorganisms. Chlorine is the most common biocide<br />
used to control biological growth because of its low cost, availability, and ease of<br />
operation. Chlorination is also used as a disinfectant to reduce potential pathogens in<br />
the reclaimed water. Frequent chlorination and shock treatment are generally<br />
adequate.<br />
Non-oxidizing microbiocides are generally required in addition to chlorine because of<br />
the high nutrient content typically found in wastewater. Since most scale inhibitors<br />
and dispersants are anionic, either anionic or nonionic biocides are usually used.<br />
Low-foaming, nonionic surfactants enhance microbiological control by allowing the<br />
microbiocides to penetrate the biological slimes. Chemical coagulation and filtration<br />
during the phosphorus removal treatment phase significantly reduce the<br />
contaminants that can lead to fouling. Chemical dispersants are also used as<br />
required.<br />
In many cases, power plants utilize disinfected secondary effluent <strong>for</strong> cooling water,<br />
although additional treatment often is needed <strong>for</strong> recirculating cooling systems.<br />
Additional treatment may include lime or alum treatment, filtration, ferric chloride<br />
precipitation, ion exchange, and reverse osmosis. In some cases, only additional<br />
chemical treatment is necessary, which may include many of the chemicals mentioned<br />
above and others, such as phosphonates or calcium phosphate <strong>for</strong> destabilization,<br />
polyacrylates <strong>for</strong> suspended solids dispersion, and anti-foaming agents <strong>for</strong> dispersion<br />
of foam caused by phosphates and some organic compounds.<br />
Boiler Feed <strong>Water</strong>. The use of reclaimed water <strong>for</strong> boiler feed water often requires<br />
extensive additional treatment and is not a common use of reclaimed water. Quality<br />
requirements <strong>for</strong> boiler-feed makeup water are dependent upon the pressure at which<br />
the boiler is operated. Generally, the higher the pressure, the higher the quality of<br />
water required.<br />
Reclaimed water must be treated to remove hardness. Calcium and magnesium salts<br />
are the principal contributors to scale <strong>for</strong>mation and deposits in boilers. Excessive<br />
alkalinity contributes to foaming and results in deposits in heater, reheater, and<br />
turbine units. Bicarbonate alkalinity, under the influence of boiler heat, may lead to<br />
2-16 Craddock Consulting Engineers<br />
In Association with CDM & James Crook<br />
TM1-Sec2_0707.doc
Section 2<br />
Implementation Considerations<br />
Craddock Consulting Engineers 2-17<br />
In Association with CDM & James Crook<br />
TM1-Sec2_0707.doc<br />
the release of carbon dioxide, which is a source of corrosion in steam-using<br />
equipment. Silica and aluminum <strong>for</strong>m a hard scale on heat-exchanger surfaces, while<br />
high concentrations of potassium and sodium can cause excessive foaming in the<br />
boiler. Depending on the characteristics of the reclaimed water, lime treatment<br />
(including flocculation, sedimentation, and recarbonation) may be required, possibly<br />
followed by multi-media filtration, carbon adsorption, and nitrogen removal. Highpurity<br />
boiler-feed water <strong>for</strong> high-pressure boilers might also require treatment by<br />
reverse osmosis or ion exchange [Meyer, 1991]. The considerable treatment and the<br />
relatively small amounts of makeup required make boiler-feed a poor candidate <strong>for</strong><br />
reclaimed water.<br />
Process <strong>Water</strong>. The suitability of reclaimed water <strong>for</strong> use in industrial processes<br />
depends on the particular use and is highly variable. For example, the electronics<br />
industry requires a very high water quality <strong>for</strong> washing circuit boards and other<br />
electronic components. On the other hand, the tanning industry can use relatively<br />
low-quality water. Requirements <strong>for</strong> textiles, pulp and paper, and metal fabricating<br />
are intermediate.<br />
<strong>Use</strong> of reclaimed water in the paper and pulp industry is a function of the grade of<br />
paper produced. The higher the quality of the paper, the more sensitive it is to water<br />
quality. Impurities found in water, particularly certain metal ions and color bodies,<br />
can cause the paper to change color with age. Biological growth can cause clogging of<br />
equipment and odors and can affect the texture and uni<strong>for</strong>mity of the paper.<br />
Corrosion and scaling of equipment may result from the presence of silica, aluminum,<br />
and hardness. Discoloration of paper may occur due to iron, manganese, or microorganisms.<br />
Suspended solids may decrease the brightness of the paper.<br />
<strong>Water</strong> used in textile manufacturing must be nonstaining; hence, it should be low in<br />
turbidity, color, iron, and manganese. Hardness causes curds to deposit on the textiles<br />
and causes problems in some of the processes that use soap. Nitrates and nitrites may<br />
cause problems in dyeing.<br />
Recommended <strong>Industrial</strong> <strong>Water</strong> Quality<br />
Each industrial use of reclaimed water has unique water quality requirements, and it<br />
is not possible to elaborate on the recommended requirements <strong>for</strong> the myriad of<br />
possible industrial applications in Minnesota. However, water quality guidelines are<br />
available <strong>for</strong> some common industrial uses of water, such as cooling water (Table 2.7)<br />
and boiler feed water (Table 2.8). Recommended water quality <strong>for</strong> several other<br />
industrial applications are listed in Table 2.9.<br />
Tables 2.7-2.9 demonstrate that the water quality requirements vary considerably with<br />
the type of industry and specific processes. Requirements <strong>for</strong> specific Minnesota<br />
industries will be presented in the project final report as part of Task 2 work activities.
Section 2<br />
Implementation Considerations<br />
Table 2.7. Recommended Cooling <strong>Water</strong> Quality<br />
(Makeup <strong>for</strong> Recirculating Systems)<br />
Parameter Recommended Limit (mg/L)<br />
Alkalinity 350<br />
Aluminum 0.1<br />
Ammonia 24<br />
Bicarbonate 200<br />
Calcium 50<br />
Chloride 500<br />
Hardness 650<br />
Iron 0.5<br />
Manganese 0.5<br />
Phosphorous 1.0<br />
Silica 50<br />
Total Suspended<br />
100<br />
Solids<br />
Sulfate 200<br />
Total Dissolved Solids 500<br />
Source: Adapted from <strong>Water</strong> Pollution Control Foundation [1989]<br />
and Goldstein et al. [1979].<br />
Table 2.8. Recommended <strong>Industrial</strong> Boiler Feed <strong>Water</strong> Quality<br />
Recommended Limit (mg/L)<br />
Parameter Low Pressure Medium Pressure High Pressure<br />
(700 psig)<br />
Alkalinity 350 100 40<br />
Aluminum 5 0.1 0.01<br />
Ammonia 0.1 0.1 0.1<br />
Bicarbonate 170 120 48<br />
Calcium * 0.4 0.01<br />
Chemical Oxygen<br />
Demand<br />
5 5 1<br />
Copper 0.5 0.05 0.05<br />
Dissolved Oxygen 2.5 0.007 0.007<br />
Hardness 350 1.0 0.07<br />
Iron 1.0 0.3 0.05<br />
Magnesium * 0.25 0.01<br />
Manganese 0.3 0.1 0.01<br />
Silica 30 10 0.7<br />
Suspended Solids 10 5 0.5<br />
TDS 700 500 200<br />
Zinc * 0.01 0.01<br />
Source: Adapted from various sources.<br />
2-18 Craddock Consulting Engineers<br />
In Association with CDM & James Crook<br />
TM1-Sec2_0707.doc
Section 2<br />
Implementation Considerations<br />
Craddock Consulting Engineers 2-19<br />
In Association with CDM& James Crook<br />
TM1-Sec2_0707.doc<br />
Table 2.9. <strong>Industrial</strong> Process <strong>Water</strong> Quality Requirements<br />
Parameter*<br />
Mechanical<br />
Pulping<br />
Pulp & Paper Textiles<br />
Chemical,<br />
Unbleached<br />
Pulp &<br />
Paper<br />
Bleached<br />
Chemical<br />
Petrochem<br />
& coal Sizing<br />
Suspension<br />
Scouring,<br />
Bleach &<br />
dye<br />
Cu -- -- -- -- 0.05 0.01 -- --<br />
Fe 0.3 1.0 0.1 0.1 1.0 0.3 0.1 2.5<br />
Mn 0.1 0.5 0.05 0.1 -- 0.05 0.01 0.5<br />
Ca -- 20 20 68 75 -- -- --<br />
Mg -- 12 12 19 30 -- -- --<br />
Cl 1,000 200 200 500 300 -- -- 250<br />
HCO3 -- -- -- 128 -- -- -- --<br />
NO3 -- -- -- 5 -- -- -- --<br />
SO4 -- -- -- 100 -- -- -- 250<br />
SiO2 -- 50 50 50 -- -- -- 35<br />
Hardness -- 100 100 250 350 25 25 --<br />
Alkalinity -- -- -- 125 -- -- -- 400<br />
TDS -- -- -- 1,000 1,000 100 100 600<br />
TSS -- 10 10 5 10 5 5 500<br />
Color 30 30 10 20 -- 5 5 --<br />
Cement<br />
pH 6 – 10 6 – 10 6 – 10 6.2 – 8.3 6 – 9 -- -- 6.5 – 8.5<br />
CCE -- -- -- -- -- -- -- 1<br />
*All values in mg/L except color and pH.<br />
Source: <strong>Water</strong> Pollution Control Federation [1989].
Treatment Requirements and Technologies<br />
Section 2<br />
Implementation Considerations<br />
The treatment requirements <strong>for</strong> industrial reuse applications will be based on the<br />
quality of the source water used by a community, industries discharging to the<br />
wastewater treatment facility, the wastewater treatment processes, and the intended<br />
use of the water by the industry. The type of technology selected will depend on<br />
whether treatment is incorporated into the wastewater treatment facility’s process<br />
train, at the industry, or at a satellite facility along the distribution line that could<br />
benefit multiple customers. If storage is required <strong>for</strong> a constant flow, additional<br />
treatment may be required. With all these variables, the treatment process and<br />
conveyance system selected is certainly a site and case-specific one.<br />
This subsection presents an overview of treatment processes used to provide<br />
reclaimed water to industries, as well as other customers. More specific treatment<br />
requirements will be identified <strong>for</strong> the Minnesota candidate industries selected under<br />
Task 2 work activities and will be presented in the project final report.<br />
<strong>Wastewater</strong> Plant Effluent Quality<br />
The constituent concentrations in wastewater plant effluent are different <strong>for</strong> every<br />
facility. However, given common permit limits, some constituent concentrations are<br />
universal to most facilities based on the general treatment trains as presented in Table<br />
2.10. In Minnesota, all municipal wastewater treatment facilities have secondary<br />
treatment and many have nutrient removal processes, particularly <strong>for</strong> nitrogen. Many<br />
plant upgrades will likely include the requirement <strong>for</strong> phosphorus removal. There are<br />
few facilities in Minnesota that have filtration processes, but this practice may become<br />
increasingly common as receiving streams reach their maximum load capacity and<br />
additional pollutant removal is necessary.<br />
Table 2.10. Typical <strong>Wastewater</strong> Treatment Plant Effluent Quality<br />
Constituent Secondary<br />
Treatment<br />
Constituent Concentration, mg/L<br />
Secondary<br />
Treatment with<br />
Nutrient Removal*<br />
2-20 Craddock Consulting Engineers<br />
In Association with CDM & James Crook<br />
TM1-Sec2_0707.doc<br />
Tertiary<br />
Treatment with<br />
Filtration<br />
BOD 5-20 5-10
Section 2<br />
Implementation Considerations<br />
Craddock Consulting Engineers<br />
In Association with CDM & James Crook 2-21<br />
TM1-Sec2_0707.doc<br />
reclaimed water. However, some contaminants may occur in higher concentrations in<br />
reclaimed water, and will vary highly with the water source, the industrial and<br />
domestic wastewater influent characteristics, and wastewater treatment processes.<br />
Table 2.11 demonstrates the variability in reclaimed water quality <strong>for</strong> constituents of<br />
concern <strong>for</strong> many industries.<br />
Treatment Processes<br />
Cooling and Process <strong>Water</strong>. The overview of industrial water quality concerns in the<br />
preceding subsection identified treatment practices <strong>for</strong> industrial water use <strong>for</strong><br />
cooling water and boiler feed water. The treatment processes commonly used <strong>for</strong><br />
industrial cooling water are shown in Figure 2.1. Nitrification is usually used to<br />
remove ammonia that causes stress in copper based alloy pipes. Ferric chloride or<br />
alum is used to precipitate phosphorus to levels less than 0.6 mg/L, to avoid<br />
precipitation and scale <strong>for</strong>mation.<br />
Table 2.11. Florida and Cali<strong>for</strong>nia Reclaimed <strong>Water</strong> Quality – <strong>Industrial</strong><br />
Constituents of Concern<br />
<strong>Water</strong> Constituent Orlando Tampa Los Angeles San<br />
(mg/L)<br />
Francisco<br />
Conductivity, umho/m 1200-1800 600-1500 2000-2700 800-1200<br />
Calcium Hardness 180-200 100-120 260-450 50-180<br />
Total Alkalinity 150-200 60-100 140-280 30-120<br />
Chlorides 20-40 30-80 250-350 40-200<br />
Phosphate 18-25 10-20 300-400 20-70<br />
Ammonia 10-15 5-15 4-20 2-8<br />
Total Suspended Solids 3-5 3-5 10-45 2-10<br />
Source: U.S. EPA Guidelines <strong>for</strong> <strong>Water</strong> Reuse [2004]<br />
Secondary<br />
Effluent<br />
Nitrification<br />
Flocculation Clarification<br />
Filtration<br />
Figure 2.1. Typical Treatment Train of Reclaimed <strong>Water</strong> <strong>for</strong> Power Plant Cooling <strong>Water</strong><br />
Disinfection
Section 2<br />
Implementation Consideration s<br />
Many Minnesota WWTP process trains include nitrification, clarification and<br />
disinfection. Additional processes needed to provide the quality required <strong>for</strong> cooling<br />
water include chemical addition/mixing (flocculation) and filtration.<br />
Disinfection. Disinfection is required <strong>for</strong> all uses of reclaimed water to meet the<br />
pathogen standards and protect public health. While Minnesota’s municipal<br />
wastewater treatment facilities have disinfection requirements, the level of treatment<br />
may not meet the lower pathogen requirements <strong>for</strong> some industrial uses. Chlorine<br />
disinfection is the most commonly used practice in Minnesota. Higher chlorine<br />
dosages and contact time may be required <strong>for</strong> reclaimed water uses. For plants under<br />
capacity this may be a minor modification; if the plant is running closer to capacity,<br />
then additional basin volume and/or chemical feed equipment may be needed to<br />
meet the required contact times.<br />
UV disinfection is used at many wastewater treatment facilities and is becoming more<br />
common at Minnesota facilities. Its application is dependent on the wastewater<br />
effluent characteristics and site-specific economics. While there are several factors to<br />
evaluate to determine if UV is the optimum disinfection practice, better per<strong>for</strong>mance<br />
is typically achieved with lower suspended solids and smaller particle sizes. Hence,<br />
<strong>for</strong> plants with process trains with filters, UV may be the cost-effective technology to<br />
achieve the higher levels of disinfection required <strong>for</strong> most reuse applications. UV<br />
disinfection has been successfully used <strong>for</strong> reclamation water production to achieve<br />
fecal coli<strong>for</strong>ms of less than 20/100 ml [Smith and Brown, 2002], a limit that provides<br />
the pathogen protection required <strong>for</strong> many reuse practices. In addition to meeting<br />
pathogen limits prior to leaving a facility, a disinfectant residual is typically<br />
maintained in the transmission lines to the reuse customer. Chlorine residuals of 0.5<br />
mg/L or greater in the conveyance system are typically recommended to reduce<br />
odors, slime and bacterial growth.<br />
Other Processes. The majority of reuse applications, particularly <strong>for</strong> industries, will<br />
require advanced wastewater treatment processes. The general processes that have<br />
been used <strong>for</strong> water reclamation include:<br />
Filtration<br />
UV Treatment of n-nitrosodimethylamine (NDMA)<br />
Nitrification<br />
Denitrification<br />
Phosphorus Removal<br />
Carbon Adsportion<br />
Membrane Processes<br />
2-22 Craddock Consulting Engineers<br />
In Association with CDM & James Crook<br />
TM1-Sec2_0707.doc
Section 2<br />
Implementation Considerations<br />
Craddock Consulting Engineers<br />
In Association with CDM & James Crook 2-23<br />
TM1-Sec2_0707.doc<br />
Filtration, nitrification, denitrification, and phosphorus removal are processes that are<br />
commonly used at municipal wastewater treatment facilities. In 20 years, Minnesota<br />
regulations will likely be in place that could require these or alternate new processes<br />
to meet discharge limits. Carbon adsorption and UV treatment of NDMA are<br />
processes used to address specific organic contaminant removal. NDMA is a potent<br />
carcinogen produced with use of chlorine or chloramines <strong>for</strong> disinfection. To address<br />
concerns with NDMA and other trace organics in reclaimed water, several utilities in<br />
Cali<strong>for</strong>nia have installed UV/hydrogen peroxide treatment systems <strong>for</strong> treatment of<br />
reverse osmosis permeate [CDM, 2004].<br />
Carbon adsorption, a process used by potable water supply systems <strong>for</strong> taste and<br />
odor control or removal of organic contaminants, can be used to reduce the<br />
biodegradable and refractory organic constituents in wastewater effluent. Carbon<br />
adsorption following a secondary treatment and filtration treatment train can produce<br />
an effluent with a BOD of 0.1-5 mg/L, a COD of 3-25 mg/L and a TOC of 1-6 mg/L.<br />
It can also be used to remove several metal ions, particularly cadmium, hexavalent<br />
chromium, silver, and selenium. Activated carbon has also been used to remove<br />
uncharged elements such as arsenic and antimony from an acidic stream. Endocrine<br />
disrupting compounds have also been successfully removed with activated carbon<br />
[Hunter and Long, 2002]. The use of activated carbon <strong>for</strong> reclaimed water would be a<br />
very industry specific requirement.<br />
Given that filtration is typically required<br />
prior to the carbon adsportion process,<br />
and that most municipal plants in<br />
Minnesota do not have filters, a different<br />
technology, notably membranes, might<br />
be selected to meet organic and metal<br />
removal goals, as well as serve other<br />
process needs.<br />
Membrane processes are moving into the<br />
wastewater treatment arena. They have<br />
been used <strong>for</strong> water reclamation in much<br />
the same capacity as <strong>for</strong> potable water<br />
supply treatment. Figure 2.2 shows a<br />
Figure 2.2. Membrane System <strong>Use</strong>d as a<br />
Tertiary Treatment Process.<br />
typical membrane system <strong>for</strong> tertiary treatment. New technologies are providing the<br />
ability to use membranes in the secondary process train. This advancement provides<br />
flexibility and/or simplification of the process train to meet wastewater process<br />
per<strong>for</strong>mance goals and produce the higher quality effluent required <strong>for</strong> many reuse<br />
applications.<br />
The type of membrane used is dependent on the various quality goals. As an<br />
extension from potable water industry applications, membranes are typically<br />
characterized by the pathogen requirements as shown in Figure 2.3. For industries,<br />
other constituents are targeted to select the proper membrane system. The West Basin<br />
<strong>Municipal</strong> <strong>Water</strong> District of Carson, Cali<strong>for</strong>nia, produces several grades of reclaimed
Section 2<br />
Implementation Considerations<br />
Craddock Consulting Engineers<br />
In Association with CDM & James Crook 2-25<br />
TM1-Sec2_0707.doc<br />
the treatment costs <strong>for</strong> broad industry categories based upon the treatment<br />
technologies typically associated with the water quality requirements <strong>for</strong> that<br />
industry. This review focuses on industries more prevalent in Minnesota and only<br />
defines the treatment costs, specifically the equipment capital costs. O&M costs are<br />
highly variable with source water quality characteristics and industry finished water<br />
requirements. O&M costs will be reviewed in Task 2 of the project. Similarly, costs<br />
associated with pumping and conveyance facilities are not included in this<br />
preliminary review of treatment costs.<br />
The water supply treatment costs <strong>for</strong> several industry categories are negligible. Power<br />
generation facilities using once-through cooling processes require large volumes of<br />
water, but of lower quality. In most instances in Minnesota, river water is used with<br />
little to no treatment. Sand and gravel washing operations also have low water<br />
quality requirements and require no additional treatment from the source supply.<br />
Cooling water used <strong>for</strong> power generation or other industry process needs that uses a<br />
recirculating process has more restrictive water quality requirements. Some smaller<br />
facilities may use a municipal water supply and no other treatment if the water<br />
quality meets the constituent thresholds. Industries using larger volumes of water,<br />
will likely use a ground water supply if it is available. If it is not available, a surface<br />
water source would be used. Higher levels of treatment are required <strong>for</strong> a surface<br />
water source that is higher in solids, organics, and contains pathogens. Some ground<br />
water supplies high in total dissolved solids (TDS) and other constituents may also<br />
require additional treatment. If a standard chemical addition, coagulation,<br />
flocculation, sedimentation, filtration and disinfection process is used, the capital cost<br />
would be approximately $1.5 per gpd of treatment capacity <strong>for</strong> a facility treating 1<br />
mgd or less based on cost curves escalated to June 2006 costs [James M. Montgomery,<br />
Consulting Engineers, 1985].<br />
Microfiltration or ultrafiltration may be a more appropriate technology to provide<br />
cooling water <strong>for</strong> recirculating systems or <strong>for</strong> boiler feed water, which typically<br />
requires a higher quality water, or <strong>for</strong> other industry processes. The capital costs <strong>for</strong><br />
micro and ultrafiltration decrease with the volume of water processed: costs on a per<br />
mgd basis are much higher <strong>for</strong> membrane plants less than 1 mgd, decrease rapidly<br />
from 1 to 10 mgd and then the cost per mgd is relatively flat after 10 mgd [AWWARF,<br />
2005]. While these costs are based on larger, municipal system supplies, the lower<br />
volume costs are applicable. The total membrane system cost <strong>for</strong> a 1 mgd system is<br />
estimated to be $2.1 million <strong>for</strong> a 0.5 mgd system ($4.20/gpd) and $2.4 million <strong>for</strong> a 1<br />
mgd system ($2.40/gpd) based on cost curves published in 2005 and escalated to June<br />
2006 costs [AWWARF, 2005].<br />
A majority of industries use municipal water <strong>for</strong> their industrial processing water<br />
supply. The costs of water supplies in the metro area range from $0.75 to $3.50 per<br />
1,000 gallons of water, based on an analysis of municipal system pricing structures in<br />
2002 [Metropolitan Council, 2004]. Ground water supplies typically have a lower
Section 2<br />
Implementation Consideration s<br />
pricing structure, between $1.50-$2.00 per 1,000 gallons, and surface supplies were in<br />
the $2.50-$3.00 per 1,000 gallon cost range.<br />
Industries requiring additional removal of color or organic compounds, as in the<br />
pulp&paper or textile industry, may use granular activated carbon (GAC) treatment<br />
technology. The cost <strong>for</strong> GAC treatment equipment (following a standard treatment<br />
process as described <strong>for</strong> cooling water) ranges from $75,000 <strong>for</strong> a 0.1 mgd system<br />
($0.75/gpd) to $500,000 <strong>for</strong> a 1 mgd system ($0.5/gpd), based on cost curves <strong>for</strong><br />
smaller GAC systems with a 10 minute empty bed contact time [U.S. EPA, 2005]. This<br />
does not include GAC replacement costs.<br />
The metal finishing and electronics industries require high quality water. In some<br />
instances and <strong>for</strong> some processing needs potable supplies are adequate. However,<br />
often reverse osmosis technology is used to obtain the water quality required <strong>for</strong> this<br />
industry. The costs <strong>for</strong> reverse osmosis system with a capacity in the 1 mgd range<br />
(assuming pretreatment with a microfiltration process) is between $1.80-$2.00 per<br />
gpd, based on cost curves scaled to June 2006 [AWWARF, 1996]. A demonstration<br />
study using reclaimed water at an electronics facility indicated that the costs to treat<br />
reclaimed water were comparable to those treating the municipal supply currently<br />
used. This study focused on the operating costs of a microfiltration followed by<br />
reverse osmosis process train. The costs to treat the reclaimed water were $3.78/1,000<br />
gallons and <strong>for</strong> the potable supply were $4.50/1,000 gallons [Gagliardo, P. et al, 2002].<br />
2.4 Institutional Considerations<br />
There are several institutional issues that need to be addressed. Laws, policies, rules,<br />
and regulations that affect the planning and implementation of water reuse projects<br />
include – <strong>for</strong> example – water rights, conflicting laws and regulations, permitting,<br />
local planning ordinances, environmental assessment and impact, public<br />
involvement/education, legal agreements or contracts, agency jurisdictions, fee<br />
structures, etc. Task 2 of this project involves working with key state agencies<br />
(MPCA, MDH, and MDNR) to identify their specific roles as they relate to water reuse<br />
and develop recommendations regarding potential policies and regulations that are in<br />
concert with each other.<br />
2.5 Examples of Reuse in Minnesota and <strong>Industrial</strong> Reuse<br />
Minnesota Reuse Applications<br />
The first uses of reclaimed water in Minnesota were <strong>for</strong> agricultural irrigation, mainly<br />
because the wastewater treatment facilities did not have an acceptable receiving<br />
stream. More recent reuse applications involve golf course irrigation in urban and<br />
resort areas, and as toilet flush water <strong>for</strong> an institutional building. In the majority of<br />
these cases the driver <strong>for</strong> reuse was to provide a discharge <strong>for</strong> the wastewater<br />
generated onsite. Table 2.12 provides a list of facilities that are using treated,<br />
municipal wastewater effluent in Minnesota. The one industrial application, use of<br />
cooling water <strong>for</strong> the Mankato Energy Center, is discussed below.<br />
2-26 Craddock Consulting Engineers<br />
In Association with CDM & James Crook<br />
TM1-Sec2_0707.doc
Section 2<br />
Implementation Considerations<br />
Craddock Consulting Engineers<br />
In Association with CDM & James Crook 2-27<br />
TM1-Sec2_0707.doc<br />
Table 2.12. <strong>Wastewater</strong> Reuse Facilities in Minnesota<br />
Facility Type of Reuse<br />
Flow,<br />
mgd<br />
Treatment Type<br />
Hennepin County Public Toilet Flush 0.0056 Activated sludge, activated<br />
Works<br />
<strong>Water</strong><br />
carbon, membrane filtration<br />
(Zenon, Inc.)<br />
Lake Allie Golf course 0.0056 Activated sludge, activated<br />
irrigation<br />
carbon, membrane filtration<br />
(Zenon, Inc.)<br />
Turtle Run South Golf course<br />
irrigation<br />
0.0168 Recirculating gravel filter<br />
Izaty’s Golf and Yacht Golf course and 0.086 Recirculating gravel filter, sand<br />
Club<br />
alfalfa field<br />
irrigation<br />
filter<br />
City of Nisswa Golf course 0.038 Aerated stabilization ponds, dual<br />
irrigation and<br />
other uses<br />
media filter<br />
City of Montgomery Golf course<br />
irrigation<br />
0.1 Aerated ponds, sand filter<br />
City of Mankato <strong>Industrial</strong><br />
6.2 Disinfected tertiary recycled<br />
(cooling water <strong>for</strong><br />
power plant)<br />
water<br />
Sources: Communications with MPCA and City of Mankato [April 2006]<br />
Cooling <strong>Water</strong><br />
There are more than 20 steam electric generating plants in the U.S. that use municipal<br />
wastewater, primarily as cooling water. A variety of treatment processes are used and<br />
are dependent on the water characteristics, treatment facility location (at the WWTP<br />
or the power plant) and site specific requirements. Typically the process train consists<br />
of oxidation, coagulation, filtration, and disinfection. Some examples illustrate the<br />
different treatment processes and variety of power facility applications <strong>for</strong> reuse.<br />
One of the first industrial reuse applications in Minnesota is the Mankato Energy<br />
Center (MEC), with construction completion scheduled by the end of 2006.<br />
<strong>Wastewater</strong> plant effluent from the Mankato WWTP (maximum 6.2 mgd) will be<br />
pumped to the MEC and MEC cooling water discharge will be returned to the plant<br />
as a permitted industrial user and commingled with treated effluent prior to<br />
dechlorination. The MEC uses an evaporative cooling process with an average loss of<br />
75%. The MEC will initially produce 365 megawatts with an ultimate capacity of 630<br />
megawatts.<br />
New facilities constructed at the Mankato WWTP include: high-rate clarification <strong>for</strong><br />
tertiary phosphorus removal with ferric chloride and polymer (Kruger Actiflo units),<br />
cloth media disk filtration, expanded chlorination using sodium hypochlorite, transfer<br />
pumping, and ancillary structures and equipment. Tertiary phosphorus removal is<br />
required to provide a supply with total phosphorus concentrations less than the<br />
permitted limit of 1 mg/L to the MEC. Chemicals containing phosphorus are added
Section 2<br />
Implementation Consideration s<br />
at the power plant to reduce scale <strong>for</strong>mation. Because the MEC’s discharge is returned<br />
to the WWTP with a concentration potentially greater than l mg/L, the plant WWTP<br />
effluent must be less than 1 mg/L, so the combined flow (MEC and WWTP discharge)<br />
consistently meet the NPDES permit phosphorus limit of 1 mg/L of total phosphorus.<br />
The process train was selected to meet the MPCA’s limits, following the Cali<strong>for</strong>nia<br />
Title 22 requirements. The NPDES permit was modified to account <strong>for</strong> the additional<br />
monitoring requirements to show adherence to the Title 22 limits.<br />
Las Vegas, Nevada, and Clark County Sanitation District provide 90 mgd of<br />
reclaimed water to supply 35 percent of the water demand in power generating<br />
stations operated by the Nevada Power Company. The Nevada Power Company<br />
receives secondary effluent and provides lime softening, filtration, and disinfection on<br />
site [<strong>Water</strong> Pollution Control Federation, 1989].<br />
The Palo Verde Nuclear Generating Station (PVNGS) is the largest nuclear power<br />
plant in the nation. The plant is located in the desert, approximately 55 miles west of<br />
Phoenix, Arizona. The facility uses reclaimed water <strong>for</strong> cooling purposes and has zero<br />
discharge. The source of the cooling water is two secondary wastewater treatment<br />
plants, located in Phoenix and Tolleson, Arizona. The PVNGS utilizes about 90 mgd<br />
of reclaimed water that receives additional treatment by trickling filters to reduce<br />
ammonia, lime/soda ash softening to reduce scale- and corrosion-causing<br />
constituents, and filtration to reduce suspended solids. Two 467-acre evaporation<br />
ponds dispose of liquid waste from blowdown [Blackson and Moreland, 1998].<br />
Boiler Feed <strong>Water</strong><br />
The Wyodak Power Plant near Gillette, Wyoming, uses 0.4 mgd of reclaimed water<br />
<strong>for</strong> boiler make-up, dust suppression, and other small-volume plant uses. Secondary<br />
effluent from Gillette is piped approximately 5 miles to a water treatment facility that<br />
includes chlorination, softening, activated carbon adsorption, pH adjustment, sand<br />
filtration, cartridge filtration, reverse osmosis, dechlorination, recarbonation, and ion<br />
exchange demineralization [Breistein and Tucker, 1986].<br />
Three industries in Odessa, Texas, have used approximately 2.5 mgd of municipal<br />
wastewater <strong>for</strong> cooling tower make-up and boiler feed <strong>for</strong> over 20 years. Secondary<br />
effluent is treated by lime softening prior to use by the industries. The reclaimed<br />
water is used directly <strong>for</strong> cooling tower make-up, and water used <strong>for</strong> boiler feed is<br />
treated by two-bed demineralization be<strong>for</strong>e use [<strong>Water</strong> Pollution Control Federation,<br />
1989].<br />
Process <strong>Water</strong><br />
Two paper mills use tertiary treated effluent from the Los Angeles County<br />
(Cali<strong>for</strong>nia) Sanitation Districts' Pomona <strong>Water</strong> Reclamation Plant as process water.<br />
The Garden State Paper Company uses 3 mgd of reclaimed water during newsprint<br />
reprocessing, and the Simpson Paper Company uses 1 mgd during the manufacture<br />
of high quality paper <strong>for</strong> stationery and wrappings. Treatment includes biological<br />
2-28 Craddock Consulting Engineers<br />
In Association with CDM & James Crook<br />
TM1-Sec2_0707.doc
Section 2<br />
Implementation Considerations<br />
Craddock Consulting Engineers<br />
In Association with CDM & James Crook 2-29<br />
TM1-Sec2_0707.doc<br />
oxidation, alum coagulation, filtration, and disinfection to achieve a total coli<strong>for</strong>m of<br />
≤2.2 total coli<strong>for</strong>m organisms/100 ml.<br />
The Hampton Roads Sanitation District (HRSD), Virginia has been supplying 0.5 mgd<br />
of nitrified secondary effluent from the York River Treatment Plant to Giant<br />
Industries’ Yorktown since 2002. Reclaimed water is used <strong>for</strong> the following service<br />
water applications: cooling; crude oil desalting; coke cutting; miscellaneous uses such<br />
as rinsing and chemical mixing; charge water <strong>for</strong> the fire protection system when it is<br />
not in use (York River water would be used during actual firefighting); and irrigation<br />
of trees. The reclaimed water limits include the following: COD
Section 2<br />
Implementation Consideration s<br />
Cali<strong>for</strong>nia State <strong>Water</strong> Resources Control Board. 1980. Evaluation of <strong>Industrial</strong> Cooling Systems<br />
Using Reclaimed <strong>Municipal</strong> <strong>Wastewater</strong>. Cali<strong>for</strong>nia State <strong>Water</strong> Resources Control Board, Office of<br />
<strong>Water</strong> <strong>Recycling</strong>, Sacramento, Cali<strong>for</strong>nia.<br />
Cali<strong>for</strong>nia State <strong>Water</strong> Resources Control Board. 2000. Porter-Cologne <strong>Water</strong> Quality Control Act.<br />
Cali<strong>for</strong>nia <strong>Water</strong> Code, Division 7. Compiled by the State <strong>Water</strong> Resources Control Board,<br />
Sacramento, Cali<strong>for</strong>nia.<br />
Crook, J. 2004. Innovative Applications in <strong>Water</strong> Reuse: Ten Case Studies. Report published by the<br />
WateReuse Association, Alexandria, Virginia.<br />
Florida Department of Environmental Protection. 1995. <strong>Water</strong> Policy. Chapter 62-40, Florida<br />
Administrative Code. Florida Department of Environmental Protection, Tallahassee, Florida.<br />
Florida Department of Environmental Protection. 1999. Reuse of Reclaimed <strong>Water</strong> and Land Application.<br />
Chapter 62-610, Florida Administrative Code. Florida Department of Environmental Protection,<br />
Tallahassee, Florida.<br />
Gaglioardo, P. B Pearce, G Lehman, and S Adham, 2002. “<strong>Use</strong> of Reclaimed <strong>Water</strong> <strong>for</strong> <strong>Industrial</strong><br />
Applications”. 2002 WateReuse Sypmposium. September 8-11. Orlando Florida.<br />
Goldstein, D.J., I. Wei, and R.E. Hicks. 1979. Reuse of <strong>Municipal</strong> <strong>Wastewater</strong> as Make-Up to Circulating<br />
Cooling Systems. In: Proceedings of the <strong>Water</strong> Reuse Symposium, Vol. 1. pp. 371-397, March 25-30,<br />
1979, Washington, D.C. Published by the AWWA Research Foundation, Denver, Colorado.<br />
Hunter, G. and B. Long. 2002. “Endocrine Disrupters in Reclaimed <strong>Water</strong>. Effective Removal from<br />
DisinfectionTechnologies.” 2002 Annual Symposium – WateReuse Symposium. Orlando, Florida.<br />
Septemeber 8-11, 2002.<br />
James M. Montgomery, Consulting Engineers, Inc., 1985. <strong>Water</strong> Treatment Principles & Design. John<br />
Wiley & Sons. New York.<br />
Meyer, R. 1991. Preparing <strong>Water</strong> <strong>for</strong> <strong>Industrial</strong> Boilers. Ind. <strong>Water</strong> Treatment, 23(2):30-32.<br />
Metropolitan Council, 2004. <strong>Water</strong> Demand and Planning in the Twin Cities Metro Area. A Regional<br />
Report prepared by Metropolitan Council, May.<br />
Miller, D.G. “West Basin <strong>Municipal</strong> <strong>Water</strong> District: 5 Designer (Recycled) <strong>Water</strong>s to Meet Customer’s<br />
Needs.” West Basin <strong>Municipal</strong> <strong>Water</strong> Disrict.<br />
National <strong>Water</strong> Research Institute. 2003. Ultraviolet Disinfection Guidelines <strong>for</strong> Drinking <strong>Water</strong> and<br />
<strong>Water</strong> Reuse. Report Number NWRI-2003-06, National <strong>Water</strong> Research Institute, Fountain Valley,<br />
Cali<strong>for</strong>nia.<br />
Okun, D.A. 1979. Criteria <strong>for</strong> Reuse of <strong>Wastewater</strong> <strong>for</strong> Nonpotable Urban <strong>Water</strong> Supply Systems in<br />
Cali<strong>for</strong>nia. Report prepared <strong>for</strong> the Cali<strong>for</strong>nia Department of Health Services, Sanitary Engineering<br />
Section, Berkeley, Cali<strong>for</strong>nia.<br />
Puckorius, P.R. and R.T. Hess. 1991. <strong>Wastewater</strong> Reuse <strong>for</strong> <strong>Industrial</strong> Cooling <strong>Water</strong> Systems. Ind.<br />
<strong>Water</strong> Treatment, 23(5):43-48.<br />
Rogers, D.W., D.H. Stone, and K.A. Sheffield. 1992. <strong>Wastewater</strong> Treatment Plant Effluents are <strong>Use</strong>d<br />
to Meet Freshwater Demands of Electric Power Generation Station. In: Proceedings of the WEF<br />
Specialty Conference on Urban and Agricultural <strong>Water</strong> Reuse, pp. 399-406, June 28-July 1, 1992,<br />
Orlando, Florida. Published by the <strong>Water</strong> Environment Federation, Alexandria, Virginia.<br />
2-30 Craddock Consulting Engineers<br />
In Association with CDM & James Crook<br />
TM1-Sec2_0707.doc
Section 2<br />
Implementation Considerations<br />
Craddock Consulting Engineers<br />
In Association with CDM & James Crook 2-31<br />
TM1-Sec2_0707.doc<br />
Smith, T. and D. Brown. 2002. “Ultraviolet Treatment Technology <strong>for</strong> the Henderson <strong>Water</strong> Reclamation<br />
Facility.” Proceedings of the <strong>Water</strong> Sources Conference, Reuse, Resources, Conservation. January 27-30,<br />
2002. Las Vegas, Nevada.<br />
State of Cali<strong>for</strong>nia. 2000a. <strong>Water</strong> <strong>Recycling</strong> Criteria. Title 22, Division 4, Chapter 3, Cali<strong>for</strong>nia Code of<br />
Regulations. Cali<strong>for</strong>nia Department of Health Services, Drinking <strong>Water</strong> Program, Sacramento, Cali<strong>for</strong>nia.<br />
State of Cali<strong>for</strong>nia. 2000b. Cross-Connection Control by <strong>Water</strong> <strong>Use</strong>rs. Health & Safety Code,<br />
Division 104, Part 12, Chapter 5, Article 2, Cali<strong>for</strong>nia Department of Health Services, Sacramento,<br />
Cali<strong>for</strong>nia.<br />
U.S. Environmental Protection Agency. 1974. Design Criteria <strong>for</strong> Mechanical, Electric, and Fluid System<br />
and Component Reliability. MCD-05. EPA-430-99-74-001, U.S. Environmental Protection Agency, Office<br />
of <strong>Water</strong> Program Operations, Washington, DC. 1974.<br />
U.S. Environmental Protection Agency. 1992. Guidelines <strong>for</strong> <strong>Water</strong> Reuse. EPA/625/R-92/004, U.S.<br />
Environmental Protection Agency, Office of Research and Development, Center <strong>for</strong> Environmental<br />
Research In<strong>for</strong>mation, Cincinnati, Ohio.<br />
U.S. Environmental Protection Agency. 2004. Guidelines <strong>for</strong> <strong>Water</strong> Reuse. EPA/625/R-04/108, U.S.<br />
Environmental Protection Agency, Office of Research and Development, Cincinnati, Ohio.<br />
U.S. Environmental Protection Agency. 2005. Technologies and Costs Document <strong>for</strong> the Final<br />
LongTerm 2 Enhanced Surface <strong>Water</strong> Treatment Rule and Final Stage 2 Disinfectants and Disinfection<br />
Byproducts Rule.. EPA/815/R-05/013, U.S. Environmental Protection Agency, Office of <strong>Water</strong> (4606-<br />
M), December.<br />
<strong>Water</strong> Pollution Control Federation. 1989. <strong>Water</strong> Reuse (Second Edition). Manual of Practice SM-3,<br />
<strong>Water</strong> Pollution Control Federation, Alexandria, Virginia.
Craddock Consulting Engineers 3-1<br />
In Association with CDM & James Crook<br />
WWReuseTM1_Sec 3_final.doc<br />
Section 3<br />
Inventory of Major WWTPs and Potential<br />
<strong>Industrial</strong> Reuse Demands<br />
This section reviews the historical water use in the state <strong>for</strong> major industrial users in<br />
context with municipal wastewater treatment plants’ (WWTPs’) location and<br />
production capacity. A more in-depth review of industries in proximity to reclaimed<br />
water suppliers is provided <strong>for</strong> each individual watershed. General in<strong>for</strong>mation on<br />
the existing water sources in the watersheds and areas that may be prone to water<br />
supply problems is also provided. The Minneapolis/St. Paul metro area is examined<br />
on a WWTP basis, where industries located within a one- and five-mile radius of each<br />
existing metro area WWTP are identified.<br />
A brief summary of the industrial reuse customer inventory sets the framework <strong>for</strong><br />
the evaluation of the inventory in the next stage of the project. In Task 2, the<br />
industries or areas where water reuse could have the most impact will be identified<br />
and further analyzed to explore treatment requirements, costs, and implementation<br />
issues.<br />
3.1 Statewide Inventory<br />
Industry <strong>Water</strong> <strong>Use</strong><br />
The nine industrial water use categories used by MDNR in their Appropriations<br />
Permit database are subdivided in the database into the following:<br />
Power Generation<br />
o Hydropower<br />
o Steam power cooling – once through<br />
o Steam power cooling – wet tower<br />
o Steam power cooling – ponds<br />
o Steam power other than cooling<br />
o Nuclear power plant<br />
o Power generation (miscellaneous not fitting other categories)<br />
<strong>Industrial</strong> Processing<br />
o Agricultural processing (food & livestock)<br />
o Pulp and paper processing<br />
o Mine processing (not sand & gravel washing)<br />
o Sand and gravel washing<br />
o <strong>Industrial</strong> process cooling once-through<br />
o Petroleum-chemical processing, ethanol<br />
o Metal processing<br />
o Non-metallic processing (rubber, plastic, glass)<br />
o <strong>Industrial</strong> processing
Section 3<br />
Inventory of Major WWTPs and Potential <strong>Industrial</strong> Reuse Demands<br />
<strong>Water</strong> <strong>Use</strong> (mgd)<br />
The majority of water used in the power industry category in Minnesota is surface<br />
water used <strong>for</strong> once-through cooling at steam power generation plants, as indicated in<br />
Figures 3.1 and 3.2. The next largest use is <strong>for</strong> nuclear plant cooling water, followed<br />
by other steam power non-cooling water uses. Almost all of the water used by this<br />
category is supplied by surface waters, as indicated in Table 3.1.<br />
1,200<br />
1,000<br />
800<br />
600<br />
400<br />
200<br />
0<br />
Nuclear Power Plant<br />
35.8% (852.6 mgd)<br />
Steam Power Other Than Cooling<br />
13.7% (326.7 mgd)<br />
Steam Power Cooling - Once<br />
through 49.6% (1179.1 mgd)<br />
Steam Power Cooling -<br />
Wet Tower 0.8% (19.5 mgd)<br />
Figure 3.1. Power Generation Facilities <strong>Water</strong> <strong>Use</strong>, 2004<br />
Source: MDNR, 2004<br />
222 223 225 226<br />
<strong>Use</strong> Code<br />
Ground <strong>Water</strong><br />
Surface <strong>Water</strong><br />
222 Steam Power Cooling -<br />
Once Through<br />
223 Steam Power Cooling -<br />
Wet tTower<br />
225 Steam Power -<br />
Other Than Cooling<br />
226 Nuclear Power Plant<br />
Figure 3.2. Power Generation Facilities <strong>Water</strong> <strong>Use</strong>, 2004<br />
Source:MDNR, 2004<br />
3-2 Craddock Consulting Engineers<br />
In Association with CDM & James Crook<br />
WWReuseTM1_Sec 3_final.doc
Section 3<br />
Inventory of Major WWTPs and Potential <strong>Industrial</strong> Reuse Demands<br />
Craddock Consulting Engineers 3-3<br />
In Association with CDM & James Crook<br />
WWReuseTM1_Sec 3_final.doc<br />
Table 3.1. Power Generation Facilities <strong>Water</strong> <strong>Use</strong> in Minnesota, 2004<br />
<strong>Water</strong> <strong>Use</strong>, mgd<br />
Category Ground <strong>Water</strong> Surface <strong>Water</strong> Total<br />
Hydropower 0 0.12 0.1<br />
Steam power cooling – once through 0.30 1178.75 1179.1<br />
Steam power cooling – wet tower 0.98 18.47 19.5<br />
Steam power other than cooling 1.36 325.35 326.7<br />
Nuclear power plant 0.14 852.44 852.6<br />
Power generation 0.85 0.01 0.9<br />
Total 3.6 2375.0 2378.7<br />
Source: MDNR, 2004<br />
Mine processing and pulp and paper processing are the largest water users under the<br />
industrial processing category, as listed in Table 3.2 and illustrated in Figures 3.3 and<br />
3.4. While these industries predominantly use surface water supplies the next largest<br />
water use category is agricultural processing, which relies primarily on higher quality<br />
ground water supplies. Appendix A provides the detailed statistics on industrial<br />
water use in Minnesota <strong>for</strong> 2000 – 2004.<br />
Table 3.2. <strong>Industrial</strong> Processing <strong>Water</strong> <strong>Use</strong> in Minnesota, 2004<br />
<strong>Water</strong> <strong>Use</strong>, mgd<br />
Category<br />
Ground<br />
<strong>Water</strong><br />
Surface<br />
<strong>Water</strong><br />
Total<br />
Agricultural processing (food & livestock) 25.2 0.1 25.3<br />
Pulp and paper processing 2.3 80.3 82.6<br />
Mine processing (not sand & gravel washing) 0.5 296.5 297.0<br />
Sand and gravel washing 3.8 7.5 11.3<br />
<strong>Industrial</strong> process cooling once-through 5.8 0.5 6.3<br />
Petroleum-chemical processing, ethanol 10.9 0.4 11.3<br />
Metal processing 3.9 0.0 3.9<br />
Non-metallic processing (rubber, plastic, glass) 3.0 0.0 3.0<br />
<strong>Industrial</strong> processing 1.0 0.0 1.0<br />
Total 56.3 385.4 441.7<br />
Source: MDNR, 2004
<strong>Water</strong> <strong>Use</strong> (mgd)<br />
Section 3<br />
Inventory of Major WWTPs and Potential <strong>Industrial</strong> Reuse Demands<br />
350<br />
300<br />
250<br />
200<br />
150<br />
100<br />
50<br />
0<br />
Metal Processing 0.9% (3.9 mgd)<br />
Petroleum Chemical Processing<br />
2.6% (11.3 mgd)<br />
<strong>Industrial</strong> Process Cooling<br />
Once Through 1.4% (6.4 mgd)<br />
Sand and Gravel Processing<br />
2.6% (11.3 mgd)<br />
Non-metallic Processing 0.7% (3.0 mgd)<br />
<strong>Industrial</strong> Processing 0.2% (1.0 mgd)<br />
Agricultural Processing<br />
5.7% (25.3 mgd)<br />
241 242 243 244 245 246 247 248 249<br />
<strong>Use</strong> Code<br />
Pulp and Paper<br />
Processing<br />
18.7% (82.6 mgd)<br />
Mine Processing 67.2% (297 mgd)<br />
Figure 3.3. <strong>Industrial</strong> Processing <strong>Water</strong> <strong>Use</strong> in 2004<br />
Source: MNDR, 2004<br />
Surface <strong>Water</strong><br />
Ground <strong>Water</strong><br />
241 Agricultural processing<br />
242 Pulp and paper processing<br />
243 Mine processing<br />
244 Sand and gravel processing<br />
245 <strong>Industrial</strong> process cooling oncethrough<br />
246 Petroleum-chemical processing<br />
247 Metal processing<br />
248 Non-metallic processing<br />
249 <strong>Industrial</strong> processing<br />
Figure 3.4. <strong>Industrial</strong> Processing by <strong>Use</strong> Code in 2004<br />
Source: MNDR, 2004<br />
3-4 Craddock Consulting Engineers<br />
In Association with CDM & James Crook<br />
WWReuseTM1_Sec 3_final.doc
Section 3<br />
Inventory of Major WWTPs and Potential <strong>Industrial</strong> Reuse Demands<br />
Craddock Consulting Engineers 3-5<br />
In Association with CDM & James Crook<br />
WWReuseTM1_Sec 3_final.doc<br />
<strong>Wastewater</strong> Treatment Plants<br />
The state of Minnesota has nearly 600 municipal WWTPs permitted <strong>for</strong> discharge to<br />
surface waters, as indicated in Figure 3.5. While the majority of permitted WWTPs<br />
have capacities of less than 1 mgd, the majority of effluent discharged comes from the<br />
11 WWTPs whose capacities exceed 10 mgd. Thus, the greatest potential <strong>for</strong><br />
maximizing industrial reuse may lie in the vicinity of these larger plants. In contrast,<br />
numerous reuse systems – perhaps numbering in the hundreds – would be required<br />
to take full advantage of the treated effluent resource.<br />
Permitted Design Combined<br />
Capacity (mgd)<br />
280<br />
240<br />
200<br />
160<br />
120<br />
80<br />
40<br />
0<br />
517<br />
0-1 mgd 1-2 mgd 2-5 mgd 5-10 mgd 10-50 mgd >50 mgd<br />
Figure 3.5. Capacity and Number of <strong>Municipal</strong> WWTPs in Minnesota<br />
Source: MPCA, 2005<br />
Proximity of Industries to WWTPs<br />
23<br />
28<br />
No. Of Facilities<br />
WWTP Design Capacity (mgd)<br />
While an understanding of the industrial water users throughout the state is helpful<br />
in assessing industrial water demands, these industries must be located near a WWTP<br />
<strong>for</strong> reclaimed water to be an economically viable supply.<br />
A statewide map of industries, the relative volume of water they use, and the<br />
proximity to larger WWTPs (Figure 3.6) gives a synopsis of potential industrial<br />
opportunities. A more detailed review is provided on an individual watershed basis<br />
in the following subsections. Figure 3.6 presents all the permitted MDNR industrial<br />
water users <strong>for</strong> the state by category. The power generation industry subcategories<br />
were all grouped under the general heading of power generation, as shown by the<br />
purple color in Figure 3.6. The relative volume of water used by these industries is<br />
depicted by the size of the symbol. Circles represent ground water-using industries<br />
and squares are surface water users.<br />
8<br />
10 1
Section 3<br />
Inventory of Major WWTPs and Potential <strong>Industrial</strong> Reuse Demands<br />
Major WWTPs (over 1 mgd design capacity) are identified by the triangles on Figure<br />
3.6, with relative size shown <strong>for</strong> each facilty’s design capacity. While it may be<br />
feasible <strong>for</strong> smaller plants (with design capabilities less than 1 mgd) to supply<br />
industry’s reclaimed water, this initial analysis focused on opportunities associated<br />
with larger WWTPs. Larger treatment facilities are more likely to have the staff and<br />
municipal infrastructure to support treatment upgrades and the administrative role<br />
that is required. The next phase of work may consider smaller WWTPs if there<br />
appears to be a close correlation between a specific WWTP effluent supply and major<br />
industrial water demands in that area.<br />
3.2 <strong>Water</strong>shed Inventories<br />
Overview<br />
The inventory of industrial water users and municipal wastewater treatment plants is<br />
summarized below <strong>for</strong> each of the ten major watersheds in Minnesota, depicted in<br />
Figure 3.7a. As discussed in Section 1, the data presented are only <strong>for</strong> industries with<br />
permits <strong>for</strong> water withdrawal. These industries are referenced as “major” industrial<br />
water users. Industries that use a municipal water supply (“waterworks”) <strong>for</strong> their<br />
water source are not represented in this analysis. This inventory is based on existing<br />
industries and WWTPs. Task 2 will incorporate <strong>for</strong>ecasts of industrial and population<br />
growth to identify future water reuse opportunities.<br />
The industrial reuse customer inventory <strong>for</strong> each watershed is presented through four<br />
main exhibits:<br />
Map of major industrial water use and major WWTPs (over 1 mgd design capacity)<br />
Statistics on industrial water use (Source: DNR Appropriations Permit Program,<br />
2004)<br />
List of WWTPs, their design capacity (based on their NPDES Permit average wet<br />
weather flow unless otherwise stated) and historic flows (Source: MPCA<br />
Dischargers Database [2005] based on Discharge Monitoring Reports submitted by<br />
each facility in requirements with their NPDES Permit). Appendix C contains the<br />
complete list of WWTPs with design capacities greater than 1 mgd.<br />
List of industries, their water use, and their proximity to a WWTP<br />
o Appendix C contains the complete industry lists <strong>for</strong> all watersheds. In the<br />
Minnesota River, Mississippi River – Headwaters and Lower Mississippi River<br />
watersheds, the distance between an industry and a WWTP was determined <strong>for</strong><br />
industries within a 5-mile radius. A 10-mile radius was used <strong>for</strong> the other<br />
watersheds.<br />
o Summary industry lists are provided in this section <strong>for</strong> watersheds with larger<br />
numbers of industries. The summaries list the industries that are closest to a<br />
WWTP, within a defined radius. The radius varies with each watershed, and is<br />
3-6 Craddock Consulting Engineers<br />
In Association with CDM & James Crook<br />
WWReuseTM1_Sec 3_final.doc
Figure 3.6. <strong>Industrial</strong> Reuse Customer Inventory<br />
"<br />
# "<br />
#<br />
"<br />
# "<br />
"<br />
"<br />
" "<br />
"<br />
"<br />
"<br />
#<br />
!<br />
"!<br />
"<br />
#<br />
! "<br />
!<br />
"!<br />
# ! "<br />
!<br />
"<br />
#<br />
"<br />
!<br />
#<br />
" " !<br />
" ! !<br />
!<br />
!<br />
!<br />
!<br />
!<br />
! ! " # !<br />
" !<br />
!<br />
!<br />
!<br />
!<br />
!<br />
!<br />
!<br />
!<br />
!<br />
!<br />
" !<br />
" !" "<br />
" #<br />
"<br />
"<br />
" "<br />
"<br />
" "<br />
#<br />
!<br />
!<br />
"<br />
"<br />
! "<br />
!<br />
"<br />
!<br />
"<br />
"<br />
! "<br />
! "<br />
!<br />
!"<br />
!<br />
!<br />
!<br />
!<br />
" !<br />
"<br />
! "<br />
"<br />
"<br />
! ! !<br />
" "<br />
!<br />
!<br />
"<br />
!<br />
"<br />
!" !<br />
!<br />
" !<br />
"<br />
!<br />
"<br />
!<br />
! "<br />
!<br />
" ! "<br />
" !<br />
!<br />
!<br />
!<br />
" " !<br />
!<br />
!<br />
! " !<br />
"<br />
!<br />
"<br />
!<br />
!<br />
!<br />
!<br />
!<br />
!<br />
"<br />
" " !<br />
"<br />
!<br />
!<br />
"! !<br />
! "<br />
"! "<br />
!<br />
! !<br />
!<br />
! ! !<br />
!<br />
!<br />
!<br />
!<br />
" ! !<br />
! !<br />
! !<br />
!<br />
!<br />
!<br />
! !<br />
!<br />
! !! ! ! !<br />
! ! !<br />
!<br />
! !<br />
!<br />
!<br />
!<br />
!<br />
! ! ! !<br />
!<br />
" !<br />
!<br />
!<br />
! !<br />
!<br />
!<br />
!<br />
! !<br />
! ! !<br />
!<br />
!<br />
!<br />
!<br />
"! ! " "<br />
! ! !<br />
!<br />
!<br />
" ! ! ! "<br />
" " "<br />
! "<br />
! " !<br />
!!<br />
! " !<br />
!<br />
!<br />
! !<br />
"<br />
"<br />
!<br />
!<br />
! " ! !<br />
!<br />
! !<br />
!<br />
!<br />
"<br />
!<br />
"<br />
! ! !<br />
! "<br />
"<br />
"<br />
!<br />
"<br />
!<br />
!<br />
!<br />
"<br />
!<br />
"<br />
" !<br />
!<br />
"<br />
! !<br />
"<br />
!<br />
"<br />
!<br />
!<br />
"<br />
!<br />
"<br />
!<br />
" !<br />
# !<br />
#<br />
!<br />
! #<br />
!<br />
! # #<br />
!<br />
" " ! #<br />
! # # !<br />
# ## !<br />
# # #<br />
#<br />
#<br />
! !<br />
!<br />
#<br />
! # !<br />
#<br />
! # # # #<br />
! !<br />
"<br />
! #<br />
#<br />
# "<br />
#<br />
" #<br />
#<br />
# # # "<br />
!<br />
#<br />
!<br />
# # !<br />
#<br />
#<br />
#<br />
#<br />
#<br />
#<br />
#<br />
! #<br />
! # !<br />
# #<br />
") Agricultural Processing #*<br />
") <strong>Industrial</strong> Process Cooling #*<br />
") <strong>Industrial</strong> Processing !(<br />
")<br />
")<br />
Metal Processing<br />
Mine Processing<br />
")<br />
") Non-Metallic Processing<br />
") Petroleum-Chemical Processing<br />
") Pulp and Paper Processing<br />
") Sand and Gravel Washing<br />
Power Generation<br />
")<br />
#<br />
#<br />
"<br />
" #<br />
"<br />
#<br />
#<br />
! "<br />
!<br />
"<br />
"<br />
"<br />
" !<br />
!<br />
" ! " ! "<br />
" #<br />
#<br />
! #<br />
!<br />
WWTP >=5 mgd<br />
WWTP 1-5 mgd<br />
Ground <strong>Water</strong><br />
Surface <strong>Water</strong><br />
County<br />
2004 <strong>Water</strong> <strong>Use</strong><br />
!<br />
#<br />
#<br />
# "<br />
!<br />
!<br />
! !<br />
"<br />
! #<br />
"<br />
"<br />
" !<br />
"<br />
! "<br />
¯<br />
0 50 100 Miles<br />
Source: Minnesota DNR <strong>Water</strong> Appropriations Permit Program, 2004 (Withdrawls greater than 1 mgy or 10,000 gpd)<br />
")<br />
")<br />
")<br />
")<br />
")<br />
")<br />
!( 0.00 - 0.50 mgd<br />
!( 0.51 - 1.50 mgd<br />
!( 1.51 - 5.00 mgd<br />
!( 5.01 - 10.00 mgd<br />
!(<br />
!(<br />
10.01 - 25.00 mgd<br />
25.01 - 505.00 mgd
#<br />
Red<br />
Tamarac<br />
#<br />
#<br />
Sand Hill<br />
Marsh<br />
Buffalo<br />
Roseau<br />
Two River<br />
#<br />
#<br />
Minnesota<br />
Lac qui Parle<br />
#<br />
Rock<br />
Figure 3.7a. Minnesota <strong>Water</strong>sheds<br />
Mustinka<br />
#<br />
#<br />
Thief<br />
Clearwater<br />
Ottertail<br />
Chippewa<br />
#<br />
#<br />
#<br />
Red Eye<br />
#<br />
#<br />
#<br />
#<br />
#<br />
Rapid<br />
#<br />
#<br />
# #<br />
#<br />
#<br />
Sauk<br />
South Fork Crow<br />
Redwood<br />
Cottonwood<br />
Des Moines<br />
Crow Wing<br />
#<br />
#<br />
Pine<br />
#<br />
#<br />
#<br />
#<br />
Rainy<br />
Big Fork<br />
#<br />
#<br />
Watonwan<br />
#<br />
# #<br />
# ##<br />
#<br />
#<br />
#<br />
#<br />
Le Sueur<br />
") Cedar River<br />
") Des Moines River<br />
") Lower Mississippi River<br />
") Minnesota River<br />
") Mississippi River - Headwaters<br />
") Missouri River<br />
") Rainy River<br />
")<br />
Red River of the North<br />
") St. Croix River<br />
") Western Lake Superior<br />
#<br />
Little Fork<br />
#<br />
# #<br />
#<br />
# #<br />
#<br />
#<br />
#<br />
#<br />
#<br />
#<br />
#<br />
#<br />
Kettle<br />
Snake<br />
Cedar<br />
#<br />
#<br />
St. Croix<br />
Cannon<br />
#*<br />
#*<br />
Vermilion<br />
#<br />
St. Louis<br />
#<br />
#<br />
#<br />
Upper Iowa<br />
Zumbro<br />
#<br />
#<br />
#<br />
#<br />
#<br />
Cloquet<br />
#<br />
Mississippi<br />
#<br />
Root<br />
WWTP >= 5 mgd<br />
WWTP 1-5 mgd<br />
0 50 100 Miles<br />
¯
Section 3<br />
Inventory of Major WWTPs and Potential <strong>Industrial</strong> Reuse Demands<br />
Craddock Consulting Engineers 3-7<br />
In Association with CDM & James Crook<br />
WWReuseTM1_Sec 3_final.doc<br />
the radius (to the nearest mile) that captures the top 30-40 industries. Appendix<br />
C provides the complete list.<br />
The facility design capacities and flows are included to compare industrial water<br />
demand to the reclaimed water supply available in a watershed. It is also useful to<br />
compare the historic WWTP flow to the plant’s design capacity. Facilities with<br />
discharge flows significantly less than the design capacity indicate: (1) the area is<br />
planning <strong>for</strong> growth or (2) there was a change in the area’s industries that caused a<br />
decrease in flow to the WWTP and/or the movement of residents from the area.<br />
Both of these cases provide an incentive <strong>for</strong> industries to locate in these areas and<br />
benefit from industrial reuse. New growth areas provide the ability to locate and<br />
install conveyance and other infrastructure more economically. Plants with excess<br />
capacity related to the closing of an industry in the area, provide available treatment<br />
capacity <strong>for</strong> an industry’s waste load. The industry might avoid the costs <strong>for</strong> their<br />
own treatment facilities and the permitting associated with an independent discharge<br />
to the receiving waters. If water supply problems exist in the area, reuse can also be<br />
factored into the planning and provide another positive reason <strong>for</strong> an industry to<br />
locate in this community.<br />
Conversely, a facility with current discharge flows near the design capacity, may be a<br />
preferred community <strong>for</strong> new industry. Assuming the area will experience some<br />
growth, communities with facilities treating flows within 80% of design capacity will<br />
be planning <strong>for</strong> a wastewater treatment expansion. The design <strong>for</strong> the expanded<br />
facilities can incorporate the treatment requirements to deliver reclaimed water to<br />
existing or new industries – providing economic incentives <strong>for</strong> an industry looking <strong>for</strong><br />
a water supply, as well as the municipality.<br />
Distances between WWTPs and industries were approximated. It is assumed that the<br />
wells used by the industry are close to the facilities that use the water supply. This<br />
may not always be the case. ‘Distance’ is used as a general criterion to evaluate the<br />
feasibility of specific water reuse applications, recognizing that distance will affect<br />
transmission costs.<br />
Along with the in<strong>for</strong>mation on existing industries and WWTPs, a synopsis of basin<br />
and regional factors related to industrial growth is provided. <strong>Water</strong> supply<br />
availability is reviewed on a regional level using the MDNR’s classification of<br />
Minnesota into six ground water areas. The areas are categorized by the general<br />
availability of ground water in the bedrock and two overlying sediment layers<br />
classified as surficial sands and buried sands, shown in Figure 3.7b. Appendix D<br />
contains the classification system and supporting documentation (MDNR, 2005).<br />
Additional in<strong>for</strong>mation on quantity and quality of ground water is summarized from<br />
the MPCA’s regional ground water profiles (MPCA, 1995). The statewide assessment<br />
of susceptibility to ground water contamination (MPCA, 1989), as shown in Figure<br />
3.7c, is also used to identify ground water supply issues. These assessments by<br />
MDNR and MPCA provide higher level indicators of ground water quantity and<br />
quality concerns that can be applied uni<strong>for</strong>mly across the state.
Section 3<br />
Inventory of Major WWTPs and Potential <strong>Industrial</strong> Reuse Demands<br />
In addition to water supply quantity and quality factors that would lead an industry<br />
to consider use of reclaimed water, relevant watershed issues are summarized. Those<br />
watersheds undergoing more extensive planning with impending Total Maximum<br />
Daily Loads (TMDLs) are identified. This is of particular importance to municipalities<br />
or industries negotiating new NPDES permits. With more stringent discharge criteria,<br />
municipalities may look to reuse options, where existing industries or future<br />
industries in the area may be likely reuse partners and collectively the watershed can<br />
reduce loadings.<br />
Cedar River<br />
<strong>Industrial</strong> <strong>Water</strong> <strong>Use</strong><br />
Industries in the Cedar River watershed primarily use ground water. As shown in<br />
Figures 3.8a and 3.8b and Table 3.8a, only 0.08 mgd of the 4.13 mgd of industrial<br />
water used in 2004 was from a surface supply and it was used <strong>for</strong> sand and gravel<br />
washing. The majority of the industrial water use in this watershed is <strong>for</strong> agricultural<br />
processing industries, specifically Hormel Foods Corporation in Austin. Ventura<br />
Foods in the Albert Lea area has a permit <strong>for</strong> water withdrawal, but has not used their<br />
permitted source the past few years and previously used less than 100 mgy. Agra<br />
Resources Coop used over 0.5 mgd of water in 2004, and the other ground water use<br />
was by Austin Utilities <strong>for</strong> cooling water.<br />
WWTPs<br />
There are two municipal WWTPs in this watershed with design capacities greater<br />
than 1 mgd: Austin WWTP and Albert Lea WWTP. Table 3.8b summarizes the design<br />
capacity and historic flows <strong>for</strong> these facilities. These WWTPs discharged nearly 10<br />
mgd in 2005 into the Cedar River watershed. Both of these facilities were designed to<br />
handle heavy industrial loads, which have fluctuated over the years with the variable<br />
production of the local industries. The design capacities listed in Table 3.8b, as<br />
reported in the MPCA database, show plenty of capacity <strong>for</strong> growth. The listed design<br />
capacity may be based on a standard domestic load and not a load with a significant<br />
low flow/high organic concentration contribution. Task 2 will examine additional<br />
data <strong>for</strong> these WWTPs and followup to confirm the design capacities. WWTPs in this<br />
watershed with design capacities less than 1 mgd have a combined design capacity of<br />
2.6 mgd.<br />
Industries and Proximity to WWTPs<br />
Figure 3.8c presents the location of the industries and WWTPs in the Cedar River<br />
watershed. Table 3.8c lists the various industries and their distance from the closer of<br />
the two WWTPs. Two of the sand and gravel companies are located more than 5 miles<br />
from a WWTP and one is about 1.5 miles from the Austin WWTP; all use surface<br />
water. Hormel Foods processing plant and administrative offices are located near the<br />
Austin WWTP; their water supply wells are 2 and 3.5 miles from the Austin WWTP.<br />
3-8 Craddock Consulting Engineers<br />
In Association with CDM & James Crook<br />
WWReuseTM1_Sec 3_final.doc
Figure 3.7b. Ground <strong>Water</strong> Availability in Minnesota<br />
")<br />
<strong>Water</strong>sheds<br />
Source: Groundwater Provinces Data, Minnesota DNR, 2005
Figure 3.7c. Ground <strong>Water</strong> Contamination Susceptibility in Minnesota<br />
")<br />
<strong>Water</strong>sheds<br />
Legend<br />
Highest Susceptibility<br />
High Susceptibility<br />
Medium Susceptibility<br />
Low Susceptibility<br />
Lowest Susceptibility<br />
Insufficient Data to Rank<br />
Source: MPCA, 1989 (with updates in 2005)
Section 3<br />
Inventory of Major WWTPs and Potential <strong>Industrial</strong> Reuse Demands<br />
Craddock Consulting Engineers 3-9<br />
In Association with CDM & James Crook<br />
WWReuseTM1_Sec 3_final.doc<br />
WATER USE (MGD)<br />
3.5<br />
3<br />
2.5<br />
2<br />
1.5<br />
1<br />
0.5<br />
0<br />
241 244<br />
USE CODE<br />
246<br />
Ground <strong>Water</strong><br />
Surface <strong>Water</strong><br />
Figure 3.8a. <strong>Industrial</strong> Processing <strong>Water</strong> <strong>Use</strong> in the Cedar River <strong>Water</strong>shed, 2004<br />
WATER USE (MGD)<br />
0.35<br />
0.30<br />
0.25<br />
0.20<br />
0.15<br />
0.10<br />
0.05<br />
0.00<br />
223<br />
USE CODE<br />
241 Agricultural Processing<br />
244 Sand and Gravel<br />
Washing<br />
246 Petroleum-chemical<br />
Processing, ethanol<br />
Source: MDNR, 2004<br />
Ground <strong>Water</strong><br />
Surface <strong>Water</strong><br />
223 Steam Power Cooling<br />
- Wet Tower<br />
Figure 3.8b. Power Generation <strong>Water</strong> <strong>Use</strong> in the Cedar River <strong>Water</strong>shed, 2004<br />
Source: MDNR, 2004
Section 3<br />
Inventory of Major WWTPs and Potential <strong>Industrial</strong> Reuse Demands<br />
Table 3.8a. <strong>Industrial</strong> <strong>Water</strong> <strong>Use</strong> in the Cedar River <strong>Water</strong>shed<br />
2004 <strong>Water</strong> <strong>Use</strong>, mgd<br />
Industry Category<br />
Ground<br />
<strong>Water</strong> Surface <strong>Water</strong> Total<br />
Agricultural Processing 3.20 0.00 3.20<br />
Petroleum - Chemical Processing, Ethanol 0.56 0.00 0.56<br />
Sand & Gravel Washing 0.00 0.08 0.08<br />
Steam Power Cooling - Wet Tower 0.29 0.00 0.29<br />
Total<br />
Source: MDNR, 2004<br />
4.05 0.08 4.13<br />
Table 3.8b. WWTPs in the Cedar River <strong>Water</strong>shed<br />
Design 2005 Ann Avg Flow as % of<br />
Facility Name Capacity, mgd Flow, mgd Design Capacity<br />
Albert Lea WWTP 18.380 4.233 23.0%<br />
Austin WWTP 8.475 5.42 64.0%<br />
Total<br />
Source: MPCA, 2005<br />
26.855 9.653 36.0%<br />
Table 3.8c. Industries in the Cedar River <strong>Water</strong>shed<br />
Industry Name Source*<br />
2004<br />
<strong>Water</strong><br />
<strong>Use</strong>,<br />
mgd<br />
Distance<br />
to<br />
WWTP,<br />
miles<br />
Closest<br />
WWTP Industry Category<br />
HORMEL FOODS CORP G 0.000 2.0 Austin Agricultural Processing<br />
HORMEL FOODS CORP G 0.681 2.0 Austin Agricultural Processing<br />
HORMEL FOODS CORP G 1.183 3.5 Austin Agricultural Processing<br />
HORMEL FOODS CORP G 1.334 3.5 Austin Agricultural Processing<br />
VENTURA FOODS LLC G 0.000 5.7 Albert Lea Agricultural Processing<br />
AGRA RESOURCES<br />
Petroleum - Chemical<br />
COOP G 0.183 9.7 Albert Lea Processing<br />
AGRA RESOURCES<br />
Petroleum - Chemical<br />
COOP G 0.208 9.7 Albert Lea Processing<br />
AGRA RESOURCES<br />
Petroleum - Chemical<br />
COOP<br />
BISHOP EXCAVATING<br />
G 0.172 9.7 Albert Lea Processing<br />
INC<br />
ULLAND BROTHERS<br />
S 0.000 >10 Austin Sand and Gravel Washing<br />
INC<br />
ULLAND BROTHERS,<br />
S 0.060 1.5 Austin Sand and Gravel Washing<br />
INC S 0.020 5.0 Austin Sand and Gravel Washing<br />
AUSTIN UTILITIES G 0.287 4.0 Austin<br />
* G=Ground <strong>Water</strong>; S=Surface <strong>Water</strong><br />
Source: MDNR, 2004<br />
STEAM POWER COOLING -<br />
WET TOWER<br />
3-10 Craddock Consulting Engineers<br />
In Association with CDM & James Crook<br />
WWReuseTM1_Sec 3_final.doc
")<br />
Figure 3.8c. Cedar River <strong>Water</strong>shed<br />
<strong>Industrial</strong> Reuse Customer Inventory<br />
Agricultural Processing<br />
") Petroleum-Chemical Processing<br />
") Sand and Gravel Washing<br />
")<br />
")<br />
Power Generation<br />
Major Lakes<br />
#*<br />
#*<br />
!(<br />
")<br />
")<br />
#<br />
!<br />
!<br />
Albert Lea<br />
Major Rivers<br />
"<br />
Cedar<br />
! Austin !<br />
# "<br />
"<br />
WWTP >= 5 mgd<br />
WWTP 1-5 mgd<br />
Ground <strong>Water</strong><br />
Surface <strong>Water</strong><br />
Cities/Townships<br />
!( 0.51 - 1.50 mgd<br />
!( 1.51 - 5.00 mgd<br />
!( 5.01 - 10.00 mgd<br />
0 25 50 Miles<br />
Source: Minnesota DNR <strong>Water</strong> Appropriations Permit Program, 2004 (Withdrawls greater than 1 mgy or 10,000 gpd)<br />
"<br />
"<br />
"<br />
"<br />
"<br />
"<br />
!( 0.00 - 0.50 mgd<br />
!(<br />
!(<br />
10.01 - 25.00 mgd<br />
25.01 - 505.00 mgd<br />
¯
Section 3<br />
Inventory of Major WWTPs and Potential <strong>Industrial</strong> Reuse Demands<br />
Craddock Consulting Engineers 3-11<br />
In Association with CDM & James Crook<br />
WWReuseTM1_Sec 3_final.doc<br />
The Agra Resources Coop is within 2 miles of the Albert Lea WWTP. The Austin<br />
Utilities power facility location is within 5 miles of the WWTP and could be closer<br />
depending on its proximity to the permitted wells.<br />
Factors Influencing Potential <strong>for</strong> <strong>Industrial</strong> Reuse<br />
The majority of the Cedar River watershed is in Ground <strong>Water</strong> Area 2 of the state,<br />
which has a good bedrock aquifer supply and limited water bearing surficial sands<br />
and moderate availability of water in the buried sand aquifers. The southern edge of<br />
the watershed is part of the karst area of Ground <strong>Water</strong> Area 3, where ground water<br />
supplies are strongly linked to surface supplies. Contamination susceptibility varies<br />
over the watershed with a higher potential in the eastern sections and areas of lower<br />
susceptibility interspersed with areas rated with highest susceptibility in the mid- and<br />
western regions of the watershed. Occasional well interferences have been noted, but<br />
the public water supplies have had no problems. The agricultural practices of the area<br />
have led to nitrate contamination which could affect the Prairie du Chien-Jordan<br />
aquifer as well as surficial aquifers. Agricultural drainage wells have polluted deeper<br />
ground water.<br />
Des Moines River<br />
<strong>Industrial</strong> <strong>Water</strong> <strong>Use</strong><br />
There is little permitted water used <strong>for</strong> industrial purposes in the Des Moines River<br />
watershed. Of the 0.66 mgd used in 2004, the majority was <strong>for</strong> agricultural processing<br />
industries, specifically PM Windom, Worthington Rendering, and the City of Heron<br />
Lake. Sand and gravel operations collectively withdrew 0.1 mgd from surface waters<br />
in 2004. Table 3.9a and Figure 3.9a summarize the industrial water use <strong>for</strong> the Des<br />
Moines River watershed. There were no water withdrawals related to power<br />
generator facilities.<br />
In Heron Lake, located southwest of Windom, a 50 million gallon capacity ethanol<br />
plant is under construction and scheduled <strong>for</strong> completion by April 2007. A<br />
wastewater treatment plant expansion has also been bid <strong>for</strong> construction.<br />
WWTPs<br />
There are two municipal WWTPs in this watershed with design capacities greater<br />
than 1 mgd: Windom WWTP and Worthington WWTP. Table 3.9b summarizes the<br />
design capacity and historic flows <strong>for</strong> the plants. These WWTPs, with a design<br />
capacity total of 5.8 mgd, discharged over 3 mgd in 2005. WWTPs in this watershed<br />
with design capacities less than 1 mgd have a combined design capacity of 3.1 mgd.<br />
As with Heron Lake discussed previously and below, smaller WWTPs in proximity to<br />
an industry may be a potential supplier of reclaimed water. With over 30% of the<br />
watershed’s wastewater treatment system capacity in facilities less than 1 mgd, and<br />
the agricultural industry potential in this area, smaller WWTPs should be evaluated<br />
more closely in Task 2.
Section 3<br />
Inventory of Major WWTPs and Potential <strong>Industrial</strong> Reuse Demands<br />
Table 3.9a. <strong>Industrial</strong> <strong>Water</strong> <strong>Use</strong> in the Des Moines River <strong>Water</strong>shed<br />
2004 <strong>Water</strong> <strong>Use</strong>, mgd<br />
Industry Category Ground <strong>Water</strong> Surface <strong>Water</strong> Total<br />
Agricultural Processing 0.56 0.00 0.56<br />
Sand & Gravel Washing 0.00 0.10 0.10<br />
Total 0.56 0.10 0.66<br />
Source: MDNR, 2004<br />
Table 3.9b. WWTPs in the Des Moines River <strong>Water</strong>shed<br />
Design 2005 Ann Avg Flow as % of<br />
Facility Name Capacity, mgd Flow, mgd Design Capacity<br />
Windom WWTP 1.830 1.074 58.7%<br />
Worthington WWTP 4.000 1.992 49.8%<br />
Total<br />
Source: MPCA, 2005<br />
5.830 3.066 52.6%<br />
WATER USE (MGD)<br />
0.6<br />
0.5<br />
0.4<br />
0.3<br />
0.2<br />
0.1<br />
0<br />
241 244<br />
USE CODE<br />
Ground <strong>Water</strong><br />
Surface <strong>Water</strong><br />
241 Agricultural Processing<br />
244 Sand and Gravel Washing<br />
Figure 3.9a <strong>Industrial</strong> Processing <strong>Water</strong> <strong>Use</strong> in the Des Moines River <strong>Water</strong>shed, 2004<br />
Source: MDNR, 2004<br />
3-12 Craddock Consulting Engineers<br />
In Association with CDM & James Crook<br />
WWReuseTM1_Sec 3_final.doc
Section 3<br />
Inventory of Major WWTPs and Potential <strong>Industrial</strong> Reuse Demands<br />
Craddock Consulting Engineers 3-13<br />
In Association with CDM & James Crook<br />
WWReuseTM1_Sec 3_final.doc<br />
Industries and Proximity to WWTPs<br />
Figure 3.9b presents the location of the industries and WWTPs in the Des Moines<br />
River watershed. Table 3.9c lists the various industries and their distance from the<br />
closer of the two WWTPs. The agricultural processing industries are all located<br />
within 3 miles of a WWTP. The Heron Lake WWTP is not shown because its design<br />
capacity of 0.1 mgd is less than 1 mgd. The ethanol plant and wastewater treatment<br />
plant modifications <strong>for</strong> Heron Lake will be investigated further in Task 2. One sand<br />
and gravel business is located about 4 miles from the Windom WWTP, while the<br />
other businesses are located more than 10 miles from a WWTP.<br />
Table 3.9c. Industries in the Des Moines River <strong>Water</strong>shed<br />
2004 <strong>Water</strong><br />
Distance to<br />
WWTP, Closest<br />
Industry Name Source* <strong>Use</strong>, mgd miles WWTP Industry Category<br />
HERON LAKE, CITY OF G 0.089 9.6 Windom Agricultural Processing<br />
HERON LAKE, CITY OF G 0.098 9.6 Windom Agricultural Processing<br />
PM WINDOM G 0.200 6.5 Windom Agricultural Processing<br />
PM WINDOM G 0.077 6.5 Windom Agricultural Processing<br />
PM WINDOM G 0.098 6.5 Windom Agricultural Processing<br />
WORTHINGTON RENDERING S 0.003 1.7 Worthington Agricultural Processing<br />
WILLETT GRAVEL CO S 0.001 >10 Windom Non-Metallic Processing<br />
MUECKE SAND & GRAVEL, R A S 0.100 >10 Windom Sand and Gravel Washing<br />
WINDOM READY MIX INC S 0.000 3.3 Windom Sand and Gravel Washing<br />
WINDOM READY MIX INC<br />
* G=Ground <strong>Water</strong>; S=Surface <strong>Water</strong><br />
Source: MDNR, 2004<br />
S 0.000 7.1 Windom Sand and Gravel Washing<br />
Factors Influencing Potential <strong>for</strong> <strong>Industrial</strong> Reuse<br />
The Des Moines River watershed is in Ground <strong>Water</strong> Area 5, represented by limited<br />
bedrock and buried sand aquifers and moderate producing surficial sand aquifers.<br />
The water quality of the buried sand and gravel and Cretaceous aquifers often yield<br />
water of poor natural quality, typically high in sulfate and total dissolved solids. The<br />
highest yielding aquifers in this region are mostly narrow, channel outwash deposits<br />
which are susceptible to contamination, notably nitrates. Many residents rely on rural<br />
water supply systems because domestic wells are contaminated with nitrates. The<br />
area around Worthington and the central portion of the watershed is typically less<br />
susceptible to contamination than the other areas.<br />
<strong>Water</strong> quantity of appropriate quality has been an issue <strong>for</strong> potable water suppliers of<br />
this watershed. The cities of Luverne and Worthington, the Lincoln-Pipestone Rural<br />
<strong>Water</strong> System and Rock County Rural <strong>Water</strong> System are working with communities<br />
in South Dakota and Iowa to provide another source of water to the Des Moines and<br />
Missouri River watersheds in Minnesota’s borders: the Lewis and Clark Rural <strong>Water</strong><br />
System.
Section 3<br />
Inventory of Major WWTPs and Potential <strong>Industrial</strong> Reuse Demands<br />
The Lewis and Clark Rural <strong>Water</strong> System will draw water from a well system near the<br />
Missouri River southwest of Vermillion, South Dakota. The water will be diverted,<br />
treated and distributed through a network of pipelines, pump stations,<br />
interconnections and storage reservoirs to service connections with each of the 15<br />
municipalities and 5 rural water systems of South Dakota, Iowa, and Minnesota that<br />
are currently members of the Lewis & Clark Rural <strong>Water</strong> System. The system is<br />
designed <strong>for</strong> a maximum capacity of 27.2 mgd with an average delivery of 19.6 mgd.<br />
This project has been pursued over the past two decades and construction was<br />
initiated in Minnesota in 2005.<br />
Lower Mississippi River<br />
<strong>Industrial</strong> <strong>Water</strong> <strong>Use</strong><br />
The Lower Mississippi River watershed has a diverse base of industries, as<br />
summarized in Table 3.10a and Figures 3.10a and 3.10b. The largest water use is<br />
related to power generation facilities (nuclear power plant, steam power cooling and<br />
miscellaneous power generation uses): averaging 578 mgd in 2004, of which all but 1<br />
mgd was obtained from surface water supplies. The Prairie Island Nuclear Plant used<br />
over 500 mgd in 2004 and another 70 mgd was used <strong>for</strong> once-through cooling at the<br />
Xcel facility near Red Wing and the Rochester Public Utilities plant. There are several<br />
agricultural processing facilities in this watershed with a combined water use of 2.9<br />
mgd in 2004. Flint Hills Resources withdrew 7 mgd from its set of wells <strong>for</strong> processing<br />
of petrochemical products.<br />
Table 3.10a. <strong>Industrial</strong> <strong>Water</strong> <strong>Use</strong> in the Lower Mississippi River <strong>Water</strong>shed<br />
2004 <strong>Water</strong> <strong>Use</strong>, mgd<br />
Industry Category<br />
Ground<br />
<strong>Water</strong> Surface <strong>Water</strong> Total<br />
Agricultural Processing 2.89 0.00 2.89<br />
<strong>Industrial</strong> Process Cooling - Once Through 0.38 0.01 0.39<br />
Metal Processing 0.70 0.00 0.70<br />
Non-Metallic Processing 1.02 0.00 1.02<br />
Nuclear Power Plant 0.09 505.84 505.93<br />
Petroleum - Chemical Processing, ethanol 7.00 0.00 7.00<br />
Power Generation 0.55 0.00 0.55<br />
Sand & Gravel Washing 0.27 1.58 1.85<br />
Steam Power Cooling - Once Through 0.00 71.38 71.38<br />
Steam Power Cooling - Wet Tower 0.41 0.00 0.41<br />
Total 13.31 578.81 592.12<br />
Source: MDNR, 2004<br />
WWTPs<br />
There are 12 municipal WWTPs in this watershed with design capacities greater than 1<br />
mgd. Table 3.10b summarizes the design capacity and historic flows <strong>for</strong> the plants.<br />
There are three facilities within 70% of the design capacity: Owatonna, Plainview-Elgin,<br />
and Rochester. Rochester is nearing completion of construction <strong>for</strong> an expansion to 24<br />
3-14 Craddock Consulting Engineers<br />
In Association with CDM & James Crook<br />
WWReuseTM1_Sec 3_final.doc
Figure 3.9b. Des Moines River <strong>Water</strong>shed<br />
<strong>Industrial</strong> Reuse Customer Inventory<br />
") Agricultural Processing<br />
") Non-Metallic Processing<br />
") Sand and Gravel Washing<br />
")<br />
#*<br />
#*<br />
!(<br />
")<br />
")<br />
"<br />
!<br />
Worthington<br />
"<br />
#<br />
#<br />
Major Lakes<br />
Major Rivers<br />
Windom<br />
"<br />
" !<br />
Source: Minnesota DNR <strong>Water</strong> Appropriations Permit Program, 2004 (Withdrawls greater than 1 mgy or 10,000 gpd)<br />
Des Moines<br />
"<br />
WWTP >= 5 mgd<br />
WWTP 1-5 mgd<br />
Ground <strong>Water</strong><br />
Surface <strong>Water</strong><br />
Cities/Townships<br />
"<br />
"<br />
"<br />
"<br />
"<br />
"<br />
!( 0.00 - 0.50 mgd<br />
!( 0.51 - 1.50 mgd<br />
!( 1.51 - 5.00 mgd<br />
!( 5.01 - 10.00 mgd<br />
!(<br />
!(<br />
10.01 - 25.00 mgd<br />
25.01 - 505.00 mgd<br />
¯<br />
0 30 60 Miles
Section 3<br />
Inventory of Major WWTPs and Potential <strong>Industrial</strong> Reuse Demands<br />
Craddock Consulting Engineers 3-15<br />
In Association with CDM & James Crook<br />
WWReuseTM1_Sec 3_final.doc<br />
mgd. In 2005, approximately 40 mgd of treated wastewater was discharged into the<br />
Lower Mississippi River watershed from these 12 facilities. Smaller WWTPs account <strong>for</strong><br />
16% of the combined capacity of WWTPs discharging to surface waters in the Lower<br />
Mississippi River watershed. This would equate to an annual average flow of 15 mgd if<br />
these rural communities grew to use the full capacity of their WWTPs.<br />
WATER USE (MGD)<br />
8<br />
7<br />
6<br />
5<br />
4<br />
3<br />
2<br />
1<br />
0<br />
241 244 245 246 247 248<br />
USE CODE<br />
Ground <strong>Water</strong><br />
Surface <strong>Water</strong><br />
Figure 3.10a. <strong>Industrial</strong> Processing <strong>Water</strong> <strong>Use</strong> in the Lower Mississippi River <strong>Water</strong>shed, 2004<br />
WATER USE (MGD)<br />
600<br />
500<br />
400<br />
300<br />
200<br />
100<br />
0<br />
222 223 226 229<br />
USE CODE<br />
241 Agricultural Processing<br />
244 Sand and Gravel Washing<br />
245 <strong>Industrial</strong> Process Cooling<br />
Once - through<br />
246 Petroleum-chemical<br />
processing, ethanol<br />
247 Metal Processing<br />
248 Non-Metallic Processing<br />
Ground <strong>Water</strong><br />
Surface <strong>Water</strong><br />
Source: MDNR, 2004<br />
222 Steam Power Cooling -<br />
Once through<br />
223 Steam Power Cooling -<br />
Wet Tower<br />
226 Nuclear Power Plant<br />
229 Power Generation<br />
Figure 3.10b. Power Generation <strong>Water</strong> <strong>Use</strong> in the Lower Mississippi River <strong>Water</strong>shed, 2004<br />
Source: MDNR, 2004
Section 3<br />
Inventory of Major WWTPs and Potential <strong>Industrial</strong> Reuse Demands<br />
Table 3.10b. WWTPs in the Lower Mississippi River <strong>Water</strong>shed<br />
Facility Name<br />
Design<br />
Capacity, mgd<br />
2005 Ann Avg<br />
Flow, mgd<br />
Flow as % of<br />
Design<br />
Capacity<br />
Faribault WWTP 7.0 3.697 52.8%<br />
Lake City WWTP 1.52 0.558 36.7%<br />
Met Council - Empire WWTP* 24 8.458 35.2%<br />
Met Council - Rosemount WWTP* 1.3 0.903 69.5%<br />
Northfield WWTP 5.20 2.067 39.8%<br />
Owatonna WWTP<br />
Plainview-Elgin Sanitary District<br />
5.0 3.531 70.6%<br />
WWTP 1.421 1.053 74.1%<br />
Red Wing WWTP 4.0 2.057 51.4%<br />
Rochester <strong>Water</strong> Reclamation Plant 19.1 13.462 70.5%<br />
Stewartville WWTP 1.111 0.531 47.8%<br />
Whitewater River Regional WWTP 1.12 0.701 62.6%<br />
Winona WWTP 6.5 3.947 60.7%<br />
Total 77.27 40.965 53.0%<br />
* The Rosemount WWTP is located in the Lower Mississippi River <strong>Water</strong>shed, but discharges into the Mississippi<br />
River-Headwaters watershed. In 2007 the Empire WWTP will move its discharge near the Rosemount WWTP<br />
discharge and the Rosemount WWTP will be phased out.<br />
Source: MPCA, 2005<br />
Industries and Proximity to WWTPs<br />
A total of 56 industries are permitted to withdraw ground and/or surface water in the<br />
Lower Mississippi River watershed and 25 of these are located within 4 miles of a<br />
larger municipal WWTP. Figure 3.10c presents the location of the industries and<br />
WWTPs in the Lower Mississippi River watershed. Table 3.10c summarizes the<br />
industries within a 4 mile radius of a WWTP. Appendix C provides the full industry<br />
list.<br />
Winona has the largest number of industries in close proximity to its WWTP. <strong>Water</strong> is<br />
used <strong>for</strong> metal processing by Badger Foundry Company and Peerless Chain<br />
Company, non-metallic processing by RTP Company, industrial process cooling by<br />
Cytec Engineered Materials, and agricultural processing by International Malting<br />
Company. Red Wing and Faribault are two other cities with multiple industries<br />
within proximity to their WWTP.<br />
There are several agricultural processing facilities within 4 miles of a WWTP. The<br />
larger agricultural processing water users are Associated Milk Producers near the<br />
Rochester WRP (2.7 mgd), International Malting Co. (1 mgd) in the Winona area, and<br />
Marigold Foods (0.3 mgd) near the Met Council’s Empire WWTP.<br />
3-16 Craddock Consulting Engineers<br />
In Association with CDM & James Crook<br />
WWReuseTM1_Sec 3_final.doc
")<br />
")<br />
")<br />
")<br />
Figure 3.10c. Lower Mississippi River <strong>Water</strong>shed<br />
<strong>Industrial</strong> Reuse Customer Inventory<br />
Agricultural Processing<br />
<strong>Industrial</strong> Process Cooling<br />
<strong>Industrial</strong> Processing<br />
Metal Processing<br />
") Non-Metallic Processing<br />
") Petroleum-Chemical Processing<br />
") Sand and Gravel Washing<br />
") Power Generation<br />
" Met Council - Rosemount<br />
!<br />
! #<br />
! " ! ! "<br />
! Met Council<br />
"<br />
- Empire<br />
" ! #<br />
"<br />
"<br />
"<br />
!" !<br />
Red Wing<br />
! "<br />
! # !<br />
Northfield<br />
"<br />
"<br />
Lake City<br />
"<br />
Faribault<br />
!<br />
"<br />
#<br />
!<br />
"<br />
Owatonna<br />
#<br />
"<br />
")<br />
#*<br />
#*<br />
!(<br />
")<br />
")<br />
#<br />
Cannon<br />
!<br />
St. Croix<br />
!<br />
!<br />
!<br />
!<br />
Major Lakes<br />
Major Rivers<br />
!<br />
!<br />
#<br />
!<br />
Plainview-Elgin Sanitary District<br />
!<br />
! #<br />
Rochester " <strong>Water</strong> Reclamation Plant<br />
Winona<br />
!<br />
!<br />
! # !" !<br />
!<br />
!<br />
! # !<br />
!<br />
Whitewater River ! Regional<br />
#<br />
Mississippi<br />
Stewartville<br />
!<br />
Upper Iowa<br />
Zumbro<br />
Source: Minnesota DNR <strong>Water</strong> Appropriations Permit Program, 2004 (Withdrawls greater than 1 mgy or 10,000 gpd)<br />
"<br />
"<br />
!<br />
#<br />
"<br />
Root<br />
" !<br />
!( 0.00 - 0.50 mgd<br />
!( 0.51 - 1.50 mgd<br />
"<br />
¯<br />
WWTP >= 5 mgd " !( 1.51 - 5.00 mgd<br />
WWTP 1-5 mgd " !( 5.01 - 10.00 mgd<br />
Ground <strong>Water</strong><br />
Surface <strong>Water</strong><br />
Cities/Townships<br />
"<br />
"<br />
!( 10.01 - 25.00 mgd<br />
!( 25.01 - 505.00 mgd<br />
0 30 60 Miles
Section 3<br />
Inventory of Major WWTPs and Potential <strong>Industrial</strong> Reuse Demands<br />
Table 3.10c. Industries in the Lower Mississippi River <strong>Water</strong>shed Within 4 Miles of a WWTP<br />
Industry Name Source*<br />
Craddock Consulting Engineers 3-17<br />
In Association with CDM & James Crook<br />
WWReuseTM1_Sec 3_final.doc<br />
2004<br />
<strong>Water</strong><br />
<strong>Use</strong>,<br />
mgd<br />
Distance<br />
to<br />
WWTP,<br />
miles Closest WWTP Industry Category<br />
ARCHER DANIELS MIDLAND CO G 0.206 1.0 Red Wing Agricultural Processing<br />
ASSOCIATED MILK PRODUCERS G 0.696 2.7 Rochester WRP Agricultural Processing<br />
HORMEL FOODS CORP G 0.272 1.0 Fairbault Agricultural Processing<br />
IFP INC G 0.012 1.0 Fairbault Agricultural Processing<br />
INTERNATIONAL MALTING CO LLC G 0.238 3.3 Winona Agricultural Processing<br />
INTERNATIONAL MALTING CO LLC G 0.726 3.3 Winona Agricultural Processing<br />
LAKESIDE FOODS INC G 0.075 3.0 Plainview - Elgin Agricultural Processing<br />
MARIGOLD FOODS INC G 0.162 2.0 MetC-Empire Agricultural Processing<br />
MARIGOLD FOODS INC G 0.157 2.0 MetC-Empire Agricultural Processing<br />
PLAINVIEW MILK PROD COOP G 0.191 3.0 Plainview - Elgin Agricultural Processing<br />
PROTEIN INGREDIENT<br />
TECHNOLOGIES INC G 0.052 2.0 Fairbault Agricultural Processing<br />
SENECA FOODS CORP G 0.049 4.0 Rochester WRP Agricultural Processing<br />
<strong>Industrial</strong> Process Cooling -<br />
CYTEC ENGINEERED MATERIALS G 0.077 3.3 Winona<br />
Once Through<br />
<strong>Industrial</strong> Process Cooling -<br />
FARIBAULT WOOLEN MILL COMPANY S 0.006 1.0 Fairbault<br />
KERRY BIOFUNCTIONAL<br />
INGREDIENTS INC G 0.298 2.5 Rochester WRP<br />
Once Through<br />
<strong>Industrial</strong> Process Cooling -<br />
Once Through<br />
BADGER FOUNDRY CO G 0.052 1.0 Winona Metal Processing<br />
BADGER FOUNDRY CO G 0.373 1.0 Winona Metal Processing<br />
PEERLESS CHAIN COMPANY G 0.266 1.0 Winona Metal Processing<br />
8TH AND JEFFERSON LLC G 0.001 1.0 Winona Non-Metallic Processing<br />
GENOVA INC G 0.139 1.0 Fairbault Non-Metallic Processing<br />
RTP COMPANY G 0.177 2.5 Winona Non-Metallic Processing<br />
RTP COMPANY G 0.259 2.5 Winona Non-Metallic Processing<br />
S B FOOT TANNING CO G 0.135 2.6 Red Wing Non-Metallic Processing<br />
S B FOOT TANNING CO G 0.172 2.6 Red Wing Non-Metallic Processing<br />
USG INTERIORS INC G 0.034 2.3 Red Wing Non-Metallic Processing<br />
USG INTERIORS INC G 0.001 2.3 Red Wing Non-Metallic Processing<br />
FRANKLIN HEATING STATION G 0.136 4.0 Rochester WRP POWER GENERATION<br />
FRANKLIN HEATING STATION G 0.367 4.0 Rochester WRP POWER GENERATION<br />
BARSNESS CONSTRUCTION & EXCA S 0.000 2.3 Northfield Sand and Gravel Washing<br />
CEMSTONE PRODUCTS G 0.011 3.8 MetC-Empire Sand and Gravel Washing<br />
STEAM POWER COOLING -<br />
NSP CO DBA XCEL ENERGY S 44.763 1.0 Red Wing ONCE THROUGH<br />
STEAM POWER COOLING -<br />
ROCHESTER PUBLIC UTILITIES S 26.622 3.0 Rochester WRP ONCE THROUGH<br />
STEAM POWER COOLING -<br />
ROCHESTER PUBLIC UTILITIES<br />
* G=Ground <strong>Water</strong>; S=Surface <strong>Water</strong><br />
Source: MDNR, 2004<br />
G 0.405 3.0 Rochester WRP WET TOWER
Section 3<br />
Inventory of Major WWTPs and Potential <strong>Industrial</strong> Reuse Demands<br />
Flint Hills Resources is the largest non-power related industrial water user in this<br />
watershed. Approximately 7 mgd was pumped from its well field in 2004 <strong>for</strong> its total<br />
facility use. They are in the process of system modifications to reuse their process<br />
water rather than add an additional well. <strong>Municipal</strong> WWTP effluent use at Flint Hills<br />
Resources was evaluated during the facility planning stages of the Met Council’s<br />
Empire WWTP expansion; the outfall <strong>for</strong> this plant will be moved to discharge into<br />
the Upper Mississippi River watershed and will be within 2 miles of Flint Hills<br />
Resources. While earlier discussions on reclaimed water from Empire were not<br />
pursued because of water quality issues, notably high chlorides in the Empire WWTP<br />
effluent, it is possible that potential future Flint Hills Resources expansions could<br />
consider this source. Also, the industrial areas along the outfall could benefit from this<br />
potential 24 mgd source of reclaimed water. More detailed investigations of this area<br />
will be conducted in Task 2.<br />
Factors Influencing Potential <strong>for</strong> <strong>Industrial</strong> Reuse<br />
The majority of the Lower Mississippi River watershed has a good bedrock source<br />
water supply that most communities rely on as their primary water source. Most of<br />
the watershed is in Ground <strong>Water</strong> Area 3 of the state, with eastern regions in Area 2<br />
and the northern reaches in Area 1. All three areas have a reliable and productive<br />
bedrock aquifer.<br />
Area 3 has extensive near-surface karst areas that result in aquifers being vulnerable<br />
to contamination. There is wide-spread nitrate contamination in near-surface aquifers<br />
as well occurrences of pesticides and other contaminants. The susceptibility to<br />
contamination index places this watershed in the medium to highest range. Area 2 on<br />
the western edge of the watershed has a more productive buried sand aquifer, but<br />
still limited surficial sand aquifers. The northern watershed, in Area 1, has a reliable<br />
supply <strong>for</strong> all three general aquifer levels.<br />
Portions of the Lower Mississippi River watershed will be affected by the TMDL <strong>for</strong><br />
Lake Pepin. The planning process on this TMDL has established preliminary targets<br />
of phosphorus and solids loading reductions of one-half into Lake Pepin. While<br />
nonpoint sources are significant contributions to this load, it is likely that most point<br />
sources will be considered <strong>for</strong> loading reductions.<br />
Minnesota River<br />
<strong>Industrial</strong> <strong>Water</strong> <strong>Use</strong><br />
With the exception of water <strong>for</strong> once through cooling of Xcel Energy’s power plant,<br />
industrial water use in the watershed is dominated by the demands of the agricultural<br />
processing industry. As shown in Figures 3.11a and 3.11b and Table 3.11a, over 60%<br />
of the ground water withdrawals were <strong>for</strong> agricultural processing facilities. While the<br />
watershed houses a diverse set of industries, most of the other industries have fairly<br />
small demands.<br />
3-18 Craddock Consulting Engineers<br />
In Association with CDM & James Crook<br />
WWReuseTM1_Sec 3_final.doc
WATER USE (MGD)<br />
Section 3<br />
Inventory of Major WWTPs and Potential <strong>Industrial</strong> Reuse Demands<br />
Craddock Consulting Engineers 3-19<br />
In Association with CDM & James Crook<br />
WWReuseTM1_Sec 3_final.doc<br />
12<br />
10<br />
8<br />
6<br />
4<br />
2<br />
0<br />
241 242 243 244 245 246 247 248 249<br />
USE CODE<br />
Ground <strong>Water</strong><br />
Surface <strong>Water</strong><br />
241 Agricultural Processing<br />
242 Pulp and Paper Processing<br />
243 Mine Processing<br />
244 Sand and Gravel Washing<br />
245 <strong>Industrial</strong> Process Cooling<br />
Once-through<br />
246 Petroleum-Chemical<br />
Processing, ethanol<br />
247 Metal Processing<br />
248 Non-Metallic Processing<br />
249 <strong>Industrial</strong> Processing<br />
Figure 3.11a. <strong>Industrial</strong> Processing <strong>Water</strong> <strong>Use</strong> in the Minnesota River <strong>Water</strong>shed, 2004<br />
WATER USE (MGD)<br />
350<br />
300<br />
250<br />
200<br />
150<br />
100<br />
50<br />
0<br />
222<br />
USE CODE<br />
Source: MDNR, 2004<br />
Ground <strong>Water</strong><br />
Surface <strong>Water</strong><br />
222 Steam Power Cooling - Once<br />
through<br />
Figure 3.11b. Power Generation <strong>Water</strong> <strong>Use</strong> in the Minnesota River <strong>Water</strong>shed, 2004<br />
Source: MDNR, 2004
Section 3<br />
Inventory of Major WWTPs and Potential <strong>Industrial</strong> Reuse Demands<br />
Table 3.11a. <strong>Industrial</strong> <strong>Water</strong> <strong>Use</strong> in the Minnesota River <strong>Water</strong>shed<br />
2004 <strong>Water</strong> <strong>Use</strong>, mgd<br />
Ground<br />
Industry Category<br />
<strong>Water</strong> Surface <strong>Water</strong> Total<br />
Agricultural Processing 11.14 0.00 11.14<br />
<strong>Industrial</strong> Process Cooling - Once Through 1.88 0.00 1.88<br />
<strong>Industrial</strong> Processing 0.17 0.00 0.17<br />
Metal Processing 1.31 0.00 1.31<br />
Mine Processing 0.20 0.04 0.24<br />
Non-Metallic Processing 0.43 0.00 0.43<br />
Petroleum - Chemical Processing, ethanol 1.18 0.00 1.18<br />
Pulp and Paper Processing 0.05 0.00 0.05<br />
Sand and Gravel Washing 0.83 1.62 2.45<br />
Steam Power Cooling - Once Through 0.11 326.00 326.11<br />
Total<br />
Source: MDNR, 2004<br />
17.30 327.66 344.96<br />
WWTPs<br />
There are 15 municipal WWTPs in the Minnesota River watershed with design<br />
capacities greater than 1 mgd. As shown in Table 3.11b, there are 3 plants with rated<br />
capacities greater than 10 mgd: Met Council’s Blue Lake and Seneca WWTPs and the<br />
Mankato WWTP. These 15 WWTPs discharged 73 mgd in 2005. The smaller WWTPs<br />
in the watershed have a combined design capacity of nearly 23 mgd, representing<br />
approximately 15% of the WWTP capacity in the watershed.<br />
Industries and Proximity to WWTPs<br />
As shown on Figure 3.11c, there are many industries of various categories residing in<br />
the Minnesota River watershed. Table 3.11c lists the various industries that are within<br />
five miles of a WWTP. Mankato has the largest number of industries in proximity of<br />
its WWTP. There are a variety of industry types utilizing ground water supplies that<br />
could be candidate industries <strong>for</strong> Mankato, in addition to the near completed<br />
construction of their project with Calpine Corporation (<strong>for</strong> 6 mgd of reclaimed water).<br />
There are several sand and gravel washing operations in St. Peter, but they are four to<br />
five miles away.<br />
Factors Influencing Potential <strong>for</strong> <strong>Industrial</strong> Reuse<br />
The Minnesota River watershed has a diverse geology that provides <strong>for</strong> three<br />
different ground water areas. Ground <strong>Water</strong> Area 5 covers the central to western<br />
reaches of the watershed. It is characterized with limited bedrock aquifers, moderate<br />
surficial sand aquifers and limited buried sand aquifers. In the north parts of the<br />
watershed, the surficial and buried sand aquifers are more productive. The eastern<br />
portions are characterized by Ground <strong>Water</strong> Area 2, which has good bedrock aquifers,<br />
moderate buried sand aquifers, and limited surfical aquifers. Well interference has<br />
occurred in some areas. The ground water contamination susceptibility of this<br />
3-20 Craddock Consulting Engineers<br />
In Association with CDM & James Crook<br />
WWReuseTM1_Sec 3_final.doc
Minnesota<br />
Figure 3.11c. Minnesota River <strong>Water</strong>shed<br />
<strong>Industrial</strong> Reuse Customer Inventory<br />
"<br />
"<br />
! !<br />
Pomme de Terre<br />
"<br />
!<br />
"<br />
!<br />
Chippewa<br />
!<br />
Marshall<br />
" #<br />
" " !<br />
!<br />
" !!!<br />
!<br />
!<br />
#<br />
!<br />
Granite Falls<br />
# " ! !<br />
"<br />
Cottonwood<br />
") Agricultural Processing<br />
") <strong>Industrial</strong> Process Cooling<br />
") <strong>Industrial</strong> Processing<br />
") Metal Processing<br />
") Mine Processing<br />
") Non-Metallic Processing<br />
") Petroleum-Chemical Processing<br />
") Pulp and Paper Processing<br />
") Sand and Gravel Washing<br />
") Power Generation<br />
Montevideo<br />
! ! ! "<br />
Redwood<br />
")<br />
#*<br />
#*<br />
!(<br />
")<br />
")<br />
"<br />
!<br />
!<br />
! !! !<br />
"<br />
#<br />
Major Lakes<br />
Major Rivers<br />
! " !<br />
!<br />
!! ! Met ! Council !<br />
! - Seneca<br />
Met Council - Blue Lake !<br />
! !<br />
! ! ! ! #<br />
!<br />
! # !<br />
! "! ! !<br />
! !<br />
"<br />
"<br />
!<br />
New Prague<br />
! !<br />
"<br />
! #<br />
New Ulm<br />
! # " !<br />
Madelia<br />
#<br />
WWTP >= 5 mgd<br />
WWTP 1-5 mgd<br />
Ground <strong>Water</strong><br />
Surface <strong>Water</strong><br />
Cities/Townships<br />
Watonwan<br />
St James<br />
!<br />
!<br />
! Mankato !<br />
!<br />
!"<br />
! #<br />
"<br />
Winnebago<br />
# ! !<br />
Fairmont<br />
# " !<br />
!<br />
!<br />
!<br />
!<br />
" St Peter<br />
#<br />
#<br />
!<br />
Wells<br />
#<br />
Waseca<br />
Source: Minnesota DNR <strong>Water</strong> Appropriations Permit Program, 2004 (Withdrawls greater than 1 mgy or 10,000 gpd)<br />
"<br />
"<br />
"<br />
"<br />
"<br />
"<br />
!(<br />
"<br />
Le Sueur<br />
!( 0.00 - 0.50 mgd<br />
!( 0.51 - 1.50 mgd<br />
!( 1.51 - 5.00 mgd<br />
!( 5.01 - 10.00 mgd<br />
!(<br />
¯<br />
10.01 - 25.00 mgd<br />
25.01 - 505.00 mgd<br />
0 30 60 Miles
Section 3<br />
Inventory of Major WWTPs and Potential <strong>Industrial</strong> Reuse Demands<br />
Craddock Consulting Engineers 3-21<br />
In Association with CDM & James Crook<br />
WWReuseTM1_Sec 3_final.doc<br />
watershed varies from low to high. Surficial sand aquifers have shown nitrate<br />
contamination.<br />
The Minnesota River watershed dischargers will be affected by the TMDL <strong>for</strong> the<br />
Minnesota River and the downstream Lake Pepin TMDL. The agricultural practices<br />
and natural characteristics of this watershed have contributed to making it a<br />
significant contributor to phosphorus and solids loadings at Lake Pepin. This<br />
watershed will be an integral part of the TMDL process and receiving stream<br />
discharge limits could push some municipalities to consider wastewater reuse.<br />
Table 3.11b. WWTPs in the Minnesota River <strong>Water</strong>shed<br />
Design 2005 Ann Flow as %<br />
Capacity, Avg Flow, of Design<br />
Facility Name<br />
mgd mgd Capacity<br />
Fairmont WWTP 3.9 1.595 41%<br />
Granite Falls WWTP 1.111 0.477 43%<br />
Madelia WWTP 1.31 0.907 69%<br />
Mankato WWTP 11.25 6.861 61%<br />
Marshall WWTP 4.5 2.5180 56%<br />
Met Council - Blue Lake WWTP 37 28.420 77%<br />
Met Council - Seneca WWTP 38 23.353 60%<br />
Montevideo WWTP 3.0 1.083 36%<br />
New Prague WWTP 1.378 0.662 48%<br />
New Ulm WWTP 6.77 2.582 38%<br />
St James WWTP 2.960 1.032 35%<br />
St Peter WWTP 4.0 1.170 29%<br />
Waseca WWTP 3.5 1.580 45%<br />
Wells Easton Minnesota Lake WWTP 1.088 0.516 47%<br />
Winnebago WWTP 1.7 0.592 35%<br />
Total<br />
Source: MPCA, 2005<br />
122.47 73.348 60%<br />
Note: Willmar WWTP discharges into the Minnesota River, but the facility resides in the Mississippi River-Headwaters. It is<br />
included with Mississippi River-Headwaters watershed summary.<br />
Mississippi River-Headwaters (Upper)<br />
<strong>Industrial</strong> <strong>Water</strong> <strong>Use</strong><br />
The Mississippi River-Headwaters or Upper Mississippi River watershed has the<br />
most diverse set of potential reuse industries, as shown in Table 3.12a and Figures<br />
3.12a and 3.12b. Cooling water, mainly <strong>for</strong> once-through systems <strong>for</strong> steam power and<br />
nuclear power facilities, is the dominant use of water by industries, totaling about 800<br />
mgd. The largest water users, outside of the power generation industry, are <strong>for</strong> pulp<br />
and paper processing at Blandin Paper Company, Grand Rapids and International<br />
Paper Company, St. Cloud. However, since both use Mississippi River water and the<br />
municipality’s use river water as their source, there is no added benefit to the ground<br />
water supply systems in those communities if they were reclaimed water customers.<br />
Agricultural processing industries were the largest user of ground water, using 6.5<br />
mgd in 2004. Metal processing, petroleum/chemical processing, and smaller pulp &<br />
paper facilities withdrew around 2 mgd each from the local aquifers in 2004.
Section 3<br />
Inventory of Major WWTPs and Potential <strong>Industrial</strong> Reuse Demands<br />
Table 3.11c. Industries in the Minnesota River <strong>Water</strong>shed Within 4 Miles of a WWTP<br />
Industry Name Source*<br />
2004<br />
<strong>Water</strong><br />
<strong>Use</strong>,<br />
mgd<br />
Distance<br />
to<br />
WWTP,<br />
miles Closest WWTP Industry Category<br />
FAIRMONT FOODS OF<br />
MINNESOTA G 0.032 1.4 Fairmont Agricultural Processing<br />
FAIRMONT, CITY OF S 0.409 1 Fairmont STEAM POWER COOLING - ONCE THROUGH<br />
NSP CO DBA XCEL ENERGY S 0.008 1 Granite Falls STEAM POWER COOLING - ONCE THROUGH<br />
CENEX HARVEST STATES<br />
COOPERATIVES G 3.578 2 Mankato Agricultural Processing<br />
WIS-PAK OF MANKATO INC G 0.371 2.5 Mankato Agricultural Processing<br />
VETTER STONE CO G 0.200 3.9 Mankato Mine Processing<br />
MINNESOTA QUARRIES INC G 0.117 1 Mankato Sand and Gravel Washing<br />
NSP CO DBA XCEL ENERGY G 0.000 1 Mankato STEAM POWER COOLING - ONCE THROUGH<br />
NSP CO DBA XCEL ENERGY S 21.581 1 Mankato STEAM POWER COOLING - ONCE THROUGH<br />
ANCHOR GLASS CONTAINER<br />
METC- Blue<br />
CORP G 0.067 2.0 Lake Non-Metallic Processing<br />
GREENMAN TECHNOLOGIES<br />
METC- Blue<br />
OF MN G 0.002 2.7 Lake Non-Metallic Processing<br />
INLAND PAPERBOARD &<br />
METC- Blue<br />
PACKAGING INC G 0.050 2.0 Lake<br />
METC- Blue<br />
Pulp and Paper Processing<br />
NSP CO DBA XCEL ENERGY G 0.000 1.0 Lake<br />
METC- Blue<br />
STEAM POWER COOLING - WET TOWER<br />
SHAKOPEE GRAVEL INC G 0.001 2.5 Lake Sand and Gravel Washing<br />
COCA-COLA BOTTLING MW G 0.706 3.7 METC- Seneca Agricultural Processing<br />
CYPRESS SEMICONDUCTOR G 0.853 2.5 METC- Seneca Metal Processing<br />
NSP CO DBA XCEL ENERGY S 295.460 2.5 METC- Seneca STEAM POWER COOLING - ONCE THROUGH<br />
NSP CO DBA XCEL ENERGY G 0.112 2.5 METC- Seneca STEAM POWER COOLING - ONCE THROUGH<br />
PEPSI COLA BOTTLING CO G 0.321 2.9 METC- Seneca Agricultural Processing<br />
POLARFAB LLC G 0.265 2.4 METC- Seneca Non-Metallic Processing<br />
SURMODICS INC G 0.003 4.0 METC- Seneca <strong>Industrial</strong> Processing<br />
ANCHOR GLASS CONTAINER<br />
METC- Blue<br />
CORP G 0.067 2.0 Lake Non-Metallic Processing<br />
GREENMAN TECHNOLOGIES<br />
METC- Blue<br />
OF MN G 0.002 2.7 Lake Non-Metallic Processing<br />
INLAND PAPERBOARD &<br />
METC- Blue<br />
PACKAGING INC<br />
ASSOCIATED MILK<br />
G 0.050 2.0 Lake Pulp and Paper Processing<br />
PRODUCERS G 0.000 1 New Prague Agricultural Processing<br />
AUGUST SCHELL BREWERY<br />
NEW ULM QUARTZITE<br />
G 0.000 1.5 New Ulm Agricultural Processing<br />
QUARRY<br />
SOUTHERN MINNESOTA<br />
S 0.042 1.3 New Ulm Mine Processing<br />
CONSTRUCTION CO G 0.150 4 St Peter Sand and Gravel Washing<br />
UNIMIN MINNESOTA CORP S 0.000 2.5 St Peter Sand and Gravel Washing<br />
CORN PLUS G 0.136 1 Winnebago Petroleum - Chemical Processing<br />
* G=Ground <strong>Water</strong>; S=Surface <strong>Water</strong><br />
Source: MDNR, 2004<br />
3-22 Craddock Consulting Engineers<br />
In Association with CDM & James Crook<br />
WWReuseTM1_Sec 3_final.doc
Section 3<br />
Inventory of Major WWTPs and Potential <strong>Industrial</strong> Reuse Demands<br />
Craddock Consulting Engineers 3-23<br />
In Association with CDM & James Crook<br />
WWReuseTM1_Sec 3_final.doc<br />
Table 3.12a. <strong>Industrial</strong> <strong>Water</strong> <strong>Use</strong> in the Mississippi River Headwaters <strong>Water</strong>shed<br />
2004 <strong>Water</strong> <strong>Use</strong>, mgd<br />
Industry Category Ground <strong>Water</strong> Surface <strong>Water</strong> Total<br />
Agricultural Processing 6.49 0.00 6.49<br />
Hydropower 0.00 0.12 0.12<br />
<strong>Industrial</strong> Process Cooling - Once Through 3.58 0.51 4.09<br />
<strong>Industrial</strong> Processing 0.87 0.00 0.87<br />
Metal Processing 1.88 0.00 1.88<br />
Mine Processing 0.24 0.00 0.24<br />
Non-Metallic Processing 0.95 0.00 0.95<br />
Nuclear Power Plant 0.05 346.60 346.65<br />
Petroleum - Chemical Processing, ethanol 2.13 0.00 2.13<br />
Power Generation 0.31 0.01 0.32<br />
Pulp and Paper Processing 2.17 26.84 29.01<br />
Sand and Gravel Washing 1.13 2.56 3.69<br />
Steam Power Cooling - Once Through 0.19 544.49 544.68<br />
Steam Power Cooling - Wet Tower 0.18 18.47 18.65<br />
Steam Power Other than Cooling 1.36 0.00 1.36<br />
Total 21.53 939.60 961.13<br />
Source: MDNR, 2004<br />
WWTPs<br />
As the most populated watershed, the Mississippi River-Headwaters watershed has<br />
the largest number of the WWTPs greater than 1 mgd and processes the most<br />
wastewater. In 2005, the WWTPs in this watershed discharged collectively 230 mgd<br />
from the 22 facilities in its borders. Table 3.12b lists the watersheds, their design<br />
capacity, and 2005 discharge volume. The Met Council’s Metropolitan WWTP, located<br />
in downtown St. Paul, provides treatment <strong>for</strong> the majority of the central and northern<br />
part of the metro area. It processed approximately 190 mgd of wastewater in 2005.<br />
Discussion of this and other Met Council facilities is reserved <strong>for</strong> Section 3.4.<br />
The next largest municipal discharger on the upper Mississippi River is the St. Cloud<br />
WWTP, which discharged 10 mgd in 2005, followed by several plants discharging 2 to<br />
4 mgd. Several of these facilities are nearing capacity, indicated by flows exceeding<br />
70% of the design capacity. These include Alexandria, Brainerd, Litchfield, Melrose,<br />
Met Council-Metro WWTP, St. Cloud and Willmar. Many of these municipalities are<br />
in the planning, design, or construction phase of an expansion. Task 2 will evaluate<br />
this in more detail.
Section 3<br />
Inventory of Major WWTPs and Potential <strong>Industrial</strong> Reuse Demands<br />
35<br />
600 30<br />
Ground <strong>Water</strong><br />
Surface <strong>Water</strong><br />
Ground <strong>Water</strong><br />
25<br />
500<br />
Surface 241 Agricultural <strong>Water</strong> Processing<br />
242 Pulp and Paper Processing<br />
20<br />
243 Mine Processing<br />
400<br />
244 Sand and Gravel Washing<br />
15<br />
300<br />
10<br />
200 5<br />
0<br />
100<br />
241 242 243 244 245 246 247 248<br />
245 <strong>Industrial</strong> Process Cooling<br />
221 Hydropower<br />
Once - through<br />
222 Steam Power Cooling - Once<br />
246 Petroleum-chemical<br />
through<br />
processing, ethanol<br />
223 Steam Power Cooling - Wet<br />
247 Metal Processing<br />
Tower<br />
248 Non-Metallic Processing<br />
225 Steam Power Other than Cooling<br />
249 <strong>Industrial</strong> Processing<br />
249 226 Nuclear Power Plant<br />
USE CODE<br />
0<br />
221 222 223 225 226 229<br />
Figure 3.12a. <strong>Industrial</strong> Processing <strong>Water</strong> <strong>Use</strong> in the Mississippi River Headwaters<br />
USE CODE<br />
<strong>Water</strong>shed, 2004<br />
WATER WATER USE (MGD) USE (MGD<br />
WATER USE (MGD<br />
35<br />
30<br />
25<br />
20<br />
15<br />
10<br />
5<br />
0<br />
241 242 243 244 245 246 247 248 249<br />
USE CODE<br />
Ground <strong>Water</strong><br />
Surface <strong>Water</strong><br />
241 Agricultural Processing<br />
242 Pulp and Paper Processing<br />
243 Mine Processing<br />
244 Sand and Gravel Washing<br />
245 <strong>Industrial</strong> Process Cooling<br />
Once - through<br />
246 Petroleum-chemical<br />
processing, ethanol<br />
247 Metal Processing<br />
248 Non-Metallic Processing<br />
249 <strong>Industrial</strong> Processing<br />
Figure 3.12a. <strong>Industrial</strong> Processing <strong>Water</strong> <strong>Use</strong> in the Mississippi River Headwaters<br />
<strong>Water</strong>shed, 2004<br />
Source: MDNR, 2004<br />
Figure 3.12b. Power Generation <strong>Water</strong> <strong>Use</strong> in the Mississippi River Headwaters<br />
<strong>Water</strong>shed, 2004<br />
Source: MDNR, 2004<br />
3-24 Craddock Consulting Engineers<br />
In Association with CDM & James Crook<br />
WWReuseTM1_Sec 3_final.doc
Section 3<br />
Inventory of Major WWTPs and Potential <strong>Industrial</strong> Reuse Demands<br />
Craddock Consulting Engineers 3-25<br />
In Association with CDM & James Crook<br />
WWReuseTM1_Sec 3_final.doc<br />
Table 3.12b. WWTPs in the Mississippi River Headwaters <strong>Water</strong>shed<br />
Facility Name<br />
Design Capacity,<br />
mgd<br />
2005 Ann Avg<br />
Flow, mgd<br />
Flow as % of<br />
Design Capacity<br />
Alexandria Lake Area Sanitary District 3.750 2.906 77.5%<br />
Bemidji WWTP 2.500 1.056 42.2%<br />
Brainerd WWTP 3.130 2.438 77.9%<br />
Buffalo WWTP 3.600 1.628 45.2%<br />
Cambridge WWTP 1.920 0.847 44.1%<br />
Camp Ripley WWTP 1.440 0.115 8.0%<br />
Elk River WWTP 2.200 1.186 53.9%<br />
Glencoe WWTP 2.600 0.69 26.5%<br />
Grand Rapids WWTP 15.200 7.33 48.2%<br />
Hutchinson WWTP 4.270 2.574 60.3%<br />
Litchfield WWTP 1.900 1.513 79.6%<br />
Little Falls WWTP 2.4 1.182 49.3%<br />
Melrose WWTP 2.5 2.001 80.0%<br />
Met Council - Eagles Point WWTP<br />
10.0 2.34 23.0%<br />
Met Council - Hastings WWTP<br />
2.9 1.592 54.9%<br />
Met Council - Metropolitan WWTP<br />
251 187.018 74.5%<br />
Monticello WWTP 2.360 1.189 50.4%<br />
Otsego WWTP East 1.650 0.206 12.5%<br />
Rogers WWTP 1.602 0.769 48.0%<br />
St Cloud WWTP 13.000 10.358 79.7%<br />
St Michael WWTP 2.445 0.834 34.1%<br />
Willmar WWTP 5.040 3.81 75.6%<br />
Total 337.4 233.6 69.2%<br />
Source: MPCA, 2005<br />
Industries and Proximity to WWTPs<br />
The watershed inventory displayed in Figure 3.12c shows the WWTPs in relation to<br />
the various industries in the watershed. The inventory shows that there are several<br />
WWTPs with industries in close proximity and most of these are agricultural<br />
processing industries. Examples include Seneca Foods in Glencoe, Burn Philip Food<br />
Ingredients in Hutchinson, Northern Food & Dairy in Alexandria, all of which have<br />
WWTPs within 1.5 miles of their operations. Table 3.12c lists industries within 4 miles<br />
of a WWTP. The complete list of industries in the Mississippi River-Headwaters<br />
watershed is in Appendix C.
Section 3<br />
Inventory of Major WWTPs and Potential <strong>Industrial</strong> Reuse Demands<br />
Table 3.12c. Industries in the Mississippi River Headwaters <strong>Water</strong>shed Within 4 Miles of a WWTP<br />
Industry Name Source*<br />
2004<br />
<strong>Water</strong> <strong>Use</strong>,<br />
mgd<br />
Distance<br />
to<br />
WWTP,<br />
miles Closest WWTP Industry Category<br />
OPTA FOOD INGREDIENTS INC G 0.200 1.00 Cambridge Agricultural Processing<br />
ELK RIVER, CITY OF S 0.006 1.00 Elk River POWER GENERATION<br />
STEAM POWER - OTHER THAN<br />
GREAT RIVER ENERGY G 0.054 1.00 Elk River<br />
COOLING<br />
STEAM POWER COOLING - ONCE<br />
GREAT RIVER ENERGY S 34.728 1.00 Elk River<br />
THROUGH<br />
ASSOCIATED MILK PRODUCERS G 0.024 1.00 Glencoe Agricultural Processing<br />
SENECA FOODS CORP G 0.478 1.00 Glencoe Agricultural Processing<br />
BURN PHILP FOOD INGREDIENTS G 0.917 1.00 Hutchinson Agricultural Processing<br />
FIRST DISTRICT ASSOC G 0.126 1.00 Litchfield Agricultural Processing<br />
DECHENE CORP G 0.004 1.00 Monticello<br />
Alexandria Lake Area<br />
Agricultural Processing<br />
NORTHERN FOOD & DAIRY INC G 0.000 1.50<br />
SD<br />
Alexandria Lake Area<br />
Agricultural Processing<br />
LEE, MARK G 0.001 1.50<br />
SD<br />
Alexandria Lake Area<br />
Sand and Gravel Washing<br />
ALEXANDRIA EXTRUSION CO G 0.004 1.50<br />
SD<br />
Alexandria Lake Area<br />
Metal Processing<br />
NORTHERN FOOD & DAIRY INC G 0.310 1.50<br />
SD Agricultural Processing<br />
BLANDIN PAPER CO S 16.680 1.50 Grand Rapids Pulp and Paper Processing<br />
BAUERLY BROTHERS INC G 0.004 1.50 Hutchinson Non-Metallic Processing<br />
EWING FARMS INC G 0.004 1.50 Monticello Agricultural Processing<br />
AGGREGATE INDUSTRIES-NCR INC G 0.009 2.00 Rogers Non-Metallic Processing<br />
HASSAN SAND & GRAVEL INC S 0.041 2.00 Rogers Sand and Gravel Washing<br />
JERRYS ICE SERVICE G 0.008 2.50 Bemidji <strong>Industrial</strong> Processing<br />
GRANITE CITY READY MIX S 0.259 2.50 St Cloud Sand and Gravel Washing<br />
BARTON SAND AND GRAVEL CO G 0.000 2.90 Elk River Sand and Gravel Washing<br />
XCEL OPTICAL COMPANY G 0.005 3.00 St Cloud Non-Metallic Processing<br />
BARTON SAND & GRAVEL G 0.089 3.50 Elk River Sand and Gravel Washing<br />
POTLATCH CORPORATION S 0.007 3.50 Grand Rapids Pulp and Paper Processing<br />
STEAM POWER COOLING - ONCE<br />
NSP CO DBA XCEL ENERGY S 132.737 3.70 METC - Metro<br />
THROUGH<br />
3M COMPANY G 2.788 2.00 METC- Eagles Point <strong>Industrial</strong> Process Cooling Once Thru<br />
LSP-COTTAGE GROVE LP G 0.000 2.00 METC- Eagles Point POWER GENERATION<br />
CAPTAIN KENS FOODS INC G 0.009 2.30 METC- Metropolitan Agricultural Processing<br />
CEMSTONE PRODUCTS G 0.007 2.30 METC- Metropolitan Non-Metallic Processing<br />
NORTH STAR STEEL MINNESOTA G 0.177 2.50 METC- Metropolitan Metal Processing<br />
NORTHERN MALLEABLE IRON CO G 0.038 3.00 METC- Metropolitan Metal Processing<br />
NRG ENERGY CENTER INC G 0.204 3.10 METC- Metropolitan Pulp and Paper Processing<br />
D & D LAND LLC G 0.000 3.30 METC- Metropolitan Non-Metallic Processing<br />
3M COMPANY G 0.322 3.40 METC- Metropolitan Non-Metallic Processing<br />
CEMSTONE PRODUCTS G 0.004 3.60 METC- Metropolitan <strong>Industrial</strong> Processing<br />
STEAM POWER COOLING - ONCE<br />
NSP CO DBA XCEL ENERGY S 132.737 3.70 METC- Metropolitan<br />
THROUGH<br />
ELK RIVER RED-E-MIX INC G 0.006 3.90 Elk River Non-Metallic Processing<br />
BAUERLY BROTHERS INC<br />
* G=Ground <strong>Water</strong>; S=Surface <strong>Water</strong><br />
Source: MDNR, 2004<br />
G 0.005 4.00 Cambridge Non-Metallic Processing<br />
3-26 Craddock Consulting Engineers<br />
In Association with CDM & James Crook<br />
WWReuseTM1_Sec 3_final.doc
Figure 3.12c. Mississippi River - Headwaters <strong>Water</strong>shed<br />
<strong>Industrial</strong> Reuse Customer Inventory<br />
Long Prairie<br />
!<br />
"<br />
!<br />
! ! "<br />
!<br />
!<br />
!<br />
!<br />
!<br />
!<br />
" !<br />
!<br />
Alexandria Lake Area Sanitary District<br />
!<br />
!<br />
!<br />
#<br />
Red Eye<br />
Crow Wing<br />
#<br />
#<br />
Bemidji<br />
!<br />
Melrose<br />
") Agricultural Processing<br />
") <strong>Industrial</strong> Process Cooling<br />
") <strong>Industrial</strong> Processing<br />
") Metal Processing<br />
") Mine Processing<br />
") Non-Metallic Processing<br />
") Petroleum-Chemical Processing<br />
") Pulp and Paper Processing<br />
") Sand and Gravel Washing<br />
") Power Generation<br />
#<br />
Leech Lake<br />
!<br />
!<br />
!<br />
#<br />
Brainerd "<br />
!<br />
"<br />
"<br />
Little Falls<br />
#<br />
"<br />
!<br />
!<br />
" !"<br />
" Grand Rapids<br />
" #<br />
" !<br />
" "<br />
"<br />
! "<br />
! "<br />
!<br />
!!!<br />
"<br />
!<br />
"<br />
!<br />
! !<br />
!<br />
"<br />
!<br />
"!<br />
"<br />
" !<br />
!<br />
!<br />
! !<br />
!<br />
" !<br />
!<br />
!<br />
!<br />
"<br />
! !<br />
! ! !<br />
!<br />
! " ! !<br />
" !<br />
! !<br />
!<br />
!<br />
!<br />
!<br />
!<br />
"<br />
!<br />
! !<br />
!<br />
!<br />
!<br />
! !<br />
" !<br />
!<br />
!<br />
!<br />
!<br />
St Cloud<br />
!<br />
! ! " ! # "<br />
!<br />
Cambridge<br />
# !<br />
! !<br />
!<br />
" "<br />
"<br />
" "!<br />
! Elk River<br />
! # "<br />
#<br />
"!<br />
!<br />
# !<br />
#<br />
Willmar<br />
Litchfield<br />
Monticello #<br />
!<br />
Otsego East<br />
#<br />
# ! # St Michael<br />
!! !<br />
!<br />
!<br />
Buffalo<br />
Rogers<br />
! !<br />
! ! !<br />
!<br />
!<br />
! ! ! ! ! !<br />
! !<br />
Met Council - Metropolitan<br />
!<br />
Hutchinson<br />
#<br />
#<br />
!<br />
Glencoe<br />
Met Council - Eagles Point<br />
! #<br />
!<br />
!<br />
Sauk<br />
Pine<br />
Camp Ripley<br />
South Fork Crow<br />
Minnesota<br />
"<br />
") Major Lakes<br />
Major Rivers<br />
#* WWTP >= 5 mgd<br />
#* WWTP 1-5 mgd<br />
!( Ground <strong>Water</strong><br />
")<br />
Surface <strong>Water</strong><br />
") Cities/Townships<br />
Rum<br />
Mississippi<br />
!<br />
!<br />
# #<br />
Mississippi<br />
Source: Minnesota DNR <strong>Water</strong> Appropriations Permit Program, 2004 (Withdrawls greater than 1 mgy or 10,000 gpd)<br />
" )<br />
")<br />
")<br />
")<br />
")<br />
")<br />
Met Council - Hastings<br />
!<br />
!<br />
!<br />
!<br />
!<br />
!<br />
0.00 - 0.50 mgd<br />
0.51 - 1.50 mgd<br />
¯<br />
1.51 - 5.00 mgd<br />
5.01 - 10.00 mgd<br />
10.01 - 25.00 mgd<br />
25.01 - 505.00 mgd<br />
0 25 50 Miles
Section 3<br />
Inventory of Major WWTPs and Potential <strong>Industrial</strong> Reuse Demands<br />
Craddock Consulting Engineers 3-27<br />
In Association with CDM & James Crook<br />
WWReuseTM1_Sec 3_final.doc<br />
Factors Influencing Potential <strong>for</strong> <strong>Industrial</strong> Reuse<br />
The northern three-quarters of the Mississippi River-Headwaters watershed is in<br />
Ground <strong>Water</strong> Area 4, known <strong>for</strong> good surficial aquifers, less reliable buried sand<br />
aquifers, and a limited supply from the bedrock. Well interference problems have<br />
been experienced in this area. The southern end, in the 7-county metro area through<br />
St. Cloud has a reliable bedrock supply and moderate bearing surficial and buried<br />
sand aquifers. The susceptibility <strong>for</strong> contamination index rates this watershed as<br />
medium to highest in the mid-watershed regions, with low susceptibility areas<br />
interspersed through the north and eastern parts of the watershed. As with the<br />
Minnesota River watershed, ground water supply and quality is highly variable<br />
across the watershed and site-specific conditions must be considered in evaluating the<br />
adequacy of the water supply.<br />
The Mississippi River-Headwaters watershed has similar surface water issues as the<br />
Lower Mississippi River and Minnesota River, particularly in relation to the Lake<br />
Pepin TMDL. Like these two watersheds, the metro area has a tremendous influence<br />
on the quality of the water leaving the watershed. <strong>Municipal</strong> and industrial<br />
dischargers in this watershed will be an integral part of the solution to meeting the<br />
water quality goals downstream.<br />
Missouri River<br />
<strong>Industrial</strong> <strong>Water</strong> <strong>Use</strong><br />
There are only two industries in the Missouri River with a permit to withdraw water.<br />
Both are sand and gravel washing operations that use surface water. In 2004 only one<br />
of these businesses withdrew water <strong>for</strong> an annual average of 0.06 mgd, as shown in<br />
Table 3.13a.<br />
Table 3.13a. <strong>Industrial</strong> <strong>Water</strong> <strong>Use</strong> in the Missouri River <strong>Water</strong>shed<br />
2004 <strong>Water</strong> <strong>Use</strong>, mgd<br />
Industry Category Ground <strong>Water</strong> Surface <strong>Water</strong> Total<br />
Sand and Gravel Washing 0.00 0.06 0.06<br />
Total 0.00 0.06 0.06<br />
Source: MDNR, 2004<br />
WWTPs<br />
The Luverne WWTP is the only facility with a capacity greater than 1 mgd and<br />
discharged nearly 0.9 mgd in 2005, as shown in Table 3.13b. The Luverne WWTP is<br />
operating at about 60% of its design capacity. The combined capacity of the smaller<br />
WWTPs in the watershed is 2.0 mgd.
Section 3<br />
Inventory of Major WWTPs and Potential <strong>Industrial</strong> Reuse Demands<br />
Table 3.13b. WWTPs in the Missouri River <strong>Water</strong>shed<br />
Design 2005 Ann Avg Flow as % of<br />
Facility Name Capacity, mgd Flow, mgd Design Capacity<br />
Luverne WWTP 1.500 0.865 57.7%<br />
Total<br />
Source: MPCA, 2005<br />
1.500 0.865 57.7%<br />
Industries and Proximity to WWTPs<br />
While both sand and gravel washing operations are within 5 miles of the Luverne<br />
WWTP, as shown on Figure 3.13b and in Table 3.13a, their limited water use and use<br />
of a surface water supply do not make them a good candidate <strong>for</strong> reclaimed water.<br />
Given this is a limited water supply area, Task 2 work may be directed at looking at<br />
the industries using a municipal water supply.<br />
Table 3.13c. Industries in the Missouri River <strong>Water</strong>shed<br />
Industry Name Source*<br />
2004 <strong>Water</strong><br />
<strong>Use</strong>, mgd<br />
Distance to<br />
WWTP, miles<br />
NORTHERN CON-<br />
AGG INC<br />
NORTHERN CON-<br />
S 0.000 5.0 Luverne<br />
AGG INC S 0.061 2.5 Luverne<br />
* G=Ground <strong>Water</strong>; S=Surface <strong>Water</strong><br />
Source: MDNR, 2004<br />
Closest<br />
WWTP Industry Category<br />
Sand and Gravel<br />
Washing<br />
Sand and Gravel<br />
Washing<br />
Factors Influencing Potential <strong>for</strong> <strong>Industrial</strong> Reuse<br />
Like the Des Moines River watershed, the water supply in the Missouri River<br />
watershed is lacking in quality and quantity. This part of the state is in Ground <strong>Water</strong><br />
Area 5 known <strong>for</strong> a limited supply in the bedrock and buried sand aquifers and only a<br />
moderate supply in the surficial aquifer. Some areas of this watershed are in Area 6<br />
which has limited supplies in all the aquifer levels. The surficial aquifers in this area<br />
have been classified as medium to high <strong>for</strong> susceptibility to contamination, with some<br />
pockets of less concern. Similar issues exist here as described <strong>for</strong> the Des Moines River<br />
watershed.<br />
Rainy River <strong>Water</strong>shed<br />
<strong>Industrial</strong> <strong>Water</strong> <strong>Use</strong><br />
The least populated watershed of the state, the Rainy River, has few industries with a<br />
water appropriations permit. As shown in Table 3.14a and Figure 3.14a, the pulp and<br />
paper industry is the largest water user, dominated by Boise White Paper near the<br />
NKASD plant. Of the 47 mgd used in 2004, less than 0.2 mgd was used <strong>for</strong> the other<br />
two types of industry, mine processing and sand and gravel washing. Boise White<br />
Paper uses only a surface water supply <strong>for</strong> its industrial uses. Potlach Corporation<br />
uses ground water supplies totaling less than 0.07 mgd.<br />
3-28 Craddock Consulting Engineers<br />
In Association with CDM & James Crook<br />
WWReuseTM1_Sec 3_final.doc
Figure 3.13b. Missouri River <strong>Water</strong>shed<br />
<strong>Industrial</strong> Reuse Customer Inventory<br />
") Sand and Gravel Washing<br />
")<br />
#*<br />
#*<br />
!(<br />
")<br />
")<br />
Rock<br />
Luverne<br />
"<br />
"<br />
#<br />
Major Lakes<br />
Major Rivers<br />
WWTP >= 5 mgd<br />
WWTP 1-5 mgd<br />
Ground <strong>Water</strong><br />
Surface <strong>Water</strong><br />
Cities/Townships<br />
!( 0.51 - 1.50 mgd<br />
!( 1.51 - 5.00 mgd<br />
!( 5.01 - 10.00 mgd<br />
0 30 60 Miles<br />
Source: Minnesota DNR <strong>Water</strong> Appropriations Permit Program, 2004 (Withdrawls greater than 1 mgy or 10,000 gpd)<br />
"<br />
"<br />
"<br />
"<br />
"<br />
"<br />
!( 0.00 - 0.50 mgd<br />
!(<br />
!(<br />
10.01 - 25.00 mgd<br />
¯<br />
25.01 - 505.00 mgd
Section 3<br />
Inventory of Major WWTPs and Potential <strong>Industrial</strong> Reuse Demands<br />
Craddock Consulting Engineers 3-29<br />
In Association with CDM & James Crook<br />
WWReuseTM1_Sec 3_final.doc<br />
Table 3.14a. <strong>Industrial</strong> <strong>Water</strong> <strong>Use</strong> in the Rainy River <strong>Water</strong>shed<br />
2004 <strong>Water</strong> <strong>Use</strong>, mgd<br />
Industry Category Ground <strong>Water</strong> Surface <strong>Water</strong> Total<br />
Mine Processing 0.00 0.01 0.01<br />
Pulp and Paper Processing 0.07 46.70 46.77<br />
Sand and Gravel Washing 0.00 0.14 0.14<br />
Total 0.07 46.85 46.92<br />
Source: MDNR, 2004<br />
WATER USE (MGD<br />
50<br />
45<br />
40<br />
35<br />
30<br />
25<br />
20<br />
15<br />
10<br />
5<br />
0<br />
242 243<br />
USE CODE<br />
244<br />
Ground <strong>Water</strong><br />
Surface <strong>Water</strong><br />
242 Pulp and Paper Processing<br />
243 Mine Processing<br />
244 Sand and Gravel Washing<br />
Figure 3.14a. <strong>Industrial</strong> Processing <strong>Water</strong> <strong>Use</strong> in the Rainy River <strong>Water</strong>shed, 2004<br />
Source: MDNR, 2004<br />
WWTPs<br />
There are two municipal WWTPs in this watershed with design capacities greater<br />
than 1 mgd: NKASD in International Falls and the Ely WWTP. Table 3.14b<br />
summarizes the design capacity and historic flows <strong>for</strong> the plants. These WWTPs<br />
discharged nearly 2 mgd in 2005. There are also several smaller WWTPs that<br />
discharge to surface waters with a combined design capacity of 3.3 mgd. This<br />
compares to a total WWTP capacity of 7.1 mgd <strong>for</strong> the watershed. Depending on the<br />
location of the industry it is possible that a smaller WWTP could provide an adequate<br />
reclaimed water supply.
Section 3<br />
Inventory of Major WWTPs and Potential <strong>Industrial</strong> Reuse Demands<br />
Table 3.14b. WWTPs in the Rainy River <strong>Water</strong>shed<br />
Design Capacity, 2005 Ann Avg Flow as % of<br />
Facility Name<br />
mgd<br />
Flow, mgd Design Capacity<br />
NKASD WWTP 2.3 1.264 55.0%<br />
Ely WWTP 1.5 0.688 45.9%<br />
Total 3.8 1.952 51.4%<br />
Source: MPCA, 2005<br />
Industries and Proximity to WWTPs<br />
The largest industry is located in International Falls and in close proximity (2.3 miles)<br />
to the WWTP, as shown on Figure 3.14c. There are no industries in Ely that have their<br />
own water permits.<br />
Table 3.14c. Industries in the Rainy River <strong>Water</strong>shed<br />
2004<br />
Distance<br />
to<br />
<strong>Water</strong> WWTP, Closest<br />
Industry Name Source* <strong>Use</strong>, mgd miles WWTP Industry Category<br />
UNITED STATES STEEL CORP S 0.010 >10 Ely Mine Processing<br />
S<br />
Pulp and Paper<br />
BOISE WHITE PAPER LLC<br />
46.684 2.3 NKASD Processing<br />
S<br />
Pulp and Paper<br />
KNAEBLE TIMBER INC<br />
0.018 >10 NKASD Processing<br />
Pulp and Paper<br />
POTLATCH CORPORATION G 0.067 >10 Ely Processing<br />
Sand and Gravel<br />
SEPPI BROS CONCRETE<br />
* G=Ground <strong>Water</strong>; S=Surface <strong>Water</strong><br />
Source: MDNR, 2004<br />
S 0.136 >10 Ely Washing<br />
Factors Influencing Potential <strong>for</strong> <strong>Industrial</strong> Reuse<br />
Ground water supplies are limited in the central and eastern portions of the Rainy<br />
River watershed. This area is Ground <strong>Water</strong> Area 3 and is dominated by glacial<br />
aquifers that are commonly thin and limited in their extent and yield. The bedrock<br />
aquifers also have limited yield; there are no large-scale regional aquifers. Ground<br />
water movement in much of the area is difficult to define because of the fractured<br />
nature of the bedrock. In the west (Area 4) and north (Area 5) portions of the<br />
watershed, the ground water supply in the surficial aquifers are less shallow and have<br />
moderate to good yields. This area can be dominated by connections to wetlands and<br />
contamination of surface aquifers has occurred. However, overall this watershed has<br />
a lowest to low susceptibility to contamination index, except along the southern<br />
border and interspersed areas in the watershed.<br />
3-30 Craddock Consulting Engineers<br />
In Association with CDM & James Crook<br />
WWReuseTM1_Sec 3_final.doc
Figure 3.14b. Rainy River <strong>Water</strong>shed<br />
<strong>Industrial</strong> Reuse Customer Inventory<br />
Rapid Little Fork<br />
") Mine Processing<br />
") Pulp and Paper Processing<br />
") Sand and Gravel Washing<br />
")<br />
Major Lakes<br />
"<br />
Big Fork<br />
" #<br />
#*<br />
#*<br />
!(<br />
")<br />
")<br />
NKASD<br />
Rainy<br />
Source: Minnesota DNR <strong>Water</strong> Appropriations Permit Program, 2004 (Withdrawls greater than 1 mgy or 10,000 gpd)<br />
!<br />
"<br />
"<br />
Vermilion<br />
Major Rivers<br />
WWTP >= 5 mgd<br />
WWTP 1-5 mgd<br />
Ground <strong>Water</strong><br />
Surface <strong>Water</strong><br />
Cities/Townships<br />
"<br />
"<br />
#<br />
"<br />
"<br />
"<br />
"<br />
Ely<br />
!( 0.00 - 0.50 mgd<br />
!( 0.51 - 1.50 mgd<br />
!( 1.51 - 5.00 mgd<br />
!( 5.01 - 10.00 mgd<br />
!(<br />
!(<br />
10.01 - 25.00 mgd<br />
25.01 - 505.00 mgd<br />
0 40 80 Miles<br />
¯
Section 3<br />
Inventory of Major WWTPs and Potential <strong>Industrial</strong> Reuse Demands<br />
Craddock Consulting Engineers 3-31<br />
In Association with CDM & James Crook<br />
WWReuseTM1_Sec 3_final.doc<br />
The Rainy River watershed is a heavily <strong>for</strong>ested area, which like much of Minnesota,<br />
values its water resources <strong>for</strong> recreational purposes. Voyageurs National Park and the<br />
Boundary <strong>Water</strong>s Canoe Area are located here, as are several of the states most<br />
famous walleye fisheries and prized trout streams. Basin planning has been ongoing<br />
in this watershed to maintain protection of Minnesota’s water resources and<br />
coordinate planning with Canada, into which the waterways flow, with nearly 60% of<br />
the watershed in Canada’s borders. The Rainy River Basin Plan, (MPCA, 2004)<br />
outlines various goals and activities to monitor, evaluate and implement projects<br />
where improvements are needed. No specific watershed initiatives were noted that<br />
would influence the use of reclaimed water in this area <strong>for</strong> industry. The driver will<br />
most likely be insufficient ground water supplies, in areas lacking a higher quality<br />
surface water supply. It is anticipated that surface water supplies could be of higher<br />
quality than reclaimed water, but will be location and industry specific.<br />
Red River of the North<br />
<strong>Industrial</strong> <strong>Water</strong> <strong>Use</strong><br />
Major industries in the Red River of the North watershed are limited to three industry<br />
types, as depicted in Figures 3.15a and 3.15b. As detailed in Table 3.15a, less than 2.2<br />
mgd of ground water supplies were withdrawn <strong>for</strong> use by agricultural processing<br />
facilities and sand and gravel washing businesses in 2004. The Otter Tail Power<br />
Company in Thief River Falls has the largest industrial water demand, using over 50<br />
mgd of surface water.<br />
Table 3.15a. <strong>Industrial</strong> <strong>Water</strong> <strong>Use</strong> in the Red River of the North <strong>Water</strong>shed<br />
2004 <strong>Water</strong> <strong>Use</strong>, mgd<br />
Industry Category Ground <strong>Water</strong> Surface <strong>Water</strong> Total<br />
Agricultural Processing 0.91 0.09 1.00<br />
Power Generation 0.00 54.43 54.43<br />
Sand & Gravel Washing 1.26 0.69 1.95<br />
Total<br />
Source: MDNR, 2004<br />
2.17 55.21 57.38<br />
WWTPs<br />
The six WWTPs in the area (with a capacity greater than 1 mgd) have a combined<br />
treatment capacity of nearly 20 mgd (Table 3.15b). In 2005, the combined discharge of<br />
the plants was 12 mgd. Four of these plants are nearing capacity: Crookston, East<br />
Grand Forks, Fergus Falls and Thief River Falls.
Section 3<br />
Inventory of Major WWTPs and Potential <strong>Industrial</strong> Reuse Demands<br />
WATER USE (MGD<br />
2.5<br />
2<br />
1.5<br />
1<br />
0.5<br />
0<br />
241 244<br />
<strong>Use</strong> Code<br />
Ground <strong>Water</strong><br />
Surface <strong>Water</strong><br />
241 Agricultural Processing<br />
244 Sand and Gravel<br />
Washing<br />
Figure 3.15a. <strong>Industrial</strong> Processing <strong>Water</strong> <strong>Use</strong> in the Red River of the North <strong>Water</strong>shed, 2004<br />
WATER USE (MGD)<br />
60<br />
50<br />
40<br />
30<br />
20<br />
10<br />
0<br />
222<br />
USE CODE<br />
Ground <strong>Water</strong><br />
Surface <strong>Water</strong><br />
Source: MDNR, 2004<br />
222 Steam Power Cooling - Once<br />
Through<br />
Figure 3.15b. Power Generation <strong>Water</strong> <strong>Use</strong> in the Red River of the North <strong>Water</strong>shed, 2004<br />
Source: MDNR, 2004<br />
3-32 Craddock Consulting Engineers<br />
In Association with CDM & James Crook<br />
WWReuseTM1_Sec 3_final.doc
Section 3<br />
Inventory of Major WWTPs and Potential <strong>Industrial</strong> Reuse Demands<br />
Craddock Consulting Engineers 3-33<br />
In Association with CDM & James Crook<br />
WWReuseTM1_Sec 3_final.doc<br />
Table 3.15b. WWTPs in the Red River of the North <strong>Water</strong>shed<br />
Facility Name<br />
Design<br />
Capacity,<br />
mgd<br />
2005 Ann Avg<br />
Flow, mgd<br />
Flow as % of<br />
Design Capacity<br />
Crookston WWTP 1.400 1.117 79.8%<br />
Detroit Lakes WWTP 3.000 1.256 41.9%<br />
East Grand Forks<br />
WWTP 1.400 1.193 85.2%<br />
Fergus Falls WWTP 2.810 1.909 67.9%<br />
Moorhead WWTP 9.000 4.753 52.8%<br />
Thief River Falls<br />
WWTP 2.140 1.447 67.6%<br />
Total 19.750 11.675 59.1%<br />
Source: MPCA, 2005<br />
Industries and Proximity to WWTPs<br />
Of the four municipal WWTPs approaching design capacity, Crookston has the<br />
closest potential industrial reuse customer (Figure 3.15c and Table 3.15c). The<br />
American Crystal Sugar facility is approximately 1 mile from the WWTP. There is also<br />
an American Crystal Sugar facility adjacent to the Moorhead WWTP.<br />
Factors Influencing Potential <strong>for</strong> <strong>Industrial</strong> Reuse<br />
Limited ground water supplies occur through much of the Red River Valley. The<br />
majority of this watershed is in Ground <strong>Water</strong> Area 5, noted <strong>for</strong> low yielding bed and<br />
buried sand aquifers. The surficial sand aquifers provide the best yields and quality.<br />
However, overpumping of these aquifers can cause the upward flow of poorer quality<br />
ground water from the lower aquifers, known <strong>for</strong> high total dissolved solids. In<br />
addition, the surficial aquifers have recharge zones that are susceptible to<br />
contamination. The larger communities in the area, such as Moorhead, use both<br />
ground and surface water supplies <strong>for</strong> their potable water supply. The Buffalo aquifer<br />
water levels were gradually declining until water treatment operations went online to<br />
treat more Red River water. This dual supply approach has been necessary to sustain<br />
the water supply aquifers of this part of the Red River watershed.<br />
Basin planning ef<strong>for</strong>ts initiated in the mid-1990s continue to guide the watershed<br />
protection initiatives <strong>for</strong> the Red River of the North watershed communities.<br />
Ammonia limits imposed in late 1990s led to improvements in the treatment<br />
processes <strong>for</strong> WWTPs in the watershed. The initiatives of neighboring states and<br />
Canada, which is downstream, will also affect the discharge requirements placed on<br />
WWTPs in this Minnesota watershed.
Section 3<br />
Inventory of Major WWTPs and Potential <strong>Industrial</strong> Reuse Demands<br />
Table 3.15c. Industries in the Red River of the North <strong>Water</strong>shed within 10 Miles of a<br />
WWTP<br />
2004 Distance to<br />
<strong>Water</strong> WWTP,<br />
Industry Name<br />
AMERICAN CRYSTAL<br />
Source* <strong>Use</strong>, mgd miles Closest WWTP Industry Category<br />
SUGAR CO<br />
AMERICAN CRYSTAL<br />
S 0.000 1 Moorhead Agricultural Processing<br />
SUGAR CO S 0.010 1.2 Crookston Agricultural Processing<br />
STEAM POWER<br />
MOORHEAD PUBLIC<br />
COOLING - ONCE<br />
SERVICE<br />
AMERICAN CRYSTAL<br />
S 0.000 1.5 Moorhead THROUGH<br />
SUGAR CO S 0.000 2 East Grand Forks Agricultural Processing<br />
NORTHERN PRIDE INC<br />
ROCK RIDGE<br />
G 0.000 2.6 Thief River Falls Agricultural Processing<br />
RESOURCES<br />
ROCK RIDGE<br />
S 0.000 3 Detroit Lakes Sand and Gravel Washing<br />
RESOURCES G 0.666 3 Detroit Lakes Sand and Gravel Washing<br />
STEAM POWER<br />
COOLING - ONCE<br />
OTTER TAIL POWER CO S 54.428 3.5 Fergus Falls THROUGH<br />
STEAM POWER<br />
COOLING - WET<br />
OTTER TAIL POWER CO G 0.000 3.5 Fergus Falls TOWER<br />
MNDAK CONCRETE INC S 0.034 7.5 Thief River Falls Sand and Gravel Washing<br />
MNDAK CONCRETE INC G 0.025 7.5 Thief River Falls Sand and Gravel Washing<br />
* G=Ground <strong>Water</strong>; S=Surface <strong>Water</strong><br />
Source: MDNR, 2004<br />
St. Croix River<br />
<strong>Industrial</strong> <strong>Water</strong> <strong>Use</strong><br />
The largest industrial water user in the St. Croix River watershed is Xcel Energy,<br />
which used 325 mgd of water from the St. Croix River in 2004. The other permitted<br />
industrial water users include several sand and gravel companies and Andersen<br />
Corporation <strong>for</strong> window production. Nearly 1 mgd of ground water was used by<br />
these industries in 2004. Figures 3.16a and 3.16b and Table 3.16a summarize the<br />
industrial water use <strong>for</strong> the St. Croix watershed.<br />
Table 3.16a. <strong>Industrial</strong> <strong>Water</strong> <strong>Use</strong> in the St. Croix River <strong>Water</strong>shed<br />
2004 <strong>Water</strong> <strong>Use</strong>, mgd<br />
Ground<br />
Industry Category<br />
<strong>Water</strong> Surface <strong>Water</strong> Total<br />
Non-Metallic Processing 0.59 0.00 0.59<br />
Sand & Gravel Washing 0.33 0.35 0.68<br />
Steam Power Other than Cooling 0.00 325.35 325.35<br />
Total 0.92 325.70 326.62<br />
Source: MDNR, 2004<br />
3-34 Craddock Consulting Engineers<br />
In Association with CDM & James Crook<br />
WWReuseTM1_Sec 3_final.doc
")<br />
Figure 3.15c. Red River of the North <strong>Water</strong>shed<br />
<strong>Industrial</strong> Reuse Customer Inventory<br />
"<br />
Tamarac<br />
East Grand Forks<br />
"<br />
#<br />
Snake<br />
Marsh<br />
Crookston<br />
"<br />
"<br />
#<br />
"<br />
"<br />
Moorhead<br />
" # "" "<br />
Agricultural Processing<br />
Red<br />
Sand Hill<br />
Wild Rice<br />
Buffalo<br />
") Sand and Gravel Washing<br />
") Power Generation<br />
"<br />
Mustinka<br />
Two River<br />
"!<br />
!<br />
")<br />
#*<br />
#*<br />
Roseau<br />
"<br />
!"<br />
!(<br />
")<br />
")<br />
Thief River Falls<br />
!<br />
#<br />
! "<br />
#<br />
Thief<br />
"!<br />
#<br />
Fergus Falls<br />
!<br />
Clearwater<br />
!<br />
Detroit Lakes<br />
Ottertail<br />
!<br />
Major Lakes<br />
Major Rivers<br />
Red Lake<br />
Source: Minnesota DNR <strong>Water</strong> Appropriations Permit Program, 2004 (Withdrawls greater than 1 mgy or 10,000 gpd)<br />
!<br />
WWTP >= 5 mgd<br />
WWTP 1-5 mgd<br />
Ground <strong>Water</strong><br />
Surface <strong>Water</strong><br />
Cities/Townships<br />
"<br />
"<br />
"<br />
"<br />
"<br />
"<br />
!( 0.00 - 0.50 mgd<br />
!( 0.51 - 1.50 mgd<br />
!( 1.51 - 5.00 mgd<br />
!( 5.01 - 10.00 mgd<br />
!(<br />
!(<br />
10.01 - 25.00 mgd<br />
25.01 - 505.00 mgd<br />
¯<br />
0 30 60 Miles
Section 3<br />
Inventory of Major WWTPs and Potential <strong>Industrial</strong> Reuse Demands<br />
Craddock Consulting Engineers 3-35<br />
In Association with CDM & James Crook<br />
WWReuseTM1_Sec 3_final.doc<br />
WATER USE (MGD)<br />
0.8<br />
0.7<br />
0.6<br />
0.5<br />
0.4<br />
0.3<br />
0.2<br />
0.1<br />
0<br />
244 248<br />
USE CODE<br />
Ground <strong>Water</strong><br />
Surface <strong>Water</strong><br />
244 Sand and Gravel Washing<br />
248 Non-Metallic Processing<br />
Figure 3.16a. <strong>Industrial</strong> Processing <strong>Water</strong> <strong>Use</strong> in the St. Croix <strong>Water</strong>shed, 2004<br />
WATER USE (MGD<br />
350<br />
300<br />
250<br />
200<br />
150<br />
100<br />
50<br />
0<br />
225<br />
USE CODE<br />
Source: MDNR, 2004<br />
Surface <strong>Water</strong><br />
225 Steam Power Other than<br />
Cooling<br />
Figure 3.16b. Power Generation <strong>Water</strong> <strong>Use</strong> in the St. Croix <strong>Water</strong>shed, 2004<br />
Source: MDNR, 2004
Section 3<br />
Inventory of Major WWTPs and Potential <strong>Industrial</strong> Reuse Demands<br />
WWTPs<br />
There are two municipal WWTPs in this watershed with design capacities greater<br />
than 1 mgd: Chisago Lakes Joint STC and Metro Council’s St. Croix Valley WWTP.<br />
Table 3.16b summarizes the design capacity and historic flows <strong>for</strong> the plant. These<br />
WWTPs discharged 3.9 mgd in 2005. There are also smaller WWTPs that discharge to<br />
surface waters with a combined design capacity of 5.2 mgd.<br />
Table 3.16b. WWTPs in the St. Croix River <strong>Water</strong>shed<br />
Facility Name<br />
Design<br />
Capacity,<br />
mgd<br />
2005 Ann<br />
Avg Flow,<br />
mgd<br />
Flow as % of<br />
Design<br />
Capacity<br />
Chisago Lakes Joint STC<br />
Met Council - St Croix Valley<br />
1.26 0.756 60.0%<br />
WWTP 4.5 3.126 69.5%<br />
Total<br />
Source: MPCA, 2005<br />
5.76 3.882 67.4%<br />
Industries and Proximity to WWTPs<br />
Figure 3.16c presents the location of the industries and WWTPs in the St. Croix River<br />
watershed. Table 3.16c lists the various industries and their distance from the closer of<br />
the two WWTPs. The sand and gravel companies are all located a considerable<br />
distance from a WWTP, the closest is 5 miles away. Andersen Corporation, which<br />
used approximately 0.6 mgd of ground water in 2004, is within 1 mile of the Met<br />
Council St. Croix Valley WWTP. The Xcel Energy facility is also within 1 mile of this<br />
WWTP.<br />
Factors Influencing Potential <strong>for</strong> <strong>Industrial</strong> Reuse<br />
This watershed resides in Ground <strong>Water</strong> Area 1 of the state, which has a good<br />
bedrock aquifer supply and moderate bearing surficial sand and buried sand aquifers.<br />
As development continues around the metro area, supply pressures will be placed on<br />
ground water resources in the metro area and fringe areas to the north. <strong>Water</strong> quality<br />
has not been an issue, in general, <strong>for</strong> this area. The St. Croix supply as a surface water<br />
is superior to other major waterways of the area. Low-level contamination of upper<br />
aquifers has occurred from spills and general effects of urbanization. Areas<br />
developing with private individual sewage treatment systems (ISTSs) or clustered<br />
systems have the increased risk of nitrate and pathogen contamination.<br />
Rapid population growth and accompanying land-use changes have affected the<br />
water resources of the St. Croix River Basin. The St. Croix Basin <strong>Water</strong> Resources<br />
Planning Team (St. Croix Basin Team), working with recently completed nutrient and<br />
sediment research, has recommended a 20-percent reduction in total phosphorus<br />
loading within the St. Croix Basin. This is based on a 39-percent projected population<br />
growth in the St. Croix Basin by the year 2020. The St. Croix basin will also be part of<br />
the Lake Pepin TMDL which is projected to require a 50% reduction in solids and<br />
phosphorus loads from upstream sources.<br />
3-36 Craddock Consulting Engineers<br />
In Association with CDM & James Crook<br />
WWReuseTM1_Sec 3_final.doc
")<br />
Figure 3.16c. St. Croix River <strong>Water</strong>shed<br />
<strong>Industrial</strong> Reuse Customer Inventory<br />
Non-Metallic Processing<br />
") Sand and Gravel Washing<br />
") Power Generation<br />
") Major Lakes<br />
!<br />
"<br />
Kettle<br />
Snake<br />
St. Croix<br />
"<br />
#<br />
" !<br />
!<br />
!<br />
# ! "<br />
! !!<br />
!<br />
Chisago Lakes Joint STC<br />
Met Council - St Croix Valley<br />
Major Rivers<br />
" !( 0.00 - 0.50 mgd<br />
#*<br />
#*<br />
WWTP >= 5 mgd<br />
WWTP 1-5 mgd<br />
"<br />
"<br />
!(<br />
!(<br />
0.51 - 1.50 mgd<br />
1.51 - 5.00 mgd<br />
!( Ground <strong>Water</strong> " !( 5.01 - 10.00 mgd<br />
") Surface <strong>Water</strong> !( 10.01 - 25.00 mgd<br />
") Cities/Townships<br />
25.01 - 505.00 mgd<br />
Source: Minnesota DNR <strong>Water</strong> Appropriations Permit Program, 2004 (Withdrawls greater than 1 mgy or 10,000 gpd)<br />
" "<br />
!(<br />
¯<br />
0 30 60 Miles
Section 3<br />
Inventory of Major WWTPs and Potential <strong>Industrial</strong> Reuse Demands<br />
Table 3.16c. Industries in the St. Croix River <strong>Water</strong>shed<br />
Distance<br />
2004 to<br />
<strong>Water</strong> WWTP,<br />
Industry Name Source* <strong>Use</strong>, mgd miles Closest WWTP Industry Category<br />
ANDERSEN<br />
NON-METALLIC<br />
CORPORATION G 0.591 4 METC St. Croix Valley PROCESSING<br />
AGGREGATE<br />
SAND & GRAVEL<br />
INDUSTRIES-NCR INC G 0.135 5 METC St. Croix Valley WASHING<br />
AGGREGATE<br />
SAND & GRAVEL<br />
INDUSTRIES-NCR INC S 0.315 9 Chisago Lakes Joint STC WASHING<br />
AGGREGATE<br />
SAND & GRAVEL<br />
INDUSTRIES-NCR INC G 0.092 9 Chisago Lakes Joint STC WASHING<br />
BARTON SAND &<br />
SAND & GRAVEL<br />
GRAVEL G 0.004 8 Chisago Lakes Joint STC WASHING<br />
BARTON SAND &<br />
SAND & GRAVEL<br />
GRAVEL G 0.004 7 METC St. Croix Valley WASHING<br />
SAND & GRAVEL<br />
BAUERLY BROTHERS INC S 0.000 >10 Chisago Lakes Joint STC WASHING<br />
SAND & GRAVEL<br />
BAUERLY BROTHERS INC G 0.005 >10 Chisago Lakes Joint STC WASHING<br />
SAND & GRAVEL<br />
BLACK DIAMOND INC G 0.079 8 METC St. Croix Valley WASHING<br />
SAND & GRAVEL<br />
BRACHT BROS INC G 0.001 >10 METC St. Croix Valley WASHING<br />
HOPKINS SAND &<br />
SAND & GRAVEL<br />
GRAVEL G 0.013 >10 Chisago Lakes Joint STC WASHING<br />
HOPKINS SAND &<br />
SAND & GRAVEL<br />
GRAVEL G 0.007 >10 Chisago Lakes Joint STC WASHING<br />
HOPKINS SAND &<br />
SAND & GRAVEL<br />
GRAVEL G 0.002 >10 Chisago Lakes Joint STC WASHING<br />
STAFNE AND AND<br />
SAND & GRAVEL<br />
GRAVEL LLC S 0.037 >10 Chisago Lakes Joint STC WASHING<br />
STEAM POWER -<br />
NSP CO DBA XCEL<br />
OTHER THAN<br />
ENERGY S 325.347 5 METC St. Croix Valley COOLING<br />
* G=Ground <strong>Water</strong>; S=Surface <strong>Water</strong><br />
Source: MDNR, 2004<br />
Craddock Consulting Engineers 3-37<br />
In Association with CDM & James Crook<br />
WWReuseTM1_Sec 3_final.doc<br />
Western Lake Superior <strong>Water</strong>shed<br />
<strong>Industrial</strong> <strong>Water</strong> <strong>Use</strong><br />
Industries in the Western Lake Superior watershed rely on the high quality surface<br />
water of Lake Superior and other surface sources <strong>for</strong> most of their needs. Only 0.15<br />
mgd of ground water was withdrawn from this watershed by industries, as indicated<br />
in Table 3.17a. The heavy water demands of the mining industry dwarf the other uses<br />
except <strong>for</strong> cooling water <strong>for</strong> steam power facilities, as shown in Figure 3.17a. Nearly<br />
300 mgd water was used by mining facilities in 2004 (Note: water used by the power<br />
industry specifically <strong>for</strong> mining activities is noted as a mining water use). As indicated in<br />
Figure 3.17b, 180 mgd of surface water was used <strong>for</strong> once through cooling water<br />
systems <strong>for</strong> steam power facilities. Pulp and paper processing, chemical processing,<br />
sand and gravel washing, and a concrete products industry were the other industry<br />
types residing in the Western Lake Superior watershed.
Section 3<br />
Inventory of Major WWTPs and Potential <strong>Industrial</strong> Reuse Demands<br />
Table 3.17a. <strong>Industrial</strong> <strong>Water</strong> <strong>Use</strong> in the Western Lake Superior <strong>Water</strong>shed<br />
2004 <strong>Water</strong> <strong>Use</strong>, mgd<br />
Ground<br />
Industry Category<br />
<strong>Water</strong> Surface <strong>Water</strong> Total<br />
Mine Processing 0.01 296.51 296.52<br />
Non-metallic Processing 0.01 0.00 0.01<br />
Petroleum - Chemical Processing, ethanol 0.00 0.43 0.43<br />
Pulp and Paper Processing 0.00 6.78 6.78<br />
Sand and Gravel Washing 0.01 0.30 0.31<br />
Steam Power Cooling - Once through 0.00 182.35 182.35<br />
Steam Power Cooling - Wet Tower 0.12 0.00 0.12<br />
Total<br />
Source: MDNR, 2004<br />
0.15 486.37 486.52<br />
WWTPs<br />
The six major WWTPs in the Western Lake Superior watershed discharged 45 mgd of<br />
treated wastewater in 2005, as summarized in Table 3.17b. Approximately 85% of this<br />
wastewater was processed at the Western Lake Superior Sanitary District (WLSSD)<br />
near downtown Duluth. The other WWTPs have capacities between 1 and 5 mgd. It is<br />
estimated that the capacity <strong>for</strong> the smaller wastewater treatment systems, less than 1<br />
mgd, is about 7 mgd.<br />
Table 3.17b. WWTPs in the Western Lake Superior <strong>Water</strong>shed<br />
2005 Ann Avg<br />
Flow, mgd<br />
Flow as % of<br />
Design<br />
Capacity<br />
Facility Name<br />
Design<br />
Capacity, mgd<br />
Eveleth WWTP<br />
Hibbing WWTP North<br />
1.000 0.645 64.5%<br />
Plant<br />
Hibbing WWTP South<br />
3.200 0.000 0.0%<br />
Plant 2.000 2.573 128.7%<br />
Two Harbors WWTP 1.600 0.701 43.8%<br />
Virginia WWTP 4.300 2.182 50.7%<br />
WLSSD WWTP 48.800 38.797 79.5%<br />
Total<br />
Source: MPCA, 2005<br />
60.900 44.898 73.7%<br />
Industries and Proximity to WWTPs<br />
The WWTP and industry combinations in this watershed have some favorable reuse<br />
options. Communities on the iron range are within 10 miles of several industries as<br />
listed in Table 3.17c. The Western Lake Superior Sanitary District (WLSSD) also has<br />
several industries within 10 miles including mine processing, sand and gravel<br />
3-38 Craddock Consulting Engineers<br />
In Association with CDM & James Crook<br />
WWReuseTM1_Sec 3_final.doc
Section 3<br />
Inventory of Major WWTPs and Potential <strong>Industrial</strong> Reuse Demands<br />
Craddock Consulting Engineers 3-39<br />
In Association with CDM & James Crook<br />
WWReuseTM1_Sec 3_final.doc<br />
washing, and it is expected that there are industries in the industrial area adjacent to<br />
the WWTP that use a potable supply.<br />
WATER USE (MGD<br />
350<br />
300<br />
250<br />
200<br />
150<br />
100<br />
50<br />
0<br />
242 243 244<br />
USE CODE<br />
246 248<br />
Ground <strong>Water</strong><br />
Surface <strong>Water</strong><br />
242 Pulp and Paper Processing<br />
243 Mine Processing<br />
244 Sand and Gravel Washing<br />
246 Petroleum-chemical<br />
processing, ethanol<br />
248 Non-Metallic Processing<br />
Figure 3.17a. <strong>Industrial</strong> Processing <strong>Water</strong> <strong>Use</strong> in the Western Lake Superior <strong>Water</strong>shed, 2004<br />
WATER USE (MGD<br />
200<br />
180<br />
160<br />
140<br />
120<br />
100<br />
80<br />
60<br />
40<br />
20<br />
0<br />
222 223<br />
USE CODE<br />
Ground <strong>Water</strong><br />
Surface <strong>Water</strong><br />
Source: MDNR, 2004<br />
222 Steam Power Cooling - Once<br />
Through<br />
223 Steam Power Cooling - Wet Tower<br />
Figure 3.17b. Power Generation <strong>Water</strong> <strong>Use</strong> in the Western Lake Superior <strong>Water</strong>shed, 2004<br />
Source: MDNR, 2004
Section 3<br />
Inventory of Major WWTPs and Potential <strong>Industrial</strong> Reuse Demands<br />
Table 3.17c. Industries in the Western Lake Superior <strong>Water</strong>shed Within 10 Miles of a WWTP<br />
2004 Distance<br />
<strong>Water</strong> to<br />
<strong>Use</strong>, WWTP, Closest<br />
Industry Name Source* mgd miles WWTP Industry Category<br />
UNITED TACONITE LLC G 0.000 1.2 Eveleth Mine Processing<br />
UNITED TACONITE LLC S 6.575 6.3 Eveleth<br />
Hibbing North<br />
Mine Processing<br />
SEPPI BROS CONCRETE S 0.115 2.5 Plant Sand and Gravel Washing<br />
TWO HARBORS, CITY<br />
STEAM POWER COOLING<br />
OF S 0.002 1.0 Two harbors - ONCE THROUGH<br />
UNITED TACONITE LLC G 0.000 1.5 Virginia Mine Processing<br />
VIRGINIA PUBLIC<br />
STEAM POWER COOLING<br />
UTILITIES S 7.915 2.5 Virginia - ONCE THROUGH<br />
VIRGINIA PUBLIC<br />
STEAM POWER COOLING<br />
UTILITIES S 2.038 2.5 Virginia - ONCE THROUGH<br />
VIRGINIA PUBLIC<br />
STEAM POWER COOLING<br />
UTILITIES S 0.276 2.5 Virginia - ONCE THROUGH<br />
ISPAT INLAND MINING<br />
UNITED STATES STEEL<br />
S 0.000 3.5 Virginia Mine Processing<br />
CORP<br />
UNITED STATES STEEL<br />
S 0.000 4.0 Virginia Mine Processing<br />
CORP<br />
UNITED STATES STEEL<br />
S 0.000 6.0 Virginia Mine Processing<br />
CORP<br />
ELK RIVER CONCRETE<br />
S 0.010 7.5 Virginia Mine Processing<br />
PRODUCTS<br />
DULUTH, MISSABE &<br />
G 0.001 9.0 Virginia Non-Metallic Processing<br />
IRON RANGE RAIL S 0.002 1.5 WLSSD Mine Processing<br />
GEORGIA PACIFIC CORP S 1.228 1.6 WLSSD Pulp and Paper Processing<br />
STEAM POWER COOLING<br />
MINNESOTA POWER S 43.716 2.6 WLSSD - ONCE THROUGH<br />
STEAM POWER COOLING<br />
MINNESOTA POWER S 0.537 2.6 WLSSD - ONCE THROUGH<br />
STEAM POWER COOLING<br />
MINNESOTA POWER S 0.013 2.6 WLSSD - ONCE THROUGH<br />
STEAM POWER COOLING<br />
MINNESOTA POWER G 0.102 3.5 WLSSD - WET TOWER<br />
TATE & LYLE CITRIC<br />
Petroleum - Chemical<br />
ACID INC S 0.429 5.0 WLSSD Processing<br />
UNITED TACONITE LLC G 0.000 7.0 WLSSD Mine Processing<br />
UNITED TACONITE LLC G 0.009 7.0 WLSSD Mine Processing<br />
STEAM POWER COOLING<br />
MINNESOTA POWER G 0.000 9.0 WLSSD - WET TOWER<br />
STEAM POWER COOLING<br />
MINNESOTA POWER G 0.001 9.0 WLSSD - WET TOWER<br />
STEAM POWER COOLING<br />
MINNESOTA POWER<br />
ARROWHEAD<br />
G 0.014 9.0 WLSSD - WET TOWER<br />
CONCRETE WORKS G 0.005 9.9 WLSSD Non-Metallic Processing<br />
* G=Ground <strong>Water</strong>; S=Surface <strong>Water</strong><br />
Source: MDNR, 2004<br />
3-40 Craddock Consulting Engineers<br />
In Association with CDM & James Crook<br />
WWReuseTM1_Sec 3_final.doc
Figure 3.17c. Western Lake Superior <strong>Water</strong>shed<br />
<strong>Industrial</strong> Reuse Customer Inventory<br />
"<br />
" " Virginia<br />
" "<br />
!<br />
#<br />
"<br />
Hibbing North Plant " # Eveleth<br />
!<br />
" #<br />
" !<br />
Hibbing South Plant<br />
#<br />
"<br />
St. Louis<br />
!<br />
" !" "<br />
!<br />
"<br />
" !<br />
WLSSD<br />
#<br />
"<br />
Nemadji<br />
") Mine Processing<br />
") Non-Metallic Processing<br />
") Petroleum_Chemical Processing<br />
") Pulp and Paper Processing<br />
") Sand and Gravel Processing<br />
") Power Generation<br />
")<br />
#*<br />
#*<br />
!(<br />
")<br />
")<br />
"<br />
"<br />
Two Harbors<br />
"<br />
#<br />
Cloquet<br />
Major Lakes<br />
Major Rivers<br />
WWTP >= 5 mgd<br />
WWTP 1-5 mgd<br />
Ground <strong>Water</strong><br />
Surface <strong>Water</strong><br />
Cities/Townships<br />
!( 0.00 - 0.50 mgd<br />
!( 0.51 - 1.50 mgd<br />
!( 1.51 - 5.00 mgd<br />
!( 5.01 - 10.00 mgd<br />
0 30 60 Miles<br />
Source: Minnesota DNR <strong>Water</strong> Appropriations Permit Program, 2004 (Withdrawls greater than 1 mgy or 10,000 gpd)<br />
"<br />
"<br />
"<br />
"<br />
"<br />
"<br />
!(<br />
!(<br />
10.01 - 25.00 mgd<br />
¯<br />
25.01 - 505.00 mgd
Section 3<br />
Inventory of Major WWTPs and Potential <strong>Industrial</strong> Reuse Demands<br />
Craddock Consulting Engineers 3-41<br />
In Association with CDM & James Crook<br />
WWReuseTM1_Sec 3_final.doc<br />
Factors Influencing Potential <strong>for</strong> <strong>Industrial</strong> Reuse<br />
The Western Lake Superior watershed has similar water availability indices as<br />
described <strong>for</strong> the Rainy River watershed. The northern half is in Area 6 and the south<br />
half is in Area 4. Both of these areas have limited bedrock aquifers. The north half has<br />
limited water supplies in all three aquifer zones, while the south half has productive<br />
surifical aquifers and less productive buried sand aquifers. The north half of the<br />
watershed is the least prone to ground water contamination, while the south half has<br />
some pockets of medium to highest susceptibility of contamination.<br />
Limitations on pollutant discharges will continue to be a focus <strong>for</strong> this watershed.<br />
This region of Minnesota is a treasured recreation area and also provides resources <strong>for</strong><br />
the state’s mining and <strong>for</strong>est industries. The Lake Superior Basin Plan, completed in<br />
2004, provides recommendations <strong>for</strong> policy and initiatives to enhance and protect this<br />
watershed and the industries that contribute to the economic vitality of the area. The<br />
partnerships and mandates associated with the Great Lakes <strong>Water</strong> Quality Agreement<br />
and related programs are expected to continue to influence the management of the<br />
watershed in response to the region’s growth. One example is the Zero Discharge<br />
Demonstration Program, which is devoted to the goal of zero discharge of nine<br />
persistent bioaccumulative toxic substances.<br />
3.3 Metro Area Inventory<br />
The range of industries in the Minneapolis/St. Paul metro area provides a perspective<br />
on the full range of industries that can be present in a community. Unlike the analysis<br />
of industrial demands outside the metro area, the inventory <strong>for</strong> the metro area<br />
includes industries that use a municipal potable supply and/or withdraw from<br />
ground or surface waters at lower thresholds than required <strong>for</strong> an appropriations<br />
permit (1 mgy or 100,000 gpd). The Met Council monitors all industries that discharge<br />
to the metro area regional sewer system. The database <strong>for</strong> the industrial users<br />
permitted by the Met Council was used to identify the industry, the type of industry,<br />
the facility location, and the amount of water that enters the facility. Some industrial<br />
users may consume most of this supply and others may discharge all of it to the sewer<br />
system. The water use data evaluated <strong>for</strong> this project is the industrial water demand –<br />
what comes into a facility.<br />
Metro Area Overview<br />
The industrial customer inventory <strong>for</strong> the metro area is represented by a diversity of<br />
industries and a prevalence of potential industrial reuse customers along the river<br />
corridors. Figure 3.18 presents the industries with water permits (MDNR<br />
appropriation permits) and Figure 3.19a locates the larger set of industries in the<br />
metro area, represented by the Met Council’s <strong>Industrial</strong> <strong>Use</strong>r permit program.
Section 3<br />
Inventory of Major WWTPs and Potential <strong>Industrial</strong> Reuse Demands<br />
The Met Council database provides <strong>for</strong> a more detailed categorization of the<br />
industries, as shown in the legend <strong>for</strong> the Figure 3.19a. These industry categories are<br />
documented with subcategories in Appendix E. Figure 3.19a also identifies if the<br />
industry obtains its water from a municipal (potable) source or another source, which<br />
typically would be through a DNR appropriations permit. The other source could be<br />
ground water (well), surface water or a combination of both. The municipal<br />
designation was rolled up to include any industry that uses a municipal supply. An<br />
industry could also have another supply through a DNR appropriations permit.<br />
The Met Council database includes any discharger to the sewer system and the term<br />
‘industrial discharger’ covers a wide designation of industries. Some dischargers use<br />
little water, such as landfill leachate systems, and mainly collect and treat water <strong>for</strong><br />
discharge. The inventory assembled <strong>for</strong> this project includes only those industry<br />
categories that have a water demand. The Met Council <strong>Industrial</strong> Dischargers Permit<br />
database does not include all industries in the area, because some have their own<br />
treatment systems and discharge permits.<br />
The industries in the metro area discharging to the sewer system, as shown in Figure<br />
3.19b, had a combined water demand of 65 mgd in 2005. The largest water users were<br />
food industries, at 15 mgd, followed by the metal products industries at 10 mgd.<br />
<strong>Water</strong> used in the electronic products and paper/packaging industries and <strong>for</strong><br />
power/steam/air conditioning and health care facilities, all had category totals over 5<br />
mgd.<br />
Building Materials<br />
Chemical Products<br />
Electronic Products<br />
Food Products<br />
Health Care<br />
Laundry<br />
Medical Products<br />
Metal Products<br />
Other<br />
Paper/Packaging<br />
Photo/Printed Products<br />
Power/Steam/AC<br />
Public Facilities<br />
Transportation<br />
1.0<br />
1.2<br />
1.7<br />
1.6<br />
1.4<br />
2.6<br />
3.4<br />
2.1<br />
Figure 3.19b. Metro Area <strong>Industrial</strong> <strong>Water</strong> Demand, 2005<br />
Source: Met Council <strong>Industrial</strong> Discharge Permit Program, 2005<br />
3-42 Craddock Consulting Engineers<br />
In Association with CDM & James Crook<br />
5.5<br />
5.9<br />
6.4<br />
7.5<br />
10.6<br />
14.7<br />
0.0 2.0 4.0 6.0 8.0 10.0 12.0 14.0 16.0<br />
<strong>Water</strong> Demand/<strong>Use</strong>, mgd<br />
WWReuseTM1_Sec 3_final.doc
Figure 3.18 Metro Area <strong>Industrial</strong> Reuse Customer<br />
Inventory - DNR <strong>Water</strong> Appropriation Permits<br />
South Fork Crow<br />
!<br />
!<br />
!<br />
" !<br />
"<br />
" !<br />
!<br />
!<br />
! ! "<br />
!<br />
!<br />
!<br />
" !<br />
! " !<br />
!<br />
!<br />
! !<br />
! "<br />
! !<br />
! ! !<br />
!<br />
!<br />
! " !<br />
!<br />
!<br />
!<br />
!<br />
! ! ! ! !<br />
! !<br />
!<br />
! !<br />
" !<br />
! "! !<br />
" " !<br />
!!! ! !<br />
"<br />
" !<br />
!<br />
!<br />
!<br />
!<br />
" !<br />
!<br />
!<br />
!<br />
!<br />
!<br />
!<br />
!<br />
!<br />
Met Council - St Croix Valley WWTP<br />
! #<br />
!<br />
!<br />
!<br />
!<br />
! ! !<br />
! !<br />
!<br />
! !<br />
!<br />
!<br />
!<br />
!<br />
! !<br />
! Met Council<br />
! !<br />
! - Metropolitan<br />
!<br />
!<br />
#<br />
!<br />
!<br />
! Met Council - Seneca WWTP<br />
! #<br />
Met Council - Blue Lake WWTP<br />
Met Council - Eagles Point<br />
# !<br />
! ! !<br />
#<br />
Met Council<br />
! !<br />
!<br />
- RosemountMet<br />
Council - Hastings<br />
#<br />
"<br />
"<br />
!<br />
#<br />
!<br />
!<br />
Met Council - Empire<br />
"<br />
!<br />
#<br />
#<br />
New Prague<br />
Rum<br />
!<br />
!<br />
Mississippi<br />
") Agricultural Processing #*<br />
") <strong>Industrial</strong> Process Cooling #*<br />
") <strong>Industrial</strong> Processing<br />
") Metal Processing<br />
!(<br />
") Non-Metallic Processing ")<br />
") Petroleum-Chemical Processing<br />
") Pulp and Paper Processing<br />
") Sand and Gravel Washing<br />
") Power Generation<br />
Minnesota<br />
"<br />
"<br />
Northfield<br />
!<br />
#<br />
#<br />
Cannon<br />
"<br />
WWTP >=5 mgd<br />
WWTP 1-5 mgd<br />
Major Rivers<br />
Ground <strong>Water</strong><br />
Surface <strong>Water</strong><br />
County<br />
<strong>Municipal</strong>ity<br />
2004 <strong>Water</strong> <strong>Use</strong><br />
!<br />
0 20 40 Miles<br />
Source: Minnesota DNR <strong>Water</strong> Appropriation Permits (Withdrawls greater than 1mgy or 10,000 gpd )<br />
!<br />
"<br />
!<br />
St. Croix<br />
!( 0.00 - 0.50 mgd<br />
!( 0.51 - 1.50 mgd<br />
!(<br />
¯<br />
!( 1.51 - 5.00 mgd<br />
!( 5.01 - 10.00 mgd<br />
!(<br />
10.01 - 25.00 mgd<br />
25.01 - 505.00 mgd
Figure 3.19a. Metro Area <strong>Industrial</strong> Reuse<br />
Customer Inventory - MCES <strong>Industrial</strong> Dischargers<br />
South Fork Crow<br />
") Building Material<br />
") Chemical Products<br />
") Electronic Products<br />
") Food Product<br />
") Glass Products<br />
") Laboratory<br />
") Laundry<br />
") Leather Products<br />
") Medical Products<br />
") Metal Products<br />
") Other<br />
") Paper/Packaging<br />
G<br />
G<br />
G<br />
G<br />
G<br />
G<br />
G<br />
G<br />
G<br />
G<br />
G<br />
G<br />
G<br />
G<br />
G<br />
G<br />
G G<br />
G<br />
G G G G G<br />
G<br />
G G G<br />
GG<br />
G<br />
G<br />
G<br />
G<br />
G<br />
G<br />
G<br />
G G<br />
G<br />
G<br />
G<br />
G<br />
G<br />
G<br />
G<br />
G G<br />
G<br />
G<br />
G G<br />
G<br />
G<br />
GG<br />
G G G<br />
G<br />
G<br />
G<br />
G G G<br />
G<br />
G<br />
G<br />
G<br />
G<br />
G<br />
G<br />
G<br />
G<br />
G G<br />
G<br />
G<br />
G<br />
G<br />
G<br />
G<br />
G<br />
G G<br />
G<br />
G<br />
[<br />
G<br />
G<br />
G<br />
G G<br />
G<br />
GG<br />
G<br />
G<br />
G<br />
G<br />
GG G<br />
G<br />
G<br />
G<br />
GG G G<br />
G GG GG<br />
G<br />
GGGG<br />
G<br />
GGG<br />
GGG G G<br />
G<br />
G<br />
GG<br />
G<br />
G<br />
G G<br />
GG<br />
G<br />
GGGG GG<br />
G<br />
G G G<br />
G G GG<br />
GG G G G G<br />
G GGGG<br />
G<br />
G<br />
GGG<br />
G GGG<br />
G G<br />
G<br />
G<br />
G<br />
G<br />
G G<br />
G<br />
G<br />
G GG<br />
G G<br />
G<br />
G GGG G[<br />
G<br />
G[ GG<br />
G<br />
G<br />
G<br />
G[<br />
G<br />
G<br />
G G G<br />
G<br />
G<br />
G[<br />
G<br />
G<br />
G<br />
G<br />
[<br />
G<br />
G<br />
G<br />
G<br />
G[GG<br />
G<br />
G<br />
G<br />
GG G<br />
GG<br />
G<br />
G GG<br />
G<br />
G<br />
G<br />
GG<br />
G<br />
G<br />
GG<br />
G G<br />
G<br />
G [ G<br />
G<br />
G<br />
G<br />
G<br />
G<br />
G<br />
G<br />
G<br />
G<br />
G<br />
G G<br />
G G<br />
G<br />
G<br />
G<br />
GGG GGG GG<br />
[<br />
G<br />
GG GG<br />
G<br />
G<br />
G<br />
GG G<br />
GG<br />
G<br />
GG<br />
G G<br />
G<br />
G G<br />
G<br />
GGG G<br />
G<br />
GG<br />
G<br />
G<br />
G GG<br />
GG<br />
G<br />
G<br />
G<br />
G<br />
G<br />
G<br />
G<br />
[<br />
GG<br />
G<br />
G G<br />
G<br />
GG<br />
G<br />
G GG<br />
GGGG<br />
G<br />
G<br />
G<br />
G G<br />
[<br />
G<br />
G<br />
G<br />
G<br />
G<br />
G<br />
G<br />
G<br />
G<br />
G<br />
G<br />
G<br />
G<br />
G<br />
G G GG[ G[ G G<br />
G GG<br />
GG<br />
G<br />
G<br />
#<br />
Rogers WWTP<br />
G<br />
G<br />
G<br />
G<br />
G<br />
G<br />
#*<br />
G<br />
St. Croix Valley WWTP<br />
G<br />
G<br />
G G<br />
G<br />
G<br />
G<br />
G<br />
#*<br />
Metropolitan WWTP<br />
G<br />
#*<br />
Seneca WWTP<br />
#*<br />
Blue Lake WWTP G<br />
#*<br />
Eagles Point WWTP<br />
#* G<br />
#*<br />
Rosemount WWTP<br />
Hastings WWTP<br />
Minnesota<br />
Rum<br />
Mississippi<br />
Interstate 394<br />
Interstate 494<br />
Interstate 35W<br />
")<br />
")<br />
")<br />
") Textile<br />
")<br />
")<br />
")<br />
#*<br />
#*<br />
Interstate 35W<br />
GGG G<br />
Photofinishing<br />
Printed Products<br />
WWTP >= 5 mgd<br />
WWTP 1-5 mgd<br />
Major Rivers<br />
Interstate<br />
Interstate 35E<br />
#*<br />
Interstate 35E<br />
G GEmpire<br />
G WWTP<br />
Cannon<br />
Research Development<br />
Transportation<br />
Utilities_Power<br />
Utilities_Steam<br />
G<br />
Interstate 35<br />
Interstate 694<br />
Interstate 94<br />
0 20 40 Miles<br />
[<br />
St. Croix<br />
¯<br />
Well/<br />
Other Nonmunicipal<br />
<strong>Municipal</strong><br />
Source: Metropolitan Council <strong>Industrial</strong> Dischargers Permit Program, 2005<br />
G<br />
G<br />
G<br />
G<br />
G<br />
G<br />
G<br />
County<br />
<strong>Municipal</strong>ity<br />
0.00 - 0.50 mgd<br />
0.51 - 1.50 mgd<br />
1.51 - 5.00 mgd<br />
5.01 - 10.00 mgd<br />
10.01 - 25.00 mgd<br />
25.01 - 505.00 mgd
Section 3<br />
Inventory of Major WWTPs and Potential <strong>Industrial</strong> Reuse Demands<br />
Craddock Consulting Engineers 3-43<br />
In Association with CDM & James Crook<br />
WWReuseTM1_Sec 3_final.doc<br />
The inventory <strong>for</strong> the metro area is restricted to the Met Council plants and Rogers<br />
WWTP (since it resides in the seven county area). In<strong>for</strong>mation is provided on a plantbasis<br />
organized by watershed. The following sections summarize the industries<br />
within 1- and 5-miles zones of the plant. These zones are represented as circles on the<br />
maps. A brief summary of the range of flows <strong>for</strong> the industries in these two zones is<br />
provided, followed by a list of the industries. The purpose of this inventory is to<br />
define the ‘universe’ of potential industrial reuse customers. Task 2 will apply<br />
selected criteria to rank and identify industrial reuse customers <strong>for</strong> a more detailed<br />
analysis.<br />
Minnesota River <strong>Water</strong>shed WWTPs<br />
The Blue Lake and Seneca WWTPs reside in the Minnesota River watershed. Both of<br />
these facilities are in the design phase of process improvements and expansion. The<br />
plants are currently rated at 37 and 39 mgd, respectively.<br />
A variety of industries are located within a 5-mile radius of the Blue Lake WWTP, as<br />
shown on Figure 3.20. Table 3.18 lists all these industries and identifies the water<br />
source. Non-metallic and metal processing facilities are the most abundant type of<br />
industry. The water demand <strong>for</strong> industries near the Blue Lake WWTP is 0.13 mgd <strong>for</strong><br />
nonpotable (not supplied by a municipal water supply system and obtained through<br />
an appropriations permit) ground water, and 3.8 mgd <strong>for</strong> a combination of potable<br />
and nonpotable supplies. The largest water user in the 5-mile zone was ADC<br />
Telecommunications Inc <strong>for</strong> metal processing. They used 1.44 mgd of municipal water<br />
in 2005. Prior Lake Aggregates, a sand and gravel washing business, had the second<br />
highest demand with 0.4 mgd. There were no facilities within a 1-mile radius.<br />
The Seneca WWTP has a larger number of industries within a five-mile radius and<br />
one food processing industry, Best Brands, within 1 mile of the plant. Figure 3.21<br />
shows these industries spatially and Table 3.19 lists the industries. The metal<br />
processing category has the largest number of facilities, but most have demands less<br />
than 0.05 mgd, except <strong>for</strong> Polar Semiconductor Inc, which used 1.7 mgd in 2005 and<br />
Cypress Semi-Conductor, which used 2 mgd in 2005. The food products industries in<br />
the 5-mile zone had the next largest demand. The total demand <strong>for</strong> the industries<br />
permitted by Met Council was 9.7 mgd in 2005. Other industries within the 5-mile<br />
zone include some that do not discharge to the Met Council sewers, but are large<br />
water users, such as Xcel Energy. Nearly 300 mgd of nonpotable supply was used by<br />
industries in the 5-mile zone of the Seneca Plant, of which 2.7 mgd was ground water.
Section 3<br />
Inventory of Major WWTPs and Potential <strong>Industrial</strong> Reuse Demands<br />
Table 3.18. Blue Lake WWTP Industries Within a 5 Mile Radius<br />
DNR <strong>Water</strong><br />
MCES Business<br />
Industry Name<br />
Permit Source * Industry Category - DNR Category<br />
ADC Telecommunications Inc M Metal Processing Metal Products<br />
Anchor Glass Container Corp x G; M&G Non-Metallic Processing<br />
B.F. Nelson Corporation M <strong>Industrial</strong> Processing Paper/Packaging<br />
Birchwood Laboratories Inc M&G Other Laboratory<br />
Cargill Inc-Process Development M Agricultural Processing Food Products<br />
Certainteed Corp M <strong>Industrial</strong> Processing Building Material<br />
Chaska Chemical Co Inc M Non-Metallic Processing Chemical Products<br />
Conklin Co M Non-Metallic Processing Chemical Products<br />
Continental Machines M Metal Processing Metal Products<br />
Degussa Building Systems (0964) M Non-Metallic Processing Chemical Products<br />
Detector Electronics Corp M Metal Processing Metal Products<br />
E A Sween Co dba Deli Express M Agricultural Processing Food Products<br />
Eaton Corp x G Metal Processing<br />
Eaton MDH Inc, Eden Prairie Pl G Metal Processing Metal Products<br />
Fremont Industries Inc G Non-Metallic Processing Chemical Products<br />
Greenman Technologies of MN x G; M&G Non-Metallic Processing Chemical Products<br />
Inland Paperboard & Packaging Inc x G Pulp and Paper Processing<br />
Stean Power - Other than<br />
Koch Material Company x G Cooling<br />
NatureWorks LLC M Non-Metallic Processing Chemical Products<br />
Novus Inc M Non-Metallic Processing<br />
Steam Power Cooling – Wet<br />
Chemical Products<br />
NSP CO DBA Xcel Energy x G Tower<br />
NVE Corp M Metal Processing<br />
<strong>Industrial</strong> Process Cooling<br />
Once - through; Metal<br />
Electronic Product<br />
Rosemount Inc x G; M&G Processing Electronic Product<br />
Rubber Industries Inc M Non-Metallic Processing Chemical Products<br />
Seagate Technology LLC M+ Metal Processing Electronic Produc<br />
Shakopee Gravel Inc x G Sand & Gravel Washing<br />
Shakopee Valley Printing M <strong>Industrial</strong> Processing Printed Products<br />
Temple-Inland* G <strong>Industrial</strong> Processing Paper/Packaging<br />
Toro Co M Metal Processing<br />
Steam Power Cooling – Wet<br />
Metal Products<br />
NSP CO DBA Xcel Energy x G Tower<br />
* M: <strong>Municipal</strong>; G: Ground <strong>Water</strong>; M & G: <strong>Municipal</strong> and Ground <strong>Water</strong>: M+: <strong>Municipal</strong> and Other Sources.<br />
** Industry located with 1 mile of the WWTP.<br />
3-44 Craddock Consulting Engineers<br />
In Association with CDM & James Crook<br />
WWReuseTM1_Sec 3_final.doc
G<br />
G<br />
Flying Cloud Dr<br />
!! G!<br />
G<br />
Figure 3.20. Blue Lake WWTP -<br />
Industries within 1 and 5 mile Radii<br />
State Hwy 5<br />
G !<br />
G<br />
G !<br />
G<br />
! G GG<br />
G G<br />
G<br />
US Hwy 169<br />
!<br />
I-494<br />
!<br />
G!<br />
Minnesota<br />
#*<br />
!<br />
G<br />
US Hwy 212<br />
Blue Lake WWTP<br />
") Agricultural Processing<br />
WWTP >=5 mgd<br />
") <strong>Industrial</strong> Process Cooling #* WWTP 1-5 mgd<br />
") <strong>Industrial</strong> Processing<br />
Major Rivers<br />
") Metal Processing<br />
Highway<br />
")<br />
")<br />
Non-Metallic Processing<br />
Other<br />
!(<br />
")<br />
Ground <strong>Water</strong><br />
Surface <strong>Water</strong><br />
") Petroleum-Chemical Processing G <strong>Municipal</strong> <strong>Water</strong><br />
")<br />
")<br />
")<br />
Pulp and Paper Processing<br />
Sand and Gravel Washing<br />
Power Generation<br />
County<br />
<strong>Municipal</strong>ity<br />
#*<br />
G<br />
G<br />
G<br />
G<br />
G<br />
G<br />
G<br />
US Hwy 169<br />
G<br />
"<br />
G<br />
G<br />
!<br />
!<br />
GG<br />
G<br />
G G G<br />
G<br />
!<br />
G! G GG<br />
State Hwy 13 I-494<br />
State Hwy 100<br />
G<br />
0 5 Miles<br />
G<br />
G<br />
Sources: Minnesota DNR <strong>Water</strong> Appropriation Permit Program, 2004 (Withdrawls greater than 1 mgy or 10,000 gpd)<br />
Metropolitan Council <strong>Industrial</strong> Dischargers Permit Program, 2005<br />
!(<br />
0.00 - 0.50 mgd<br />
!( 0.51 - 1.50 mgd<br />
!( 1.51 - 5.00 mgd<br />
!( 5.01 - 10.00 mgd<br />
10.01 - 25.00 mgd !(<br />
25.01 - 505.00 mgd !(<br />
¯<br />
G<br />
G<br />
G
G<br />
G<br />
State Hwy 62<br />
GG<br />
!<br />
"!<br />
! !<br />
Figure 3.21. Seneca WWTP -<br />
Industries within 1 and 5 mile Radii<br />
G<br />
G<br />
G<br />
!<br />
!<br />
G<br />
G G<br />
G<br />
G GG<br />
G<br />
G<br />
G<br />
G<br />
I-35W<br />
State Hwy 13 W<br />
I-35W<br />
G<br />
Minnesota<br />
!<br />
G!<br />
G<br />
" !<br />
G<br />
State Hwy 77<br />
G<br />
!<br />
I-494<br />
G G<br />
G!<br />
!<br />
G<br />
G<br />
I-35E<br />
!!<br />
G !<br />
"<br />
G<br />
#*<br />
Seneca WWTP<br />
State Hwy 77 State Hwy 5<br />
") Agricultural Processing<br />
WWTP >=5 mgd<br />
") <strong>Industrial</strong> Process Cooling #* WWTP 1-5 mgd<br />
") <strong>Industrial</strong> Processing<br />
Major Rivers<br />
") Metal Processing<br />
Highway<br />
")<br />
")<br />
Non-Metallic Processing<br />
Other<br />
!(<br />
")<br />
Ground <strong>Water</strong><br />
Surface <strong>Water</strong><br />
") Petroleum-Chemical Processing G <strong>Municipal</strong> <strong>Water</strong><br />
")<br />
")<br />
")<br />
Pulp and Paper Processing<br />
Sand and Gravel Washing<br />
Power Generation<br />
County<br />
<strong>Municipal</strong>ity<br />
#*<br />
State Hwy 55<br />
G<br />
I-494<br />
I-35E<br />
!<br />
G G<br />
G<br />
! GG<br />
G<br />
Mississippi<br />
State Hwy 13<br />
State Hwy 55<br />
G<br />
G G<br />
!<br />
Dodd Rd<br />
G G!<br />
State Hwy 110<br />
G<br />
Dodd Rd<br />
GG<br />
0 5Miles<br />
G<br />
G<br />
Sources: Minnesota DNR <strong>Water</strong> Appropriation Permit Program, 2004 (Withdrawls greater than 1 mgy or 10,000 gpd)<br />
Metropolitan Council <strong>Industrial</strong> Dischargers Permit Program, 2005<br />
!(<br />
Robert Tr S<br />
¯<br />
0.00 - 0.50 mgd<br />
!( 0.51 - 1.50 mgd<br />
!( 1.51 - 5.00 mgd<br />
!( 5.01 - 10.00 mgd<br />
10.01 - 25.00 mgd !(<br />
25.01 - 505.00 mgd !(
Section 3<br />
Inventory of Major WWTPs and Potential <strong>Industrial</strong> Reuse Demands<br />
Craddock Consulting Engineers 3-45<br />
In Association with CDM & James Crook<br />
WWReuseTM1_Sec 3_final.doc<br />
Table 3.19. Seneca WWTP Industries Within a 5 mile Radius<br />
DNR <strong>Water</strong> Industry Category - MCES Business<br />
Industry Name<br />
Permit Source*<br />
DNR<br />
Category<br />
Best Brands Inc** M Agricultural Processing Food Products<br />
Added Value Technology M Metal Processing Electronic Products<br />
Aspen Equipment Co M Metal Processing Metal Products<br />
Better Parts Co M Metal Processing Metal Products<br />
Bo-Decor Metal Finishing Inc M Metal Processing Metal Products<br />
BSM/CORAM North America, Inc. M Metal Processing Metal Products<br />
Buddy's Kitchen Inc M Agricultural Processing Food Products<br />
Cintas Corp - Eagan M <strong>Industrial</strong> Processing Laundry<br />
Coca - Cola Bottling MW x G<br />
G,<br />
Agricultural Processing<br />
Cypress Semiconductor x M&G Metal Processing<br />
Domino's National Commissary C M Agricultural Processing Food Products<br />
Donaldson Co Inc M Metal Processing Metal Products<br />
Ecolab Inc M Non-Metallic Processing Chemical Products<br />
FMS Corp M Metal Processing Metal Products<br />
General Dynamics Advanced Info M Metal Processing Electronic Produc<br />
Gopher Resource Corp x G, M+ Metal Processing<br />
Hitchcock Industries Inc M Metal Processing Metal Products<br />
Holnamic x G Metal Processing<br />
Huebsch Laundry Co M <strong>Industrial</strong> Processing Laundry<br />
Interstate Detroit Diesel M Metal Processing Transportation<br />
KIK Minnesota M Non-Metallic Processing Chemical Products<br />
Leeann Chin Inc M Agricultural Processing Food Products<br />
Litho Technical Service M <strong>Industrial</strong> Processing Printed Products<br />
Lloyd's Barbeque Co M Agricultural Processing Food Products<br />
LSG/Sky Chef M+ Agricultural Processing Food Products<br />
Metro Transit M Metal Processing Transportation<br />
Metropolitan Airports Commissi M+ Metal Processing Transportation<br />
Micro Parts Inc M Metal Processing Metal Products<br />
Micron Molding Inc x G Non-Metallic Processing<br />
Midwest Coca Cola Bottling Inc M&G Agricultural Processing Food Products<br />
Minnesota Knitting Mills M Non-Metallic Processing Textiles<br />
Morrissey Inc M Metal Processing Metal Products<br />
Northwest Airlines Inc x G Metal Processing<br />
Northwest Airlines Inc (MB) 20 G Metal Processing Transportation<br />
Northwest Airlines Inc (OB) M Metal Processing<br />
Steam Power Cooling –<br />
Transportation<br />
NSP CO DBA Xcel Energy x G, S Once Through<br />
Pepsi Bottling Group LLC M&G Agricultural Processing Food Products<br />
Pepsi Cola Bottling Co x G Agricultural Processing<br />
Polar Semiconductor Inc M&G Metal Processing Electronic Produc<br />
Polarfab LLC x G Non-Metallic Processing<br />
Printed Circuits Inc M Metal Processing Electronic Produc<br />
Release Coatings of Minneapoli M Non-Metallic Processing Chemical Products<br />
Rosemount Aerospace Inc M Metal Processing Electronic Produc<br />
Servisair & Shell Fuel Service M+ Metal Processing Transportation
Section 3<br />
Inventory of Major WWTPs and Potential <strong>Industrial</strong> Reuse Demands<br />
Table 3.19. Seneca WWTP Industries Within a 5 mile Radius<br />
DNR <strong>Water</strong> Industry Category - MCES Business<br />
Industry Name<br />
Permit Source*<br />
DNR<br />
Category<br />
Skyline Exhibits M+ Metal Processing Metal Products<br />
Spruce Co M <strong>Industrial</strong> Processing Laundry<br />
Sunburst Chemicals Inc M Non-Metallic Processing Chemical Products<br />
Surmodics Inc x G <strong>Industrial</strong> Processing<br />
Tempco Mfg Co Inc M Metal Processing Metal Products<br />
Thermo King Corp M Metal Processing Metal Products<br />
Thomson West - Eagan Productio M+ <strong>Industrial</strong> Processing Printed Products<br />
Valmont / Applied Coating Tech M Metal Processing Metal Products<br />
Ziegler Inc M Metal Processing Metal Products<br />
* M: <strong>Municipal</strong>; G: Ground <strong>Water</strong>; M & G: <strong>Municipal</strong> and Ground <strong>Water</strong>: M+: <strong>Municipal</strong> and Other Sources;<br />
S: Surface <strong>Water</strong>.<br />
** Industry located with 1 mile of the WWTP.<br />
Mississippi River <strong>Water</strong>shed WWTPs<br />
The WWTPs that discharge to the Mississippi River-Headwaters watershed from<br />
upstream to downstream include: Rogers, Metropolitan, Rosemount, Eagles Point,<br />
and Hastings. The Empire WWTP currently discharges to the Vermillion River, a part<br />
of the Lower Mississippi River watershed. Upon completion of facility and interceptor<br />
construction, the discharge will move to a new discharge point on the Mississippi<br />
River in the vicinity of the existing Rosemount WWTP discharge.<br />
The 1.6 mgd Rogers WWTP has only two industries within a 5-mile radius (both<br />
located within 1 mile) of the plant with a total demand of 0.05 mgd. Figure 3.22 and<br />
Table 3.20 identify these industries as sand and gravel washing businesses, one of<br />
which does other processing operations.<br />
Table 3.20 Rogers WWTP Industries Within a 5 Mile Radius<br />
DNR <strong>Water</strong><br />
Industry Name<br />
Permit Source* Industry Category - DNR<br />
Aggregate Industries_NCR Inc.** x G Non-Metallic Processing<br />
Hassen Sand & Gravel Inc. ** x S Sand & Gravel Washing<br />
* G: Ground <strong>Water</strong>; S: Surface <strong>Water</strong>.<br />
** Industry located with 1 mile of the WWTP.<br />
MCES Business<br />
Category<br />
The largest WWTP in Minnesota, the 250 mgd Metropolitan (Metro) WWTP, has a<br />
diversity of industries within a 5-mile radius of the plant, as shown on Figure 3.23. A<br />
chemical company, Hawkins Chemical, with a demand of 0.1 mgd, is located within<br />
1 mile of the plant. In the 5-mile zone around the plant, the industrial water demand<br />
is 0.96 mgd <strong>for</strong> nonpotable supply, and 17 mgd <strong>for</strong> combined municipal and<br />
nonpotable supplies. Table 3.21 lists these facilities and their industry type.<br />
3-46 Craddock Consulting Engineers<br />
In Association with CDM & James Crook<br />
WWReuseTM1_Sec 3_final.doc
Figure 3.22. Rogers WWTP -<br />
Industries within 1 and 5 mile Radii<br />
Central Ave E<br />
I-94<br />
"<br />
#<br />
Rogers<br />
WWTP<br />
") Agricultural Processing<br />
WWTP >=5 mgd<br />
") <strong>Industrial</strong> Process Cooling #* WWTP 1-5 mgd<br />
") <strong>Industrial</strong> Processing<br />
Major Rivers<br />
") Metal Processing<br />
Highway<br />
")<br />
")<br />
Non-Metallic Processing<br />
Other<br />
!(<br />
")<br />
Ground <strong>Water</strong><br />
Surface <strong>Water</strong><br />
") Petroleum-Chemical Processing G <strong>Municipal</strong> <strong>Water</strong><br />
")<br />
")<br />
")<br />
Pulp and Paper Processing<br />
Sand and Gravel Washing<br />
Power Generation<br />
County<br />
<strong>Municipal</strong>ity<br />
#*<br />
State Hwy 101<br />
!<br />
I-94<br />
US Hwy 10<br />
North Fork Crow<br />
Mississippi<br />
¯<br />
0 5Miles<br />
G<br />
G<br />
Sources: Minnesota DNR <strong>Water</strong> Appropriation Permit Program, 2004 (Withdrawls greater than 1 mgy or 10,000 gpd)<br />
Metropolitan Council <strong>Industrial</strong> Dischargers Permit Program, 2005<br />
!(<br />
0.00 - 0.50 mgd<br />
!( 0.51 - 1.50 mgd<br />
!( 1.51 - 5.00 mgd<br />
!( 5.01 - 10.00 mgd<br />
10.01 - 25.00 mgd !(<br />
25.01 - 505.00 mgd !(
! I-94 G<br />
!<br />
G G<br />
Minnesota<br />
G<br />
! GG<br />
G<br />
G<br />
G<br />
G<br />
G G<br />
Dodd Rd<br />
State Hwy 55<br />
G<br />
Figure 3.23. Metropolitan WWTP -<br />
Industries within 1 and 5 mile Radii<br />
State Hwy 36<br />
I-35E<br />
!<br />
!<br />
G<br />
G<br />
G<br />
G<br />
G<br />
G<br />
!<br />
G ! G G G<br />
G<br />
G G!<br />
! G<br />
"<br />
W 7th St<br />
I-494<br />
Dodd Rd<br />
G<br />
S Smith Ave<br />
G<br />
State Hwy 110<br />
State Hwy 55<br />
G<br />
G<br />
G<br />
I-35E<br />
Robert Tr S<br />
E 7th St<br />
Robert St<br />
S Lafayette Rd<br />
G<br />
N Arcade St<br />
G<br />
GG !<br />
!! !<br />
G<br />
G<br />
Maplewood Dr<br />
US Hwy 52<br />
!<br />
G<br />
#<br />
G<br />
!<br />
Metropolitan WWTP<br />
Concord St N<br />
G<br />
G<br />
") Agricultural Processing<br />
WWTP >=5 mgd<br />
") <strong>Industrial</strong> Process Cooling #* WWTP 1-5 mgd<br />
") <strong>Industrial</strong> Processing<br />
Major Rivers<br />
") Metal Processing<br />
Highway<br />
")<br />
")<br />
Non-Metallic Processing<br />
Other<br />
!(<br />
")<br />
Ground <strong>Water</strong><br />
Surface <strong>Water</strong><br />
") Petroleum-Chemical Processing G <strong>Municipal</strong> <strong>Water</strong><br />
")<br />
")<br />
")<br />
Pulp and Paper Processing<br />
Sand and Gravel Washing<br />
Power Generation<br />
County<br />
<strong>Municipal</strong>ity<br />
#*<br />
Concord St S<br />
G<br />
G<br />
!<br />
!<br />
G!<br />
!! G<br />
!<br />
G<br />
Mississippi<br />
US Hwy 61<br />
G<br />
Stillwater Rd<br />
G<br />
G<br />
! !!!<br />
G<br />
Division St N<br />
Century Ave<br />
I-494<br />
G<br />
US Hwy 61<br />
I-94<br />
G<br />
GG<br />
34th St N<br />
0 5Miles<br />
G<br />
G<br />
Sources: Minnesota DNR <strong>Water</strong> Appropriation Permit Program, 2004 (Withdrawls greater than 1 mgy or 10,000 gpd)<br />
Metropolitan Council <strong>Industrial</strong> Dischargers Permit Program, 2005<br />
!(<br />
I-694<br />
G<br />
¯<br />
0.00 - 0.50 mgd<br />
!( 0.51 - 1.50 mgd<br />
!( 1.51 - 5.00 mgd<br />
!( 5.01 - 10.00 mgd<br />
10.01 - 25.00 mgd !(<br />
25.01 - 505.00 mgd !(
Section 3<br />
Inventory of Major WWTPs and Potential <strong>Industrial</strong> Reuse Demands<br />
Craddock Consulting Engineers 3-47<br />
In Association with CDM & James Crook<br />
WWReuseTM1_Sec 3_final.doc<br />
Table 3.21. Metropolitan WWTP Industries Within a 5 Mile Radius<br />
DNR <strong>Water</strong><br />
Industry Name<br />
Permit Source* Industry Category - DNR MCES Business Category<br />
3M Co M Metal Processing Metal Products<br />
3M Co - 3M Center M Other Research & Develop<br />
3M Company x G Non-Metallic Processing<br />
A W Beadblasting Co M Metal Processing Metal Products<br />
ADDCO Inc M Metal Processing Metal Products<br />
Americraft Carton Inc M <strong>Industrial</strong> Processing Paper/Packaging<br />
Anamax Corp (0273) M+ Agricultural Processing Food Products<br />
Bix Produce Co M Agricultural Processing Food Products<br />
C & H Chemical Inc M Non-Metallic Processing Chemical Products<br />
Captain Kens Foods Inc x G Agricultural Processing<br />
Canadian Pacific Railway M+ Metal Processing<br />
<strong>Industrial</strong> Processing; Non-<br />
Transportation<br />
Cemstone Products x G Metallic Processing<br />
Central Livestock Association M+ Agricultural Processing Food Products<br />
D & D Land LLC x G Non-Metallic Processing<br />
Dakota Premium Foods LLC M Agricultural Processing Food Products<br />
Dean Foods Woodbury M Agricultural Processing Food Products<br />
Diamond Products Co M+ Non-Metallic Processing Chemical Products<br />
District Energy St Paul Inc M Other Utilities-Steam&A<br />
ECOLAB Inc x G <strong>Industrial</strong> Processing<br />
Ecowater Corp M Other Other<br />
Fox Packaging Inc M Non-Metallic Processing Chemical Products<br />
G & K Services M <strong>Industrial</strong> Processing Laundry<br />
Gerdau Ameristeel US Inc - St M&G Metal Processing<br />
Petroleum or Chemical<br />
Metal Products<br />
Gopher State Ethanol LLC x G Processing, Ethanol<br />
Gross-Given Mfg Co M Metal Processing Metal Products<br />
Hawkins Chemical Inc** M Non-Metallic Processing Chemical Products<br />
Health Systems Cooperative<br />
Lau M <strong>Industrial</strong> Processing Laundry<br />
IonBond Inc M Non-Metallic Processing Chemical Products<br />
J & L Wire Cloth Co Inc M Metal Processing Metal Products<br />
Metro Transit M Metal Processing Transportation<br />
Modernistic Inc M <strong>Industrial</strong> Processing Printed Products<br />
Molex Inc Copper Flex<br />
Products M Metal Processing Metal Products<br />
North Star Steel Minnesota x G Metal Processing<br />
North Star Steel St Paul x G Metal Processing<br />
Northern Malleable Iron Co x G Metal Processing<br />
Northern Screw Machine Co M Metal Processing Metal Products<br />
NRG Energy Center Inc x G Pulp and Paper Processing<br />
Steam Power - Other than<br />
Cooling; Steam Power<br />
NSP CO DBA Xcel Energy x G, S Cooling - Once Through<br />
NSP, dba Xcel Energy (0576) M&G Power Generation Utilities-Power<br />
Old Home Foods Inc M+ Agricultural Processing Food Products<br />
Rexam Beverage Can M Metal Processing Metal Products
Section 3<br />
Inventory of Major WWTPs and Potential <strong>Industrial</strong> Reuse Demands<br />
Table 3.21. Metropolitan WWTP Industries Within a 5 Mile Radius<br />
DNR <strong>Water</strong><br />
Industry Name<br />
Permit Source* Industry Category - DNR MCES Business Category<br />
Sexton Printing Inc M <strong>Industrial</strong> Processing Printed Products<br />
South St Paul Truck Wash M Metal Processing Transportation<br />
St Paul Cogeneration LLC M&G Power Generation Utilities-Power<br />
St Paul Pioneer Press Dispatch M; M&G <strong>Industrial</strong> Processing Printed Products<br />
Stock Yards Meat Packing Co M Agricultural Processing Food Products<br />
Summit Brewing Co M Agricultural Processing Food Products<br />
Travel Tags M <strong>Industrial</strong> Processing Printed Products<br />
Twin City Hide Inc (0048) M Non-Metallic Processing Leather Products<br />
Twin City Tanning Co (0784) M Non-Metallic Processing Leather Products<br />
Univar USA Inc M Non-Metallic Processing Chemical Products<br />
Upper River Services Inc M+ Metal Processing Transportation<br />
Versa Iron & Machine M&G Metal Processing Metal Products<br />
Viking Drill & Tool Inc M Metal Processing Metal Products<br />
<strong>Water</strong>ous Co M Metal Processing Metal Products<br />
Wipaire Inc M Metal Processing Metal Products<br />
* M: <strong>Municipal</strong>; G: Ground <strong>Water</strong>; M & G: <strong>Municipal</strong> and Ground <strong>Water</strong>: M+: <strong>Municipal</strong> and Other Sources; S:<br />
Surface <strong>Water</strong><br />
** Industry located with 1 mile of the WWTP.<br />
The Rosemount WWTP will be phased out by 2007, as the outfall from the expanded<br />
Empire WWTP is brought online. The in<strong>for</strong>mation is still summarized because the<br />
outfall from Empire will be able to serve these areas with treated effluent when the<br />
facility is abandoned. There are four facilities within a 1-mile radius of Rosemount<br />
and five more within a five-mile radius. <strong>Municipal</strong> water demand was 0.07 and<br />
nonpotable water demand was 7.7 mgd in 2004. Figure 3.24 show these industries<br />
spatially and Table 3.22 lists the facilities and their industry type.<br />
Table 3.22. Rosemount WWTP Industries Within a 5 Mile Radius<br />
Industry Name<br />
DNR<br />
Permit<br />
<strong>Water</strong><br />
Source* Industry Category - DNR<br />
Aggregate Industries-NCR Inc x S Sand & Gravel Washing<br />
Bituminous Roadways Inc x S Sand & Gravel Washing<br />
Continental Nitrogen & Resources** x G<br />
Petroleum or Chemical<br />
Processing, Ethanol<br />
CF Industries Inc x G Non-Metallic Processing<br />
Petroleum or Chemical<br />
Flint Hills Resources LP** x G Processing, Ethanol<br />
MCES<br />
Business<br />
Category<br />
Greif Bros Corp M <strong>Industrial</strong> Processing Paper/Packaging<br />
NRG Processing Solutions LLC x G Non-Metallic Processing<br />
Spectro Alloys Corp** x G Metal Processing<br />
Wayne Transports Inc** M&G Metal Processing Transportation<br />
* M: <strong>Municipal</strong>; G: Ground <strong>Water</strong>; S: Surface <strong>Water</strong><br />
** Industry located with 1 mile of the WWTP.<br />
3-48 Craddock Consulting Engineers<br />
In Association with CDM & James Crook<br />
WWReuseTM1_Sec 3_final.doc
G<br />
G<br />
G!<br />
Dodd Rd<br />
GG<br />
Figure 3.24. Rosemount WWTP -<br />
Industries within 1 and 5 mile Radii<br />
#*<br />
Empire WWTP<br />
State Hwy 55<br />
"<br />
Empire Outfall<br />
(Construction Completed 2007)<br />
!! ! !<br />
! ! ! ! ! !<br />
US Hwy 52<br />
G<br />
#*<br />
"<br />
!<br />
!<br />
"<br />
Rosemount WWTP<br />
US Hwy 52<br />
Courthouse Blvd<br />
") Agricultural Processing<br />
WWTP >=5 mgd<br />
") <strong>Industrial</strong> Process Cooling #* WWTP 1-5 mgd<br />
") <strong>Industrial</strong> Processing<br />
Major Rivers<br />
") Metal Processing<br />
Highway<br />
")<br />
")<br />
Non-Metallic Processing<br />
Other<br />
!(<br />
")<br />
Ground <strong>Water</strong><br />
Surface <strong>Water</strong><br />
") Petroleum-Chemical Processing G <strong>Municipal</strong> <strong>Water</strong><br />
")<br />
")<br />
")<br />
Pulp and Paper Processing<br />
Sand and Gravel Washing<br />
Power Generation<br />
County<br />
<strong>Municipal</strong>ity<br />
#*<br />
Mississippi<br />
US Hwy 61<br />
G<br />
! !<br />
! !!<br />
#*<br />
Eagles Point WWTP<br />
Hasting Tr<br />
¯<br />
145th St E<br />
0 5Miles<br />
G<br />
G<br />
Sources: Minnesota DNR <strong>Water</strong> Appropriation Permit Program, 2004 (Withdrawls greater than 1 mgy or 10,000 gpd)<br />
Metropolitan Council <strong>Industrial</strong> Dischargers Permit Program, 2005<br />
!(<br />
0.00 - 0.50 mgd<br />
!( 0.51 - 1.50 mgd<br />
!( 1.51 - 5.00 mgd<br />
!( 5.01 - 10.00 mgd<br />
10.01 - 25.00 mgd !(<br />
25.01 - 505.00 mgd !(
Section 3<br />
Inventory of Major WWTPs and Potential <strong>Industrial</strong> Reuse Demands<br />
Craddock Consulting Engineers 3-49<br />
In Association with CDM & James Crook<br />
WWReuseTM1_Sec 3_final.doc<br />
As described previously in the Lower Mississippi River <strong>Water</strong>shed Inventory section,<br />
Flint Hills Resources is one of the high water demand industries in the watershed,<br />
withdrawing nearly 6 mgd in 2004, and previous discussions with Met Council on<br />
wastewater reuse opportunities have occurred. The industry with the next largest<br />
water use near Rosemount WWTP is Aggregate Industries, with a demand of 1.1<br />
mgd.<br />
The Eagles Point WWTP, which was expanded to 10 mgd in 2003, is situated near a<br />
3M chemical facility which uses most of the 2.8 mgd ground water supply <strong>for</strong><br />
industrial process cooling (once-through). Figure 3.25 shows the well field <strong>for</strong> 3M<br />
within the 1-mile radius and the other industries in the area. The other industries<br />
within a 5-mile radius of the plant used 1.13 mgd in 2004. Over 1 mgd of surface<br />
water was used by Aggregate Industries. Table 3.23 lists the industries.<br />
Table 3.23. Eagles Point WWTP Industries Within a 5 Mile Radius<br />
DNR <strong>Water</strong> Industry MCES Business<br />
Industry Name<br />
Permit Source* Category - DNR<br />
<strong>Industrial</strong> Process<br />
Cooling Once<br />
Category<br />
3M Company** x G Through<br />
Advance Corp #1258 M Metal Processing<br />
Sand & Gravel<br />
Metal Products<br />
Aggregate Industries - NCR Inc x S Washing<br />
Non-Metallic<br />
CF Industries x G Processing<br />
HD Hudson Mfg Co M Metal Processing Metal Products<br />
LSP-Cottage Grove LP** x G Power Generation<br />
Spectro Alloys Corp x G Metal Processing<br />
* M: <strong>Municipal</strong>; S: Surface <strong>Water</strong>.; G: Ground <strong>Water</strong><br />
** Industry located with 1 mile of the WWTP<br />
The Hastings WWTP has several industries within a 5-mile radius, as shown on<br />
Figure 3.26. There is a 0.05 mgd industrial water demand within 1 mile of the plant,<br />
<strong>for</strong> the facilities listed in Table 3.24. In a 5-mile zone, there are agricultural processing<br />
industries with a combined demand of 0.04 mgd and sand and gravel washing<br />
operations that rely primarily on surface water supplies.<br />
The Empire WWTP was expanded from 9 mgd to 24 mgd and will have a new<br />
discharge to the Mississippi River in the vicinity of the one currently used by the<br />
Rosemount WWTP. Figure 3.27 identifies the industries near the plant and Table 3.25<br />
lists those within a 5-mile radius. The outfall <strong>for</strong> the Empire WWTP to the Mississippi<br />
River is also shown on the figure. The list of industries in Table 3.25 is restricted to the<br />
radius around the plant, but could be broadened to include industries along the<br />
outfall, which would include those in the Rosemount WWTP proximity. The industry<br />
with the largest water demand near the Empire WWTP is Marigold Foods, which uses<br />
0.32 mgd of ground water supplied by its own well field. Another Food Product<br />
industry, Kemps, has a demand of 0.25 mgd. The other industries in the area have a<br />
combined demand of 0.42 mgd.
Section 3<br />
Inventory of Major WWTPs and Potential <strong>Industrial</strong> Reuse Demands<br />
Table 3.24. Hasting WWTP Industries Within a 5 Mile Radius<br />
DNR<br />
Permit<br />
<strong>Water</strong><br />
Source*<br />
Industry Category -<br />
DNR<br />
MCES Business<br />
Category<br />
Industry Name<br />
3M Company x G<br />
<strong>Industrial</strong> Process Cooling<br />
Once Through<br />
Aggregate Industries - NCR Inc x S Sand & Gravel Washing<br />
Barton Sand & Gravel x S Sand & Gravel Washing<br />
Con Agra Flour Milling Co x G Agricultural Processing<br />
Hastings Coop Creamery M Agricultural Processing Food Products<br />
H D Hudson Mfg Co** M Metal Processing Metal Products<br />
Intek Plastics Inc** M Non-Metallic Processing Chemical Products<br />
LSP-Cottage Grove LP x G Power Generation<br />
Intek Plastics Inc** M Non-Metallic Processing Chemical Products<br />
* M: <strong>Municipal</strong>; G: Ground <strong>Water</strong>; S: Surface <strong>Water</strong>.<br />
** Industry located with 1 mile of the WWTP.<br />
Table 3.25. Empire WWTP Industries Within a 5 Mile Radius<br />
DNR <strong>Water</strong> Industry Category - MCES Business<br />
Industry Name<br />
Permit Source*<br />
DNR<br />
Non-Metallic<br />
Processing; Sand &<br />
Category<br />
Aggregate Industries - NCR Inc x G; S Gravel Washing<br />
Cannon Equipment M Metal Processing<br />
Sand & Gravel<br />
Metal Products<br />
Cemstone Products x G Washing<br />
J I T Powder Coating M Metal Processing Metal Products<br />
Kemps LLC M&G Agricultural Processing Food Products<br />
Marigold Foods Inc x G Agricultural Processing<br />
Non-Metallic<br />
NRG Processing Solutions LLC x G Processing<br />
Per<strong>for</strong>mance <strong>Industrial</strong> Coating M Metal Processing Metal Products<br />
Valmont/Lexington M Metal Processing Metal Products<br />
* M: <strong>Municipal</strong>; G: Ground <strong>Water</strong>; M & G: <strong>Municipal</strong> and Ground <strong>Water</strong>: S: Surface<br />
<strong>Water</strong>.<br />
St. Croix River <strong>Water</strong>shed WWTP<br />
The only WWTP with a capacity greater than 1 mgd in the St. Croix River watershed,<br />
resident to the seven county metro area, is the Met Council St. Croix Valley WWTP.<br />
As shown on Figure 3.28, there are a few industries within 5 miles of this 5.8 mgd<br />
facility. Table 3.26 lists the four industries. As discussed under the <strong>Water</strong>shed<br />
Inventory subsection, the largest demand in the watershed is <strong>for</strong> cooling water <strong>for</strong> the<br />
Xcel Energy steam power plant. The Andersen Corporation has the next highest<br />
demand, using 0.5 mgd of nonpotable supply and 0.5 mgd of municipal supply <strong>for</strong><br />
the needs at their facility. The other industries have a combined demand of 0.025<br />
mgd.<br />
3-50 Craddock Consulting Engineers<br />
In Association with CDM & James Crook<br />
WWReuseTM1_Sec 3_final.doc
G<br />
!<br />
! ! #*<br />
"<br />
!<br />
!<br />
G<br />
! !!!<br />
G<br />
"<br />
Courthouse Blvd<br />
Rosemount WWTP<br />
Figure 3.25. Eagles Point WWTP -<br />
Industries within 1 and 5 mile Radii<br />
US Hwy 61<br />
US Hwy 61<br />
G<br />
Hastings Tr Hasting Tr<br />
!<br />
! !<br />
#*<br />
!!<br />
Eagles Point WWTP<br />
145th St E<br />
") Agricultural Processing<br />
WWTP >=5 mgd<br />
") <strong>Industrial</strong> Process Cooling #* WWTP 1-5 mgd<br />
") <strong>Industrial</strong> Processing<br />
Major Rivers<br />
") Metal Processing<br />
Highway<br />
")<br />
")<br />
Non-Metallic Processing<br />
Other<br />
!(<br />
")<br />
Ground <strong>Water</strong><br />
Surface <strong>Water</strong><br />
") Petroleum-Chemical Processing G <strong>Municipal</strong> <strong>Water</strong><br />
")<br />
")<br />
")<br />
Pulp and Paper Processing<br />
Sand and Gravel Washing<br />
Power Generation<br />
County<br />
<strong>Municipal</strong>ity<br />
#*<br />
Manning Ave S<br />
Mississippi<br />
G<br />
Vermillion St<br />
#*<br />
Hastings WWTP<br />
G<br />
!<br />
GG<br />
Point Douglas Dr S<br />
Le Duc Dr<br />
G<br />
"<br />
0 5 Miles<br />
G<br />
G<br />
Sources: Minnesota DNR <strong>Water</strong> Appropriation Permit Program, 2004 (Withdrawls greater than 1 mgy or 10,000 gpd)<br />
Metropolitan Council <strong>Industrial</strong> Dischargers Permit Program, 2005<br />
!(<br />
"<br />
¯<br />
0.00 - 0.50 mgd<br />
!( 0.51 - 1.50 mgd<br />
!( 1.51 - 5.00 mgd<br />
!( 5.01 - 10.00 mgd<br />
10.01 - 25.00 mgd !(<br />
25.01 - 505.00 mgd !(
G<br />
Figure 3.26. Hastings WWTP -<br />
Industries within 1 and 5 mile Radii<br />
US Hwy 61<br />
!<br />
! !!<br />
#*<br />
! !<br />
Cottage Grove<br />
145th St E<br />
Manning Ave S<br />
G<br />
Vermillion St<br />
Lillehei Ave<br />
#*<br />
Hastings WWTP<br />
G<br />
!<br />
GG<br />
Point Douglas Dr S<br />
Le Duc Dr<br />
G<br />
"<br />
"<br />
") Agricultural Processing<br />
WWTP >=5 mgd<br />
") <strong>Industrial</strong> Process Cooling #* WWTP 1-5 mgd<br />
") <strong>Industrial</strong> Processing<br />
Major Rivers<br />
") Metal Processing<br />
Highway<br />
")<br />
")<br />
Non-Metallic Processing<br />
Other<br />
!(<br />
")<br />
Ground <strong>Water</strong><br />
Surface <strong>Water</strong><br />
") Petroleum-Chemical Processing G <strong>Municipal</strong> <strong>Water</strong><br />
")<br />
")<br />
")<br />
Pulp and Paper Processing<br />
Sand and Gravel Washing<br />
Power Generation<br />
County<br />
<strong>Municipal</strong>ity<br />
#*<br />
Red Wing Blvd<br />
Mississippi<br />
St. Croix<br />
¯<br />
0 5Miles<br />
G<br />
G<br />
Sources: Minnesota DNR <strong>Water</strong> Appropriation Permit Program, 2004 (Withdrawls greater than 1 mgy or 10,000 gpd)<br />
Metropolitan Council <strong>Industrial</strong> Dischargers Permit Program, 2005<br />
!(<br />
0.00 - 0.50 mgd<br />
!( 0.51 - 1.50 mgd<br />
!( 1.51 - 5.00 mgd<br />
!( 5.01 - 10.00 mgd<br />
10.01 - 25.00 mgd !(<br />
25.01 - 505.00 mgd !(
G<br />
!<br />
G<br />
!<br />
Vermillion River<br />
Figure 3.27. Empire WWTP -<br />
Industries within 1 and 5 mile Radii<br />
G<br />
" !<br />
!<br />
G!<br />
Chippendale Ave W<br />
Robert Tr S<br />
Ash St<br />
G<br />
G<br />
#<br />
!<br />
Empire Outfall<br />
(Construction Completed 2007)<br />
Empire WWTP<br />
") Agricultural Processing<br />
WWTP >=5 mgd<br />
") <strong>Industrial</strong> Process Cooling #* WWTP 1-5 mgd<br />
") <strong>Industrial</strong> Processing<br />
Major Rivers<br />
") Metal Processing<br />
Highway<br />
")<br />
")<br />
Non-Metallic Processing<br />
Other<br />
!(<br />
")<br />
Ground <strong>Water</strong><br />
Surface <strong>Water</strong><br />
") Petroleum-Chemical Processing G <strong>Municipal</strong> <strong>Water</strong><br />
")<br />
")<br />
")<br />
Pulp and Paper Processing<br />
Sand and Gravel Washing<br />
Power Generation<br />
County<br />
<strong>Municipal</strong>ity<br />
#*<br />
#<br />
¯<br />
Rosemount WWTP<br />
G<br />
US Hwy 52<br />
220th St E Hampton Ave<br />
Coates Blvd<br />
0 5Miles<br />
G<br />
G<br />
Sources: Minnesota DNR <strong>Water</strong> Appropriation Permit Program, 2004 (Withdrawls greater than 1 mgy or 10,000 gpd)<br />
Metropolitan Council <strong>Industrial</strong> Dischargers Permit Program, 2005<br />
!(<br />
0.00 - 0.50 mgd<br />
!( 0.51 - 1.50 mgd<br />
!( 1.51 - 5.00 mgd<br />
!( 5.01 - 10.00 mgd<br />
10.01 - 25.00 mgd !(<br />
25.01 - 505.00 mgd !(<br />
Emery Ave
State Hwy 36<br />
!<br />
Figure 3.28. St. Croix Valley WWTP -<br />
Industries within 1 and 5 mile Radii<br />
I-94<br />
Dellwood Rd N<br />
Stillwater Blvd N<br />
G G<br />
State Hwy 36<br />
!<br />
N Main St<br />
SMain St<br />
#<br />
Saint Croix Tr N<br />
"<br />
St. Croix Valley WWTP<br />
I-94<br />
St. Croix<br />
") Agricultural Processing<br />
WWTP >=5 mgd<br />
") <strong>Industrial</strong> Process Cooling #* WWTP 1-5 mgd<br />
") <strong>Industrial</strong> Processing<br />
Major Rivers<br />
") Metal Processing<br />
Highway<br />
")<br />
")<br />
Non-Metallic Processing<br />
Other<br />
!(<br />
")<br />
Ground <strong>Water</strong><br />
Surface <strong>Water</strong><br />
") Petroleum-Chemical Processing G <strong>Municipal</strong> <strong>Water</strong><br />
")<br />
")<br />
")<br />
Pulp and Paper Processing<br />
Sand and Gravel Washing<br />
Power Generation<br />
County<br />
<strong>Municipal</strong>ity<br />
#*<br />
!!<br />
G<br />
Minnesota St S<br />
!<br />
¯<br />
0 5Miles<br />
G<br />
G<br />
Sources: Minnesota DNR <strong>Water</strong> Appropriation Permit Program, 2004 (Withdrawls greater than 1 mgy or 10,000 gpd)<br />
Metropolitan Council <strong>Industrial</strong> Dischargers Permit Program, 2005<br />
!(<br />
0.00 - 0.50 mgd<br />
!( 0.51 - 1.50 mgd<br />
!( 1.51 - 5.00 mgd<br />
!( 5.01 - 10.00 mgd<br />
10.01 - 25.00 mgd !(<br />
25.01 - 505.00 mgd !(
Section 3<br />
Inventory of Major WWTPs and Potential <strong>Industrial</strong> Reuse Demands<br />
Craddock Consulting Engineers 3-51<br />
In Association with CDM & James Crook<br />
WWReuseTM1_Sec 3_final.doc<br />
Table 3.26. St Croix Valley WWTP Industries Within a 5 Mile Radius<br />
DNR <strong>Water</strong> Industry Category - MCES Business<br />
Industry Name<br />
Permit Source*<br />
DNR<br />
Category<br />
Andersen Corporation** x M&G Non-Metallic Processing Building Materials<br />
DiaSorin Inc** M Non-Metallic Processing Medical Products<br />
NSP CO DBA Xcel Energy x S<br />
Steam Power - Other<br />
Than Cooling<br />
Sterling <strong>Water</strong> Inc dba Culliga M Other Other<br />
* M: <strong>Municipal</strong>; G: Ground <strong>Water</strong>; M & G: <strong>Municipal</strong> and Ground <strong>Water</strong>: S: Surface <strong>Water</strong>.<br />
** Listed under Non-Metallic Processing <strong>for</strong> the industry code of the DNR database.<br />
3.4 Inventory Summary<br />
Ground <strong>Water</strong> Supply<br />
The availability of higher quality ground water, typically sought first <strong>for</strong> municipal and<br />
industrial purposes, is a key factor in planning <strong>for</strong> growth in most of Minnesota. The<br />
summary of watershed inventories presented in Table 3.27 shows there are several<br />
areas of the state with limited ground water supplies. These areas are in the Des Moines<br />
River and Missouri River watersheds, in the southwest part of the state, northwestern<br />
Minnesota in parts of the Red River of the North watershed, and in the Rainy River and<br />
Western Lake Superior watersheds, in north central and northeastern Minnesota.<br />
There are also community-specific water supply limitations in quality and quantity,<br />
as seen in the southwest and northwest metro areas, that are restricting withdrawals<br />
from certain aquifers. Ground water contamination is found throughout the state and<br />
certain aquifer characteristics make some aquifers a less reliable supply, as in the karst<br />
area of the Lower Mississippi River watershed. In general, the water quality of an area<br />
and susceptibility to contamination must be assessed on a site specific basis and is not<br />
a good indicator of regional water supply limitations.<br />
Supply vs. Demand<br />
The comparison of historic ground water use by industries and WWTP effluent<br />
discharge flows indicates that each watershed currently processes enough wastewater<br />
to supply these industrial needs, but as the spatial inventories demonstrated, the<br />
industries are not usually in proximity to WWTPs. The annual WWTP (greater than 1<br />
mgd design capacity) discharges totaled 425 mgd, while total industrial water demand<br />
was 445 mgd (excludes power generation industry) and industrial ground water<br />
demand totaled 60 mgd.<br />
The statewide assessment of industrial demand per<strong>for</strong>med under this project includes<br />
only major users that have their own permitted water supply, based on a compilation<br />
of the DNR Appropriations Permit database. There are also industries that use<br />
significant quantities of water provided by a municipal water system and these<br />
industries are not captured in the inventory. The metro area analysis included<br />
industries that use a municipal (potable) water supply (only or in combination with a<br />
DNR permitted supply) and provided a more detailed categorization of industry types,<br />
based on a compilation of the Met Council’s <strong>Industrial</strong> Discharger (<strong>Use</strong>r) database.
Section 3<br />
Inventory of Major WWTPs and Potential Reuse Demands<br />
Table 3.27. <strong>Industrial</strong> <strong>Water</strong> Reuse Inventory Summary by <strong>Water</strong>shed<br />
<strong>Water</strong>shed<br />
Ground<br />
<strong>Water</strong><br />
Surface<br />
<strong>Water</strong><br />
Total<br />
Total<br />
Without<br />
Power<br />
Facilities*<br />
Larger<br />
WWTP<br />
Capacity<br />
(WWTPs<br />
> 1 mgd)<br />
Smaller<br />
WWTP<br />
Capacity<br />
(WWTPs<br />
< 1 mgd)<br />
Larger<br />
WWTP<br />
Discharge<br />
Flow,<br />
2005<br />
No. of<br />
Industry<br />
Categories<br />
with <strong>Water</strong><br />
Permits<br />
Ground<br />
<strong>Water</strong><br />
Availability<br />
3-52 Craddock Consulting Engineers<br />
In Association with CDM & James Crook<br />
WWReuseTM1_Sec 3_final.doc<br />
Ground <strong>Water</strong><br />
Contamination<br />
Susceptibility<br />
2004 <strong>Industrial</strong> <strong>Water</strong> <strong>Use</strong>, mgd mgd mgd mgd No. =Favors <strong>Recycling</strong><br />
Cedar River 4.1 0.1 4.1 4.1 26.9 2.6 9.7 4 No Factor No Factor<br />
Des Moines River 0.56 0.16 0.7 0.7 5.8 3.1 3.1 2 No Factor<br />
Lower Mississippi<br />
River 13.3 578.8 592.1 14.9 77.3 15.8 41.0 10 No Factor <br />
Minnesota River 17.3 327.7 345.0 19.0 123.5 22.4 73.4 10 No Factor Potential Factor<br />
Mississippi River-<br />
Headwaters 21.5 939.6 961.1 51.3 337.4 31.5 233.6 15 No Factor No Factor<br />
Missouri River 0 0.1 0.1 0.1 1.5 2.0 0.7 1 No Factor<br />
Rainy River
Section 3<br />
Inventory of Major WWTPs and Potential <strong>Industrial</strong> Reuse Demands<br />
Craddock Consulting Engineers 3-53<br />
In Association with CDM & James Crook<br />
WWReuseTM1_Sec 3_final.doc<br />
The Met Council database provided a single data source <strong>for</strong> a regional inventory of<br />
industries and their water demand. A more accurate method to identify potential<br />
industries <strong>for</strong> a specific WWTP is the analysis of water billing records, which typically<br />
provide enough detail to also assess any industrial seasonal water demands.<br />
While the inventories per<strong>for</strong>med on a state and watershed basis <strong>for</strong> this study do not<br />
include all potential industrial water users, they do provide an indication of the types<br />
of industries in the area and the types of industries that may be attracted to the area. If<br />
it is assumed that the degree of diversity of industries in the watersheds does not<br />
change (number of industry categories represented as listed in Table 3.27), then one<br />
would expect to see a similar diversity in the future. Diversity of industries is an<br />
indicator of areas that may be more advantageous <strong>for</strong> wastewater reuse. Given the<br />
capital and O&M costs associated with supplying reclaimed water, and that costs per<br />
gallon supplied typically decrease with increased supply, municipalities in areas with<br />
multiple industrial customers will be more likely to invest in facilities <strong>for</strong> wastewater<br />
reuse. If some industries have seasonal or weekly production schedules, the<br />
fluctuations can be dampened by having a more diverse set of customers.<br />
As indicated in Table 3.27, the watersheds with the most diverse (there<strong>for</strong>e, potential)<br />
industrial reuse customers are the larger watersheds that have larger population<br />
centers. The diversity criterion is only an indicator and has limitations with the data<br />
set used in this study. Smaller communities may have other industries that are not<br />
captured by the DNR database.<br />
Areas with industries that have the highest ground water use are possibly better<br />
candidates <strong>for</strong> water reuse, particularly if there are local supply issues. From Table<br />
3.27, the watersheds with the greatest demand <strong>for</strong> ground water by major industries<br />
are also those with the greatest land area: Mississippi River-Headwaters, Minnesota<br />
River and Lower Mississippi River. These watersheds also have the largest reclaimed<br />
water supply. While these watersheds do not have regional water supply issues like<br />
those in the southwest and northeast of Minnesota, local issues and the proximity of a<br />
diversity of industries may provide a community-specific fit <strong>for</strong> use of reclaimed<br />
water by industries.<br />
The other criterion used to assess areas that may favor water reuse by industries, was<br />
the WWTP location and capacity. The more industries closer to the plant, the more<br />
favorable a customer they are <strong>for</strong> reclaimed water. Capacity can be an indicator in its<br />
comparison to the current plant flow rates. Plants approaching capacity may be<br />
planning <strong>for</strong> expansion and any treatment modifications could roll in requirements<br />
<strong>for</strong> reclaimed water. Conversely, plants with excess capacity and limited growth<br />
potential in the area, may attract industry <strong>for</strong> its treatment capacity, and if supply is<br />
an issue, water reuse options could be explored. This criteria is not applicable on a<br />
broad watershed basis. However, specific WWTPs are noted in the watershed<br />
discussion on factors influencing potential <strong>for</strong> industrial reuse.
Section 3<br />
Inventory of Major WWTPs and Potential <strong>Industrial</strong> Reuse Demands<br />
As discussed throughout this technical memorandum, the factors that promote and<br />
result in a water reuse application are very site specific. The inventory of industry<br />
water demand and WWTP supply has been evaluated with broad criteria in this<br />
document: ground water quality and quantity, pollutant discharge limitations <strong>for</strong><br />
receiving streams, industry diversity, available supply to meet demand, and the<br />
WWTP capacity and location. Under Task 2 of the project, the evaluation of<br />
wastewater reuse opportunities in Minnesota will expand to consider treatment<br />
requirements, new facility construction, operation and maintenance needs, costs, and<br />
the range of issues associated with implementation of facilities and practices to use<br />
treated, municipal <strong>for</strong> beneficial uses.<br />
3.5 References<br />
Minnesota Department of Natural Resources (MDNR), 2004. Minnesota <strong>Water</strong> Appropriations<br />
Permit Program. Data summarized through 2004 were obtained from the MDNR website in<br />
March 2006. (This Technical Memorandum uses the 2004 annual volume reported to DNR,<br />
presented as the average annual water use in million gallons per day (mgd)). The Permit<br />
In<strong>for</strong>mation Report (MS Excel) was created 6/23/2005 and the ArcView shape files were<br />
created 12/19/2005.<br />
Minnesota Department of Natural Resources (MDNR), 2005. Where is Ground <strong>Water</strong> and Is it<br />
Available <strong>for</strong> <strong>Use</strong>? MDNR Fact Sheet on Ground-<strong>Water</strong> Sustainability, 2 pages.<br />
Minnesota Pollution Control Agency (MPCA), 2005. Minnesota Discharge Monitoring Report<br />
Data Summary. Data summarized <strong>for</strong> dischargers in 2003-2005 were obtained via CD from the<br />
MPCA in April 2006. (This Technical Memorandum uses the 2005 annual discharge volume<br />
reported to MPCA, presented as the average annual water discharged in million gallons per<br />
day (mgd)). The ArcView shape files were obtained from the MPCA website download link<br />
“MPCA <strong>Water</strong> Quality Monitoring Stations” at<br />
http://www.pca.state.mn.us/data/eda<strong>Water</strong>/index.cfm.<br />
Minnesota Pollution Control Agency (MPCA), 1995. Regional Ground <strong>Water</strong> Profiles.<br />
Developed by the Interagency Ground <strong>Water</strong> Coordination Group. Available at:<br />
http://www.pca.state.mn.us/water/gwprofiles.html.<br />
Minnesota Pollution Control Agency (MPCA), 1989. Statewide Evaluation of Ground <strong>Water</strong><br />
Contamination Susceptibility. GIS files <strong>for</strong> map updated in 2005: metadata not complete <strong>for</strong><br />
this publication.<br />
Metropolitan Council, 2005. Metropolitan Council <strong>Industrial</strong> Dischargers Permit Program.<br />
Data summarized <strong>for</strong> dischargers to the Metropolitan Council sewer system, under the<br />
agency’s Pretreatment Program, were obtained in May 2006. (This Technical Memorandum<br />
uses the 2005 annual volume of incoming water reported to Metropolitan Council, presented<br />
as the average annual water demand in million gallons per day (mgd)). The ArcView shape<br />
files were obtained from the Metropolitan Council website (2002) and updates provided by<br />
Metropolitan Council staff (May 2006).<br />
3-54 Craddock Consulting Engineers<br />
In Association with CDM & James Crook<br />
TM1-Sec 3_0707.doc
Craddock Consulting Engineers<br />
In Association with CDM & James Crook<br />
Appendix A<br />
DNR Appropriations Permit Data<br />
Analysis Documentation
Craddock Consulting Engineers<br />
In Association with CDM & James Crook
<strong>Water</strong> <strong>Use</strong> Code Categories<br />
Minnesota Department of Natural Resources <strong>Water</strong> Appropriations Permit Program<br />
WATERWORKS<br />
211 <strong>Municipal</strong><br />
212 Private waterworks<br />
(trailer courts, small housing units)<br />
213 Commercial and Institutional<br />
(business, industry, hospital)<br />
214 Cooperative waterworks<br />
215 Fire protection<br />
216 Campgrounds, waysides, highway rest areas<br />
217 Rural <strong>Water</strong> Districts<br />
219 <strong>Water</strong>works<br />
POWER GENERATION<br />
221 Hydropower<br />
222 Steam power cooling-once through<br />
223 Steam power cooling-wet tower<br />
224 Steam power cooling-ponds<br />
225 Steam power other than cooling<br />
226 Nuclear power plant<br />
229 Power generation<br />
AIR CONDITIONING<br />
231 Commercial building A/C<br />
232 Institutions (school, hospital)<br />
233 Heat pumps<br />
234 Coolant pumps<br />
235 District heating<br />
239 Once-through heating or A/C<br />
238 Air conditioning<br />
INDUSTRIAL<br />
241 Agricultural processing (food & livestock)<br />
242 Pulp and paper processing<br />
243 Mine processing (not sand & gravel washing)<br />
244 Sand and gravel washing<br />
245 <strong>Industrial</strong> process cooling once-through<br />
246 Petroleum-chemical processing, ethanol<br />
247 Metal processing<br />
248 Non-metallic processing (rubber, plastic, glass)<br />
249 <strong>Industrial</strong> processing<br />
TEMPORARY<br />
251 Construction (non-dewatering)<br />
252 Construction (dewatering)<br />
253 Pipeline & tank testing<br />
254 Landscape watering<br />
255 Pollution containment<br />
256 <strong>Water</strong> level maintenance<br />
257 Livestock waste treatment<br />
258 Temporary ag irrigation<br />
259 Temporary<br />
Page 1
<strong>Water</strong> <strong>Use</strong> Code Categories<br />
Minnesota Department of Natural Resources <strong>Water</strong> Appropriations Permit Program<br />
WATER LEVEL MAINTENANCE<br />
261 Basin (lake) level<br />
262 Mine dewatering<br />
263 Quarry dewatering<br />
264 Sand/gravel pit dewatering<br />
265 Tile drainage and pumped sumps<br />
266 Dewatering<br />
269 <strong>Water</strong> level maintenance<br />
SPECIAL CATEGORIES<br />
271 Pollution containment<br />
272 Aquaculture (hatcheries, fisheries)<br />
273 Snow making<br />
274 Peat fire control<br />
275 Livestock watering<br />
276 Pipeline and tank testing<br />
277 Sewage treatment<br />
279 Special Categories<br />
NON-CROP IRRIGATION<br />
281 Golf course<br />
282 Cemetery<br />
283 Landscaping<br />
284 Sod farms<br />
285 Nursery<br />
286 Orchard<br />
289 Non-crop irrigation<br />
MAJOR CROP IRRIGATION<br />
290 Major crop irrigation<br />
296 Wild rice irrigation<br />
Page 2
Minnesota <strong>Water</strong> <strong>Use</strong> <strong>for</strong> All Categories, 2000-2004<br />
Source: DNR Appropriations Permit Data<br />
CATEGORY CATEGORY CODE Sum Of USE_2004 (MGY) Sum Of USE_2004 (MGD) Percentage of the Total <strong>Water</strong> <strong>Use</strong><br />
AIR CONDITIONING 1 2492.95 6.83 0.2<br />
INDUSTRIAL PROCESSING 2 161205.9 441.66 11.8<br />
MAJOR CROP IRRIGATION 3 73901.55 202.47 5.4<br />
NON-CROP IRRIGATION 4 9431.6 25.84 0.7<br />
POWER GENERATION 5 868251.05 2378.77 63.4<br />
SPECIAL CATEGORIES 6 12165.45 33.33 0.9<br />
TEMPORARY 7 1788.5 4.9 0.1<br />
WATER LEVEL MAINTENANCE 8 36562.05 100.17 2.7<br />
WATERWORKS 9 202888.9 555.86 14.8<br />
Total 3749.8<br />
CATEGORY CATEGORY CODE Sum Of USE_2003 (MGY) Sum Of USE_2003 (MGD) Percentage of the Total <strong>Water</strong> <strong>Use</strong><br />
AIR CONDITIONING 1 2638.95 7.23 0.2<br />
INDUSTRIAL PROCESSING 2 171874.85 470.89 12.6<br />
MAJOR CROP IRRIGATION 3 93600.6 256.44 6.8<br />
NON-CROP IRRIGATION 4 10694.5 29.3 0.8<br />
POWER GENERATION 5 820720.75 2248.55 60.1<br />
SPECIAL CATEGORIES 6 12234.8 33.52 0.9<br />
TEMPORARY 7 719.05 1.97 0.1<br />
WATER LEVEL MAINTENANCE 8 36729.95 100.63 2.7<br />
WATERWORKS 9 217342.9 595.46 15.9<br />
Total 3744.0<br />
CATEGORY CATEGORY CODE Sum Of USE_2002 (MGY) Sum Of USE_2002 (MGD) Percentage of the Total <strong>Water</strong> <strong>Use</strong><br />
AIR CONDITIONING 1 3007.6 8.24 0.2<br />
INDUSTRIAL PROCESSING 2 160928.5 440.9 12.5<br />
MAJOR CROP IRRIGATION 3 62725.25 171.85 4.9<br />
NON-CROP IRRIGATION 4 6880.25 18.85 0.5<br />
POWER GENERATION 5 811836.65 2224.21 62.9<br />
SPECIAL CATEGORIES 6 13129.05 35.97 1.0<br />
TEMPORARY 7 25.55 0.07 0.0<br />
WATER LEVEL MAINTENANCE 8 37638.8 103.12 2.9<br />
WATERWORKS 9 194391.7 532.58 15.1<br />
Total 3535.8<br />
CATEGORY CATEGORY CODE Sum Of USE_2001 (MGY) Sum Of USE_2001 (MGD) Percentage of the Total <strong>Water</strong> <strong>Use</strong><br />
AIR CONDITIONING 1 3179.15 8.71 0.3<br />
INDUSTRIAL PROCESSING 2 109339.4 299.56 8.7<br />
MAJOR CROP IRRIGATION 3 85997.65 235.61 6.8<br />
NON-CROP IRRIGATION 4 9044.7 24.78 0.7<br />
POWER GENERATION 5 795634.3 2179.82 63.1<br />
SPECIAL CATEGORIES 6 13286 36.4 1.1<br />
TEMPORARY 7 0 0 0.0<br />
WATER LEVEL MAINTENANCE 8 38354.2 105.08 3.0<br />
WATERWORKS 9 206590 566 16.4<br />
Total 3456.0<br />
AppA-DNR<strong>Water</strong>_AllCateg_00-04.xls, wateruse_w_power(00-04) Page 1 7/6/2007
Minnesota <strong>Water</strong> <strong>Use</strong> <strong>for</strong> All Categories, 2000-2004<br />
Source: DNR Appropriations Permit Data<br />
CATEGORY CATEGORY CODE Sum Of USE_2000 (MGY) Sum Of USE_2000 (MGD) Percentage of the Total <strong>Water</strong> <strong>Use</strong><br />
AIR CONDITIONING 1 3066 8.4 0.2<br />
INDUSTRIAL PROCESSING 2 167556.9 459.06 12.6<br />
MAJOR CROP IRRIGATION 3 72207.95 197.83 5.4<br />
NON-CROP IRRIGATION 4 8519.1 23.34 0.6<br />
POWER GENERATION 5 829250.8 2271.92 62.4<br />
SPECIAL CATEGORIES 6 13245.85 36.29 1.0<br />
TEMPORARY 7 0 0 0.0<br />
WATER LEVEL MAINTENANCE 8 41737.75 114.35 3.1<br />
WATERWORKS 9 193464.6 530.04 14.6<br />
Total 3641.2<br />
SUM OF WATER USE (MGD)<br />
2500<br />
2000<br />
1500<br />
1000<br />
500<br />
0<br />
WATER USE BY CATEGORY IN 2000-2004<br />
1 2 3 4 5 6 7 8 9<br />
CATEGORY CODE<br />
2004 2003 2002<br />
2001 2000<br />
CATEGORIES:<br />
1 AIR CONDITIONING<br />
2 INDUSTRIAL PROCESSING<br />
3 MAJOR CROP IRRIGATION<br />
4 NON-CROP IRRIGATION<br />
5 POWER GENERATION<br />
6 SPECIAL CATEGORIES<br />
8 TEMPORARY<br />
9 WATER LEVEL<br />
MAINTENANCE<br />
AppA-DNR<strong>Water</strong>_AllCateg_00-04.xls, wateruse_w_power(00-04) Page 2 7/6/2007
<strong>Water</strong>works 15%<br />
<strong>Water</strong> Level<br />
Maintenance 2.7%<br />
Temporary 0.1%<br />
Special Categories 1%<br />
Minnesota <strong>Water</strong> <strong>Use</strong> in 2004<br />
Air Conditioning 0.2%<br />
Air Conditioning 0.2%<br />
<strong>Water</strong>works 15.9%<br />
<strong>Water</strong> Level<br />
Maintenance 2.7%<br />
Temporary 0.1%<br />
Special Categories 0.9%<br />
Minnesota <strong>Water</strong> <strong>Use</strong> in 2003<br />
Power Generation<br />
63%<br />
Power Generation<br />
60.1%<br />
Minnesota <strong>Water</strong> <strong>Use</strong> <strong>for</strong> All Categories, 2000-2004<br />
Source: DNR Appropriations Permit Data<br />
<strong>Industrial</strong> Processing 12%<br />
Major Crop Irrigation 5%<br />
Non Crop Irrigation 1%<br />
<strong>Industrial</strong> Processing 12.6%<br />
Major Crop Irrigation 6.8%<br />
Non Crop Irrigation 0.8%<br />
AppA-DNR<strong>Water</strong>_AllCateg_00-04.xls, wateruse_w_power(00-04) Page 3 7/6/2007
Air Conditioning 0.2%<br />
<strong>Water</strong>works 15.1%<br />
<strong>Water</strong> Level<br />
Maintenance 2.9%<br />
Special Categories 1.0%<br />
Minnesota <strong>Water</strong> <strong>Use</strong> in 2002<br />
Air Conditioning 0.3%<br />
<strong>Water</strong>works 16.4%<br />
<strong>Water</strong> Level<br />
Maintenance 3.0%<br />
Special Categories 1.1%<br />
Minnesota <strong>Water</strong> <strong>Use</strong> in 2001<br />
Power Generation<br />
62.9%<br />
Power Generation<br />
63.1%<br />
Minnesota <strong>Water</strong> <strong>Use</strong> <strong>for</strong> All Categories, 2000-2004<br />
Source: DNR Appropriations Permit Data<br />
<strong>Industrial</strong> Processing 12.5%<br />
Major Crop Irrigation 4.9%<br />
Non Crop Irrigation 0.5%<br />
<strong>Industrial</strong> Processing 8.7%<br />
Major Crop Irrigation 6.8%<br />
Non Crop Irrigation 0.7%<br />
AppA-DNR<strong>Water</strong>_AllCateg_00-04.xls, wateruse_w_power(00-04) Page 4 7/6/2007
<strong>Water</strong>works 14.6%<br />
<strong>Water</strong> Level<br />
Maintenance 3.1%<br />
Special Categories 1.0%<br />
Minnesota <strong>Water</strong> <strong>Use</strong> in 2000<br />
Air Conditioning 0.2%<br />
Power Generation<br />
62.4%<br />
Minnesota <strong>Water</strong> <strong>Use</strong> <strong>for</strong> All Categories, 2000-2004<br />
Source: DNR Appropriations Permit Data<br />
<strong>Industrial</strong> Processing 12.6%<br />
Major Crop Irrigation 5.4%<br />
Non Crop Irrigation 0.6%<br />
AppA-DNR<strong>Water</strong>_AllCateg_00-04.xls, wateruse_w_power(00-04) Page 5 7/6/2007
Minnesota <strong>Water</strong> <strong>Use</strong>, 2000-2004 - Statistics Without Power Generation<br />
Source: DNR Appropriations Permit Data<br />
CATEGORY CATEGORY CODE Sum Of USE_2004 (MGY) Sum Of USE_2004 (MGD) Percentage of the Total <strong>Water</strong> <strong>Use</strong><br />
AIR CONDITIONING 1 2492.95 6.83 0.5<br />
INDUSTRIAL PROCESSING 2 161205.9 441.66 32.2<br />
MAJOR CROP IRRIGATION 3 73901.55 202.47 14.8<br />
NON-CROP IRRIGATION 4 9431.6 25.84 1.9<br />
SPECIAL CATEGORIES 5 12165.45 33.33 2.4<br />
TEMPORARY 6 1788.5 4.9 0.4<br />
WATER LEVEL MAINTENANCE 7 36562.05 100.17 7.3<br />
WATERWORKS 8 202888.9 555.86 40.5<br />
POWER GENERATION 9 868251.05 2378.77<br />
Total Without Power Generation 1371.1<br />
CATEGORY CATEGORY CODE Sum Of USE_2003 (MGY) Sum Of USE_2003 (MGD) Percentage of the Total <strong>Water</strong> <strong>Use</strong><br />
AIR CONDITIONING 1 2638.95 7.23 0.5<br />
INDUSTRIAL PROCESSING 2 171874.85 470.89 31.5<br />
MAJOR CROP IRRIGATION 3 93600.6 256.44 17.1<br />
NON-CROP IRRIGATION 4 10694.5 29.3 2.0<br />
SPECIAL CATEGORIES 6 12234.8 33.52 2.2<br />
TEMPORARY 7 719.05 1.97 0.1<br />
WATER LEVEL MAINTENANCE 8 36729.95 100.63 6.7<br />
WATERWORKS 9 217342.9 595.46 39.8<br />
POWER GENERATION 5 820720.75 2248.55 150.4<br />
Total Without Power Generation 1495.4<br />
CATEGORY CATEGORY CODE Sum Of USE_2002 (MGY) Sum Of USE_2002 (MGD) Percentage of the Total <strong>Water</strong> <strong>Use</strong><br />
AIR CONDITIONING 1 3007.6 8.24 0.6<br />
INDUSTRIAL PROCESSING 2 160928.5 440.9 33.6<br />
MAJOR CROP IRRIGATION 3 62725.25 171.85 13.1<br />
NON-CROP IRRIGATION 4 6880.25 18.85 1.4<br />
SPECIAL CATEGORIES 6 13129.05 35.97 2.7<br />
TEMPORARY 7 25.55 0.07 0.01<br />
WATER LEVEL MAINTENANCE 8 37638.8 103.12 7.9<br />
WATERWORKS 9 194391.7 532.58 40.6<br />
POWER GENERATION 5 811836.65 2224.21 169.6<br />
Total Without Power Generation 1311.6<br />
CATEGORY CATEGORY CODE Sum Of USE_2001 (MGY) Sum Of USE_2001 (MGD) Percentage of the Total <strong>Water</strong> <strong>Use</strong><br />
AIR CONDITIONING 1 3179.15 8.71 0.7<br />
INDUSTRIAL PROCESSING 2 109339.4 299.56 23.5<br />
MAJOR CROP IRRIGATION 3 85997.65 235.61 18.5<br />
NON-CROP IRRIGATION 4 9044.7 24.78 1.9<br />
SPECIAL CATEGORIES 6 13286 36.4 2.9<br />
TEMPORARY 7 0 0 0.0<br />
WATER LEVEL MAINTENANCE 8 38354.2 105.08 8.2<br />
WATERWORKS 9 206590 566 44.4<br />
POWER GENERATION 5 795634.3 2179.82 170.8<br />
Total Without Power Generation 1276.1<br />
AppA-DNR<strong>Water</strong>_AllCateg_00-04.xls, wateruse_wo_power(00-04) Page 1 7/6/2007
Minnesota <strong>Water</strong> <strong>Use</strong>, 2000-2004 - Statistics Without Power Generation<br />
Source: DNR Appropriations Permit Data<br />
CATEGORY CATEGORY CODE Sum Of USE_2000 (MGY) Sum Of USE_2000 (MGD) Percentage of the Total <strong>Water</strong> <strong>Use</strong><br />
AIR CONDITIONING 1 3066 8.4 0.6<br />
INDUSTRIAL PROCESSING 2 167556.9 459.06 33.5<br />
MAJOR CROP IRRIGATION 3 72207.95 197.83 14.4<br />
NON-CROP IRRIGATION 4 8519.1 23.34 1.7<br />
SPECIAL CATEGORIES 6 13245.85 36.29 2.7<br />
TEMPORARY 7 0 0 0.0<br />
WATER LEVEL MAINTENANCE 8 41737.75 114.35 8.4<br />
WATERWORKS 9 193464.6 530.04 38.7<br />
POWER GENERATION 5 829250.8 2271.92 165.9<br />
Total Without Power Generation 1369.3<br />
SUM OF WATER USE (MGD)<br />
700<br />
600<br />
500<br />
400<br />
300<br />
200<br />
100<br />
0<br />
WATER USE BY CATEGORY IN 2000-2004 (Excluding Power Generation)<br />
1 2 3 4 5 6 7 8<br />
CATEGORY CODE<br />
2004<br />
2003<br />
2002<br />
2001<br />
2000<br />
CATEGORIES:<br />
1 AIR CONDITIONING<br />
2 INDUSTRIAL PROCESSING<br />
3 MAJOR CROP IRRIGATION<br />
4 NON-CROP IRRIGATION<br />
5 SPECIAL CATEGORIES<br />
6 TEMPORARY<br />
7 WATER LEVEL<br />
MAINTENANCE<br />
AppA-DNR<strong>Water</strong>_AllCateg_00-04.xls, wateruse_wo_power(00-04) Page 2 7/6/2007
Minnesota <strong>Water</strong> <strong>Use</strong> in 2004<br />
(without Power Generation)<br />
<strong>Water</strong>works 40.5%<br />
<strong>Water</strong> Level Maintenance 7.3%<br />
Minnesota <strong>Water</strong> <strong>Use</strong> in 2003<br />
(without Power Generation)<br />
<strong>Water</strong>works 39.8%<br />
<strong>Water</strong> Level Maintenance 6.7%<br />
Temporary 0.4%<br />
Temporary 0.1%<br />
Minnesota <strong>Water</strong> <strong>Use</strong>, 2000-2004 - Statistics Without Power Generation<br />
Source: DNR Appropriations Permit Data<br />
Air Conditioning 0.5%<br />
Non Crop Irrigation 1.9%<br />
Special Categories 2.4%<br />
Air Conditioning 0.5%<br />
Non Crop Irrigation 2.0%<br />
Special Categories 2.2%<br />
<strong>Industrial</strong> Processing 32%<br />
Major Crop Irrigation 15%<br />
<strong>Industrial</strong> Processing 31.5%<br />
Major Crop Irrigation 17.1%<br />
AppA-DNR<strong>Water</strong>_AllCateg_00-04.xls, wateruse_wo_power(00-04) Page 3 7/6/2007
Minnesota <strong>Water</strong> <strong>Use</strong> in 2002<br />
(without Power Generation)<br />
<strong>Water</strong>works 40.6%<br />
<strong>Water</strong> Level Maintenance 7.9%<br />
Minnesota <strong>Water</strong> <strong>Use</strong> in 2001<br />
(without Power Generation)<br />
<strong>Water</strong>works 44.4%<br />
<strong>Water</strong> Level Maintenance 8.2%<br />
Temporary 0.01%<br />
Minnesota <strong>Water</strong> <strong>Use</strong>, 2000-2004 - Statistics Without Power Generation<br />
Source: DNR Appropriations Permit Data<br />
Air Conditioning 0.6%<br />
Non Crop Irrigation 1.4%<br />
Special Categories 2.7%<br />
Air Conditioning 0.7%<br />
<strong>Industrial</strong> Processing 33.6%<br />
Major Crop Irrigation 13.1%<br />
<strong>Industrial</strong> Processing 23.5%<br />
Major Crop Irrigation 18.5%<br />
Non Crop Irrigation 1.9%<br />
Special Categories 2.7%<br />
AppA-DNR<strong>Water</strong>_AllCateg_00-04.xls, wateruse_wo_power(00-04) Page 4 7/6/2007
Minnesota <strong>Water</strong> <strong>Use</strong> in 2000<br />
(without Power Generation)<br />
<strong>Water</strong>works 38.7%<br />
<strong>Water</strong> Level Maintenance 8.4%<br />
Minnesota <strong>Water</strong> <strong>Use</strong>, 2000-2004 - Statistics Without Power Generation<br />
Source: DNR Appropriations Permit Data<br />
Air Conditioning 0.6%<br />
Non Crop Irrigation 1.7%<br />
Special Categories 2.7%<br />
<strong>Industrial</strong> Processing 33.5%<br />
Major Crop Irrigation 14.4%<br />
AppA-DNR<strong>Water</strong>_AllCateg_00-04.xls, wateruse_wo_power(00-04) Page 5 7/6/2007
Minnesota Power Generation Facilities <strong>Water</strong> <strong>Use</strong>, 2000-2004<br />
CATEGORY USE_CODE Sum Of USE_2004 (MGY) Sum Of USE_2004 (MGD) percentage of total<br />
Ground<br />
water<br />
(MGD)<br />
Surface<br />
water<br />
(MGD)<br />
Ground<br />
water<br />
(MGY)<br />
POWER GENERATION 221 43.8 0.1 0.0 0 0.12 0.0 43.8<br />
POWER GENERATION 222 430353.25 1179.1 49.6 0.3 1178.75 109.5 430243.8<br />
POWER GENERATION 223 7099.25 19.5 0.8 0.98 18.47 357.7 6741.6<br />
POWER GENERATION 225 119249.15 326.7 13.7 1.36 325.35 496.4 118752.8<br />
POWER GENERATION 226 311191.7 852.6 35.8 0.14 852.44 51.1 311140.6<br />
POWER GENERATION 229 313.9 0.9 0.0 0.85 0.01 310.3 3.7<br />
total 868207.25 2378.7 100.0 3.6 2375.0<br />
CATEGORY USE_CODE Sum Of USE_2003 (MGY) Sum Of USE_2003 (MGD) percentage of total<br />
Ground<br />
water<br />
(MGD)<br />
Surface<br />
water<br />
(MGD)<br />
Ground<br />
water<br />
(MGY)<br />
POWER GENERATION 221 47.45 0.1 0.0 0 0.13 0.0 47.5<br />
POWER GENERATION 222 402481.85 1102.7 49.0 0.43 1102.26 157.0 402324.9<br />
POWER GENERATION 223 7537.25 20.7 0.9 1.06 19.59 386.9 7150.4<br />
POWER GENERATION 225 101199.9 277.3 12.3 1.22 276.04 445.3 100754.6<br />
POWER GENERATION 226 309049.15 846.7 37.7 0.11 846.6 40.2 309009.0<br />
POWER GENERATION 229 405.15 1.1 0.0 1.1 0.01 401.5 3.7<br />
total 820673.3 2248.4<br />
CATEGORY USE_CODE Sum Of USE_2002 (MGY) Sum Of USE_2002 (MGD) percentage of total<br />
Ground<br />
water<br />
(MGD)<br />
Surface<br />
water<br />
(MGD)<br />
Ground<br />
water<br />
(MGY)<br />
POWER GENERATION 221 10.95 0.0 0.0 0 0.03 0.0 11.0<br />
POWER GENERATION 222 377691.05 1034.8 46.5 0.31 1034.46 113.2 377577.9<br />
POWER GENERATION 223 8037.3 22.0 1.0 0.92 21.1 335.8 7701.5<br />
POWER GENERATION 225 100192.5 274.5 12.3 1.17 273.33 427.1 99765.5<br />
POWER GENERATION 226 325463.2 891.7 40.1 0.11 891.57 40.2 325423.1<br />
POWER GENERATION 229 441.65 1.2 0.1 1.21 0 441.7 0.0<br />
total 811825.7 2224.2<br />
CATEGORY USE_CODE Sum Of USE_2001 (MGY) Sum Of USE_2001 (MGD) percentage of total<br />
Ground<br />
water<br />
(MGD)<br />
Surface<br />
water<br />
(MGD)<br />
Ground<br />
water<br />
(MGY)<br />
POWER GENERATION 221 0 0.0 0.0 0 0 0.0 0.0<br />
POWER GENERATION 222 375548.5 1028.9 47.2 0.33 1028.57 120.5 375428.1<br />
POWER GENERATION 223 7774.5 21.3 1.0 1.09 20.21 397.9 7376.7<br />
POWER GENERATION 225 98845.65 270.8 12.4 1.09 269.72 397.9 98447.8<br />
POWER GENERATION 226 313078.75 857.8 39.3 0.12 857.63 43.8 313035.0<br />
POWER GENERATION 229 386.9 1.1 0.0 1.05 0.01 383.3 3.7<br />
total 795634.3 2179.8<br />
CATEGORY USE_CODE Sum Of USE_2000 (MGY) Sum Of USE_2000 (MGD) percentage of total<br />
Ground<br />
water<br />
(MGD)<br />
Surface<br />
water<br />
(MGD)<br />
Ground<br />
water<br />
(MGY)<br />
POWER GENERATION 221 0 0.0 0.0 0 0 0.0 0.0<br />
POWER GENERATION 222 385578.7 1056.4 46.5 0.5 1055.88 182.5 385396.2<br />
POWER GENERATION 223 8365.8 22.9 1.0 1.41 21.51 514.7 7851.2<br />
POWER GENERATION 225 105981.4 290.4 12.8 1.03 289.33 376.0 105605.5<br />
POWER GENERATION 226 328927.05 901.2 39.7 0.11 901.06 40.2 328886.9<br />
POWER GENERATION 229 397.85 1.1 0.0 1.09 0 397.9 0.0<br />
total 829250.8 2271.9<br />
App A_<strong>Industrial</strong> water use_state_2000-2004.xls, Power Generation Summary<br />
Page 1 of 5<br />
Surface<br />
water<br />
(MGY)<br />
Surface<br />
water<br />
(MGY)<br />
Surface<br />
water<br />
(MGY)<br />
Surface<br />
water<br />
(MGY)<br />
Surface<br />
water<br />
(MGY)<br />
7/6/2007
<strong>Use</strong>Code by Year<br />
Minnesota Power Generation Facilities <strong>Water</strong> <strong>Use</strong>, 2000-2004<br />
Power Generation <strong>Use</strong>Code 222 Year Sum Of USE_2000 (MGY) Sum Of USE_2000 (MGD) percentage of total<br />
Ground<br />
water<br />
(MGD)<br />
Surface<br />
water<br />
(MGD)<br />
Ground<br />
water<br />
(MGY)<br />
Surface<br />
water<br />
(MGY)<br />
222 2004 430353.25 1179.1 49.6 0.3 1178.75 109.5 430243.8<br />
222 2003 402481.85 1102.7 49.0 0.43 1102.26 156.95 402324.9<br />
222 2002 377691.05 1034.8 46.5 0.31 1034.46 113.15 377577.9<br />
222 2001 375548.5 1028.9 47.2 0.33 1028.57 120.45 375428.1<br />
222 2000 385578.7 1056.4 46.5 0.5 1055.88 182.5 385396.2<br />
Power Generation <strong>Use</strong>Code 223 Year Sum Of USE_2000 (MGY) Sum Of USE_2000 (MGD) percentage of total<br />
Ground<br />
water<br />
(MGD)<br />
Surface<br />
water<br />
(MGD)<br />
Ground<br />
water<br />
(MGY)<br />
Surface<br />
water<br />
(MGY)<br />
223 2004 7099.25 19.45 0.8 0.98 18.47 357.7 6741.55<br />
223 2003 7537.25 20.65 0.9 1.06 19.59 386.9 7150.35<br />
223 2002 8037.3 22.02 1.0 0.92 21.1 335.8 7701.5<br />
223 2001 7774.5 21.3 1.0 1.09 20.21 397.85 7376.65<br />
223 2000 8365.8 22.92 1.0 1.41 21.51 514.65 7851.15<br />
Power Generation <strong>Use</strong>Code 225 Year Sum Of USE_2000 (MGY) Sum Of USE_2000 (MGD) percentage of total<br />
Ground<br />
water<br />
(MGD)<br />
Surface<br />
water<br />
(MGD)<br />
Ground<br />
water<br />
(MGY)<br />
Surface<br />
water<br />
(MGY)<br />
225 2004 119249.15 326.71 13.7 1.36 325.35 496.4 118752.8<br />
225 2003 101199.9 277.26 12.3 1.22 276.04 445.3 100754.6<br />
225 2002 100192.5 274.5 12.3 1.17 273.33 427.05 99765.45<br />
225 2001 98845.65 270.81 12.4 1.09 269.72 397.85 98447.8<br />
225 2000 105981.4 290.36 12.8 1.03 289.33 375.95 105605.5<br />
Power Generation <strong>Use</strong>Code 226 Year Sum Of USE_2000 (MGY) Sum Of USE_2000 (MGD) percentage of total<br />
Ground<br />
water<br />
(MGD)<br />
Surface<br />
water<br />
(MGD)<br />
Ground<br />
water<br />
(MGY)<br />
Surface<br />
water<br />
(MGY)<br />
226 2004 311191.7 852.58 35.8 0.14 852.44 51.1 311140.6<br />
226 2003 309049.15 846.71 37.7 0.11 846.6 40.15 309009<br />
226 2002 325463.2 891.68 40.1 0.11 891.57 40.15 325423.1<br />
226 2001 313078.75 857.75 39.3 0.12 857.63 43.8 313035<br />
226 2000 328927.05 901.17 39.7 0.11 901.06 40.15 328886.9<br />
Power Generation <strong>Use</strong>Code 229 Year Sum Of USE_2000 (MGY) Sum Of USE_2000 (MGD) percentage of total<br />
Ground<br />
water<br />
(MGD)<br />
Surface<br />
water<br />
(MGD)<br />
Ground<br />
water<br />
(MGY)<br />
Surface<br />
water<br />
(MGY)<br />
229 2004 313.9 0.86 0.0 0.85 0.01 310.25 3.65<br />
229 2003 405.15 1.11 0.0 1.1 0.01 401.5 3.65<br />
229 2002 441.65 1.21 0.1 1.21 0 441.65 0<br />
229 2001 386.9 1.06 0.0 1.05 0.01 383.25 3.65<br />
229 2000 397.85 1.09 0.0 1.09 0 397.85 0<br />
App A_<strong>Industrial</strong> water use_state_2000-2004.xls, Power Generation Summary<br />
Page 2 of 5<br />
7/6/2007
<strong>Water</strong> <strong>Use</strong> (MGD)<br />
<strong>Water</strong> <strong>Use</strong> (MGD)<br />
1400<br />
1200<br />
1000<br />
25<br />
20<br />
15<br />
10<br />
800<br />
600<br />
400<br />
200<br />
5<br />
0<br />
0<br />
Steam Power Cooling - Once through<br />
<strong>Water</strong> <strong>Use</strong> 2000-2004<br />
2004 2003 2002 2001 2000<br />
Year<br />
Steam Power Cooling - Wet Tower<br />
<strong>Water</strong> <strong>Use</strong> 2000-2004<br />
2004 2003 2002 2001 2000<br />
Year<br />
App A_<strong>Industrial</strong> water use_state_2000-2004.xls, Power Generation Summary<br />
Minnesota Power Generation Facilities <strong>Water</strong> <strong>Use</strong>, 2000-2004<br />
Surface <strong>Water</strong><br />
Ground <strong>Water</strong><br />
Surface <strong>Water</strong><br />
Ground <strong>Water</strong><br />
Page 3 of 5<br />
7/6/2007
<strong>Water</strong> <strong>Use</strong> (MGD)<br />
<strong>Water</strong> <strong>Use</strong> (MGD)<br />
350<br />
300<br />
250<br />
200<br />
150<br />
100<br />
50<br />
0<br />
1000<br />
900<br />
800<br />
700<br />
600<br />
500<br />
400<br />
300<br />
200<br />
100<br />
0<br />
Steam Power Other Than Cooling<br />
<strong>Water</strong> <strong>Use</strong> 2000-2004<br />
2004 2003 2002 2001 2000<br />
Year<br />
Nuclear Power Plant<br />
<strong>Water</strong> <strong>Use</strong> 2000-2004<br />
2004 2003 2002 2001 2000<br />
Year<br />
App A_<strong>Industrial</strong> water use_state_2000-2004.xls, Power Generation Summary<br />
Minnesota Power Generation Facilities <strong>Water</strong> <strong>Use</strong>, 2000-2004<br />
Surface <strong>Water</strong><br />
Ground <strong>Water</strong><br />
Surface <strong>Water</strong><br />
Ground <strong>Water</strong><br />
Page 4 of 5<br />
7/6/2007
<strong>Water</strong> <strong>Use</strong> (MGD)<br />
1.4<br />
1.2<br />
1<br />
0.8<br />
0.6<br />
0.4<br />
0.2<br />
0<br />
Power Generation<br />
<strong>Water</strong> <strong>Use</strong> 2000-2004<br />
2004 2003 2002 2001 2000<br />
Year<br />
App A_<strong>Industrial</strong> water use_state_2000-2004.xls, Power Generation Summary<br />
Minnesota Power Generation Facilities <strong>Water</strong> <strong>Use</strong>, 2000-2004<br />
Surface <strong>Water</strong><br />
Ground <strong>Water</strong><br />
Page 5 of 5<br />
7/6/2007
Minnesota <strong>Industrial</strong> Processing Facility <strong>Water</strong> <strong>Use</strong>, 2000-2004<br />
CATEGORY USE_CODE Sum Of USE_2004 (MGY) Sum Of USE_2004 (MGD) Percentage of total<br />
Ground<br />
water<br />
(MGD)<br />
Surface<br />
water<br />
(MGD)<br />
Ground<br />
water<br />
(MGY)<br />
INDUSTRIAL PROCESSING 241 9216.25 25.3 5.7 25.2 0.1 9183.4 32.9<br />
INDUSTRIAL PROCESSING 242 30149 82.6 18.7 2.3 80.3 835.9 29313.2<br />
INDUSTRIAL PROCESSING 243 108401.35 297.0 67.2 0.5 296.5 164.3 108237.1<br />
INDUSTRIAL PROCESSING 244 4113.55 11.3 2.6 3.8 7.5 1387.0 2726.6<br />
INDUSTRIAL PROCESSING 245 2314.1 6.3 1.4 5.8 0.5 2124.3 189.8<br />
INDUSTRIAL PROCESSING 246 4131.8 11.3 2.6 10.9 0.4 3974.9 157.0<br />
INDUSTRIAL PROCESSING 247 1412.55 3.9 0.9 3.9 0.0 1412.6 0.0<br />
INDUSTRIAL PROCESSING 248 1087.7 3.0 0.7 3.0 0.0 1087.7 0.0<br />
INDUSTRIAL PROCESSING 249 379.6 1.0 0.2 1.0 0.0 379.6 0.0<br />
total 161205.9 441.7 56.3 385.4 20549.5 140656.4<br />
CATEGORY USE_CODE Sum Of USE_2003 (MGY) Sum Of USE_2003 (MGD) Percentage of total<br />
Ground<br />
water<br />
(MGD)<br />
Surface<br />
water<br />
(MGD)<br />
Ground<br />
water<br />
(MGY)<br />
INDUSTRIAL PROCESSING 241 8665.1 23.7 5.0 23.56 0.18 8599.4 65.7<br />
INDUSTRIAL PROCESSING 242 29798.6 81.6 17.3 2.39 79.25 872.4 28926.3<br />
INDUSTRIAL PROCESSING 243 119665.25 327.9 69.6 0.39 327.46 142.4 119522.9<br />
INDUSTRIAL PROCESSING 244 3876.3 10.6 2.3 3.12 7.50 1138.8 2737.5<br />
INDUSTRIAL PROCESSING 245 2153.5 5.9 1.3 5.30 0.60 1934.5 219.0<br />
INDUSTRIAL PROCESSING 246 4657.4 12.8 2.7 12.05 0.71 4398.3 259.2<br />
INDUSTRIAL PROCESSING 247 1445.4 4.0 0.8 3.96 0.00 1445.4 0.0<br />
INDUSTRIAL PROCESSING 248 1233.7 3.4 0.7 3.38 0.00 1233.7 0.0<br />
INDUSTRIAL PROCESSING 249 379.6 1.0 0.2 1.04 0.00 379.6 0.0<br />
total 171874.85 470.9 55.2 415.7 20144.4 151730.5<br />
CATEGORY USE_CODE Sum Of USE_2002 (MGY) Sum Of USE_2002 (MGD) Percentage of total<br />
Ground<br />
water<br />
(MGD)<br />
Surface<br />
water<br />
(MGD)<br />
Ground<br />
water<br />
(MGY)<br />
INDUSTRIAL PROCESSING 241 8581.15 23.5 5.3 23.48 0.03 8570.2 11.0<br />
INDUSTRIAL PROCESSING 242 32036.05 87.8 19.9 2.83 84.94 1033.0 31003.1<br />
INDUSTRIAL PROCESSING 243 106711.4 292.4 66.3 0.27 292.09 98.6 106612.9<br />
INDUSTRIAL PROCESSING 244 3770.45 10.3 2.3 2.61 7.72 952.7 2817.8<br />
INDUSTRIAL PROCESSING 245 2204.6 6.0 1.4 5.59 0.45 2040.4 164.3<br />
INDUSTRIAL PROCESSING 246 4314.3 11.8 2.7 11.32 0.50 4131.8 182.5<br />
INDUSTRIAL PROCESSING 247 1438.1 3.9 0.9 3.94 0.00 1438.1 0.0<br />
INDUSTRIAL PROCESSING 248 1518.4 4.2 0.9 4.16 0.00 1518.4 0.0<br />
INDUSTRIAL PROCESSING 249 354.05 1.0 0.2 0.97 0.00 354.1 0.0<br />
total 160928.5 440.9 55.2 385.7 20137.1 140791.5<br />
CATEGORY USE_CODE Sum Of USE_2001 (MGY) Sum Of USE_2001 (MGD) Percentage of total<br />
Ground<br />
water<br />
(MGD)<br />
Surface<br />
water<br />
(MGD)<br />
Ground<br />
water<br />
(MGY)<br />
INDUSTRIAL PROCESSING 241 8566.55 23.5 7.8 23.46 0.01 8562.9 3.7<br />
INDUSTRIAL PROCESSING 242 32269.65 88.4 29.5 3.00 85.41 1095.0 31174.7<br />
INDUSTRIAL PROCESSING 243 54830.3 150.2 50.1 0.29 149.93 105.9 54724.5<br />
INDUSTRIAL PROCESSING 244 3489.4 9.6 3.2 2.92 6.64 1065.8 2423.6<br />
INDUSTRIAL PROCESSING 245 2394.4 6.6 2.2 6.02 0.54 2197.3 197.1<br />
INDUSTRIAL PROCESSING 246 4536.95 12.4 4.1 11.82 0.61 4314.3 222.7<br />
INDUSTRIAL PROCESSING 247 1394.3 3.8 1.3 3.82 0.00 1394.3 0.0<br />
INDUSTRIAL PROCESSING 248 1481.9 4.1 1.4 4.06 0.00 1481.9 0.0<br />
INDUSTRIAL PROCESSING 249 375.95 1.0 0.3 1.03 0.00 376.0 0.0<br />
total 109339.4 299.6 56.4 243.1 20593.3 88746.1<br />
App A_<strong>Industrial</strong> water use_state_2000-2004.xls. <strong>Industrial</strong> Processing Summary Page 1 of 8 7/6/2007<br />
Surface<br />
water<br />
(MGY)<br />
Surface<br />
water<br />
(MGY)<br />
Surface<br />
water<br />
(MGY)<br />
Surface<br />
water<br />
(MGY)
Minnesota <strong>Industrial</strong> Processing Facility <strong>Water</strong> <strong>Use</strong>, 2000-2004<br />
CATEGORY USE_CODE Sum Of USE_2000 (MGY) Sum Of USE_2000 (MGD) Percentage of total<br />
Ground<br />
water<br />
(MGD)<br />
Surface<br />
water<br />
(MGD)<br />
Ground<br />
water<br />
(MGY)<br />
INDUSTRIAL PROCESSING 241 8435.15 23.1 5.0 23.10 0.01 8431.5 3.7<br />
INDUSTRIAL PROCESSING 242 36007.25 98.7 21.5 2.87 95.78 1047.6 34959.7<br />
INDUSTRIAL PROCESSING 243 109295.6 299.4 65.2 0.30 299.14 109.5 109186.1<br />
INDUSTRIAL PROCESSING 244 3723 10.2 2.2 2.92 7.28 1065.8 2657.2<br />
INDUSTRIAL PROCESSING 245 2328.7 6.4 1.4 5.74 0.64 2095.1 233.6<br />
INDUSTRIAL PROCESSING 246 4343.5 11.9 2.6 11.34 0.56 4139.1 204.4<br />
INDUSTRIAL PROCESSING 247 1470.95 4.0 0.9 4.03 0.00 1471.0 0.0<br />
INDUSTRIAL PROCESSING 248 1529.35 4.2 0.9 4.19 0.00 1529.4 0.0<br />
INDUSTRIAL PROCESSING 249 423.4 1.2 0.3 1.16 0.00 423.4 0.0<br />
total 167556.9 459.1 55.7 403.4 20312.3 147244.7<br />
USE_CODE by YEAR<br />
Ground<br />
water<br />
(MGD)<br />
Surface<br />
water<br />
(MGD)<br />
Ground<br />
water<br />
(MGY)<br />
INDUSTRIAL PROCESSING<br />
USE_CODE Year Sum Of USE_2000 (MGY) Sum Of USE_2000 (MGD) Percentage of total<br />
241 2004 9216.25 25.25 5.7 25.16 0.09 9183.4 32.85<br />
241 2003 8665.1 23.74 5.0 23.56 0.18 8599.4 65.7<br />
241 2002 8581.15 23.51 5.3 23.48 0.03 8570.2 10.95<br />
241 2001 8566.55 23.47 7.8 23.46 0.01 8562.9 3.65<br />
241 2000 8435.15 23.11 5.0 23.1 0.01 8431.5 3.65<br />
Ground<br />
water<br />
(MGD)<br />
Surface<br />
water<br />
(MGD)<br />
Ground<br />
water<br />
(MGY)<br />
INDUSTRIAL PROCESSING<br />
USE_CODE Year Sum Of USE_2000 (MGY) Sum Of USE_2000 (MGD) Percentage of total<br />
242 2004 30149 82.6 18.70 2.29 80.31 835.85 29313.15<br />
242 2003 29798.6 81.64 17.34 2.39 79.25 872.35 28926.25<br />
242 2002 32036.05 87.77 19.91 2.83 84.94 1032.95 31003.1<br />
242 2001 32269.65 88.41 29.51 3 85.41 1095 31174.65<br />
242 2000 36007.25 98.65 21.49 2.87 95.78 1047.55 34959.7<br />
Ground<br />
water<br />
(MGD)<br />
Surface<br />
water<br />
(MGD)<br />
Ground<br />
water<br />
(MGY)<br />
INDUSTRIAL PROCESSING<br />
USE_CODE Year Sum Of USE_2000 (MGY) Sum Of USE_2000 (MGD) Percentage of total<br />
243 2004 108401.35 296.99 67.24 0.45 296.54 164.25 108237.1<br />
243 2003 119665.25 327.85 69.62 0.39 327.46 142.35 119522.9<br />
243 2002 106711.4 292.36 66.31 0.27 292.09 98.55 106612.85<br />
243 2001 54830.3 150.22 50.15 0.29 149.93 105.85 54724.45<br />
243 2000 109295.6 299.44 65.23 0.3 299.14 109.5 109186.1<br />
Ground<br />
water<br />
(MGD)<br />
Surface<br />
water<br />
(MGD)<br />
Ground<br />
water<br />
(MGY)<br />
INDUSTRIAL PROCESSING<br />
USE_CODE Year Sum Of USE_2000 (MGY) Sum Of USE_2000 (MGD) Percentage of total<br />
244 2004 4113.55 11.27 2.55 3.8 7.47 1387 2726.55<br />
244 2003 3876.3 10.62 2.26 3.12 7.5 1138.8 2737.5<br />
244 2002 3770.45 10.33 2.34 2.61 7.72 952.65 2817.8<br />
244 2001 3489.4 9.56 3.19 2.92 6.64 1065.8 2423.6<br />
244 2000 3723 10.2 2.22 2.92 7.28 1065.8 2657.2<br />
Ground<br />
water<br />
(MGD)<br />
Surface<br />
water<br />
(MGD)<br />
Ground<br />
water<br />
(MGY)<br />
INDUSTRIAL PROCESSING<br />
USE_CODE Year Sum Of USE_2000 (MGY) Sum Of USE_2000 (MGD) Percentage of total<br />
245 2004 2314.1 6.34 1.44 5.82 0.52 2124.3 189.8<br />
245 2003 2153.5 5.9 1.25 5.3 0.6 1934.5 219<br />
245 2002 2204.6 6.04 1.37 5.59 0.45 2040.35 164.25<br />
245 2001 2394.4 6.56 2.19 6.02 0.54 2197.3 197.1<br />
245 2000 2328.7 6.38 1.39 5.74 0.64 2095.1 233.6<br />
App A_<strong>Industrial</strong> water use_state_2000-2004.xls. <strong>Industrial</strong> Processing Summary Page 2 of 8 7/6/2007<br />
Surface<br />
water<br />
(MGY)<br />
Surface<br />
water<br />
(MGY)<br />
Surface<br />
water<br />
(MGY)<br />
Surface<br />
water<br />
(MGY)<br />
Surface<br />
water<br />
(MGY)<br />
Surface<br />
water<br />
(MGY)
Minnesota <strong>Industrial</strong> Processing Facility <strong>Water</strong> <strong>Use</strong>, 2000-2004<br />
Ground<br />
water<br />
(MGD)<br />
Surface<br />
water<br />
(MGD)<br />
Ground<br />
water<br />
(MGY)<br />
INDUSTRIAL PROCESSING<br />
USE_CODE Year Sum Of USE_2000 (MGY) Sum Of USE_2000 (MGD) Percentage of total<br />
246 2004 4131.8 11.3 2.56 10.9 0.4 3974.9 157.0<br />
246 2003 4657.4 12.76 2.71 12.05 0.71 4398.25 259.15<br />
246 2002 4314.3 11.82 2.68 11.32 0.5 4131.8 182.5<br />
246 2001 4536.95 12.43 4.15 11.82 0.61 4314.3 222.65<br />
246 2000 4343.5 11.9 2.59 11.34 0.56 4139.1 204.4<br />
Ground<br />
water<br />
(MGD)<br />
Surface<br />
water<br />
(MGD)<br />
Ground<br />
water<br />
(MGY)<br />
INDUSTRIAL PROCESSING<br />
USE_CODE Year Sum Of USE_2000 (MGY) Sum Of USE_2000 (MGD) Percentage of total<br />
247 2004 1412.55 3.87 0.88 3.87 0 1412.55 0<br />
247 2003 1445.4 3.96 0.84 3.96 0 1445.4 0<br />
247 2002 1438.1 3.94 0.89 3.94 0 1438.1 0<br />
247 2001 1394.3 3.82 1.28 3.82 0 1394.3 0<br />
247 2000 1470.95 4.03 0.88 4.03 0 1470.95 0<br />
Ground<br />
water<br />
(MGD)<br />
Surface<br />
water<br />
(MGD)<br />
Ground<br />
water<br />
(MGY)<br />
INDUSTRIAL PROCESSING<br />
USE_CODE Year Sum Of USE_2000 (MGY) Sum Of USE_2000 (MGD) Percentage of total<br />
248 2004 1087.7 2.98 0.67 2.98 0 1087.7 0<br />
248 2003 1233.7 3.38 0.72 3.38 0 1233.7 0<br />
248 2002 1518.4 4.16 0.94 4.16 0 1518.4 0<br />
248 2001 1481.9 4.06 1.36 4.06 0 1481.9 0<br />
248 2000 1529.35 4.19 0.91 4.19 0 1529.35 0<br />
Ground<br />
water<br />
(MGD)<br />
Surface<br />
water<br />
(MGD)<br />
Ground<br />
water<br />
(MGY)<br />
INDUSTRIAL PROCESSING<br />
USE_CODE Year Sum Of USE_2000 (MGY) Sum Of USE_2000 (MGD) Percentage of total<br />
249 2004 379.6 1.04 0.24 1.04 0 379.6 0<br />
249 2003 379.6 1.04 0.22 1.04 0 379.6 0<br />
249 2002 354.05 0.97 0.22 0.97 0 354.05 0<br />
249 2001 375.95 1.03 0.34 1.03 0 375.95 0<br />
249 2000 423.4 1.16 0.25 1.16 0 423.4 0<br />
App A_<strong>Industrial</strong> water use_state_2000-2004.xls. <strong>Industrial</strong> Processing Summary Page 3 of 8 7/6/2007<br />
Surface<br />
water<br />
(MGY)<br />
Surface<br />
water<br />
(MGY)<br />
Surface<br />
water<br />
(MGY)<br />
Surface<br />
water<br />
(MGY)
WATER USE (MGD)<br />
<strong>Water</strong> <strong>Use</strong> (MGD)<br />
350<br />
300<br />
250<br />
200<br />
150<br />
100<br />
50<br />
0<br />
25.5<br />
25.0<br />
24.5<br />
24.0<br />
23.5<br />
23.0<br />
22.5<br />
22.0<br />
INDUSTRIAL PROCESSING BY USE CODE IN 2000-2004<br />
241 242 243 244 245 246 247 248 249<br />
USE CODE<br />
Agricultual Processing (Food & Livestock)<br />
<strong>Water</strong> <strong>Use</strong> 2000-2004<br />
2004 2003 2002 2001 2000<br />
Year<br />
Minnesota <strong>Industrial</strong> Processing Facility <strong>Water</strong> <strong>Use</strong>, 2000-2004<br />
2004 2003 2002 2001 2000<br />
241 Agricultural processing<br />
242 Pulp and paper processing<br />
243 Mine processing<br />
244 Sand and gravel processing<br />
245 <strong>Industrial</strong> process cooling oncethrough<br />
246 Petroleum-chemical processing<br />
247 Metal processing<br />
248 Non-metallic processing<br />
249 <strong>Industrial</strong> processing<br />
Surface <strong>Water</strong><br />
Ground <strong>Water</strong><br />
App A_<strong>Industrial</strong> water use_state_2000-2004.xls. <strong>Industrial</strong> Processing Summary Page 4 of 8 7/6/2007
<strong>Water</strong> <strong>Use</strong> (MGD)<br />
<strong>Water</strong> <strong>Use</strong> (MGD)<br />
120.0<br />
100.0<br />
80.0<br />
60.0<br />
40.0<br />
20.0<br />
0.0<br />
350.0<br />
300.0<br />
250.0<br />
200.0<br />
150.0<br />
100.0<br />
50.0<br />
0.0<br />
Pulp and Paper Processing<br />
<strong>Water</strong> <strong>Use</strong> 2000-2004<br />
2004 2003 2002 2001 2000<br />
Year<br />
Mine Processing (not Sand & Gravel Washing)<br />
<strong>Water</strong> <strong>Use</strong> 2000-2004<br />
2004 2003 2002 2001 2000<br />
Year<br />
Minnesota <strong>Industrial</strong> Processing Facility <strong>Water</strong> <strong>Use</strong>, 2000-2004<br />
Surface <strong>Water</strong><br />
Ground <strong>Water</strong><br />
Surface <strong>Water</strong><br />
Ground <strong>Water</strong><br />
App A_<strong>Industrial</strong> water use_state_2000-2004.xls. <strong>Industrial</strong> Processing Summary Page 5 of 8 7/6/2007
<strong>Water</strong> <strong>Use</strong> (MGD)<br />
<strong>Water</strong> <strong>Use</strong> (MGD)<br />
12.0<br />
10.0<br />
8.0<br />
6.0<br />
4.0<br />
2.0<br />
0.0<br />
7.0<br />
6.0<br />
5.0<br />
4.0<br />
3.0<br />
2.0<br />
1.0<br />
0.0<br />
Sand and Gravel Washing<br />
<strong>Water</strong> <strong>Use</strong> 2000-2004<br />
2004 2003 2002 2001 2000<br />
Year<br />
<strong>Industrial</strong> Process Cooling Once-through<br />
<strong>Water</strong> <strong>Use</strong> 2000-2004<br />
2004 2003 2002 2001 2000<br />
Year<br />
Minnesota <strong>Industrial</strong> Processing Facility <strong>Water</strong> <strong>Use</strong>, 2000-2004<br />
Surface <strong>Water</strong><br />
Ground <strong>Water</strong><br />
Surface <strong>Water</strong><br />
Ground <strong>Water</strong><br />
App A_<strong>Industrial</strong> water use_state_2000-2004.xls. <strong>Industrial</strong> Processing Summary Page 6 of 8 7/6/2007
<strong>Water</strong> <strong>Use</strong> (MGD)<br />
<strong>Water</strong> <strong>Use</strong> (MGD)<br />
13.0<br />
12.5<br />
12.0<br />
11.5<br />
11.0<br />
10.5<br />
10.0<br />
9.5<br />
4.1<br />
4.0<br />
4.0<br />
3.9<br />
3.9<br />
3.8<br />
3.8<br />
3.7<br />
Petroleum-Chemical Processing, ethanol<br />
<strong>Water</strong> <strong>Use</strong> 2000-2004<br />
2004 2003 2002 2001 2000<br />
Year<br />
Metal Processing<br />
<strong>Water</strong> <strong>Use</strong> 2000-2004<br />
2004 2003 2002 2001 2000<br />
Year<br />
Minnesota <strong>Industrial</strong> Processing Facility <strong>Water</strong> <strong>Use</strong>, 2000-2004<br />
Surface <strong>Water</strong><br />
Ground <strong>Water</strong><br />
Surface <strong>Water</strong><br />
Ground <strong>Water</strong><br />
App A_<strong>Industrial</strong> water use_state_2000-2004.xls. <strong>Industrial</strong> Processing Summary Page 7 of 8 7/6/2007
<strong>Water</strong> <strong>Use</strong> (MGD)<br />
<strong>Water</strong> <strong>Use</strong> (MGD)<br />
4.5<br />
4.0<br />
3.5<br />
3.0<br />
2.5<br />
2.0<br />
1.5<br />
1.0<br />
0.5<br />
0.0<br />
1.2<br />
1.2<br />
1.1<br />
1.1<br />
1.0<br />
1.0<br />
0.9<br />
0.9<br />
Non-Metallic Processing (Rubber, Plastic, Glass)<br />
<strong>Water</strong> <strong>Use</strong> 2000-2004<br />
2004 2003 2002 2001 2000<br />
Year<br />
<strong>Industrial</strong> Processing<br />
<strong>Water</strong> <strong>Use</strong> 2000-2004<br />
2004 2003 2002 2001 2000<br />
Year<br />
Minnesota <strong>Industrial</strong> Processing Facility <strong>Water</strong> <strong>Use</strong>, 2000-2004<br />
Surface <strong>Water</strong><br />
Ground <strong>Water</strong><br />
Surface <strong>Water</strong><br />
Ground <strong>Water</strong><br />
App A_<strong>Industrial</strong> water use_state_2000-2004.xls. <strong>Industrial</strong> Processing Summary Page 8 of 8 7/6/2007
Craddock Consulting Engineers<br />
In Association with CDM & James Crook<br />
Appendix B<br />
Status of <strong>Water</strong> Reuse<br />
Regulations and Guidelines
Craddock Consulting Engineers<br />
In Association with CDM & James Crook
Overview<br />
There are no federal regulations governing water reclamation and reuse in the United<br />
States; regulations are developed and implemented at the state government level. The<br />
lack of federal regulations has resulted in differing standards among states that have<br />
developed water reuse regulations. In the 1990s, several states adopted or revised their<br />
respective regulations, and it was common practice to base reuse criteria on those of states<br />
that had comprehensive regulations, guidelines, and background in<strong>for</strong>mation to support<br />
them. The Guidelines <strong>for</strong> <strong>Water</strong> Reuse [U.S. Environmental Protection Agency, 1992], which<br />
were published in 1992 (revised in 2004), were also used as a resource by states that had<br />
limited or no regulations or guidelines. Since then, there has been increased interest in<br />
water reuse in several states that previously did not have water reuse regulations.<br />
At present, no states have regulations that cover all potential uses of reclaimed water, but<br />
several states have extensive regulations that prescribe requirements <strong>for</strong> a wide range of<br />
end uses of the reclaimed water. Other states have regulations or guidelines that focus<br />
on land treatment of wastewater effluent, emphasizing additional treatment or effluent<br />
disposal rather than beneficial reuse, even though the effluent may be used <strong>for</strong> irrigation<br />
of agricultural sites or public access lands.<br />
Minnesota is one of several states that have not developed state water reuse criteria.<br />
Currently, the State of Minnesota uses Cali<strong>for</strong>nia’s <strong>Water</strong> <strong>Recycling</strong> Criteria [State of<br />
Cali<strong>for</strong>nia, 2000a] to evaluate water reuse projects on a case-by-case basis, as summarized<br />
in Table 1.<br />
The status and summary of water reclamation and reuse regulations and guidelines in<br />
the United States as of 2004 have been documented in the EPA Guidelines <strong>for</strong> <strong>Water</strong> Reuse<br />
[U.S. Environmental Protection Agency, 2004] and are provided in Table 2. The absence<br />
of state regulations and guidelines <strong>for</strong> specific reuse applications does not necessarily<br />
prohibit those applications; many states evaluate specific types of water reuse on a caseby-case<br />
basis. Based on the data in Table 2, 25 states have adopted regulations regarding<br />
the use of reclaimed water, 16 states have guidelines or design standards, and 9 states<br />
have no regulations or guidelines. These data are somewhat misleading, as they include<br />
regulations and guidelines directed at land disposal of effluent or land application of<br />
wastewater intended primarily as a disposal mechanism rather than beneficial reuse.<br />
The number of states with regulations or guidelines <strong>for</strong> each type of reuse is summarized<br />
in Table 3, which has been adapted from the U.S. EPA Guidelines <strong>for</strong> <strong>Water</strong> Reuse. As<br />
indicated in Table 3, agricultural and landscape irrigation represent the reclaimed water<br />
uses most commonly regulated, and many states have implemented regulations that<br />
apply only to those types of use. As noted above, these data include state regulations<br />
that pertain to land disposal of effluent or land application of wastewater intended<br />
primarily as a disposal mechanism rather than beneficial reuse.<br />
Craddock Consulting Engineers B-1<br />
In Association with CDM & James Crook<br />
WWReuse Tm1_Appendix B_Regulatory.doc
Table 1. 2000 Cali<strong>for</strong>nia <strong>Water</strong> <strong>Recycling</strong> Criteria<br />
Appendix B<br />
Status of <strong>Water</strong> Reuse Regulations and Guidelines<br />
Craddock Consulting Engineers B-2<br />
In Association with CDM & James Crook<br />
WWReuse Tm1_Appendix B_Regulatory.doc<br />
Type of <strong>Use</strong><br />
Irrigation of fodder, fiber, and seed crops, orchards b and<br />
vineyards b , processed food crops c , nonfood-bearing trees,<br />
ornamental nursery stock d , and sod farms d ; flushing<br />
sanitary sewers<br />
Irrigation of pasture <strong>for</strong> milking animals, landscape areas e ,<br />
ornamental nursery stock and sod farms where public<br />
access is not restricted; landscape impoundments;<br />
industrial or commercial cooling water where no mist is<br />
created; nonstructural fire fighting; industrial boiler feed;<br />
soil compaction; dust control; cleaning roads, sidewalks,<br />
and outdoor areas<br />
Irrigation of food crops b ; restricted recreational<br />
impoundments; fish hatcheries<br />
Irrigation of food crops f and open access landscape areas g ;<br />
toilet and urinal flushing; industrial process water;<br />
decorative fountains; commercial laundries and car<br />
washes; snow-making; structural fire fighting; industrial<br />
or commercial cooling where mist is created<br />
Nonrestricted recreational impoundments<br />
Total Coli<strong>for</strong>m<br />
Limits a<br />
Treatment<br />
Required<br />
None required Oxidation<br />
≤23/100 ml a<br />
≤240/100 ml in more than<br />
one sample in any 30-day<br />
≤2.2/100 ml a<br />
≤23/100 ml in more than one<br />
sample in any 30-day period<br />
≤2.2/100 ml a<br />
≤23/100 ml in more than one<br />
sample in any 30-day period<br />
240/100 ml (maximum)<br />
≤2.2/100 ml a<br />
≤23/100 ml in more than one<br />
sample in any 30-day period<br />
240/100 ml (maximum)<br />
Ground water recharge by spreading Case-by-case evaluation<br />
Oxidation<br />
Disinfection<br />
Oxidation<br />
Disinfection<br />
Oxidation<br />
Coagulation h<br />
Filtration i<br />
Disinfection<br />
Oxidation<br />
Coagulation<br />
Clarification j<br />
Filtration i<br />
Disinfection<br />
Case-by-case<br />
evaluation<br />
a<br />
Based on running 7-day median; daily sampling is required.<br />
b<br />
No contact between reclaimed water and edible portion of crop.<br />
c<br />
Food crops that undergo commercial pathogen-destroying prior to human consumption.<br />
d<br />
No irrigation <strong>for</strong> at least 14 days prior to harvesting, sale, or allowing public access.<br />
e<br />
Cemeteries, freeway landscaping, restricted access golf courses, and other controlled access areas.<br />
f<br />
Contact between reclaimed water and edible portion of crop; includes edible root crops.<br />
g<br />
Parks, playgrounds, schoolyards, residential landscaping, unrestricted access golf courses, and other<br />
uncontrolled access irrigation areas.<br />
h<br />
Not required if the turbidity of influent to the filters is continuously measured, does not exceed 5<br />
nephelometric turbidity units (NTU) <strong>for</strong> more than 15 minutes and never exceeds 10 NTU, and there is<br />
capability to automatically activate chemical addition or divert wastewater if the filter influent turbidity<br />
exceeds 5 NTU <strong>for</strong> more than 15 minutes.<br />
i<br />
The turbidity after filtration through filter media cannot exceed an average of 2 NTU within any 24-hour<br />
period, 5 NTU more than 5 percent of the time within a 24-hour period, and 10 NTU at any time. The<br />
turbidity after filtration through a membrane process cannot exceed 0.2 NTU more than 5 percent of the<br />
time within any 24-hour period and 0.5 NTU at any time.<br />
j<br />
Not required if reclaimed water is monitored <strong>for</strong> enteric viruses, Giardia, and Cryptosporidium.<br />
Source: Adapted from State of Cali<strong>for</strong>nia [2000a].
Appendix B<br />
Status of <strong>Water</strong> Reuse Regulations and Guidelines<br />
Table 2. Summary of State Reuse Regulations and Guidelines <strong>for</strong> Nonpotable<br />
Reuse Applications<br />
State<br />
Craddock Consulting Engineers B-3<br />
In Association with CDM & James Crook<br />
WWReuse Tm1_Appendix B_Regulatory.doc<br />
Regulations<br />
Guidelines<br />
No Regulations or<br />
Guidelines<br />
Unrestricted<br />
Nonpotable Urban<br />
<strong>Use</strong>s<br />
Restricted<br />
Nonpotable Urban<br />
<strong>Use</strong>s<br />
Agricultural<br />
Irrigation of Food<br />
Crops<br />
Agricultural<br />
Irrigation of Non-<br />
Food Crops<br />
Unrestricted<br />
Recreational<br />
Impoundments<br />
Restricted<br />
Recreational<br />
Impoundments<br />
Alabama <br />
Alaska <br />
Arizona <br />
Arkansas <br />
Cali<strong>for</strong>nia <br />
Colorado <br />
Connecticut <br />
Delaware <br />
Florida <br />
Georgia <br />
Hawaii <br />
Idaho <br />
Illinois <br />
Indiana <br />
Iowa <br />
Kansas <br />
Kentucky <br />
Louisiana <br />
Maine <br />
Maryland <br />
Massachusetts <br />
Michigan <br />
Minnesota <br />
Mississippi <br />
Missouri <br />
Montana <br />
Nebraska <br />
Nevada <br />
New Hampshire <br />
New Jersey <br />
New Mexico <br />
New York <br />
North Carolina <br />
North Dakota <br />
Ohio <br />
Oklahoma <br />
Oregon <br />
Pennsylvania <br />
Rhode Island <br />
South Carolina <br />
South Dakota <br />
Tennessee <br />
Texas <br />
Utah <br />
Vermont <br />
Virginia <br />
Washington <br />
West Virginia <br />
Wisconsin <br />
Wyoming <br />
Source: Adapted from U.S. Environmental Protection Agency [2004].<br />
Environmental<br />
<strong>Use</strong>s<br />
<strong>Industrial</strong> <strong>Use</strong>s
Appendix B<br />
Status of <strong>Water</strong> Reuse Regulations and Guidelines<br />
Table 3. Number of States with Reuse Regulations or Guidelines <strong>for</strong> Different<br />
Types of <strong>Use</strong><br />
Craddock Consulting Engineers B-4<br />
In Association with CDM & James Crook<br />
WWReuse Tm1_Appendix B_Regulatory.doc<br />
Type of <strong>Use</strong><br />
Unrestricted urban water reuse<br />
Irrigation<br />
Toilet flushing<br />
Fire protection<br />
Construction<br />
Landscape impoundment<br />
Street cleaning<br />
Restricted urban water reuse<br />
Agricultural irrigation of food<br />
crops<br />
Agricultural irrigation of<br />
nonfood crops<br />
Unrestricted recreational water<br />
reuse<br />
Restricted recreational water<br />
reuse<br />
Number of<br />
States with<br />
Regulations or<br />
Guidelines<br />
Environmental water reuse 3<br />
<strong>Industrial</strong> water reuse<br />
Ground water Recharge<br />
Indirect Potable Reuse<br />
28<br />
28<br />
10<br />
9<br />
9<br />
11<br />
6<br />
Adapted from U.S. Environmental Protection Agency [2004].<br />
34<br />
21<br />
40<br />
7<br />
9<br />
9<br />
5<br />
5<br />
Description<br />
Irrigation of areas in which public access is<br />
not restricted, such as parks, playgrounds,<br />
school yards, and residences.<br />
Toilet flushing, air conditioning, fire<br />
protection, construction, cleansing,<br />
ornamental fountains, and aesthetic<br />
impoundments.<br />
Irrigation of areas in which public access can<br />
be controlled, such as golf courses,<br />
cemeteries, and highway medians.<br />
Irrigation of food crops which are intended<br />
<strong>for</strong> human consumption.<br />
Food crop is to be processed.<br />
Food crop is consumed uncooked.<br />
Irrigation of fodder, fiber, and seed crops,<br />
pasture land, commercial nurseries, and sod<br />
farms.<br />
An impoundment of water in which no<br />
limitations are imposed on body-contact<br />
water recreation activities.<br />
An impoundment of reclaimed water in<br />
which recreation is limited to fishing,<br />
boating, and other non-contact recreational<br />
activities.<br />
Reclaimed water used to create manmade<br />
wetlands, enhance natural wetlands, and to<br />
sustain stream flows.<br />
Reclaimed water used in industrial facilities<br />
primarily <strong>for</strong> cooling system makeup water,<br />
boiler-feed water, process water, and general<br />
washdown and cleansing.<br />
Using via infiltration basins, percolation<br />
ponds or injection wells, reclaimed water is<br />
used to recharge ground water aquifers.<br />
The intentional discharge of highly treated<br />
reclaimed water into surface waters or<br />
ground water that will be used as a source of<br />
potable water supply.
Appendix B<br />
Status of <strong>Water</strong> Reuse Regulations and Guidelines<br />
The standards in states having the most reuse experience tend to be more stringent than<br />
those in states with fewer reuse projects. States that have water reuse regulations or<br />
guidelines typically set standards <strong>for</strong> reclaimed water quality and specify minimum<br />
treatment requirements, although a few states, such as Texas and New Mexico, do not<br />
prescribe treatment processes and rely solely on water quality limits.<br />
Regulatory Requirements <strong>for</strong> Nonpotable <strong>Use</strong>s of<br />
Reclaimed <strong>Water</strong><br />
In the past, most state water reuse regulations were developed in response to a need to<br />
regulate a growing number of water reuse projects in the particular state. Recently, some<br />
states that currently have few reuse projects have taken a proactive approach and have<br />
adopted criteria, which tend to encourage implementation of projects. Arizona,<br />
Cali<strong>for</strong>nia, Florida, and Texas, which have had comprehensive criteria <strong>for</strong> a number of<br />
years, have revised their water reuse regulations within the last ten years to reflect<br />
additional reclaimed water uses, advances in wastewater treatment technology, and<br />
increased knowledge in the areas of microbiology and public health protection.<br />
Common <strong>Use</strong>s<br />
The variations and inconsistencies among state regulations are illustrated in Table 4,<br />
which includes examples of several states’ reclaimed water standards <strong>for</strong> uses ranging<br />
from fodder crop irrigation to toilet and urinal flushing in buildings.<br />
<strong>Water</strong> reuse regulations focus on public health implications of using the water, and water<br />
quality criteria not related to health protection usually are not included in water reuse<br />
regulations. Most states with extensive water reuse experience have comparable,<br />
conservatively-based water quality criteria or guidelines. Arguments <strong>for</strong> less restrictive<br />
standards are most often predicated upon a lack of documented health hazards rather<br />
than upon any certainty that hazards are small or nonexistent. In the absence of<br />
definitive epidemiological data and a unified interpretation of scientific and technical<br />
data on pathogen exposures, selection of water quality limits will continue to be<br />
somewhat subjective and inconsistent among the states. Regulatory requirements <strong>for</strong><br />
some nonpotable uses of reclaimed water not included in Table 4 are discussed below.<br />
Wetlands<br />
In most cases, the primary intent in applying reclaimed water to wetlands is to provide<br />
additional treatment of effluent prior to discharge or reuse, although wetlands are<br />
sometimes created solely <strong>for</strong> environmental enhancement. In such cases, secondary<br />
treatment is usually acceptable as influent to the wetland system. Very few states have<br />
regulations that specifically address the use of reclaimed water <strong>for</strong> creation of artificial<br />
wetlands or the restoration or enhancement of natural wetlands. Where there are no<br />
regulations, regulatory agencies prescribe requirements on a case-by-case basis. In<br />
addition to state requirements, natural wetlands, which are considered waters of the<br />
United States, are protected under EPA's NPDES Permit and <strong>Water</strong> Quality Standards<br />
programs. Constructed wetlands built and operated <strong>for</strong> the purpose of wastewater<br />
treatment generally are not considered waters of the United States.<br />
Craddock Consulting Engineers B-5<br />
In Association with CDM & James Crook<br />
WWReuse Tm1_Appendix B_Regulatory.doc
Table 4. Examples of State <strong>Water</strong> Reuse Criteria <strong>for</strong> Selected Nonpotable Applications<br />
Appendix B<br />
Status of <strong>Water</strong> Reuse Regulations and Guidelines<br />
Fodder Crop Irrigation 1<br />
Processed Food Crop Irrigation 2<br />
Food Crop Irrigation 3<br />
Restricted Recreational<br />
Impoundments 4<br />
State<br />
Treatment<br />
Quality Limits<br />
Required<br />
Treatment<br />
Quality Limits<br />
Required<br />
Treatment<br />
Quality Limits<br />
Required<br />
Treatment<br />
Quality Limits<br />
Required<br />
No detect. fecal Secondary No detect. fecal coli/ Secondary<br />
Arizona 1,000 fecal coli/100 ml Secondary Not covered Not covered coli/100 ml Filtration 100 ml<br />
Filtration<br />
2 NTU<br />
Disinfection<br />
Oxidation<br />
2 NTU<br />
Disinfection<br />
Cali<strong>for</strong>nia Not specified Oxidation Not specified Oxidation<br />
2.2 total coli/100 ml<br />
2 NTU<br />
Coagulation 5<br />
Filtration<br />
Disinfection<br />
2.2 total coli/100 ml<br />
Oxidation<br />
Disinfection<br />
Colorado Not covered Not covered Not covered Not covered Not covered Not covered Not covered Not covered<br />
Florida<br />
200 fecal coli/100 ml<br />
20 mg/L CBOD 6<br />
20 mg/l TSS 7<br />
Secondary<br />
Disinfection<br />
No detect. fecal coli/<br />
100 ml<br />
20 mg/L CBOD<br />
5 mg/L TSS<br />
Secondary<br />
Filtration<br />
Disinfection<br />
<strong>Use</strong> prohibited <strong>Use</strong> prohibited<br />
No detect. fecal coli/<br />
100 ml<br />
20 mg/L CBOD<br />
5 mg/L TSS<br />
Secondary<br />
Filtration<br />
Disinfection<br />
New Mexico<br />
(Policy)<br />
1,000 fecal coli/100 ml<br />
75 mg/L TSS<br />
30 mg/L BOD 6<br />
Not specified Not covered Not covered <strong>Use</strong> Prohibited <strong>Use</strong> Prohibited<br />
100 fecal coli/100 ml<br />
30 mg/L BOD<br />
30 mg/L TSS<br />
Not specified<br />
Utah<br />
200 fecal coli/100 ml<br />
25 mg/L BOD<br />
25 mg/L TSS<br />
Secondary<br />
Disinfection<br />
No detect. fecal coli/<br />
100 ml<br />
10 mg/L BOD<br />
2 NTU<br />
Secondary<br />
Filtration<br />
Disinfection<br />
No detect. fecal<br />
coli/100 ml<br />
10 mg/L BOD<br />
2 NTU<br />
Secondary<br />
Filtration<br />
Disinfection<br />
200 fecal coli/100 ml<br />
25 mg/L BOD<br />
25 mg/L TSS<br />
Secondary<br />
Disinfection<br />
200 fecal coli/100 ml<br />
200 fecal coli/100 ml<br />
20 fecal coli/100 ml<br />
Texas 20 mg/L BOD<br />
Not specified 20 mg/L BOD<br />
Not specified <strong>Use</strong> prohibited <strong>Use</strong> prohibited 3 NTU<br />
Not specified<br />
15 mg/L CBOD<br />
15 mg/L CBOD<br />
5 mg/L BOD or CBOD<br />
Washington 240 total coli/100 ml<br />
Oxidation<br />
Disinfection<br />
240 total coli/100 ml<br />
Oxidation<br />
Disinfection<br />
2.2 total coli/<br />
100 ml<br />
2 NTU<br />
Oxidation<br />
Coagulation<br />
Filtration<br />
Disinfection<br />
Oxidation<br />
2.2 total coli/100 ml<br />
Disinfection<br />
1<br />
In some states more restrictive requirements apply where milking animals are allowed to graze on pasture irrigated with reclaimed water.<br />
2<br />
Physical or chemical processing sufficient to destroy pathogenic microorganisms. Less restrictive requirements may apply where there is no direct contact between reclaimed<br />
water and the edible portion of the crop.<br />
3<br />
Food crops eaten raw where there is direct contact between reclaimed water and the edible portion of the crop.<br />
4<br />
Recreation is limited to fishing, boating, and other nonbody contact activities.<br />
5<br />
Not needed if filter effluent turbidity does not exceed 2 NTU, the turbidity of the influent to the filters is continually measured, the influent turbidity does not exceed 5 NTU <strong>for</strong><br />
more than 15 minutes and never exceeds 10 NTU, and there is capability to automatically activate chemical addition or divert the wastewater should the filter influent turbidity<br />
exceed 5 NTU <strong>for</strong> more than 15 minutes.<br />
6<br />
CBOD – carbonaceous biochemical oxygen demand; where BOD is the same as Total BOD<br />
7 TSS – total suspended solids<br />
Craddock Consulting Engineers B-6<br />
In Association with CDM & James Crook<br />
WWReuse Tm1_Appendix B_Regulatory.doc
Table 4. Examples of State <strong>Water</strong> Reuse Criteria <strong>for</strong> Selected Nonpotable Applications (cont’d)<br />
State<br />
Arizona<br />
Appendix B<br />
Status of <strong>Water</strong> Reuse Regulations and Guidelines<br />
Craddock Consulting Engineers B-7<br />
In Association with CDM & James Crook<br />
WWReuse Tm1_Appendix B_Regulatory.doc<br />
Restricted Access Irrigation 1<br />
Quality Limits<br />
200 fecal<br />
coli/100 ml<br />
Cali<strong>for</strong>nia 23 total coli/100 ml<br />
Colorado<br />
Florida<br />
New Mexico<br />
(Policy)<br />
Utah<br />
Texas<br />
126 E.coli/100 ml<br />
3 NTU<br />
200 fecal coli/100 ml<br />
20 mg/L CBOD 6<br />
20 mg/l TSS 7<br />
200 fecal coli/100 ml<br />
30 mg/L BOD 6<br />
30 mg/L TSS<br />
200 fecal coli/100 ml<br />
25 mg/L BOD<br />
25 mg/L TSS<br />
200 fecal coli/100 ml<br />
20 mg/L BOD<br />
15 mg/L CBOD<br />
Washington 23 total coli/100 ml<br />
Treatment<br />
Required<br />
Secondary<br />
Disinfection<br />
Oxidation<br />
Disinfection<br />
Secondary<br />
Disinfection<br />
Secondary<br />
Disinfection<br />
Not specified<br />
Secondary<br />
Disinfection<br />
Not specified<br />
Oxidation<br />
Disinfection<br />
Unrestricted Access Irrigation 2<br />
Quality Limits<br />
No detect. fecal coli/<br />
100 ml<br />
2 NTU<br />
2.2 total coli/100 ml<br />
2 NTU<br />
126 E.coli/100 ml<br />
3 NTU<br />
No detect. fecal coli/<br />
100 ml<br />
20 mg/L CBOD<br />
5 mg/L TSS<br />
If within 100 ft of<br />
dwelling:<br />
5 fecal coli/100 ml<br />
10 mg/L BOD<br />
3 NTU<br />
No detect. fecal coli/<br />
100 ml<br />
10 mg/L BOD<br />
2 NTU<br />
20 fecal coli/100 ml<br />
3 NTU<br />
5 mg/L BOD or CBOD<br />
2.2 total coli/100 ml<br />
2 NTU<br />
Treatment<br />
Required<br />
Oxidation<br />
Filtration<br />
Disinfection<br />
Secondary<br />
Coagulation 4<br />
Filtration<br />
Disinfection<br />
Secondary<br />
Filtration<br />
Disinfection<br />
Secondary<br />
Filtration<br />
Disinfection<br />
Not specified<br />
Secondary<br />
Filtration<br />
Disinfection<br />
Not specified<br />
Oxidation<br />
Coagulation<br />
Filtration<br />
Disinfection<br />
Toilet Flushing 3 <strong>Industrial</strong> Cooling <strong>Water</strong> 4<br />
Quality Limits<br />
No detect. fecal<br />
coli/100 ml<br />
2 NTU<br />
2.2 total coli/<br />
100 ml<br />
2 NTU<br />
Treatment<br />
Required<br />
Oxidation<br />
Filtration<br />
Disinfection<br />
Oxidation<br />
Coagulation 5<br />
Filtration<br />
Disinfection<br />
Not covered Not covered<br />
No detect. fecal<br />
coli/100 ml<br />
20 mg/L CBOD<br />
5 mg/L TSS<br />
100 fecal coli/100<br />
ml<br />
30 mg/L BOD<br />
30 mg/L TSS<br />
No detect. fecal<br />
coli/100 ml<br />
10 mg/L BOD<br />
2 NTU<br />
20 fecal coli/100 ml<br />
3 NTU<br />
5 mg/L BOD or<br />
CBOD<br />
2.2 total coli/<br />
100 ml<br />
2 NTU<br />
Secondary<br />
Filtration<br />
Disinfection<br />
Quality Limits<br />
Treatment<br />
Required<br />
Not covered Not covered<br />
2.2 total coli/100 ml<br />
2 NTU<br />
126 E.coli/100 ml<br />
3 NTU<br />
No detect. fecal coli/<br />
100 ml<br />
20 mg/L CBOD<br />
5 mg/L TSS<br />
Oxidation<br />
Coagulation 4<br />
Filtration<br />
Disinfection<br />
Secondary<br />
Filtration<br />
Disinfection<br />
Secondary<br />
Filtration<br />
Disinfection<br />
Not specified Not covered Not covered<br />
Secondary<br />
Filtration<br />
Disinfection<br />
Not specified<br />
Oxidation<br />
Coagulation<br />
Filtration<br />
Disinfection<br />
200 fecal coli/100 ml<br />
25 mg/L BOD<br />
25 mg/TSS<br />
200 fecal coli/100 ml<br />
20 mg/L BOD<br />
15 mg/L CBOD<br />
2.2 total coli/100 ml<br />
2 NTU<br />
Secondary<br />
Disinfection<br />
Not specified<br />
Oxidation<br />
Coagulation<br />
Filtration<br />
Disinfection<br />
1<br />
Classification varies by state; generally includes irrigation of cemeteries, freeway medians, restricted access golf courses, and similar restricted access areas.<br />
2<br />
Includes irrigation of parks, playgrounds, schoolyards, residential lawns, and similar unrestricted access areas.<br />
3<br />
Not allowed in single-family residential dwelling units.<br />
4<br />
Cooling towers where a mist is created that may reach populated areas.<br />
5<br />
Not needed if filter effluent turbidity does not exceed 2 NTU, the turbidity of the influent to the filters is continually measured, the influent turbidity does not exceed 5 NTU <strong>for</strong><br />
more than 15 minutes and never exceeds 10 NTU, and there is capability to automatically activate chemical addition or divert the wastewater should the filter influent turbidity<br />
exceed 5 NTU <strong>for</strong> more than 15 minutes.<br />
6<br />
CBOD – Carbonaceous biochemical oxygen demand; where BOD is the same as Total BOD<br />
7 TSS – total suspended solids
Appendix B<br />
Status of <strong>Water</strong> Reuse Regulations and Guidelines<br />
In the few states that have adopted regulations <strong>for</strong> reclaimed water use in wetlands,<br />
requirements vary based on type of wetland system and degree of public access. For<br />
example, Washington requires that reclaimed water discharged to natural wetlands<br />
where there is no expected human contact with the water must meet Class D reclaimed<br />
water standards (secondary treatment and not more than 240 total coli<strong>for</strong>m (coli)/100<br />
ml), while discharges to natural or constructed wetlands providing human contact<br />
recreational or educational beneficial uses must meet Class A reclaimed water standards<br />
(tertiary treatment and not more than 2.2 total coli/100 ml in the reclaimed water).<br />
Reclaimed water discharged to any wetland system in Washington cannot exceed the<br />
following water quality limits: 20 mg/L biochemical oxygen demand (BOD); 20 mg/L<br />
total suspended solids (TSS); 3 mg/L total Kjeldahl nitrogen (as N); and 1 mg/L total<br />
phosphorus (as P).<br />
<strong>Industrial</strong> <strong>Use</strong>s Other than Cooling<br />
Due to the myriad of industrial processes that use water, regulatory agencies generally<br />
prescribe water reuse requirements <strong>for</strong> industrial applications other than cooling on an<br />
individual case basis. Reclaimed water from conventional wastewater treatment<br />
processes is of adequate quality <strong>for</strong> many industrial applications that can tolerate water<br />
of less than potable quality. <strong>Industrial</strong> uses of reclaimed water include cooling, process<br />
water, stack scrubbing, boiler feed, wash water, transport of material, and as an<br />
ingredient in a nonfood-related product.<br />
Regulatory considerations <strong>for</strong> reuse of water in industrial applications include<br />
generation of aerosols, safety of manufactured products, and associated food and<br />
beverage production. For example, Florida regulations address the use of reclaimed water<br />
<strong>for</strong> food processing at industrial facilities. Florida’s reuse rule specifically prohibits the use<br />
of reclaimed water in the manufacture or processing of food or beverage <strong>for</strong> human<br />
consumption where the reclaimed water will be incorporated into or come in contact<br />
with the food or beverage product. Similarly, Washington standards do not allow the<br />
use of reclaimed water <strong>for</strong> food preparation and prohibit its use in food or drink <strong>for</strong><br />
humans. While many industrial uses require water of higher chemical quality than that<br />
typically present in reclaimed water, e.g., computer chip manufacturing requires reverse<br />
osmosis treatment to produce ultra-pure wash water, water reuse regulations are<br />
intended to provide health protection and only include requirements to attain that end.<br />
Miscellaneous Nonpotable <strong>Use</strong>s<br />
While all states that have water reuse regulations or guidelines include criteria <strong>for</strong> crop<br />
and/or landscape irrigation, some include requirements <strong>for</strong> less common uses of<br />
reclaimed water, such as flushing sanitary sewers, street cleaning, dust control, soil<br />
compaction, making concrete, snowmaking, decorative fountains, commercial laundries,<br />
commercial car washes, equipment washing, and fire protection systems. For these and<br />
similar uses, the various state standards impose wastewater treatment process<br />
requirements, reclaimed water quality limits, and design and operational requirements<br />
reflective of the degree of human exposure to the water that are in concert with other<br />
more common uses of reclaimed water. For example, secondary treatment with a<br />
minimal level of disinfection is acceptable <strong>for</strong> uses where there is little or no expected<br />
Craddock Consulting Engineers B-8<br />
In Association with CDM & James Crook<br />
WWReuse Tm1_Appendix B_Regulatory.doc
Appendix B<br />
Status of <strong>Water</strong> Reuse Regulations and Guidelines<br />
human contact with the water, such as flushing sanitary sewers or making concrete.<br />
Conversely, uses such as snowmaking and vehicle washing are likely to result in contact<br />
with the reclaimed water, and tertiary treatment with a high level of disinfection is<br />
usually required.<br />
Treatment, <strong>Water</strong> Quality, and Other Requirements<br />
Treatment Process Requirements<br />
With few exceptions, state water reuse regulations prescribe treatment unit process<br />
requirements. Where expected exposure is incidental or not likely, a low level of<br />
wastewater treatment is usually acceptable and undisinfected or disinfected secondary<br />
treated effluent may be allowed dependent on the type of use. In most states, the<br />
definition of secondary treatment means that neither the BOD (total BOD) nor TSS<br />
exceed 30 mg/L. A few states use the term “oxidized wastewater” to define secondary<br />
treated wastewater, where oxidized wastewater is defined as wastewater in which the<br />
organic matter has been stabilized, is nonputrescible, and contains dissolved oxygen.<br />
Most state regulations do not require a specific type of secondary treatment; e.g.,<br />
conventional activated sludge, extended aeration activated sludge, lagoon systems, and<br />
other types of secondary treatment may be acceptable. Where public exposure to<br />
reclaimed water used <strong>for</strong> nonpotable applications is expected to occur, tertiary treatment<br />
usually is required. Different types of acceptable tertiary treatment may include sand<br />
filtration, multi-media filtration, membranes, or other methods shown to be effective in<br />
reducing particulate and organic matter.<br />
BOD, TSS, and Turbidity Requirements<br />
Most states specify wastewater treatment processes and reclaimed water quality limits<br />
<strong>for</strong> TSS and/or turbidity, total or fecal coli<strong>for</strong>ms, and disinfection. States that have<br />
regulations <strong>for</strong> potable reuse also include limits on chemical constituents that include,<br />
but are not limited to, the U.S. EPA drinking water standards. For uses of reclaimed<br />
water that require a high quality product water, BOD and TSS limits as low as 5 mg/L<br />
are specified in some states. These limits are applicable where filtration or other tertiary<br />
treatment processes are used to remove some objectionable constituents and prepare the<br />
water <strong>for</strong> disinfection. Daily sampling <strong>for</strong> BOD and TSS, using composite samples is<br />
usually required, although less frequent sampling is allowed in some states. Not all<br />
states include limits <strong>for</strong> BOD and TSS, and several states specify turbidity requirements<br />
in lieu of TSS. Turbidity limits generally are required only <strong>for</strong> tertiary treated reclaimed<br />
water where human contact is expected or likely. Where required, most states require<br />
that turbidity be continuously monitored. The compliance point <strong>for</strong> turbidity usually is<br />
just prior to disinfection.<br />
Where specified, limits on turbidity in reclaimed water after filtration range from 1 to 10<br />
nephelometric turbidity units (NTU), with 2 NTU being a common requirement.<br />
Cali<strong>for</strong>nia specifies different turbidity requirements depending on type of tertiary<br />
treatment. Where media filtration is the tertiary treatment process, turbidity after<br />
filtration cannot exceed an average of 2 NTU within any 24-hour period, cannot exceed 5<br />
NTU more than 5 percent of the time within a 24-hour period, and cannot exceed 10<br />
Craddock Consulting Engineers B-9<br />
In Association with CDM & James Crook<br />
WWReuse Tm1_Appendix B_Regulatory.doc
Appendix B<br />
Status of <strong>Water</strong> Reuse Regulations and Guidelines<br />
NTU at any time. Where membranes are used in lieu of media filtration, turbidity<br />
cannot exceed 0.2 NTU more than 5 percent of the time within a 24-hour period and<br />
cannot exceed 0.5 NTU at any time.<br />
Coli<strong>for</strong>m Bacteria Limits<br />
Most states use fecal coli<strong>for</strong>m organisms as the indicator organism <strong>for</strong> microbial<br />
pathogens in reclaimed water, while a few states use total coli<strong>for</strong>m. Fecal or total<br />
coli<strong>for</strong>m limits depend on use of the water and are highly variable among states.<br />
Arizona, Florida, and some other states’ regulations are similar to, or based on, the EPA<br />
Guidelines <strong>for</strong> <strong>Water</strong> Reuse and use fecal coli<strong>for</strong>m organisms as the indicator organism. In<br />
those states regulations typically require that reclaimed water have no detectable fecal<br />
coli<strong>for</strong>m/100 ml <strong>for</strong> high level nonpotable applications and not exceed 200 fecal<br />
coli<strong>for</strong>m/100 ml <strong>for</strong> uses where human contact is minimal.<br />
States that use total coli<strong>for</strong>m as the indicator organism require that total coli<strong>for</strong>m<br />
organisms not exceed 2.2/100 ml <strong>for</strong> high level uses and either 23 or 240/100 ml <strong>for</strong> uses<br />
where there is no or minimal human contact with the water. Higher single sample<br />
maximum coli<strong>for</strong>m limits are allowed in several states. Regulatory compliance varies in<br />
different states, but usually is based on median or geometric mean values over a given<br />
time period. Coli<strong>for</strong>m samples are usually required to be collected on a daily basis<br />
during peak flow conditions to represent the most demanding treatment facility<br />
operating conditions. Less frequent coli<strong>for</strong>m sampling is allowed in some states.<br />
Several states require that coli<strong>for</strong>m analyses be conducted using the multiple tube<br />
fermentation technique with the results expressed as the most probable number (MPN),<br />
while others allow use of the membrane filter (MF) technique. A few states do not<br />
specify which enumeration technique to use, and some states allow the use of either the<br />
MPN or MF methods.<br />
The draft revisions of the Minnesota water quality standards include Escherichia coli (E.<br />
coli). While indicator organisms in water reuse criteria do not necessarily have to be the<br />
same as those in waste discharge requirements, it is likely that E. coli will be part of the<br />
evaluation of water reuse criteria <strong>for</strong> Minnesota.<br />
Limits and Monitoring <strong>for</strong> Pathogenic Protozoa<br />
At present, no states have set limits on pathogenic organisms <strong>for</strong> any nonpotable reuse<br />
application, but at least two states require monitoring <strong>for</strong> specific pathogens under<br />
certain circumstances. In an ef<strong>for</strong>t to learn more about the possible presence of<br />
protozoan pathogens in reclaimed water that receives tertiary treatment and a high level<br />
of disinfection, Florida’s reuse rules contain parasite monitoring requirements. Facilities<br />
(ith capacities of 1.0 mgd and larger are required to sample their reclaimed water <strong>for</strong><br />
Giardia and Cryptosporidium at least once every two years. Smaller facilities must sample<br />
at least once every five years. Samples are required to be taken following the<br />
disinfection process.<br />
Cali<strong>for</strong>nia requires that reclaimed water used <strong>for</strong> nonrestricted recreational<br />
impoundments be monitored <strong>for</strong> enteric viruses, Giardia, and Cryptosporidium if tertiary<br />
Craddock Consulting Engineers B-10<br />
In Association with CDM & James Crook<br />
WWReuse Tm1_Appendix B_Regulatory.doc
Appendix B<br />
Status of <strong>Water</strong> Reuse Regulations and Guidelines<br />
treatment does not include a sedimentation process between the chemical coagulation<br />
and filtration processes. Monthly sampling is required <strong>for</strong> the first year of operation,<br />
and quarterly sampling is required during the second year of operation. Sampling may<br />
be discontinued after the second year of operation with approval of the Cali<strong>for</strong>nia<br />
Department of Health Services (DHS).<br />
Currently, there are no states with monitoring requirements <strong>for</strong> other pathogens.<br />
Disinfection Requirements<br />
Where chlorine is used as the disinfectant, several states require continuous monitoring of<br />
chlorine residual and specify both the chlorine residual and contact time that must be met,<br />
particularly <strong>for</strong> reclaimed water uses where human contact with the water is likely to<br />
occur. Required chlorine residuals and disinfection contact times differ substantially from<br />
state-to-state ranging from 1 to 5 mg/L and 15 to 90 minutes at peak flow, respectively.<br />
Where UV is used <strong>for</strong> disinfection, most states do not specify UV dosage or design or<br />
operating conditions, although some state regulations require compliance with the<br />
Ultraviolet Disinfection Guidelines <strong>for</strong> Drinking <strong>Water</strong> and <strong>Water</strong> Reuse [National <strong>Water</strong><br />
Research Institute, 2003].<br />
While the need to maintain a chlorine residual in reclaimed water distribution systems to<br />
prevent odors, slimes, and bacterial regrowth was recognized early in the development of<br />
dual water systems [Okun, 1979], only in the last decade or so have regulatory agencies<br />
begun to require such residuals. A few states now require maintenance of a chlorine<br />
residual (typically 0.5 or 1.0 mg/L) in distribution systems carrying reclaimed water.<br />
Facilities using UV disinfection will need to add chlorination facilities to meet residual<br />
requirements.<br />
Treatment Facility Reliability<br />
Some states have adopted treatment reliability requirements to insure that inadequately<br />
treated reclaimed water is not reused. Generally, requirements consist of alarms<br />
warning of power failure or failure of essential unit processes, automatic standby power<br />
sources, emergency storage or disposal provisions, and the provision that each<br />
treatment process be equipped with multiple units or a back-up unit. Reliability<br />
requirements <strong>for</strong> Cali<strong>for</strong>nia and Florida are presented below as examples.<br />
Cali<strong>for</strong>nia Requirements. Cali<strong>for</strong>nia’s <strong>Water</strong> <strong>Recycling</strong> Criteria provide design and<br />
operational considerations covering alarms, power supply, emergency storage and<br />
disposal, wastewater treatment processes, and chemical supply, storage and feed<br />
facilities. For treatment processes, a variety of reliability features are acceptable. For<br />
example, <strong>for</strong> all biological treatment processes one of the following is required: (1) alarm<br />
(failure and power loss) and multiple units capable of producing oxidized wastewater<br />
(i.e., secondary treatment) with one unit not in operation; (2) alarm (failure and power<br />
loss) and short-term (at least 24 hours) storage or disposal provisions and stand-by<br />
replacement equipment; or (3) alarm (failure and power loss) and long-term (at least 20<br />
days) storage or disposal provisions. Similar reliability requirements apply to other<br />
treatment processes.<br />
Craddock Consulting Engineers B-11<br />
In Association with CDM & James Crook<br />
WWReuse Tm1_Appendix B_Regulatory.doc
Appendix B<br />
Status of <strong>Water</strong> Reuse Regulations and Guidelines<br />
Florida Requirements. Florida requires Class I reliability as defined by the U.S. EPA<br />
[U.S. Environmental Protection Agency, 1974] at water reclamation facilities where<br />
filtration and high-level disinfection are provided. Class I reliability requires multiple<br />
treatment units or back-up units and a secondary power source. In addition, a<br />
minimum of 1 day of reject storage is required to store reclaimed water of unacceptable<br />
quality <strong>for</strong> additional treatment. Florida also requires staffing at the water reclamation<br />
facility 24 hours/day, 7 days/week or 6 hours/day, 7 days/week as long as reclaimed<br />
water is delivered to the reuse system only during periods when a qualified operator is<br />
present. Operator presence can be reduced to 6 hours/day if additional reliability<br />
features are provided.<br />
Storage Requirements<br />
Current regulations and guidelines regarding storage requirements are primarily based<br />
upon the need to limit or prevent surface water discharge and are not related to storage<br />
required to meet diurnal or seasonal variations in supply and demand. Storage<br />
requirements vary from state to state and are generally dependent upon geographic<br />
location, climate, and site conditions. A minimum storage volume equal to 3 days of the<br />
average design flow is typical in water-short states with warm climates, while more than<br />
200 days of storage are required in some northern states because of the high number of<br />
non-irrigation days due to high rainfall or freezing temperatures.<br />
Most states that specify storage requirements do not differentiate between operational<br />
and seasonal storage. The majority of states that have storage requirements in their<br />
regulations or guidelines require that a water balance be per<strong>for</strong>med on the water reuse<br />
system, taking into account all inputs and outputs of water to the system based on a<br />
specified rainfall recurrence interval.<br />
Reclaimed <strong>Water</strong> Application Rates<br />
Most state regulations do not include requirements or recommendations regarding<br />
reclaimed water irrigation application rates, as these are generally based on plant or<br />
crop irrigated and site-specific conditions. Of the states that do recommend application<br />
rates, the maximum recommended hydraulic loading rate typically is 2 inches/wk).<br />
Ground <strong>Water</strong> Monitoring<br />
Ground water monitoring is often required when reclaimed water is used <strong>for</strong> irrigation<br />
or <strong>for</strong> impoundments that are not sealed to prevent seepage. In general, the ground<br />
water monitoring programs require that one well be placed hydraulically upgradient of<br />
the water reuse site to assess background and incoming ground water conditions within<br />
the aquifer in question and one or more wells be placed hydraulically down gradient of<br />
the reuse site to monitor compliance with ground water quality requirements. Ground<br />
water monitoring programs associated with reclaimed water irrigation generally focus<br />
on water quality in shallow aquifers. Sampling parameters and frequency of sampling<br />
are generally considered on a case-by-case basis.<br />
Craddock Consulting Engineers B-12<br />
In Association with CDM & James Crook<br />
WWReuse Tm1_Appendix B_Regulatory.doc
Setback Distances<br />
Appendix B<br />
Status of <strong>Water</strong> Reuse Regulations and Guidelines<br />
Many states have established setback distances between reclaimed water use areas and<br />
surface waters, potable water supply wells, or areas accessible to the public. Setbacks<br />
are usually required where reclaimed water is used <strong>for</strong> spray irrigation, cooling water in<br />
towers, and other areas where spray or mist is <strong>for</strong>med. Setbacks may also be required at<br />
irrigation or impoundment sites to prevent percolated reclaimed water from reaching<br />
potable water supply wells. Setback distances vary depending on the quality of<br />
reclaimed water, type of reuse, method of application, and purpose of the setback, e.g.,<br />
to avoid human contact with the water or protect potable water sources from<br />
contamination. Setback distances, where required, vary considerably from state-to-state,<br />
and range from 50 feet to as much and 800 feet. Some states do not require setback<br />
distances from irrigated areas to areas accessible to the public if a high level of treatment<br />
and disinfection is provided.<br />
Cross Connection Control<br />
Cross connection control regulations to prevent interconnecting reclaimed and potable<br />
water pipelines are included in some state water reuse criteria. Regulations often<br />
address: identification of transmission and distribution lines and appurtenances via<br />
color-coding, taping, or other means; separation of reclaimed water and potable water<br />
lines; allowable pressures; surveillance; and backflow prevention devices. At use areas<br />
that receive both potable and reclaimed water, backflow prevention devices are usually<br />
required on the potable water supply line to each site to reduce the potential of<br />
contaminating the potable drinking water system in the event of a cross-connection at a use<br />
area. Direct connections between reclaimed water and potable water lines are not allowed<br />
in any state.<br />
Cali<strong>for</strong>nia’s <strong>Water</strong> <strong>Recycling</strong> Criteria require compliance with the Cali<strong>for</strong>nia<br />
Department of Health Services cross connection control regulations [State of<br />
Cali<strong>for</strong>nia, 2000b]. Those regulations require that water systems serving residences<br />
through a dual water system that uses reclaimed water <strong>for</strong> landscape irrigation must,<br />
as a minimum, be protected by a double check valve assembly backflow preventer.<br />
The same requirement applies to a public water system in buildings using reclaimed<br />
water in a separate piping system within buildings <strong>for</strong> fire protection. A reduced<br />
pressure principle backflow prevention device is required as a minimum to protect the<br />
potable system at sites other than those mentioned above. An air gap separation is<br />
required where a public water system is used to supplement a reclaimed water supply.<br />
Cali<strong>for</strong>nia’s criteria <strong>for</strong> dual plumbed systems within buildings include the following<br />
requirements:<br />
Internal use of reclaimed water within any individually-owned residential unit,<br />
including multiplexes or condominiums is prohibited;<br />
Submission of a report that includes a detailed description of the intended use area,<br />
plans and specifications, and cross connection control provisions and testing<br />
procedures;<br />
Craddock Consulting Engineers B-13<br />
In Association with CDM & James Crook<br />
WWReuse Tm1_Appendix B_Regulatory.doc
Testing <strong>for</strong> possible cross connections at least every four years;<br />
Appendix B<br />
Status of <strong>Water</strong> Reuse Regulations and Guidelines<br />
Notification of any incidence of backflow from the reclaimed water system into the<br />
potable water system within 24 hours of discovery;<br />
Con<strong>for</strong>mance to the DHS cross connection control regulations; and<br />
Facilities that produce or process food products or beverages can use reclaimed water<br />
internally only <strong>for</strong> fire suppression systems.<br />
State Regulations <strong>for</strong> Indirect Potable Reuse<br />
There are no direct potable reuse projects in the United States, and no states have<br />
developed regulations allowing such use. From a regulatory standpoint, few states have<br />
addressed the challenge of developing regulations <strong>for</strong> indirect potable reuse. Cali<strong>for</strong>nia<br />
and Florida are in the <strong>for</strong>efront of developing discrete criteria relating to planned<br />
indirect potable reuse of reclaimed water. Some of the other states rely on U.S. EPA’s<br />
Underground Injection Control regulations to protect potable ground water basins,<br />
while some states prohibit indirect potable reuse altogether. There are no federal<br />
regulations that specifically address potable reuse of reclaimed water.<br />
State of Cali<strong>for</strong>nia<br />
The existing Cali<strong>for</strong>nia <strong>Water</strong> <strong>Recycling</strong> Criteria include general requirements <strong>for</strong> ground<br />
water recharge of domestic water supply aquifers by surface spreading. The regulations<br />
state that reclaimed water used <strong>for</strong> ground water recharge of domestic water supply<br />
aquifers by surface spreading “shall be at all times of a quality that fully protects public<br />
health” and that DHS recommendations “will be based on all relevant aspects of each<br />
project, including the following factors: treatment provided; effluent quality and quantity;<br />
spreading area operations; soil characteristics; hydrogeology; residence time; and distance<br />
to withdrawal.” Until more definitive criteria are adopted, proposals to recharge ground<br />
water by either surface spreading or injection will be evaluated on a case-by-case basis,<br />
although draft ground water recharge criteria described below will guide DHS decisions.<br />
Cali<strong>for</strong>nia has prepared draft criteria <strong>for</strong> ground water recharge (the most recent being<br />
in 2004), which are summarized in Table 5.<br />
State of Florida<br />
Florida’s water reuse rules pertaining to ground water recharge and indirect potable<br />
reuse are summarized in Table 6. Although not specifically designated as indirect<br />
potable reuse systems, ground water recharge projects located over potable aquifers<br />
could function as an indirect potable reuse system. If more than 50 percent of the<br />
wastewater applied to the systems is collected after percolation, the systems are<br />
considered to be effluent disposal systems and not beneficial reuse. Loading to these<br />
systems is limited to 9 inches/day. For systems having higher loading rates or a more<br />
direct connection to an aquifer than normally encountered, reclaimed water must<br />
receive secondary treatment, filtration, disinfection, and must meet primary and<br />
secondary drinking water standards.<br />
Craddock Consulting Engineers B-14<br />
In Association with CDM & James Crook<br />
WWReuse Tm1_Appendix B_Regulatory.doc
Appendix B<br />
Status of <strong>Water</strong> Reuse Regulations and Guidelines<br />
Table 5. Cali<strong>for</strong>nia Draft Ground <strong>Water</strong> Recharge Regulations<br />
Craddock Consulting Engineers B-15<br />
In Association with CDM & James Crook<br />
WWReuse Tm1_Appendix B_Regulatory.doc<br />
Contaminant Type<br />
Pathogenic Microorganisms<br />
Type of Recharge<br />
Surface spreading Subsurface injection<br />
Filtration ≤ 2 NTU<br />
Disinfection 5-log virus inactivation a , ≤ 2.2 total coli<strong>for</strong>m per 100 ml<br />
Retention time<br />
underground<br />
6 months 12 months<br />
Horizontal<br />
separation b<br />
500 ft 2000 ft<br />
Regulated Contaminants<br />
Drinking water<br />
standards<br />
Total nitrogen<br />
Unregulated Contaminants<br />
TOC e in filtered<br />
wastewater<br />
TOC in recycled<br />
water<br />
Recycled water<br />
contribution (RWC)<br />
Meet all drinking water MCLs c (except nitrogen) and new federal and state<br />
regulations as they are adopted<br />
Level specified by DHS <strong>for</strong> existing project with no RWC increase<br />
≤5 mg/L <strong>for</strong> new project or increased RWC at existing project<br />
Or NO2 d and NO3 d consistently met in mound (blending allowed)<br />
TOC ≤ 16 mg/L in any portion of the filtered wastewater not subjected to<br />
reverse osmosis (RO) treatment<br />
RO treatment as needed to achieve:<br />
TOC level specified by DHS <strong>for</strong><br />
existing project with no RWC<br />
increase<br />
TOC ≤ (0.5 mg/L)/RWC (new<br />
project or increased RWC at existing<br />
project)<br />
Compliance point is in recycled water<br />
or mound f (no blending)<br />
100% RO treatment to achieve:<br />
TOC level specified by DHS<br />
<strong>for</strong> existing project with no<br />
RWC increase<br />
TOC ≤ (0.5 mg/L)/RWC (new<br />
project or increased RWC at<br />
existing project)<br />
≤ 50 % subject to above requirements<br />
50-100 % subject to additional requirements<br />
a<br />
The virus log reduction requirement may be met by a combination of removal and inactivation.<br />
b<br />
May be reduced upon demonstration via tracer testing that the required detention time will be met at the<br />
proposed alternative distance.<br />
c<br />
MCL=maximum contaminant level.<br />
d<br />
NO2=nitrite and NO3=nitrate<br />
e<br />
TOC=total organic carbon<br />
f<br />
If mound monitoring approved.<br />
Source: Adapted from Cali<strong>for</strong>nia Department of Health Services [2004].
Appendix B<br />
Status of <strong>Water</strong> Reuse Regulations and Guidelines<br />
Table 6. Florida <strong>Water</strong> Reuse Rules <strong>for</strong> Ground <strong>Water</strong> Recharge and Indirect<br />
Potable Reuse<br />
Type of <strong>Use</strong> <strong>Water</strong> Quality Limits<br />
200 fecal coli/100 ml<br />
Treatment Required<br />
Ground water recharge via 20 mg/L CBOD5<br />
Secondary<br />
rapid infiltration basins (RIBs) 20 mg/L TSS<br />
12 mg/L NO3 (as N)<br />
No detectable fecal coli/100 ml<br />
Disinfection<br />
Ground water recharge via<br />
RIBs in unfavorable<br />
conditions<br />
Ground water recharge or<br />
injection to ground waters<br />
having TDS < 3000 mg/L<br />
Ground water recharge or<br />
injection to ground waters<br />
having TDS 3,000-10,000<br />
mg/L<br />
Indirect potable reuse:<br />
discharge to Class I surface<br />
waters (used <strong>for</strong> public water<br />
supply)<br />
Craddock Consulting Engineers B-16<br />
In Association with CDM & James Crook<br />
WWReuse Tm1_Appendix B_Regulatory.doc<br />
20 mg/L CBOD5<br />
5.0 mg/L TSS<br />
Primary a & secondary drinking<br />
water standards<br />
10 mg/L total N<br />
No detectable total coli/100 ml<br />
20 mg/LCBOD5<br />
5.0 mg/L TSS<br />
3.0 mg/L TOC<br />
0.2 mg/L TOX b<br />
10 mg/L total N<br />
Primary a & secondary drinking<br />
water standards<br />
No detectable total coli/100 ml<br />
20 mg/LCBOD5<br />
5.0 mg/L TSS<br />
10 mg/L total N<br />
Primary drinking water standards a<br />
No detectable total coli/100 ml<br />
20 mg/LCBOD5<br />
5.0 mg/L TSS<br />
3.0 mg/L TOC<br />
10 mg/L total N<br />
Primary a & secondary drinking<br />
water standards<br />
WQBELs c may apply<br />
Secondary<br />
Filtration<br />
Disinfection<br />
Secondary<br />
Filtration<br />
Disinfection<br />
Multiple barriers <strong>for</strong> control<br />
of pathogens & organics<br />
Pilot testing required<br />
Secondary<br />
Filtration<br />
Disinfection<br />
Secondary<br />
Filtration<br />
Disinfection<br />
a Except <strong>for</strong> asbestos.<br />
b TOX = total organic halogen.<br />
c WQBELs are water quality based effluent limitations to ensure that water quality standards in a<br />
receiving body of water will not be violated.<br />
Source: Adapted from Florida Department of Environmental Protection [1999].<br />
The Florida regulations include requirements <strong>for</strong> planned indirect potable reuse by<br />
injection into water supply aquifers and augmentation of surface supplies. A minimum<br />
horizontal separation distance of 500 feet is required between reclaimed water injection<br />
wells and potable water supply wells. The injection regulations pertain to G-I, G-II, and<br />
F-I ground waters, all of which are classified as potable aquifers. Reclaimed water must<br />
meet G-II ground water standards prior to injection. G-II ground water standards are,<br />
<strong>for</strong> the most part, primary and secondary drinking water standards. Florida considers
Appendix B<br />
Status of <strong>Water</strong> Reuse Regulations and Guidelines<br />
discharges to Class I surface waters (public water supplies) as indirect potable reuse.<br />
Discharges less than 24 hours travel time upstream from Class I waters are also<br />
considered as indirect potable reuse. Outfalls <strong>for</strong> surface water discharges cannot be<br />
located within 500 feet of existing or approved potable water intakes within Class I<br />
surface waters. Pilot testing is required prior to implementation of injection or surface<br />
water augmentation projects.<br />
Other States<br />
In some states, regulations addressing indirect potable reuse are independent from the<br />
state’s water reuse regulations. For example, the use of reclaimed water <strong>for</strong> ground<br />
water recharge in Arizona is regulated under statutes and administrative rules<br />
administered by the Arizona Department of Environmental Quality (ADEQ) and the<br />
Arizona Department of <strong>Water</strong> Resources (ADWR). Several different permits are<br />
required by these agencies prior to implementation of a ground water recharge project.<br />
In general, ADEQ regulates ground water quality and ADWR manages ground water<br />
supply. All aquifers in Arizona currently are classified <strong>for</strong> drinking water protected use,<br />
and the state has adopted National Primary Drinking <strong>Water</strong> Maximum Contaminant<br />
Levels (MCLs) as aquifer water quality standards. These standards apply to all ground<br />
water in saturated <strong>for</strong>mations that yield more than 5 gallons per day (gpd) of water.<br />
Any ground water recharge project involving injection of reclaimed water into an<br />
aquifer is required to demonstrate compliance with aquifer water quality standards at<br />
the point of injection.<br />
Regulation Mandates<br />
States such as Cali<strong>for</strong>nia and Florida have regulations that mandate water reuse under<br />
certain conditions. The Florida <strong>Water</strong> Policy [Florida Department of Environmental<br />
Protection, 1995] establishes a mandatory reuse program that is actively en<strong>for</strong>ced. The<br />
policy requires that the state’s water management districts identify water resource<br />
caution areas that have water supply problems that have become critical or are<br />
anticipated to become critical within the next 20 years. State legislation requires<br />
preparation of water reuse feasibility studies <strong>for</strong> treatment facilities located within the<br />
water resource caution areas, and a “reasonable” amount of reclaimed water use from<br />
municipal wastewater treatment facilities is required within the designated water<br />
resource caution areas unless reuse is not economically, environmentally, or technically<br />
feasible. <strong>Water</strong> reuse also may be required outside of designated water resource caution<br />
areas if reclaimed water is readily available, reuse is economically, environmentally, and<br />
technologically feasible, and rules governing the imposition of requirements <strong>for</strong> reuse<br />
have been adopted in those areas by the water management district having jurisdiction.<br />
In Cali<strong>for</strong>nia, laws and regulations exist that mandate water reuse under certain<br />
conditions. Section 13550 of the Cali<strong>for</strong>nia <strong>Water</strong> Code states that the use of potable<br />
domestic water <strong>for</strong> nonpotable uses, including, but not limited to, cemeteries, golf<br />
courses, highway landscaped areas, and industrial and irrigation uses, is a waste or an<br />
unreasonable use of the water if reclaimed water is available which meets certain<br />
conditions [Cali<strong>for</strong>nia State <strong>Water</strong> Resources Control Board, 2000]. The conditions are:<br />
Craddock Consulting Engineers B-17<br />
In Association with CDM & James Crook<br />
WWReuse Tm1_Appendix B_Regulatory.doc
Appendix B<br />
Status of <strong>Water</strong> Reuse Regulations and Guidelines<br />
the source of reclaimed water is of adequate quality <strong>for</strong> these uses and is available <strong>for</strong><br />
these uses; reclaimed water may be furnished <strong>for</strong> these uses at a reasonable cost to the<br />
user; after concurrence with the State Department of Health Services, the use of<br />
reclaimed water from the proposed source will not be detrimental to public health; and<br />
use of reclaimed water <strong>for</strong> these uses will not adversely affect downstream water rights,<br />
will not degrade water quality, and is determined not to be injurious to plant life, fish<br />
and wildlife. The <strong>Water</strong> Code mandates that no person or public agency shall use water<br />
from any source or quality suitable <strong>for</strong> potable domestic use <strong>for</strong> nonpotable uses if<br />
suitable reclaimed water is available and meets the conditions stated above. Other<br />
sections of the code allow <strong>for</strong> mandating reclaimed water use <strong>for</strong> irrigation of residential<br />
landscaping, industrial cooling applications, and toilet and urinal flushing in<br />
nonresidential buildings. Some local jurisdictions in the state have taken action to<br />
require the use of reclaimed water is certain situations.<br />
U.S. EPA Guidelines <strong>for</strong> <strong>Water</strong> Reuse<br />
In recognition of the increasing role of water reuse as an integral component of the<br />
nation's water resources management – and to facilitate the orderly planning, design, and<br />
implementation of water reuse projects – the U.S. Environmental Protection Agency<br />
(EPA), in conjunction with the U.S. Agency <strong>for</strong> International Development, published<br />
Guidelines <strong>for</strong> <strong>Water</strong> Reuse in 1992 [U.S. Environmental Protection Agency, 1992]. The<br />
U.S. EPA took the position that national water reuse standards were not necessary and<br />
comprehensive guidelines, coupled with flexible state regulations, would foster increased<br />
consideration and implementation of water reuse projects. The guidelines were updated<br />
in 2004 [U.S. Environmental Protection Agency, 2004] to include technological advances,<br />
research data, and other in<strong>for</strong>mation generated in the last decade. The guidelines<br />
address various aspects of water reuse and include recommended treatment processes,<br />
reclaimed water quality limits, monitoring frequencies, setback distances, and other<br />
controls <strong>for</strong> various water reuse applications. The suggested guidelines <strong>for</strong> wastewater<br />
treatment and reclaimed water quality are presented in Appendix A.<br />
It is explicitly stated in the Guidelines <strong>for</strong> <strong>Water</strong> Reuse that the recommended treatment<br />
unit processes and water quality limits presented in the guidelines “are not intended to be<br />
used as definitive water reclamation and reuse criteria. They are intended to provide<br />
reasonable guidance <strong>for</strong> water reuse opportunities, particularly in states that have not<br />
developed their own criteria or guidelines.” [U.S. Environmental Protection Agency,<br />
2004].<br />
References<br />
Cali<strong>for</strong>nia Department of Health Services. 2004. Draft Groundwater Recharge Regulations: 12-1-04.<br />
Cali<strong>for</strong>nia Department of Health Services, Drinking <strong>Water</strong> Technical Program Branch, Sacramento, Cali<strong>for</strong>nia.<br />
Cali<strong>for</strong>nia State <strong>Water</strong> Resources Control Board. 2000. Porter-Cologne <strong>Water</strong> Quality Control Act.<br />
Cali<strong>for</strong>nia <strong>Water</strong> Code, Division 7. Compiled by the State <strong>Water</strong> Resources Control Board, Sacramento,<br />
Cali<strong>for</strong>nia.<br />
Craddock Consulting Engineers B-18<br />
In Association with CDM & James Crook<br />
WWReuse Tm1_Appendix B_Regulatory.doc
Appendix B<br />
Status of <strong>Water</strong> Reuse Regulations and Guidelines<br />
Florida Department of Environmental Protection. 1995. <strong>Water</strong> Policy. Chapter 62-40, Florida Administrative<br />
Code. Florida Department of Environmental Protection, Tallahassee, Florida.<br />
Florida Department of Environmental Protection. 1999. Reuse of Reclaimed <strong>Water</strong> and Land Application.<br />
Chapter 62-610, Florida Administrative Code. Florida Department of Environmental Protection, Tallahassee,<br />
Florida.<br />
National <strong>Water</strong> Research Institute. 2003. Ultraviolet Disinfection Guidelines <strong>for</strong> Drinking <strong>Water</strong> and<br />
<strong>Water</strong> Reuse. Report Number NWRI-2003-06, National <strong>Water</strong> Research Institute, Fountain Valley,<br />
Cali<strong>for</strong>nia.<br />
Okun, D.A. 1979. Criteria <strong>for</strong> Reuse of <strong>Wastewater</strong> <strong>for</strong> Nonpotable Urban <strong>Water</strong> Supply Systems in<br />
Cali<strong>for</strong>nia. Report prepared <strong>for</strong> the Cali<strong>for</strong>nia Department of Health Services, Sanitary Engineering Section,<br />
Berkeley, Cali<strong>for</strong>nia.<br />
State of Cali<strong>for</strong>nia. 2000a. <strong>Water</strong> <strong>Recycling</strong> Criteria. Title 22, Division 4, Chapter 3, Cali<strong>for</strong>nia Code of<br />
Regulations. Cali<strong>for</strong>nia Department of Health Services, Drinking <strong>Water</strong> Program, Sacramento, Cali<strong>for</strong>nia.<br />
State of Cali<strong>for</strong>nia. 2000b. Cross-Connection Control by <strong>Water</strong> <strong>Use</strong>rs. Health & Safety Code, Division<br />
104, Part 12, Chapter 5, Article 2, Cali<strong>for</strong>nia Department of Health Services, Sacramento, Cali<strong>for</strong>nia.<br />
U.S. Environmental Protection Agency. 1974. Design Criteria <strong>for</strong> Mechanical, Electric, and Fluid System and<br />
Component Reliability. MCD-05. EPA-430-99-74-001, U.S. Environmental Protection Agency, Office of<br />
<strong>Water</strong> Program Operations, Washington, DC. 1974.<br />
U.S. Environmental Protection Agency. 1992. Guidelines <strong>for</strong> <strong>Water</strong> Reuse. EPA/625/R-92/004, U.S.<br />
Environmental Protection Agency, Office of Research and Development, Center <strong>for</strong> Environmental<br />
Research In<strong>for</strong>mation, Cincinnati, Ohio.<br />
U.S. Environmental Protection Agency. 2004. Guidelines <strong>for</strong> <strong>Water</strong> Reuse. EPA/625/R-04/108, U.S.<br />
Environmental Protection Agency, Office of Research and Development, Cincinnati, Ohio.<br />
Craddock Consulting Engineers B-19<br />
In Association with CDM & James Crook<br />
WWReuse Tm1_Appendix B_Regulatory.doc
Craddock Consulting Engineers<br />
In Association with CDM & James Crook<br />
Appendix C<br />
<strong>Water</strong>shed Inventory Data
Craddock Consulting Engineers<br />
In Association with CDM & James Crook
Table 3.8a. <strong>Industrial</strong> <strong>Water</strong> <strong>Use</strong> in the Cedar River <strong>Water</strong>shed<br />
Industry Category Groundwater<br />
2004 <strong>Water</strong> <strong>Use</strong>, mgd<br />
Surface <strong>Water</strong> Total<br />
Agricultural Processing 3.20 0.00 3.20<br />
Petroleum - Chemical Processig, ethanol 0.56 0.02 0.58<br />
Sand & Gravel Washing 0.00 0.08 0.08<br />
Steam Power Cooling - Wet Tower 0.29 0.00 0.29<br />
Total 4.05 0.10 4.15<br />
Table 3.8b. WWTPs in the Cedar River <strong>Water</strong>shed<br />
Facility Name<br />
Design<br />
Capacity, mgd<br />
Ann Avg Flow, mgd<br />
2003 2004 2005<br />
Albert Lea WWTP 18.380 4.233<br />
Austin WWTP 8.475 5.42<br />
Total 26.855 9.653<br />
Table 3.8c. Industries in the Cedar River <strong>Water</strong>shed<br />
Resource 2004 <strong>Water</strong> <strong>Use</strong>, Distance to WWTP,<br />
Industry Name<br />
Name<br />
mgd<br />
miles Closest WWTP Industry Category<br />
HORMEL FOODS CORP Ground <strong>Water</strong> 0.000 2.0 Austin Agricultural Processing<br />
HORMEL FOODS CORP Ground <strong>Water</strong> 0.681 2.0 Austin Agricultural Processing<br />
HORMEL FOODS CORP Ground <strong>Water</strong> 1.183 3.5 Austin Agricultural Processing<br />
HORMEL FOODS CORP Ground <strong>Water</strong> 1.334 3.5 Austin Agricultural Processing<br />
VENTURA FOODS LLC Ground <strong>Water</strong> 0.000 5.7 Albert Lea Agricultural Processing<br />
AGRA RESOURCES COOP Ground <strong>Water</strong> 0.183 9.7 Albert Lea Petroleum - Chemical Processing<br />
AGRA RESOURCES COOP Ground <strong>Water</strong> 0.208 9.7 Albert Lea Petroleum - Chemical Processing<br />
AGRA RESOURCES COOP Ground <strong>Water</strong> 0.172 9.7 Albert Lea Petroleum - Chemical Processing<br />
BISHOP EXCAVATING INC Surface <strong>Water</strong> 0.000 >10 Austin Sand and Gravel Washing<br />
ULLAND BROTHERS INC Surface <strong>Water</strong> 0.060 1.5 Austin Sand and Gravel Washing<br />
ULLAND BROTHERS, INC Surface <strong>Water</strong> 0.020 5.0 Austin Sand and Gravel Washing<br />
AUSTIN UTILITIES Ground <strong>Water</strong> 0.287 4.0 Austin STEAM POWER COOLING - WET TOWER
WATER USE (MGD)<br />
WATER USE (MGD)<br />
3.5<br />
3<br />
2.5<br />
2<br />
1.5<br />
1<br />
0.5<br />
0<br />
0.35<br />
0.3<br />
0.25<br />
0.2<br />
0.15<br />
0.1<br />
0.05<br />
0<br />
241 244<br />
USE CODE<br />
246<br />
223<br />
USE CODE<br />
Ground <strong>Water</strong><br />
Surface <strong>Water</strong><br />
241 Agricultural Processing<br />
244 Sand and Gravel<br />
Washing<br />
246 Petroleum-chemical<br />
Processing, ethanol<br />
Figure 3.8a. <strong>Industrial</strong> Processing <strong>Water</strong> <strong>Use</strong> in the Cedar River <strong>Water</strong>shed, 2004<br />
Ground <strong>Water</strong><br />
Surface <strong>Water</strong><br />
223 Steam Power<br />
Cooling - Wet Tower<br />
Figure 3.8b. Power Generation <strong>Water</strong> <strong>Use</strong> in the Cedar River <strong>Water</strong>shed, 2004
WATER USE (MGD)<br />
WATER USE (MGD)<br />
3.5<br />
3<br />
2.5<br />
2<br />
1.5<br />
1<br />
0.5<br />
0<br />
0.35<br />
0.3<br />
0.25<br />
0.2<br />
0.15<br />
0.1<br />
0.05<br />
0<br />
241 244<br />
USE CODE<br />
246<br />
223<br />
USE CODE<br />
Ground <strong>Water</strong><br />
Surface <strong>Water</strong><br />
241 Agricultural Processing<br />
244 Sand and Gravel<br />
Washing<br />
246 Petroleum-chemical<br />
Processing, ethanol<br />
Figure 3.8a. <strong>Industrial</strong> Processing <strong>Water</strong> <strong>Use</strong> in the Cedar River <strong>Water</strong>shed, 2004<br />
Ground <strong>Water</strong><br />
Surface <strong>Water</strong><br />
223 Steam Power<br />
Cooling - Wet Tower<br />
Figure 3.8b. Power Generation <strong>Water</strong> <strong>Use</strong> in the Cedar River <strong>Water</strong>shed, 2004
Table 3.9a. <strong>Industrial</strong> <strong>Water</strong> <strong>Use</strong> in the Des Moines River <strong>Water</strong>shed<br />
Industry Category Groundwater<br />
2004 <strong>Water</strong> <strong>Use</strong>, mgd<br />
Surface <strong>Water</strong> Total<br />
Agricultural Processing 0.56 0.00 0.56<br />
Sand & Gravel Washing 0.00 0.10 0.10<br />
Total 0.56 0.10 0.66<br />
Table 3.9b. WWTPs in the Des Moines River <strong>Water</strong>shed<br />
Facility Name<br />
Design<br />
Capacity, mgd<br />
Ann Avg Flow, mgd<br />
2003 2004 2005<br />
Windom WWTP 1.830 1.074<br />
Worthington WWTP 4.000 1.992<br />
Total 5.830 3.066<br />
Table 3.9c. Industries in the Des Moines River <strong>Water</strong>shed<br />
2004 <strong>Water</strong> <strong>Use</strong>, Distance to WWTP,<br />
Industry Name Resource Name mgd<br />
miles Closest WWTP Industry Category<br />
HERON LAKE, CITY OF Ground <strong>Water</strong> 0.089 9.6 Windom Agricultural Processing<br />
HERON LAKE, CITY OF Ground <strong>Water</strong> 0.098 9.6 Windom Agricultural Processing<br />
PM WINDOM Ground <strong>Water</strong> 0.200 6.5 Windom Agricultural Processing<br />
PM WINDOM Ground <strong>Water</strong> 0.077 6.5 Windom Agricultural Processing<br />
PM WINDOM Ground <strong>Water</strong> 0.098 6.5 Windom Agricultural Processing<br />
WORTHINGTON RENDERING Surface <strong>Water</strong> 0.003 1.7 Worthington Agricultural Processing<br />
WILLETT GRAVEL CO Surface <strong>Water</strong> 0.001 >10 Windom Non-Metallic Processing<br />
MUECKE SAND & GRAVEL, R A Surface <strong>Water</strong> 0.100 >10 Windom Sand and Gravel Washing<br />
WINDOM READY MIX INC Surface <strong>Water</strong> 0.000 3.3 Windom Sand and Gravel Washing<br />
WINDOM READY MIX INC Surface <strong>Water</strong> 0.000 7.1 Windom Sand and Gravel Washing
WATER USE (MGD)<br />
0.6<br />
0.5<br />
0.4<br />
0.3<br />
0.2<br />
0.1<br />
0<br />
241 244<br />
USE CODE<br />
Ground <strong>Water</strong><br />
Surface <strong>Water</strong><br />
241 Agricultural Processing<br />
244 Sand and Gravel Washing<br />
Figure 3.9a <strong>Industrial</strong> Processing <strong>Water</strong> <strong>Use</strong> in the Des Moines River <strong>Water</strong>shed, 2004
Table 3.10a. <strong>Industrial</strong> <strong>Water</strong> <strong>Use</strong> in the Lower Mississippi River <strong>Water</strong>shed<br />
2004 <strong>Water</strong> <strong>Use</strong>, mgd<br />
Industry Category Groundwater Surface <strong>Water</strong> Total<br />
Agricultural Processing 2.89 0.00 2.89<br />
<strong>Industrial</strong> Process Cooling - Once Through 0.38 0.01 0.39<br />
Metal Processing 0.70 0.00 0.70<br />
Non-Metallic Processing 1.02 0.00 1.02<br />
Nuclear Power Plant 0.09 505.84 505.93<br />
Petroleum - Chemical Processing, ethanol 7.00 0.00 7.00<br />
Power Generation 0.55 0.00 0.55<br />
Sand & Gravel Washing 0.27 1.58 1.85<br />
Steam Power Cooling - Once Through 0.00 71.38 71.38<br />
Steam Power Cooling - Wet Tower 0.41 0.00 0.41<br />
Total 13.31 578.81 592.12<br />
Table 3.10b. WWTPs in the Lower Mississippi River <strong>Water</strong>shed<br />
Facility Name<br />
Design<br />
Capacity, mgd<br />
Ann Avg Flow, mgd<br />
Flow as % of<br />
Design Capacity<br />
2003 2004 2005 2005<br />
Faribault WWTP 7.000 3.697 53%<br />
Lake City WWTP 1.520 0.558 37%<br />
Met Council - Empire WWTP* 24.000 8.458 35%<br />
Met Council - Rosemount WWTP* 1.300 0.903 69%<br />
Northfield WWTP 5.200 2.067 40%<br />
Owatonna WWTP 5.000 3.531 71%<br />
Plainview-Elgin Sanitary District WWTP 1.421 1.053 74%<br />
Red Wing WWTP 4.000 2.057 51%<br />
Rochester <strong>Water</strong> Reclamation Plant 19.100 13.462 70%<br />
Stewartville WWTP 1.111 0.531 48%<br />
Whitewater River Regional WWTP 1.120 0.701 63%<br />
Winona WWTP 6.500 3.947 61%<br />
Total 77.272 40.965 53%<br />
* Design capacity changed per MCES instructions
Table 3.10d. Industries in the Lower Mississippi River <strong>Water</strong>shed<br />
2004 <strong>Water</strong> <strong>Use</strong>, Distance to<br />
Industry<br />
Industry Name Resource Name mgd WWTP, miles Closest WWTP<br />
Category<br />
ARCHER DANIELS MIDLAND CO Ground <strong>Water</strong> 0.206 1.0 Red Wing Agricultural Processing<br />
ASSOCIATED MILK PRODUCERS Ground <strong>Water</strong> 0.603 2.7 Rochester WWTP/<strong>Water</strong> Reclamation Plant Agricultural Processing<br />
ASSOCIATED MILK PRODUCERS Ground <strong>Water</strong> 0.092 2.7 Rochester WWTP/<strong>Water</strong> Reclamation Plant Agricultural Processing<br />
ASSOCIATED MILK PRODUCERS Ground <strong>Water</strong> 0.001 2.7 Rochester WWTP/<strong>Water</strong> Reclamation Plant Agricultural Processing<br />
CON AGRA FLOUR MILLING CO Ground <strong>Water</strong> 0.018 1.5 Met Council - Hastings Agricultural Processing<br />
FOREMOST FARMS USA Ground <strong>Water</strong> 0.009 >10 Stewartville Agricultural Processing<br />
FOREMOST FARMS USA Ground <strong>Water</strong> 0.005 >10 Stewartville Agricultural Processing<br />
GRANGER CO-OP CREAMERY Ground <strong>Water</strong> 0.004 >10 Stewartville Agricultural Processing<br />
HORMEL FOODS CORP Ground <strong>Water</strong> 0.272 1.0 Fairbault Agricultural Processing<br />
IFP INC Ground <strong>Water</strong> 0.012 1.0 Fairbault Agricultural Processing<br />
INTERNATIONAL MALTING CO LLC Ground <strong>Water</strong> 0.238 3.3 Winona Agricultural Processing<br />
INTERNATIONAL MALTING CO LLC Ground <strong>Water</strong> 0.726 3.3 Winona Agricultural Processing<br />
LAKESIDE FOODS INC Ground <strong>Water</strong> 0.075 3.0 Plainview - Elgin Sanitary District Agricultural Processing<br />
LAND O LAKES INC Ground <strong>Water</strong> 0.008 9.2 Lake City Agricultural Processing<br />
LAND O LAKES INC Ground <strong>Water</strong> 0.000 >10 Plainview - Elgin Sanitary District Agricultural Processing<br />
MAPLE ISLAND INC Ground <strong>Water</strong> 0.002 >10 Plainview - Elgin Sanitary District Agricultural Processing<br />
MARIGOLD FOODS INC Ground <strong>Water</strong> 0.162 2.0 Met Council - Empire Agricultural Processing<br />
MARIGOLD FOODS INC Ground <strong>Water</strong> 0.157 2.0 Met Council - Empire Agricultural Processing<br />
PLAINVIEW MILK PROD COOP Ground <strong>Water</strong> 0.191 3.0 Plainview - Elgin Sanitary District Agricultural Processing<br />
PROTEIN INGREDIENT TECHNOLOGIES INC Ground <strong>Water</strong> 0.052 2.0 Fairbault Agricultural Processing<br />
SENECA FOODS CORP Ground <strong>Water</strong> 0.049 4.0 Rochester WWTP/<strong>Water</strong> Reclamation Plant Agricultural Processing<br />
TURKEY STORE COMPANY Ground <strong>Water</strong> 0.009 5.5 Fairbault Agricultural Processing<br />
CYTEC ENGINEERED MATERIALS INC Ground <strong>Water</strong> 0.004 3.3 Winona <strong>Industrial</strong> Process Cooling - Once Through<br />
CYTEC ENGINEERED MATERIALS INC Ground <strong>Water</strong> 0.073 3.3 Winona <strong>Industrial</strong> Process Cooling - Once Through<br />
FARIBAULT WOOLEN MILL COMPANY Surface <strong>Water</strong> 0.006 1.0 Fairbault <strong>Industrial</strong> Process Cooling - Once Through<br />
KERRY BIOFUNCTIONAL INGREDIENTS INC Ground <strong>Water</strong> 0.298 2.5 Rochester WWTP/<strong>Water</strong> Reclamation Plant <strong>Industrial</strong> Process Cooling - Once Through<br />
S B FOOT TANNING CO Ground <strong>Water</strong> 0.000 3.2 Red Wing <strong>Industrial</strong> Processing<br />
S B FOOT TANNING CO Ground <strong>Water</strong> 0.000 3.2 Red Wing <strong>Industrial</strong> Processing<br />
BADGER FOUNDRY CO Ground <strong>Water</strong> 0.052 1.0 Winona Metal Processing<br />
BADGER FOUNDRY CO Ground <strong>Water</strong> 0.373 1.0 Winona Metal Processing<br />
PEERLESS CHAIN COMPANY Ground <strong>Water</strong> 0.266 1.0 Winona Metal Processing<br />
TECHNICAL DIE CASTING INC Ground <strong>Water</strong> 0.010 9.3 Winona Metal Processing<br />
8TH AND JEFFERSON LLC Ground <strong>Water</strong> 0.001 1.0 Winona Non-Metallic Processing<br />
AGGREGATE INDUSTRIES-NCR INC Ground <strong>Water</strong> 0.015 5.0 Met Council - Empire Non-Metallic Processing<br />
AGGREGATE INDUSTRIES-NCR INC Ground <strong>Water</strong> 0.009 5.0 Met Council - Empire Non-Metallic Processing<br />
GENOVA INC Ground <strong>Water</strong> 0.139 1.0 Fairbault Non-Metallic Processing<br />
HANSON PIPE & PRODUCTS MN INC Ground <strong>Water</strong> 0.078 7.5 Met Council - Empire Non-Metallic Processing<br />
NRG PROCESSING SOLUTIONS LLC Ground <strong>Water</strong> 0.000 5.6 Met Council - Empire Non-Metallic Processing<br />
RTP COMPANY Ground <strong>Water</strong> 0.177 2.5 Winona Non-Metallic Processing<br />
RTP COMPANY Ground <strong>Water</strong> 0.259 2.5 Winona Non-Metallic Processing<br />
S B FOOT TANNING CO Ground <strong>Water</strong> 0.135 2.6 Red Wing Non-Metallic Processing<br />
S B FOOT TANNING CO Ground <strong>Water</strong> 0.172 2.6 Red Wing Non-Metallic Processing<br />
USG INTERIORS INC Ground <strong>Water</strong> 0.034 2.3 Red Wing Non-Metallic Processing<br />
USG INTERIORS INC Ground <strong>Water</strong> 0.001 2.3 Red Wing Non-Metallic Processing<br />
Lower Mississippi_060806.xls, Tab 3.10d_append Page 1 of 3 6/28/2006
Table 3.10d. Industries in the Lower Mississippi River <strong>Water</strong>shed<br />
2004 <strong>Water</strong> <strong>Use</strong>, Distance to<br />
Industry<br />
Industry Name Resource Name mgd WWTP, miles Closest WWTP<br />
Category<br />
NSP CO DBA XCEL ENERGY Ground <strong>Water</strong> 0.051 6.1 Red Wing NUCLEAR POWER PLANT<br />
NSP CO DBA XCEL ENERGY Ground <strong>Water</strong> 0.036 6.1 Red Wing NUCLEAR POWER PLANT<br />
NSP CO DBA XCEL ENERGY Surface <strong>Water</strong> 505.836 6.1 Red Wing NUCLEAR POWER PLANT<br />
NSP CO DBA XCEL ENERGY Ground <strong>Water</strong> 0.000 6.1 Red Wing NUCLEAR POWER PLANT<br />
AL-CORN CLEAN FUEL Ground <strong>Water</strong> 0.000 >10 Owatonna Petroleum - Chemical Processing<br />
AL-CORN CLEAN FUEL Ground <strong>Water</strong> 0.000 >10 Owatonna Petroleum - Chemical Processing<br />
AL-CORN CLEAN FUEL Ground <strong>Water</strong> 0.000 >10 Owatonna Petroleum - Chemical Processing<br />
AL-CORN CLEAN FUEL Ground <strong>Water</strong> 0.387 >10 Owatonna Petroleum - Chemical Processing<br />
CONTINENTAL NITROGEN & RESOURCES Ground <strong>Water</strong> 0.000 1.6 Met Council - Rosemount Petroleum - Chemical Processing<br />
CONTINENTAL NITROGEN & RESOURCES Ground <strong>Water</strong> 0.085 1.6 Met Council - Rosemount Petroleum - Chemical Processing<br />
FLINT HILLS RESOURCES LP Ground <strong>Water</strong> 0.960 8.5 Met Council - Empire Petroleum - Chemical Processing<br />
FLINT HILLS RESOURCES LP Ground <strong>Water</strong> 0.660 8.5 Met Council - Empire Petroleum - Chemical Processing<br />
FLINT HILLS RESOURCES LP Ground <strong>Water</strong> 1.048 8.5 Met Council - Empire Petroleum - Chemical Processing<br />
FLINT HILLS RESOURCES LP Ground <strong>Water</strong> 1.407 8.5 Met Council - Empire Petroleum - Chemical Processing<br />
FLINT HILLS RESOURCES LP Ground <strong>Water</strong> 0.000 8.5 Met Council - Empire Petroleum - Chemical Processing<br />
FLINT HILLS RESOURCES LP Ground <strong>Water</strong> 0.329 8.5 Met Council - Empire Petroleum - Chemical Processing<br />
FLINT HILLS RESOURCES LP Ground <strong>Water</strong> 1.661 8.5 Met Council - Empire Petroleum - Chemical Processing<br />
FLINT HILLS RESOURCES LP Ground <strong>Water</strong> 0.465 8.5 Met Council - Empire Petroleum - Chemical Processing<br />
FLINT HILLS RESOURCES LP Ground <strong>Water</strong> 0.000 8.5 Met Council - Empire Petroleum - Chemical Processing<br />
FRANKLIN HEATING STATION Ground <strong>Water</strong> 0.136 4.0 Rochester WWTP/<strong>Water</strong> Reclamation Plant POWER GENERATION<br />
FRANKLIN HEATING STATION Ground <strong>Water</strong> 0.367 4.0 Rochester WWTP/<strong>Water</strong> Reclamation Plant POWER GENERATION<br />
GREAT RIVER ENERGY Ground <strong>Water</strong> 0.001 >10 Stewartville POWER GENERATION<br />
NSP CO DBA XCEL ENERGY Ground <strong>Water</strong> 0.042 6.1 Red Wing POWER GENERATION<br />
AGGREGATE INDUSTRIES-NCR INC Surface <strong>Water</strong> 0.000 6.8 Red Wing Sand and Gravel Washing<br />
AGGREGATE INDUSTRIES-NCR INC Surface <strong>Water</strong> 0.320 5.0 Met Council - Empire Sand and Gravel Washing<br />
AGGREGATE INDUSTRIES-NCR INC Surface <strong>Water</strong> 0.472 10.0 Red Wing Sand and Gravel Washing<br />
AGGREGATE INDUSTRIES-NCR INC Surface <strong>Water</strong> 0.000 >10 Met Council - Empire Sand and Gravel Washing<br />
AGGREGATE INDUSTRIES-NCR INC Surface <strong>Water</strong> 0.000 2.0 Met Council - Hastings Sand and Gravel Washing<br />
AGGREGATE INDUSTRIES-NCR INC Surface <strong>Water</strong> 0.000 2.0 Met Council - Hastings Sand and Gravel Washing<br />
BARSNESS CONSTRUCTION & EXCAVATION Surface <strong>Water</strong> 0.000 2.3 Northfield Sand and Gravel Washing<br />
BARTON SAND & GRAVEL Surface <strong>Water</strong> 0.002 9.0 Met Council - Empire Sand and Gravel Washing<br />
BARTON SAND & GRAVEL Surface <strong>Water</strong> 0.004 >10 Met Council - Empire Sand and Gravel Washing<br />
BITUMINOUS ROADWAYS INC Surface <strong>Water</strong> 0.004 4.0 Met Council - Rosemount Sand and Gravel Washing<br />
BONANZA GRAIN INC Ground <strong>Water</strong> 0.005 >10 Winona Sand and Gravel Washing<br />
BONANZA GRAIN INC Surface <strong>Water</strong> 0.025 >10 Winona Sand and Gravel Washing<br />
CEMSTONE PRODUCTS Ground <strong>Water</strong> 0.011 3.8 Met Council - Empire Sand and Gravel Washing<br />
FISCHER SAND & AGGREGATE Ground <strong>Water</strong> 0.163 6.5 Met Council - Empire Sand and Gravel Washing<br />
FISCHER SAND & AGGREGATE Ground <strong>Water</strong> 0.000 6.5 Met Council - Empire Sand and Gravel Washing<br />
FISCHER SAND & AGGREGATE Ground <strong>Water</strong> 0.000 6.5 Met Council - Empire Sand and Gravel Washing<br />
MATHY CONSTRUCTION CO Surface <strong>Water</strong> 0.000 4.3 Rochester WWTP/<strong>Water</strong> Reclamation Plant Sand and Gravel Washing<br />
MATHY CONSTRUCTION CO Ground <strong>Water</strong> 0.009 4.5 Winona Sand and Gravel Washing<br />
MEDFORD PROPERTIES Surface <strong>Water</strong> 0.224 8.5 Fairbault Sand and Gravel Washing<br />
MILESTONE MATERIALS Ground <strong>Water</strong> 0.006 >10 Lake City Sand and Gravel Washing<br />
OWATONNA CONSTRUCTION CO INC Surface <strong>Water</strong> 0.202 7.7 Northfield Sand and Gravel Washing<br />
Lower Mississippi_060806.xls, Tab 3.10d_append Page 2 of 3 6/28/2006
Table 3.10d. Industries in the Lower Mississippi River <strong>Water</strong>shed<br />
2004 <strong>Water</strong> <strong>Use</strong>, Distance to<br />
Industry<br />
Industry Name Resource Name mgd WWTP, miles Closest WWTP<br />
Category<br />
PATTERSON QUARRIES Ground <strong>Water</strong> 0.024 >10 Rochester WWTP/<strong>Water</strong> Reclamation Plant Sand and Gravel Washing<br />
RIVER CITY ASPHALT INC Surface <strong>Water</strong> 0.037 9.8 Met Council - Empire Sand and Gravel Washing<br />
ROVERUD CONSTRUCTION INC Surface <strong>Water</strong> 0.000 >10 Winona Sand and Gravel Washing<br />
ROVERUD CONSTRUCTION INC Surface <strong>Water</strong> 0.000 >10 Winona Sand and Gravel Washing<br />
SHAMROCK ENTERPRISES Ground <strong>Water</strong> 0.048 5.9 Rochester WWTP/<strong>Water</strong> Reclamation Plant Sand and Gravel Washing<br />
SOUTHERN MN CONSTRUCTION CO Surface <strong>Water</strong> 0.275 10.0 Owatonna Sand and Gravel Washing<br />
STORLIE, JOHN Surface <strong>Water</strong> 0.000 8.4 Met Council - Empire Sand and Gravel Washing<br />
TRI-COUNTY AGGREGATE, INC Surface <strong>Water</strong> 0.019 4.4 Fairbault Sand and Gravel Washing<br />
NSP CO DBA XCEL ENERGY Surface <strong>Water</strong> 42.659 1.0 Red Wing STEAM POWER COOLING - ONCE THROUGH<br />
NSP CO DBA XCEL ENERGY Surface <strong>Water</strong> 2.104 1.0 Red Wing STEAM POWER COOLING - ONCE THROUGH<br />
NSP CO DBA XCEL ENERGY Surface <strong>Water</strong> 0.000 1.0 Red Wing STEAM POWER COOLING - ONCE THROUGH<br />
NSP CO DBA XCEL ENERGY Surface <strong>Water</strong> 0.000 1.0 Red Wing STEAM POWER COOLING - ONCE THROUGH<br />
NSP CO DBA XCEL ENERGY Surface <strong>Water</strong> 0.000 1.0 Red Wing STEAM POWER COOLING - ONCE THROUGH<br />
ROCHESTER PUBLIC UTILITIES Surface <strong>Water</strong> 26.622 3.0 Rochester WWTP/<strong>Water</strong> Reclamation Plant STEAM POWER COOLING - ONCE THROUGH<br />
ROCHESTER PUBLIC UTILITIES Ground <strong>Water</strong> 0.212 3.0 Rochester WWTP/<strong>Water</strong> Reclamation Plant STEAM POWER COOLING - WET TOWER<br />
ROCHESTER PUBLIC UTILITIES Ground <strong>Water</strong> 0.000 3.0 Rochester WWTP/<strong>Water</strong> Reclamation Plant STEAM POWER COOLING - WET TOWER<br />
ROCHESTER PUBLIC UTILITIES Ground <strong>Water</strong> 0.193 3.0 Rochester WWTP/<strong>Water</strong> Reclamation Plant STEAM POWER COOLING - WET TOWER<br />
Count of Industries<br />
Lower Mississippi_060806.xls, Tab 3.10d_append Page 3 of 3 6/28/2006
WATER USE (MGD)<br />
WATER USE (MGD)<br />
8<br />
7<br />
6<br />
5<br />
4<br />
3<br />
2<br />
1<br />
0<br />
600<br />
500<br />
400<br />
300<br />
200<br />
100<br />
0<br />
241 244 245 246 247 248<br />
USE CODE<br />
222 223 226 229<br />
USE CODE<br />
Ground <strong>Water</strong><br />
Surface <strong>Water</strong><br />
241 Agricultural Processing<br />
244 Sand and Gravel<br />
Washing<br />
245 <strong>Industrial</strong> Process<br />
Cooling Once - through<br />
246 Petroleum-chemical<br />
processing, ethanol<br />
247 Metal Processing<br />
248 Non-Metallic Processing<br />
Figure 3.10a. <strong>Industrial</strong> Processing <strong>Water</strong> <strong>Use</strong> in the Lower Mississippi River <strong>Water</strong>shed, 2004<br />
Ground <strong>Water</strong><br />
Surfacce <strong>Water</strong><br />
222 Steam Power Cooling - Once<br />
through<br />
223 Steam Power Cooling - Wet<br />
Tower<br />
226 Nuclear Power Plant<br />
229 Power Generation<br />
Figure 3.10b. Power Generation <strong>Water</strong> <strong>Use</strong> in the Lower Mississippi River <strong>Water</strong>shed, 2004
Table 3.11a. <strong>Industrial</strong> <strong>Water</strong> <strong>Use</strong> in the Minnesota River <strong>Water</strong>shed<br />
2004 <strong>Water</strong> <strong>Use</strong>, mgd<br />
Industry Category Groundwater Surface <strong>Water</strong> Total<br />
Agricultural Processing 11.14 0.00 11.14<br />
<strong>Industrial</strong> Process Cooling - Once Through 1.88 0.00 1.88<br />
<strong>Industrial</strong> Processing 0.17 0.00 0.17<br />
Metal Processing 1.31 0.00 1.31<br />
Mine Processing 0.20 0.04 0.24<br />
Non-Metallic Processing 0.43 0.00 0.43<br />
Petroleum - Chemical Processing, ethanol 1.18 0.00 1.18<br />
Pulp and Paper Processing 0.05 0.00 0.05<br />
Sand and Gravel Washing 0.83 1.62 2.45<br />
Steam Power Cooling - Once Through 0.11 326.00 326.11<br />
Total 17.30 327.66 344.96<br />
Table 3.11b. WWTPs in the Minnesota River <strong>Water</strong>shed<br />
Facility Name<br />
Design<br />
Capacity, mgd<br />
Flow as % of<br />
Ann Avg Flow,<br />
Design<br />
mgd<br />
Capacity<br />
2005 2005<br />
Fairmont WWTP 3.900 1.595 41%<br />
Granite Falls WWTP 1.111 0.477 43%<br />
Madelia WWTP 1.310 0.907 69%<br />
Mankato WWTP 11.250 6.861 61%<br />
Marshall WWTP 4.500 2.518 56%<br />
Met Council - Blue Lake WWTP* 37.000 28.420 77%<br />
Met Council - Seneca WWTP* 39.000 23.353 60%<br />
Montevideo WWTP 3.000 1.083 36%<br />
New Prague WWTP 1.378 0.662 48%<br />
New Ulm WWTP 6.770 2.582 38%<br />
St James WWTP 2.960 1.032 35%<br />
St Peter WWTP 4.000 1.170 29%<br />
Waseca WWTP 3.500 1.580 45%<br />
Wells Easton Minnesota Lake WWTP 1.088 0.516 47%<br />
Winnebago WWTP 1.700 0.592 35%<br />
Total 122.467 73.348 60%<br />
* Design capacity changed per MCES instructions.
Table 3.11d. Industries in the Minnesota River <strong>Water</strong>shed<br />
2004 <strong>Water</strong> <strong>Use</strong>,<br />
Distance to<br />
WWTP,<br />
Industry Name Resource Name mgd<br />
miles Closest WWTP Industry Category<br />
ANDERSON CUSTOM PROCESSING Ground <strong>Water</strong> 0.0318 >5 New Ulm Agricultural Processing<br />
ARCHER DANIELS MIDLAND CO Ground <strong>Water</strong> 0.1422 >5 New Ulm Agricultural Processing<br />
ARCHER DANIELS MIDLAND CO Ground <strong>Water</strong> 0.0000 >5 Marshall Agricultural Processing<br />
ARCHER DANIELS MIDLAND CO Ground <strong>Water</strong> 0.0803 >5 New Ulm Agricultural Processing<br />
ARCHER DANIELS MIDLAND CO Ground <strong>Water</strong> 0.0518 >5 New Ulm Agricultural Processing<br />
ARCHER DANIELS MIDLAND CO Ground <strong>Water</strong> 0.0427 >5 New Ulm Agricultural Processing<br />
ARCHER DANIELS MIDLAND CO Ground <strong>Water</strong> 0.0814 >5 New Ulm Agricultural Processing<br />
ARCHER DANIELS MIDLAND CO Ground <strong>Water</strong> 0.0197 >5 New Ulm Agricultural Processing<br />
ARCHER DANIELS MIDLAND CO Ground <strong>Water</strong> 0.5162 >5 New Ulm Agricultural Processing<br />
ARCHER DANIELS MIDLAND CO Ground <strong>Water</strong> 0.2940 >5 New Ulm Agricultural Processing<br />
ASSOCIATED MILK PRODUCERS Ground <strong>Water</strong> 0.0866 >5 Montevideo Agricultural Processing<br />
ASSOCIATED MILK PRODUCERS Ground <strong>Water</strong> 0.1129 >5 Montevideo Agricultural Processing<br />
ASSOCIATED MILK PRODUCERS Ground <strong>Water</strong> 0.0000 1.0 New Prague Agricultural Processing<br />
AUGUST SCHELL BREWERY Ground <strong>Water</strong> 0.0000 1.5 New Ulm Agricultural Processing<br />
AUGUST SCHELL BREWERY Ground <strong>Water</strong> 0.0000 1.5 New Ulm Agricultural Processing<br />
BONGARDS CREAMERIES Ground <strong>Water</strong> 0.1362 >5 Met Council - Blue Lake Agricultural Processing<br />
BONGARDS CREAMERIES Ground <strong>Water</strong> 0.1104 >5 Met Council - Blue Lake Agricultural Processing<br />
BONGARDS CREAMERIES Ground <strong>Water</strong> 0.1384 >5 Met Council - Blue Lake Agricultural Processing<br />
BUTTERFIELD FOODS COMPANY Ground <strong>Water</strong> 0.1386 >5 St James Agricultural Processing<br />
BUTTERFIELD FOODS COMPANY Ground <strong>Water</strong> 0.0115 >5 St James Agricultural Processing<br />
BUTTERFIELD FOODS COMPANY Ground <strong>Water</strong> 0.0353 >5 St James Agricultural Processing<br />
BUTTERFIELD FOODS COMPANY Ground <strong>Water</strong> 0.0416 >5 St James Agricultural Processing<br />
CENEX HARVEST STATES COOPERATIVES Ground <strong>Water</strong> 3.5781 2.0 Mankato Agricultural Processing<br />
CHRISTENSEN FAMILY FARMS Ground <strong>Water</strong> 0.0060 >5 New Ulm Agricultural Processing<br />
COCA-COLA BOTTLING MW Ground <strong>Water</strong> 0.0266 3.7 Met Council - Seneca Agricultural Processing<br />
COCA-COLA BOTTLING MW Ground <strong>Water</strong> 0.6797 3.7 Met Council - Seneca Agricultural Processing<br />
DAIRY FARMERS OF AMERICA INC Ground <strong>Water</strong> 0.0000 >5 New Ulm Agricultural Processing<br />
DARLING INTERNATIONAL INC Ground <strong>Water</strong> 0.0625 >5 Winnebago Agricultural Processing<br />
DEL MONTE CORPORATION Ground <strong>Water</strong> 0.0690 >5 New Ulm Agricultural Processing<br />
DEL MONTE CORPORATION Ground <strong>Water</strong> 0.0710 >5 New Ulm Agricultural Processing<br />
FAIRMONT FOODS OF MINNESOTA Ground <strong>Water</strong> 0.0000 1.2 Fairmont Agricultural Processing<br />
FAIRMONT FOODS OF MINNESOTA Ground <strong>Water</strong> 0.0000 1.2 Fairmont Agricultural Processing<br />
FAIRMONT FOODS OF MINNESOTA Ground <strong>Water</strong> 0.0321 1.4 Fairmont Agricultural Processing<br />
FARMERS UNION MARKETING Ground <strong>Water</strong> 0.0000 >5 Granite Falls Agricultural Processing<br />
FARMERS UNION MARKETING Surface <strong>Water</strong> 0.0005 >5 Granite Falls Agricultural Processing<br />
FARMERS UNION MARKETING Ground <strong>Water</strong> 0.0068 >5 Granite Falls Agricultural Processing<br />
FARMERS UNION MARKETING Ground <strong>Water</strong> 0.0249 >5 Granite Falls Agricultural Processing<br />
GEDNEY COMPANY, M A Ground <strong>Water</strong> 0.1666 >5 Met Council - Blue Lake Agricultural Processing<br />
GEDNEY COMPANY, M A Ground <strong>Water</strong> 0.0000 >5 Met Council - Blue Lake Agricultural Processing<br />
NICOLLET FOOD PRODUCTS Ground <strong>Water</strong> 0.0134 >5 New Ulm Agricultural Processing<br />
NICOLLET FOOD PRODUCTS Ground <strong>Water</strong> 0.0000 >5 New Ulm Agricultural Processing<br />
PEPSI COLA BOTTLING CO Ground <strong>Water</strong> 0.1548 2.9 Met Council - Seneca Agricultural Processing<br />
PEPSI COLA BOTTLING CO Ground <strong>Water</strong> 0.1663 2.9 Met Council - Seneca Agricultural Processing<br />
Minnesota River_<strong>Industrial</strong>_060106.xls, Tab 3.11 c Page 1 of 4 6/28/2006
Table 3.11d. Industries in the Minnesota River <strong>Water</strong>shed<br />
2004 <strong>Water</strong> <strong>Use</strong>,<br />
Distance to<br />
WWTP,<br />
Industry Name Resource Name mgd<br />
miles Closest WWTP Industry Category<br />
PROTEIN INGREDIENT TECHNOLOGIES INC Ground <strong>Water</strong> 0.1249 >5 St James Agricultural Processing<br />
RAHR MALTING COMPANY Ground <strong>Water</strong> 0.2033 >5 Met Council - Blue Lake Agricultural Processing<br />
RAHR MALTING COMPANY Ground <strong>Water</strong> 0.0000 >5 Met Council - Blue Lake Agricultural Processing<br />
RAHR MALTING COMPANY Ground <strong>Water</strong> 0.7937 >5 Met Council - Blue Lake Agricultural Processing<br />
RAHR MALTING COMPANY Ground <strong>Water</strong> 1.0378 >5 Met Council - Blue Lake Agricultural Processing<br />
RAHR MALTING COMPANY Ground <strong>Water</strong> 0.5066 >5 Met Council - Blue Lake Agricultural Processing<br />
SENECA FOODS CORP Ground <strong>Water</strong> 0.0441 >5 New Prague Agricultural Processing<br />
SENECA FOODS CORP Ground <strong>Water</strong> 0.2808 >5 New Prague Agricultural Processing<br />
SENECA FOODS CORP Ground <strong>Water</strong> 0.1932 >5 Winnebago Agricultural Processing<br />
SOUTHERN MINNESOTA SUGAR COOP Ground <strong>Water</strong> 0.2581 >5 Granite Falls Agricultural Processing<br />
SOUTHERN MINNESOTA SUGAR COOP Ground <strong>Water</strong> 0.0000 >5 Granite Falls Agricultural Processing<br />
SOUTHERN MINNESOTA SUGAR COOP Ground <strong>Water</strong> 0.0000 >5 Granite Falls Agricultural Processing<br />
SOUTHERN MINNESOTA SUGAR COOP Ground <strong>Water</strong> 0.1386 >5 Granite Falls Agricultural Processing<br />
SOUTHERN MINNESOTA SUGAR COOP Ground <strong>Water</strong> 0.0537 >5 Granite Falls Agricultural Processing<br />
WIS-PAK OF MANKATO INC Ground <strong>Water</strong> 0.0005 2.5 Mankato Agricultural Processing<br />
WIS-PAK OF MANKATO INC Ground <strong>Water</strong> 0.3704 2.5 Mankato Agricultural Processing<br />
AG PROCESSING INC Ground <strong>Water</strong> 0.7123 >5 Montevideo <strong>Industrial</strong> Process Cooling - Once Through<br />
AG PROCESSING INC Ground <strong>Water</strong> 0.6288 >5 Montevideo <strong>Industrial</strong> Process Cooling - Once Through<br />
AG PROCESSING INC Ground <strong>Water</strong> 0.0000 >5 Montevideo <strong>Industrial</strong> Process Cooling - Once Through<br />
ROSEMOUNT INC Ground <strong>Water</strong> 0.0030 4.5 Met Council - Blue Lake <strong>Industrial</strong> Process Cooling - Once Through<br />
THERMOTECH Ground <strong>Water</strong> 0.5263 >5 Met Council - Blue Lake <strong>Industrial</strong> Process Cooling - Once Through<br />
THERMOTECH Ground <strong>Water</strong> 0.0058 >5 Met Council - Blue Lake <strong>Industrial</strong> Process Cooling - Once Through<br />
CARGILL INC Ground <strong>Water</strong> 0.0016 >5 Winnebago <strong>Industrial</strong> Processing<br />
DUKE REALTY INVESTMENTS INC Ground <strong>Water</strong> 0.1671 >5 Met Council - Blue Lake <strong>Industrial</strong> Processing<br />
PINGEL, RON Ground <strong>Water</strong> 0.0000 >5 Met Council - Blue Lake <strong>Industrial</strong> Processing<br />
SURMODICS INC Ground <strong>Water</strong> 0.0033 4.0 Met Council - Seneca <strong>Industrial</strong> Processing<br />
WATONWAN FARM SERVICE CO Ground <strong>Water</strong> 0.0011 >5 Wells Easton Minnetonka Lake <strong>Industrial</strong> Processing<br />
CYPRESS SEMICONDUCTOR Ground <strong>Water</strong> 0.8532 2.5 Met Council - Seneca Metal Processing<br />
CYPRESS SEMICONDUCTOR Ground <strong>Water</strong> 0.0000 2.5 Met Council - Seneca Metal Processing<br />
CYPRESS SEMICONDUCTOR Ground <strong>Water</strong> 0.0000 2.5 Met Council - Seneca Metal Processing<br />
EATON CORP Ground <strong>Water</strong> 0.0488 5.0 Met Council - Blue Lake Metal Processing<br />
GOPHER RESOURCE CORP Ground <strong>Water</strong> 0.1296 4.5 Met Council - Seneca Metal Processing<br />
HINIKER COMPANY Ground <strong>Water</strong> 0.0005 5.0 Mankato Metal Processing<br />
HINIKER COMPANY Ground <strong>Water</strong> 0.0005 5.0 Mankato Metal Processing<br />
HINIKER COMPANY Ground <strong>Water</strong> 0.0060 5.0 Mankato Metal Processing<br />
HOLNAM INC Ground <strong>Water</strong> 0.0003 4.8 Met Council - Seneca Metal Processing<br />
NORTHWEST AIRLINES INC Ground <strong>Water</strong> 0.0956 4.2 Met Council - Seneca Metal Processing<br />
NORTHWEST AIRLINES INC Ground <strong>Water</strong> 0.1668 4.2 Met Council - Seneca Metal Processing<br />
VALMONT COATINGS INC Ground <strong>Water</strong> 0.0115 5.0 Met Council - Blue Lake Metal Processing<br />
NEW ULM QUARTZITE QUARRY Surface <strong>Water</strong> 0.0416 1.3 New Ulm Mine Processing<br />
VETTER STONE CO Ground <strong>Water</strong> 0.0000 5.0 St Peter Mine Processing<br />
VETTER STONE CO Ground <strong>Water</strong> 0.0608 3.9 Mankato Mine Processing<br />
VETTER STONE CO Ground <strong>Water</strong> 0.0611 3.9 Mankato Mine Processing<br />
Minnesota River_<strong>Industrial</strong>_060106.xls, Tab 3.11 c Page 2 of 4 6/28/2006
Table 3.11d. Industries in the Minnesota River <strong>Water</strong>shed<br />
2004 <strong>Water</strong> <strong>Use</strong>,<br />
Distance to<br />
WWTP,<br />
Industry Name Resource Name mgd<br />
miles Closest WWTP Industry Category<br />
VETTER STONE CO Ground <strong>Water</strong> 0.0778 3.9 Mankato Mine Processing<br />
VETTER STONE CO Ground <strong>Water</strong> 0.0000 3.9 Mankato Mine Processing<br />
AGGREGATE INDUSTRIES-NCR INC Ground <strong>Water</strong> 0.0000 >5 New Prague Non-Metallic Processing<br />
ANCHOR GLASS CONTAINER CORP Ground <strong>Water</strong> 0.0636 2.0 Met Council - Blue Lake Non-Metallic Processing<br />
ANCHOR GLASS CONTAINER CORP Ground <strong>Water</strong> 0.0036 2.0 Met Council - Blue Lake Non-Metallic Processing<br />
AVR INC Ground <strong>Water</strong> 0.0121 >5 Met Council - Seneca Non-Metallic Processing<br />
GREENMAN TECHNOLOGIES OF MN Ground <strong>Water</strong> 0.0025 2.7 Met Council - Blue Lake Non-Metallic Processing<br />
MICRON MOLDING INC Ground <strong>Water</strong> 0.0148 4.5 Met Council - Seneca Non-Metallic Processing<br />
MIDWEST ELECTRIC Ground <strong>Water</strong> 0.0186 4.6 Mankato Non-Metallic Processing<br />
MIDWEST ELECTRIC Ground <strong>Water</strong> 0.0003 4.6 Mankato Non-Metallic Processing<br />
PLASTECH CORP Ground <strong>Water</strong> 0.0000 >5 New Prague Non-Metallic Processing<br />
POLARFAB LLC Ground <strong>Water</strong> 0.0995 2.4 Met Council - Seneca Non-Metallic Processing<br />
POLARFAB LLC Ground <strong>Water</strong> 0.1658 2.4 Met Council - Seneca Non-Metallic Processing<br />
STARBUCK CEMENT Ground <strong>Water</strong> 0.0447 >5 Montevideo Non-Metallic Processing<br />
STARBUCK CEMENT Ground <strong>Water</strong> 0.0016 >5 Montevideo Non-Metallic Processing<br />
WATONWAN FARM SERVICE CO Ground <strong>Water</strong> 0.0005 >5 Wells Easton Minnetonka Lake Non-Metallic Processing<br />
CHIPPEWA VALLEY ETHANOL CO Ground <strong>Water</strong> 0.1003 >5 Montevideo Petroleum - Chemical Processing<br />
CHIPPEWA VALLEY ETHANOL CO Ground <strong>Water</strong> 0.1003 >5 Montevideo Petroleum - Chemical Processing<br />
CHIPPEWA VALLEY ETHANOL CO Ground <strong>Water</strong> 0.1003 >5 Montevideo Petroleum - Chemical Processing<br />
CHIPPEWA VALLEY ETHANOL CO Ground <strong>Water</strong> 0.1003 >5 Montevideo Petroleum - Chemical Processing<br />
CORN PLUS Ground <strong>Water</strong> 0.1359 1.0 Winnebago Petroleum - Chemical Processing<br />
CORN PLUS Ground <strong>Water</strong> 0.0000 1.0 Winnebago Petroleum - Chemical Processing<br />
CORN PLUS Ground <strong>Water</strong> 0.0000 1.0 Winnebago Petroleum - Chemical Processing<br />
DIVERSIFIED ENERGY CO LLC Ground <strong>Water</strong> 0.1107 >5 Montevideo Petroleum - Chemical Processing<br />
DIVERSIFIED ENERGY CO LLC Ground <strong>Water</strong> 0.2570 >5 Montevideo Petroleum - Chemical Processing<br />
GRANITE FALLS ENERGY LLC Ground <strong>Water</strong> 0.0000 >5 Granite Falls Petroleum - Chemical Processing<br />
HEARTLAND CORN PRODUCTS Ground <strong>Water</strong> 0.2781 >5 St Peter Petroleum - Chemical Processing<br />
INLAND PAPERBOARD & PACKAGING INC Ground <strong>Water</strong> 0.0279 2.0 Met Council - Blue Lake Pulp and Paper Processing<br />
INLAND PAPERBOARD & PACKAGING INC Ground <strong>Water</strong> 0.0225 2.0 Met Council - Blue Lake Pulp and Paper Processing<br />
AGGREGATE INDUSTRIES-NCR INC Surface <strong>Water</strong> 0.0000 >5 Montevideo Sand and Gravel Washing<br />
AGGREGATE INDUSTRIES-NCR INC Ground <strong>Water</strong> 0.0000 >5 Montevideo Sand and Gravel Washing<br />
ALEXANDRIA GRAVEL PRODUCTS Ground <strong>Water</strong> 0.0211 >5 Montevideo Sand and Gravel Washing<br />
BRYAN ROCK PRODUCTS INC Ground <strong>Water</strong> 0.0142 >5 Met Council - Blue Lake Sand and Gravel Washing<br />
BUFFALO BITUMINOUS Surface <strong>Water</strong> 0.0000 >5 Met Council - Blue Lake Sand and Gravel Washing<br />
CENTRAL-ALLIED ENTERPRISES INC Ground <strong>Water</strong> 0.0000 >5 Montevideo Sand and Gravel Washing<br />
DUININCK BROTHERS INC Surface <strong>Water</strong> 0.0000 >5 Marshall Sand and Gravel Washing<br />
DUININCK BROTHERS INC Surface <strong>Water</strong> 0.0000 >5 New Prague Sand and Gravel Washing<br />
DUININCK CONCRETE LLC Surface <strong>Water</strong> 0.0329 >5 Granite Falls Sand and Gravel Washing<br />
EDWARD KRAEMER & SONS INC Surface <strong>Water</strong> 0.4129 4.8 Met Council - Seneca Sand and Gravel Washing<br />
EDWARD KRAEMER & SONS INC Ground <strong>Water</strong> 0.0003 4.8 Met Council - Seneca Sand and Gravel Washing<br />
HANCOCK CONCRETE PRODUCTS Ground <strong>Water</strong> 0.0000 >5 Montevideo Sand and Gravel Washing<br />
HANCOCK CONCRETE PRODUCTS Ground <strong>Water</strong> 0.1447 >5 Montevideo Sand and Gravel Washing<br />
HENRICH & SONS INC Surface <strong>Water</strong> 0.0748 >5 Marshall Sand and Gravel Washing<br />
Minnesota River_<strong>Industrial</strong>_060106.xls, Tab 3.11 c Page 3 of 4 6/28/2006
Table 3.11d. Industries in the Minnesota River <strong>Water</strong>shed<br />
2004 <strong>Water</strong> <strong>Use</strong>,<br />
Distance to<br />
WWTP,<br />
Industry Name Resource Name mgd<br />
miles Closest WWTP Industry Category<br />
JOHNSON, WAYNE F Ground <strong>Water</strong> 0.1652 5.0 St Peter Sand and Gravel Washing<br />
JOHNSON, WAYNE F Ground <strong>Water</strong> 0.1019 5.0 St Peter Sand and Gravel Washing<br />
L & S CONSTRUCTION CORP Surface <strong>Water</strong> 0.0000 >5 Marshall Sand and Gravel Washing<br />
L & S CONSTRUCTION CORP Surface <strong>Water</strong> 0.0000 >5 Marshall Sand and Gravel Washing<br />
L & S CONSTRUCTION CORP Surface <strong>Water</strong> 0.0000 >5 Marshall Sand and Gravel Washing<br />
MARSHALL SAND & GRAVEL Surface <strong>Water</strong> 0.0000 5.0 Marshall Sand and Gravel Washing<br />
MINNESOTA QUARRIES INC Ground <strong>Water</strong> 0.1096 1.0 Mankato Sand and Gravel Washing<br />
MINNESOTA QUARRIES INC Ground <strong>Water</strong> 0.0071 1.0 Mankato Sand and Gravel Washing<br />
MORRIS SAND & GRAVEL Surface <strong>Water</strong> 0.1597 >5 Montevideo Sand and Gravel Washing<br />
MUELLER & SONS INC, WM Ground <strong>Water</strong> 0.0414 >5 Met Council - Blue Lake Sand and Gravel Washing<br />
NORTHERN CON-AGG INC Surface <strong>Water</strong> 0.0589 >5 Marshall Sand and Gravel Washing<br />
ORTONVILLE STONE CO Surface <strong>Water</strong> 0.0000 >5 Montevideo Sand and Gravel Washing<br />
PRIOR LAKE AGGREGATES Surface <strong>Water</strong> 0.3816 >5 Met Council - Blue Lake Sand and Gravel Washing<br />
SHAKOPEE GRAVEL INC Ground <strong>Water</strong> 0.0011 2.5 Met Council - Blue Lake Sand and Gravel Washing<br />
SOUTHERN MINNESOTA CONSTRUCTION CO Ground <strong>Water</strong> 0.1501 4.0 St Peter Sand and Gravel Washing<br />
SOUTHERN MN CONSTRUCTION CO Surface <strong>Water</strong> 0.0000 4.5 Mankato Sand and Gravel Washing<br />
SOUTHERN MN CONSTRUCTION CO Surface <strong>Water</strong> 0.4195 5.0 Mankato Sand and Gravel Washing<br />
UNIMIN MINNESOTA CORP Surface <strong>Water</strong> 0.0000 2.5 St Peter Sand and Gravel Washing<br />
UNIMIN MINNESOTA CORP Ground <strong>Water</strong> 0.0688 5.0 St Peter Sand and Gravel Washing<br />
WASECA SAND & GRAVEL Surface <strong>Water</strong> 0.0789 4.4 Waseca Sand and Gravel Washing<br />
KOCH MATERIALS COMPANY Ground <strong>Water</strong> 0.0000 >5 Met Council - Blue Lake STEAM POWER - OTHER THAN COOLING<br />
FAIRMONT, CITY OF Surface <strong>Water</strong> 0.1030 1.0 Fairmont STEAM POWER COOLING - ONCE THROUGH<br />
FAIRMONT, CITY OF Surface <strong>Water</strong> 0.0726 1.0 Fairmont STEAM POWER COOLING - ONCE THROUGH<br />
FAIRMONT, CITY OF Surface <strong>Water</strong> 0.2334 1.0 Fairmont STEAM POWER COOLING - ONCE THROUGH<br />
INTERSTATE POWER & LIGHT CO Surface <strong>Water</strong> 8.5427 >5 Fairmont STEAM POWER COOLING - ONCE THROUGH<br />
NSP CO DBA XCEL ENERGY Surface <strong>Water</strong> 295.4600 2.5 Met Council - Seneca STEAM POWER COOLING - ONCE THROUGH<br />
NSP CO DBA XCEL ENERGY Ground <strong>Water</strong> 0.1123 2.5 Met Council - Seneca STEAM POWER COOLING - ONCE THROUGH<br />
NSP CO DBA XCEL ENERGY Ground <strong>Water</strong> 0.0000 1.0 Mankato STEAM POWER COOLING - ONCE THROUGH<br />
NSP CO DBA XCEL ENERGY Ground <strong>Water</strong> 0.0000 1.0 Mankato STEAM POWER COOLING - ONCE THROUGH<br />
NSP CO DBA XCEL ENERGY Surface <strong>Water</strong> 4.0655 1.0 Mankato STEAM POWER COOLING - ONCE THROUGH<br />
NSP CO DBA XCEL ENERGY Surface <strong>Water</strong> 6.2948 1.0 Mankato STEAM POWER COOLING - ONCE THROUGH<br />
NSP CO DBA XCEL ENERGY Surface <strong>Water</strong> 11.1874 1.0 Mankato STEAM POWER COOLING - ONCE THROUGH<br />
NSP CO DBA XCEL ENERGY Surface <strong>Water</strong> 0.0332 1.0 Mankato STEAM POWER COOLING - ONCE THROUGH<br />
NSP CO DBA XCEL ENERGY Surface <strong>Water</strong> 0.0082 1.0 Granite Falls STEAM POWER COOLING - ONCE THROUGH<br />
NSP CO DBA XCEL ENERGY Surface <strong>Water</strong> 0.0000 1.0 Granite Falls STEAM POWER COOLING - ONCE THROUGH<br />
NSP CO DBA XCEL ENERGY Surface <strong>Water</strong> 0.0000 1.0 Granite Falls STEAM POWER COOLING - ONCE THROUGH<br />
NSP CO DBA XCEL ENERGY Surface <strong>Water</strong> 0.0000 1.0 Granite Falls STEAM POWER COOLING - ONCE THROUGH<br />
NSP CO DBA XCEL ENERGY Surface <strong>Water</strong> 0.0000 1.0 Granite Falls STEAM POWER COOLING - ONCE THROUGH<br />
NSP CO DBA XCEL ENERGY Surface <strong>Water</strong> 0.0000 1.0 Granite Falls STEAM POWER COOLING - ONCE THROUGH<br />
NSP CO DBA XCEL ENERGY Surface <strong>Water</strong> 0.0000 1.0 Granite Falls STEAM POWER COOLING - ONCE THROUGH<br />
NSP CO DBA XCEL ENERGY Surface <strong>Water</strong> 0.0000 1.0 Granite Falls STEAM POWER COOLING - ONCE THROUGH<br />
NSP CO DBA XCEL ENERGY Surface <strong>Water</strong> 0.0000 1.0 Granite Falls STEAM POWER COOLING - ONCE THROUGH<br />
NSP CO DBA XCEL ENERGY Ground <strong>Water</strong> 0.0000 1.0 Met Council - Blue Lake STEAM POWER COOLING - WET TOWER<br />
Minnesota River_<strong>Industrial</strong>_060106.xls, Tab 3.11 c Page 4 of 4 6/28/2006
WATER USE (MGD)<br />
WATER USE (MGD)<br />
12<br />
10<br />
8<br />
6<br />
4<br />
2<br />
0<br />
350<br />
300<br />
250<br />
200<br />
150<br />
100<br />
50<br />
0<br />
241 242 243 244 245 246 247 248 249<br />
USE CODE<br />
222<br />
USE CODE<br />
Ground <strong>Water</strong><br />
Surface <strong>Water</strong><br />
Figure 3.11a. <strong>Industrial</strong> Processing <strong>Water</strong> <strong>Use</strong> in the Minnesota River <strong>Water</strong>shed, 2004<br />
241 Agricultural Processing<br />
242 Pulp and Paper Processing<br />
243 Mine Processing<br />
244 Sand and Gravel Washing<br />
245 <strong>Industrial</strong> Process Cooling<br />
Once-through<br />
246 Petroleum-Chemical<br />
Processing, ethanol<br />
247 Metal Processing<br />
248 Non-Metallic Processing<br />
249 <strong>Industrial</strong> Processing<br />
Ground <strong>Water</strong><br />
Surface <strong>Water</strong><br />
222 Steam Power Cooling - Once<br />
through<br />
Figure 3.11b. Power Generation <strong>Water</strong> <strong>Use</strong> in the Minnesota River <strong>Water</strong>shed, 2004
Table 3.12a. <strong>Industrial</strong> <strong>Water</strong> <strong>Use</strong> in the Mississippi River Headwaters <strong>Water</strong>shed<br />
2004 <strong>Water</strong> <strong>Use</strong>, mgd<br />
Industry Category Groundwater Surface <strong>Water</strong> Total<br />
Agricultural Processing 6.49 0.00 6.49<br />
Hydropower 0.00 0.12 0.12<br />
<strong>Industrial</strong> Process Cooling - Once Through 3.58 0.51 4.09<br />
<strong>Industrial</strong> Processing 0.87 0.00 0.87<br />
Metal Processing 1.88 0.00 1.88<br />
Mine Processing 0.24 0.00 0.24<br />
Non-Metallic Processing 0.95 0.00 0.95<br />
Nuclear Power Plant 0.05 346.60 346.65<br />
Petroleum - Chemical Processing, ethanol 2.13 0.00 2.13<br />
Power Generation 0.31 0.01 0.32<br />
Pulp and Paper Processing 2.17 26.84 29.01<br />
Sand and Gravel Washing 1.13 2.56 3.69<br />
Steam Power Cooling - Once Through 0.19 544.49 544.68<br />
Steam Power Cooling - Wet Tower 0.18 18.47 18.65<br />
Steam Power Other than Cooling 1.36 0.00 1.36<br />
Total 21.53 939.60 961.13<br />
Table 3.12b. WWTPs in the Mississippi River Headwaters <strong>Water</strong>shed<br />
Facility Name<br />
Design<br />
Capacity, mgd<br />
Ann Avg Flow, mgd<br />
Flow as % of<br />
Design<br />
Capacity<br />
2003 2004 2005 2005<br />
Alexandria Lake Area Sanitary District 3.750 2.906 77%<br />
Bemidji WWTP 2.500 1.056 42%<br />
Brainerd WWTP 3.130 2.438 78%<br />
Buffalo WWTP 3.600 1.628 45%<br />
Cambridge WWTP 1.920 0.847 44%<br />
Camp Ripley WWTP 1.440 0.115 8%<br />
Elk River WWTP 2.200 1.186 54%<br />
Glencoe WWTP 2.600 0.69 27%<br />
Grand Rapids WWTP 15.200 7.33 48%<br />
Hutchinson WWTP 4.270 2.574 60%<br />
Litchfield WWTP 1.900 1.513 80%<br />
Little Falls WWTP 2.400 1.182 49%<br />
Melrose WWTP 2.500 2.001 80%<br />
Met Council - Eagles Point WWTP* 10.000 2.34 23%<br />
Met Council - Hastings WWTP* 2.900 1.592 55%<br />
Met Council - Metropolitan WWTP 251.000 187.018 75%<br />
Monticello WWTP 2.360 1.189 50%<br />
Otsego WWTP East 1.650 0.206 12%<br />
Rogers WWTP 1.602 0.769 48%<br />
St Cloud WWTP 13.000 10.358 80%<br />
St Michael WWTP 2.445 0.834 34%<br />
Willmar WWTP 5.040 3.81 76%<br />
Total 337.407 233.582 69%<br />
* Design capacity changed per MCES instructions.
Table 3.12c. Industries in the Mississippi River Headwaters <strong>Water</strong>shed<br />
2004 <strong>Water</strong> <strong>Use</strong>,<br />
Distance<br />
to<br />
WWTP,<br />
Industry Name Resource Name mgd miles Closest WWTP Industry Category<br />
ADM MILLING CO Ground <strong>Water</strong> 0.000 >5 Met Council - Metropolitan Agricultural Processing<br />
ASSOCIATED MILK PRODUCERS Ground <strong>Water</strong> 0.024 1.00 Glencoe Agricultural Processing<br />
ASSOCIATED MILK PRODUCERS Ground <strong>Water</strong> 0.013 >5 Litchfield Agricultural Processing<br />
BURN PHILP FOOD INGREDIENTS Ground <strong>Water</strong> 0.000 1.00 Hutchinson Agricultural Processing<br />
BURN PHILP FOOD INGREDIENTS Ground <strong>Water</strong> 0.412 1.00 Hutchinson Agricultural Processing<br />
BURN PHILP FOOD INGREDIENTS Ground <strong>Water</strong> 0.076 1.00 Hutchinson Agricultural Processing<br />
BURN PHILP FOOD INGREDIENTS Ground <strong>Water</strong> 0.429 1.00 Hutchinson Agricultural Processing<br />
CAPTAIN KENS FOODS INC Ground <strong>Water</strong> 0.009 2.30 Met Council - Metropolitan Agricultural Processing<br />
DAIRI CONCEPTS LP Ground <strong>Water</strong> 0.000 >5 Buffalo Agricultural Processing<br />
DAIRI CONCEPTS LP Ground <strong>Water</strong> 0.000 >5 Buffalo Agricultural Processing<br />
DECHENE CORP Ground <strong>Water</strong> 0.002 1.00 Monticello Agricultural Processing<br />
DECHENE CORP Ground <strong>Water</strong> 0.002 1.00 Monticello Agricultural Processing<br />
DEEP ROCK WATER CO Ground <strong>Water</strong> 0.019 >5 Met Council - Metropolitan Agricultural Processing<br />
DEEP ROCK WATER CO Ground <strong>Water</strong> 0.019 >5 Met Council - Metropolitan Agricultural Processing<br />
EWING FARMS INC Ground <strong>Water</strong> 0.004 1.50 Monticello Agricultural Processing<br />
FARIBAULT FOODS INC Ground <strong>Water</strong> 0.022 >5 Buffalo Agricultural Processing<br />
FARIBAULT FOODS INC Ground <strong>Water</strong> 0.226 >5 Buffalo Agricultural Processing<br />
FARMERS UNION MARKETING Ground <strong>Water</strong> 0.003 >5 St Cloud Agricultural Processing<br />
FARMERS UNION MARKETING Ground <strong>Water</strong> 0.094 >5 Little Falls Agricultural Processing<br />
FARMERS UNION MARKETING Ground <strong>Water</strong> 0.000 >5 Little Falls Agricultural Processing<br />
FIRST DISTRICT ASSOC Ground <strong>Water</strong> 0.105 1.00 Litchfield Agricultural Processing<br />
FIRST DISTRICT ASSOC Ground <strong>Water</strong> 0.021 1.00 Litchfield Agricultural Processing<br />
GENERAL MILLS OPERATIONS INC Ground <strong>Water</strong> 0.061 >5 Met Council - Metropolitan Agricultural Processing<br />
GENERAL MILLS OPERATIONS INC Ground <strong>Water</strong> 0.025 >5 Met Council - Metropolitan Agricultural Processing<br />
GENERAL MILLS OPERATIONS INC Ground <strong>Water</strong> 0.048 >5 Met Council - Metropolitan Agricultural Processing<br />
GOLD N PLUMP POULTRY Ground <strong>Water</strong> 0.144 >5 St Cloud Agricultural Processing<br />
GOLD N PLUMP POULTRY Ground <strong>Water</strong> 0.118 >5 St Cloud Agricultural Processing<br />
GOLD N PLUMP POULTRY Ground <strong>Water</strong> 0.089 >5 St Cloud Agricultural Processing<br />
GOLD N PLUMP POULTRY Ground <strong>Water</strong> 0.137 >5 St Cloud Agricultural Processing<br />
GOLD N PLUMP POULTRY Ground <strong>Water</strong> 0.285 >5 St Cloud Agricultural Processing<br />
GOLD N PLUMP POULTRY Ground <strong>Water</strong> 0.000 >5 St Cloud Agricultural Processing<br />
ISANTI FOODS LLC Ground <strong>Water</strong> 0.001 >5 Cambridge Agricultural Processing<br />
ISANTI FOODS LLC Ground <strong>Water</strong> 0.076 >5 Cambridge Agricultural Processing<br />
LAKESIDE FOODS INC Ground <strong>Water</strong> 0.131 >5 Melrose Agricultural Processing<br />
LAMB WESTON/RDO FROZEN Ground <strong>Water</strong> 0.000 >5 Bemidji Agricultural Processing<br />
LAMB WESTON/RDO FROZEN Ground <strong>Water</strong> 0.480 >5 Bemidji Agricultural Processing<br />
LAMB WESTON/RDO FROZEN Ground <strong>Water</strong> 1.110 >5 Bemidji Agricultural Processing<br />
MEYER BROTHERS DAIRY Ground <strong>Water</strong> 0.007 >5 Buffalo Agricultural Processing<br />
M-FOODS DAIRY LLC Ground <strong>Water</strong> 0.605 >5 Met Council - Metropolitan Agricultural Processing<br />
MINNESOTA BEEF INDUSTRIES INC Ground <strong>Water</strong> 0.076 >5 Glencoe Agricultural Processing<br />
MINNESOTA BEEF INDUSTRIES INC Ground <strong>Water</strong> 0.000 >5 Glencoe Agricultural Processing<br />
NORTHERN FOOD & DAIRY INC Ground <strong>Water</strong> 0.028 >5 Alexandria Lake Area Sanitary District Agricultural Processing<br />
Mississippi_<strong>Industrial</strong> Summary_060106.xls, Tab 3.12c Page1 of 7 6/28/2006
Table 3.12c. Industries in the Mississippi River Headwaters <strong>Water</strong>shed<br />
2004 <strong>Water</strong> <strong>Use</strong>,<br />
Distance<br />
to<br />
WWTP,<br />
Industry Name Resource Name mgd miles Closest WWTP Industry Category<br />
NORTHERN FOOD & DAIRY INC Ground <strong>Water</strong> 0.000 1.50 Alexandria Lake Area Sanitary District Agricultural Processing<br />
NORTHERN FOOD & DAIRY INC Ground <strong>Water</strong> 0.310 1.50 Alexandria Lake Area Sanitary District Agricultural Processing<br />
NORTHERN STAR COMPANY Ground <strong>Water</strong> 0.324 >5 Met Council - Metropolitan Agricultural Processing<br />
OAK GROVE DAIRY Ground <strong>Water</strong> 0.009 >5 Glencoe Agricultural Processing<br />
OLD DUTCH FOODS INC Ground <strong>Water</strong> 0.068 >5 Met Council - Metropolitan Agricultural Processing<br />
OPTA FOOD INGREDIENTS INC Ground <strong>Water</strong> 0.200 1.00 Cambridge Agricultural Processing<br />
PETRON, JOHN AND CHRISTINE Ground <strong>Water</strong> 0.031 >5 Little Falls Agricultural Processing<br />
REFLO INC Ground <strong>Water</strong> 0.070 >5 St Cloud Agricultural Processing<br />
REFLO INC Ground <strong>Water</strong> 0.096 >5 St Cloud Agricultural Processing<br />
SENECA FOODS CORP Ground <strong>Water</strong> 0.183 1.00 Glencoe Agricultural Processing<br />
SENECA FOODS CORP Ground <strong>Water</strong> 0.084 1.00 Glencoe Agricultural Processing<br />
SENECA FOODS CORP Ground <strong>Water</strong> 0.028 1.00 Glencoe Agricultural Processing<br />
SENECA FOODS CORP Ground <strong>Water</strong> 0.183 1.00 Glencoe Agricultural Processing<br />
SONSTEGARD FOODS Ground <strong>Water</strong> 0.000 >5 Buffalo Agricultural Processing<br />
SONSTEGARD FOODS Ground <strong>Water</strong> 0.003 >5 Buffalo Agricultural Processing<br />
U OF MN Surface <strong>Water</strong> 0.122 >5 Met Council - Metropolitan HYDRO POWER<br />
3M COMPANY Ground <strong>Water</strong> 0.135 2.00 Met Council - Eagles Point <strong>Industrial</strong> Process Cooling Once Through<br />
3M COMPANY Ground <strong>Water</strong> 0.290 2.00 Met Council - Eagles Point <strong>Industrial</strong> Process Cooling Once Through<br />
3M COMPANY Ground <strong>Water</strong> 0.184 2.00 Met Council - Eagles Point <strong>Industrial</strong> Process Cooling Once Through<br />
3M COMPANY Ground <strong>Water</strong> 0.525 2.00 Met Council - Eagles Point <strong>Industrial</strong> Process Cooling Once Through<br />
3M COMPANY Ground <strong>Water</strong> 0.981 2.00 Met Council - Eagles Point <strong>Industrial</strong> Process Cooling Once Through<br />
3M COMPANY Ground <strong>Water</strong> 0.673 2.00 Met Council - Eagles Point <strong>Industrial</strong> Process Cooling Once Through<br />
ATEK MANUFACTURING LLC Ground <strong>Water</strong> 0.024 4.20 Brainerd <strong>Industrial</strong> Process Cooling Once Through<br />
ATEK MANUFACTURING LLC Ground <strong>Water</strong> 0.000 4.20 Brainerd <strong>Industrial</strong> Process Cooling Once Through<br />
FORD MOTOR CO Surface <strong>Water</strong> 0.512 >5 Met Council - Metropolitan <strong>Industrial</strong> Process Cooling Once Through<br />
GAF MATERIALS CORP Ground <strong>Water</strong> 0.195 >5 Met Council - Metropolitan <strong>Industrial</strong> Process Cooling Once Through<br />
HONEYWELL INC Ground <strong>Water</strong> 0.410 >5 Met Council - Metropolitan <strong>Industrial</strong> Process Cooling Once Through<br />
HONEYWELL INC Ground <strong>Water</strong> 0.000 >5 Met Council - Metropolitan <strong>Industrial</strong> Process Cooling Once Through<br />
MED-TEK INC Ground <strong>Water</strong> 0.000 >5 Met Council - Metropolitan <strong>Industrial</strong> Process Cooling Once Through<br />
PREMIER PRODUCTS INC Ground <strong>Water</strong> 0.003 >5 Cambridge <strong>Industrial</strong> Process Cooling Once Through<br />
SPX CORPORATION Ground <strong>Water</strong> 0.098 >5 St Cloud <strong>Industrial</strong> Process Cooling Once Through<br />
SPX CORPORATION Ground <strong>Water</strong> 0.033 >5 St Cloud <strong>Industrial</strong> Process Cooling Once Through<br />
VEECO INSTRUMENTS INC Ground <strong>Water</strong> 0.030 >5 Met Council - Metropolitan <strong>Industrial</strong> Process Cooling Once Through<br />
AMERICAN LINEN SUPPLY CO Ground <strong>Water</strong> 0.248 >5 Met Council - Metropolitan <strong>Industrial</strong> Processing<br />
ANOKA RED-E-MIX INC Ground <strong>Water</strong> 0.005 >5 Rogers <strong>Industrial</strong> Processing<br />
AVR INC Ground <strong>Water</strong> 0.007 >5 Rogers <strong>Industrial</strong> Processing<br />
CEMSTONE PRODUCTS Ground <strong>Water</strong> 0.004 3.60 Met Council - Metropolitan <strong>Industrial</strong> Processing<br />
DBL LABS INC Ground <strong>Water</strong> 0.002 >5 St Cloud <strong>Industrial</strong> Processing<br />
DBL LABS INC Ground <strong>Water</strong> 0.004 >5 St Cloud <strong>Industrial</strong> Processing<br />
ECOLAB INC Ground <strong>Water</strong> 0.016 \ \ <strong>Industrial</strong> Processing<br />
G & K SERVICES Ground <strong>Water</strong> 0.104 >5 Met Council - Metropolitan <strong>Industrial</strong> Processing<br />
G & K SERVICES Ground <strong>Water</strong> 0.061 >5 Met Council - Metropolitan <strong>Industrial</strong> Processing<br />
Mississippi_<strong>Industrial</strong> Summary_060106.xls, Tab 3.12c Page2 of 7 6/28/2006
Table 3.12c. Industries in the Mississippi River Headwaters <strong>Water</strong>shed<br />
2004 <strong>Water</strong> <strong>Use</strong>,<br />
Distance<br />
to<br />
WWTP,<br />
Industry Name Resource Name mgd miles Closest WWTP Industry Category<br />
HONEYWELL INC Ground <strong>Water</strong> 0.210 >5 Met Council - Metropolitan <strong>Industrial</strong> Processing<br />
HONEYWELL INC Ground <strong>Water</strong> 0.126 >5 Met Council - Metropolitan <strong>Industrial</strong> Processing<br />
JERRYS ICE SERVICE Ground <strong>Water</strong> 0.008 2.50 Bemidji <strong>Industrial</strong> Processing<br />
LEEF BROTHERS INC Ground <strong>Water</strong> 0.059 >5 Met Council - Metropolitan <strong>Industrial</strong> Processing<br />
PEARSON CANDY COMPANY Ground <strong>Water</strong> 0.013 >5 Met Council - Metropolitan <strong>Industrial</strong> Processing<br />
SPRING PARK LAUNDRY Ground <strong>Water</strong> 0.001 >5 Buffalo <strong>Industrial</strong> Processing<br />
STYLMARK INC Ground <strong>Water</strong> 0.001 >5 Met Council - Metropolitan <strong>Industrial</strong> Processing<br />
AACRON INC Ground <strong>Water</strong> 0.321 >5 Met Council - Metropolitan Metal Processing<br />
AACRON INC Ground <strong>Water</strong> 0.224 >5 Met Council - Metropolitan Metal Processing<br />
ACME METAL SPINNING Ground <strong>Water</strong> 0.001 >5 Met Council - Metropolitan Metal Processing<br />
ALEXANDRIA EXTRUSION CO Ground <strong>Water</strong> 0.004 1.50 Alexandria Lake Area Sanitary District Metal Processing<br />
COOPERATIVE PLATING Ground <strong>Water</strong> 0.053 >5 Met Council - Metropolitan Metal Processing<br />
FLAME METALS PROCESSING Ground <strong>Water</strong> 0.000 >5 Met Council - Metropolitan Metal Processing<br />
HARD CHROME INC Ground <strong>Water</strong> 0.054 >5 Met Council - Metropolitan Metal Processing<br />
HIAWATHA METALCRAFT INC Ground <strong>Water</strong> 0.504 >5 Met Council - Metropolitan Metal Processing<br />
HIAWATHA METALCRAFT INC Ground <strong>Water</strong> 0.047 >5 Met Council - Metropolitan Metal Processing<br />
KURT MANUFACTURING COMPANY Ground <strong>Water</strong> 0.000 >5 Met Council - Metropolitan Metal Processing<br />
METAL-MATIC INC Ground <strong>Water</strong> 0.224 >5 Met Council - Metropolitan Metal Processing<br />
METAL-MATIC INC Ground <strong>Water</strong> 0.000 >5 Met Council - Metropolitan Metal Processing<br />
MINNESOTA METAL FINISHING INC Ground <strong>Water</strong> 0.024 >5 Met Council - Metropolitan Metal Processing<br />
NORTH STAR STEEL MINNESOTA Ground <strong>Water</strong> 0.000 2.50 Met Council - Metropolitan Metal Processing<br />
NORTH STAR STEEL MINNESOTA Ground <strong>Water</strong> 0.059 2.50 Met Council - Metropolitan Metal Processing<br />
NORTH STAR STEEL MINNESOTA Ground <strong>Water</strong> 0.082 2.50 Met Council - Metropolitan Metal Processing<br />
NORTH STAR STEEL ST PAUL Ground <strong>Water</strong> 0.022 2.50 Met Council - Metropolitan Metal Processing<br />
NORTH STAR STEEL ST PAUL Ground <strong>Water</strong> 0.013 2.50 Met Council - Metropolitan Metal Processing<br />
NORTHERN MALLEABLE IRON CO Ground <strong>Water</strong> 0.038 3.00 Met Council - Metropolitan Metal Processing<br />
PIONEER METAL FINISHING CORP Ground <strong>Water</strong> 0.133 >5 Met Council - Metropolitan Metal Processing<br />
PLATING INC Ground <strong>Water</strong> 0.016 >5 Met Council - Metropolitan Metal Processing<br />
REO PLASTICS INC Ground <strong>Water</strong> 0.000 >5 Rogers Metal Processing<br />
REO PLASTICS INC Ground <strong>Water</strong> 0.003 >5 Rogers Metal Processing<br />
SPECTRO ALLOYS CORP Ground <strong>Water</strong> 0.006 4.70 Met Council - Eagles Point Metal Processing<br />
SPECTRO ALLOYS CORP Ground <strong>Water</strong> 0.000 4.70 Met Council - Eagles Point Metal Processing<br />
SUPERIOR PLATING INC Ground <strong>Water</strong> 0.048 >5 Met Council - Metropolitan Metal Processing<br />
COLD SPRING GRANITE CO Ground <strong>Water</strong> 0.005 >5 St Cloud Mine Processing<br />
COLD SPRING GRANITE CO Ground <strong>Water</strong> 0.021 >5 St Cloud Mine Processing<br />
COLD SPRING GRANITE CO Ground <strong>Water</strong> 0.045 >5 St Cloud Mine Processing<br />
COLD SPRING GRANITE CO Ground <strong>Water</strong> 0.001 >5 St Cloud Mine Processing<br />
COLD SPRING GRANITE CO Ground <strong>Water</strong> 0.009 >5 St Cloud Mine Processing<br />
COLD SPRING GRANITE CO Ground <strong>Water</strong> 0.009 >5 St Cloud Mine Processing<br />
COLD SPRING GRANITE CO Ground <strong>Water</strong> 0.009 >5 St Cloud Mine Processing<br />
EDWARD KRAEMER & SONS INC Ground <strong>Water</strong> 0.000 >5 Little Falls Mine Processing<br />
EDWARD KRAEMER & SONS INC Ground <strong>Water</strong> 0.000 >5 Little Falls Mine Processing<br />
Mississippi_<strong>Industrial</strong> Summary_060106.xls, Tab 3.12c Page3 of 7 6/28/2006
Table 3.12c. Industries in the Mississippi River Headwaters <strong>Water</strong>shed<br />
2004 <strong>Water</strong> <strong>Use</strong>,<br />
Distance<br />
to<br />
WWTP,<br />
Industry Name Resource Name mgd miles Closest WWTP Industry Category<br />
UNITED STATES STEEL CORP Ground <strong>Water</strong> 0.141 >5 Grand Rapids Mine Processing<br />
3M COMPANY Ground <strong>Water</strong> 0.000 3.40 Met Council - Metropolitan Non-Metallic Processing<br />
3M COMPANY Ground <strong>Water</strong> 0.000 3.40 Met Council - Metropolitan Non-Metallic Processing<br />
3M COMPANY Ground <strong>Water</strong> 0.190 3.40 Met Council - Metropolitan Non-Metallic Processing<br />
3M COMPANY Ground <strong>Water</strong> 0.132 3.40 Met Council - Metropolitan Non-Metallic Processing<br />
AGGREGATE INDUSTRIES-NCR INC Ground <strong>Water</strong> 0.016 >5 Rogers Non-Metallic Processing<br />
AGGREGATE INDUSTRIES-NCR INC Ground <strong>Water</strong> 0.009 >5 Met Council - Metropolitan Non-Metallic Processing<br />
AGGREGATE INDUSTRIES-NCR INC Ground <strong>Water</strong> 0.009 2.00 Rogers Non-Metallic Processing<br />
AGGREGATE INDUSTRIES-NCR INC Ground <strong>Water</strong> 0.001 4.50 Elk River Non-Metallic Processing<br />
AGGREGATE INDUSTRIES-NCR INC Ground <strong>Water</strong> 0.004 4.50 Elk River Non-Metallic Processing<br />
AGGREGATE INDUSTRIES-NCR INC Ground <strong>Water</strong> 0.002 >5 Rogers Non-Metallic Processing<br />
BAUERLY BROTHERS INC Ground <strong>Water</strong> 0.004 >5 St Cloud Non-Metallic Processing<br />
BAUERLY BROTHERS INC Ground <strong>Water</strong> 0.005 4.00 Cambridge Non-Metallic Processing<br />
BAUERLY BROTHERS INC Ground <strong>Water</strong> 0.002 >5 St Cloud Non-Metallic Processing<br />
BAUERLY BROTHERS INC Ground <strong>Water</strong> 0.004 1.50 Hutchinson Non-Metallic Processing<br />
BUFFALO BITUMINOUS Ground <strong>Water</strong> 0.003 >5 Monticello Non-Metallic Processing<br />
C S MCCROSSAN CONSTRUCTION0 Ground <strong>Water</strong> 0.007 >5 Rogers Non-Metallic Processing<br />
CEMSTONE PRODUCTS Ground <strong>Water</strong> 0.007 2.30 Met Council - Metropolitan Non-Metallic Processing<br />
CEMSTONE PRODUCTS Ground <strong>Water</strong> 0.014 >5 Met Council - Metropolitan Non-Metallic Processing<br />
CEMSTONE PRODUCTS Ground <strong>Water</strong> 0.008 >5 Met Council - Metropolitan Non-Metallic Processing<br />
CF INDUSTRIES INC Ground <strong>Water</strong> 0.010 4.80 Met Council - Eagles Point Non-Metallic Processing<br />
CF INDUSTRIES INC Ground <strong>Water</strong> 0.000 4.80 Met Council - Eagles Point Non-Metallic Processing<br />
D & D LAND LLC Ground <strong>Water</strong> 0.000 3.30 Met Council - Metropolitan Non-Metallic Processing<br />
ELK RIVER RED-E-MIX INC Ground <strong>Water</strong> 0.006 3.90 Elk River Non-Metallic Processing<br />
FEDERAL CARTRIDGE CO Ground <strong>Water</strong> 0.003 >5 Rogers Non-Metallic Processing<br />
FEDERAL CARTRIDGE CO Ground <strong>Water</strong> 0.000 >5 Rogers Non-Metallic Processing<br />
FEDERAL CARTRIDGE CO Ground <strong>Water</strong> 0.131 >5 Rogers Non-Metallic Processing<br />
HANSON SPANCRETE MIDWEST INC Ground <strong>Water</strong> 0.000 >5 Rogers Non-Metallic Processing<br />
HANSON SPANCRETE MIDWEST INC Ground <strong>Water</strong> 0.021 >5 Rogers Non-Metallic Processing<br />
HONEYWELL INC Ground <strong>Water</strong> 0.136 >5 Met Council - Metropolitan Non-Metallic Processing<br />
MARSHALL CONCRETE PRODUCTS INC Ground <strong>Water</strong> 0.006 >5 Otesego East Non-Metallic Processing<br />
MARSHALL CONCRETE PRODUCTS INC Ground <strong>Water</strong> 0.006 >5 Met Council - Metropolitan Non-Metallic Processing<br />
MCO LENS INC Ground <strong>Water</strong> 0.011 >5 St Cloud Non-Metallic Processing<br />
PECHINEY PLASTIC PACKAGING INC Ground <strong>Water</strong> 0.008 >5 Met Council - Metropolitan Non-Metallic Processing<br />
POTLATCH CORPORATION Ground <strong>Water</strong> 0.012 >5 Bemidji Non-Metallic Processing<br />
POTLATCH CORPORATION Ground <strong>Water</strong> 0.065 >5 Bemidji Non-Metallic Processing<br />
ROBINSON RUBBER Ground <strong>Water</strong> 0.032 >5 Rogers Non-Metallic Processing<br />
TWO THOUSAND FAHRENHEIT INC Ground <strong>Water</strong> 0.001 >5 Monticello Non-Metallic Processing<br />
WEYERHAEUSER COMPANY Ground <strong>Water</strong> 0.007 >5 Brainerd Non-Metallic Processing<br />
WEYERHAEUSER COMPANY Ground <strong>Water</strong> 0.006 >5 Brainerd Non-Metallic Processing<br />
WEYERHAEUSER COMPANY Ground <strong>Water</strong> 0.000 >5 Brainerd Non-Metallic Processing<br />
WEYERHAEUSER COMPANY Ground <strong>Water</strong> 0.021 >5 Brainerd Non-Metallic Processing<br />
Mississippi_<strong>Industrial</strong> Summary_060106.xls, Tab 3.12c Page4 of 7 6/28/2006
Table 3.12c. Industries in the Mississippi River Headwaters <strong>Water</strong>shed<br />
2004 <strong>Water</strong> <strong>Use</strong>,<br />
Distance<br />
to<br />
WWTP,<br />
Industry Name Resource Name mgd miles Closest WWTP Industry Category<br />
WEYERHAEUSER COMPANY Ground <strong>Water</strong> 0.009 >5 Brainerd Non-Metallic Processing<br />
WEYERHAEUSER COMPANY Ground <strong>Water</strong> 0.022 >5 Brainerd Non-Metallic Processing<br />
WEYERHAEUSER COMPANY Ground <strong>Water</strong> 0.005 >5 Brainerd Non-Metallic Processing<br />
WEYERHAEUSER COMPANY Ground <strong>Water</strong> 0.005 >5 Brainerd Non-Metallic Processing<br />
WEYERHAEUSER COMPANY Ground <strong>Water</strong> 0.006 >5 Brainerd Non-Metallic Processing<br />
XCEL OPTICAL COMPANY Ground <strong>Water</strong> 0.005 3.00 St Cloud Non-Metallic Processing<br />
NSP CO DBA XCEL ENERGY Surface <strong>Water</strong> 346.603 4.30 Monticello NUCLEAR POWER PLANT<br />
NSP CO DBA XCEL ENERGY Ground <strong>Water</strong> 0.047 4.30 Monticello NUCLEAR POWER PLANT<br />
NSP CO DBA XCEL ENERGY Ground <strong>Water</strong> 0.000 4.30 Monticello NUCLEAR POWER PLANT<br />
BUSHMILLS ETHANOL Ground <strong>Water</strong> 0.000 >5 Willmar Petroleum-chemical Processing, Ethanol<br />
FLINT HILLS RESOURCES LP Ground <strong>Water</strong> 0.000 5.00 Met Council - Metropolitan Petroleum-chemical Processing, Ethanol<br />
GOPHER STATE ETHANOL LLC Ground <strong>Water</strong> 0.181 4.00 Met Council - Metropolitan Petroleum-chemical Processing, Ethanol<br />
GOPHER STATE ETHANOL LLC Ground <strong>Water</strong> 0.000 4.00 Met Council - Metropolitan Petroleum-chemical Processing, Ethanol<br />
MARATHON ASHLAND PETROLEUM LLC Ground <strong>Water</strong> 0.716 >5 Met Council - Metropolitan Petroleum-chemical Processing, Ethanol<br />
MARATHON ASHLAND PETROLEUM LLC Ground <strong>Water</strong> 0.631 >5 Met Council - Metropolitan Petroleum-chemical Processing, Ethanol<br />
MARATHON ASHLAND PETROLEUM LLC Ground <strong>Water</strong> 0.098 >5 Met Council - Metropolitan Petroleum-chemical Processing, Ethanol<br />
MARATHON ASHLAND PETROLEUM LLC Ground <strong>Water</strong> 0.200 >5 Met Council - Metropolitan Petroleum-chemical Processing, Ethanol<br />
MARATHON ASHLAND PETROLEUM LLC Ground <strong>Water</strong> 0.065 >5 Met Council - Metropolitan Petroleum-chemical Processing, Ethanol<br />
MINNESOTA ENERGY Ground <strong>Water</strong> 0.000 >5 Glencoe Petroleum-chemical Processing, Ethanol<br />
MINNESOTA ENERGY Ground <strong>Water</strong> 0.239 >5 Glencoe Petroleum-chemical Processing, Ethanol<br />
ELK RIVER, CITY OF Surface <strong>Water</strong> 0.006 1.00 Elk River POWER GENERATION<br />
LSP-COTTAGE GROVE LP Ground <strong>Water</strong> 0.000 2.00 Met Council - Eagles Point POWER GENERATION<br />
NSP CO DBA XCEL ENERGY Ground <strong>Water</strong> 0.192 >5 Met Council - Metropolitan POWER GENERATION<br />
NSP CO DBA XCEL ENERGY Ground <strong>Water</strong> 0.114 >5 Met Council - Metropolitan POWER GENERATION<br />
BLANDIN PAPER CO Surface <strong>Water</strong> 16.680 1.50 Grand Rapids Pulp and Paper Processing<br />
INTERNATIONAL PAPER CO Surface <strong>Water</strong> 9.801 >5 St Cloud Pulp and Paper Processing<br />
LIBERTY PAPER INC Ground <strong>Water</strong> 0.354 >5 Monticello Pulp and Paper Processing<br />
LIBERTY PAPER INC Ground <strong>Water</strong> 0.256 >5 Monticello Pulp and Paper Processing<br />
LIBERTY PAPER INC Ground <strong>Water</strong> 0.000 >5 Monticello Pulp and Paper Processing<br />
NORBORD MINNESOTA Ground <strong>Water</strong> 0.025 >5 Bemidji Pulp and Paper Processing<br />
NRG ENERGY CENTER INC Ground <strong>Water</strong> 0.204 3.10 Met Council - Metropolitan Pulp and Paper Processing<br />
POTLATCH CORPORATION Surface <strong>Water</strong> 0.007 3.50 Grand Rapids Pulp and Paper Processing<br />
POTLATCH CORPORATION Ground <strong>Water</strong> 0.015 >5 Bemidji Pulp and Paper Processing<br />
POTLATCH CORPORATION Ground <strong>Water</strong> 0.000 >5 Bemidji Pulp and Paper Processing<br />
WALDORF CORPORATION Ground <strong>Water</strong> 0.009 >5 Met Council - Metropolitan Pulp and Paper Processing<br />
WALDORF CORPORATION Ground <strong>Water</strong> 0.000 >5 Met Council - Metropolitan Pulp and Paper Processing<br />
WALDORF CORPORATION Ground <strong>Water</strong> 0.000 >5 Met Council - Metropolitan Pulp and Paper Processing<br />
WALDORF CORPORATION Ground <strong>Water</strong> 1.307 >5 Met Council - Metropolitan Pulp and Paper Processing<br />
WAUSAU PAPER OF MINNESOTA LLC Surface <strong>Water</strong> 0.353 4.20 Brainerd Pulp and Paper Processing<br />
AGGREGATE INDUSTRIES-NCR INC Surface <strong>Water</strong> 1.092 4.50 Met Council - Metropolitan Sand and Gravel Washing<br />
AGGREGATE INDUSTRIES-NCR INC Surface <strong>Water</strong> 0.028 4.50 Met Council - Metropolitan Sand and Gravel Washing<br />
AGGREGATE INDUSTRIES-NCR INC Ground <strong>Water</strong> 0.000 >5 Rogers Sand and Gravel Washing<br />
Mississippi_<strong>Industrial</strong> Summary_060106.xls, Tab 3.12c Page5 of 7 6/28/2006
Table 3.12c. Industries in the Mississippi River Headwaters <strong>Water</strong>shed<br />
2004 <strong>Water</strong> <strong>Use</strong>,<br />
Distance<br />
to<br />
WWTP,<br />
Industry Name Resource Name mgd miles Closest WWTP Industry Category<br />
AGGREGATE INDUSTRIES-NCR INC Ground <strong>Water</strong> 0.000 >5 Rogers Sand and Gravel Washing<br />
AGGREGATE INDUSTRIES-NCR INC Surface <strong>Water</strong> 0.373 5.00 Elk River Sand and Gravel Washing<br />
AGGREGATE INDUSTRIES-NCR INC Ground <strong>Water</strong> 0.434 4.50 Elk River Sand and Gravel Washing<br />
AGGREGATE INDUSTRIES-NCR INC Ground <strong>Water</strong> 0.067 >5 Bemidji Sand and Gravel Washing<br />
AGGREGATE INDUSTRIES-NCR INC Ground <strong>Water</strong> 0.000 >5 Brainerd Sand and Gravel Washing<br />
ALEXANDRIA CONCRETE Ground <strong>Water</strong> 0.136 >5 Alexandria Lake Area Sanitary District Sand and Gravel Washing<br />
AMCON BLOCK & PRECAST Surface <strong>Water</strong> 0.000 4.80 St Cloud Sand and Gravel Washing<br />
ANNANDALE ROCK PRODUCTS Surface <strong>Water</strong> 0.132 >5 Litchfield Sand and Gravel Washing<br />
BARTON CONTRACTING CO Surface <strong>Water</strong> 0.028 >5 Monticello Sand and Gravel Washing<br />
BARTON SAND & GRAVEL Ground <strong>Water</strong> 0.089 3.50 Elk River Sand and Gravel Washing<br />
BARTON SAND & GRAVEL Surface <strong>Water</strong> 0.093 >5 Rogers Sand and Gravel Washing<br />
BARTON SAND AND GRAVEL CO Ground <strong>Water</strong> 0.000 2.90 Elk River Sand and Gravel Washing<br />
BAUERLY BROTHERS INC Ground <strong>Water</strong> 0.017 >5 Brainerd Sand and Gravel Washing<br />
BAUERLY BROTHERS INC Ground <strong>Water</strong> 0.000 >5 Litchfield Sand and Gravel Washing<br />
BAUERLY BROTHERS INC Surface <strong>Water</strong> 0.000 >5 Litchfield Sand and Gravel Washing<br />
BAUERLY BROTHERS INC Ground <strong>Water</strong> 0.108 >5 Litchfield Sand and Gravel Washing<br />
BAUERLY BROTHERS INC Surface <strong>Water</strong> 0.002 >5 St Cloud Sand and Gravel Washing<br />
BAUERLY BROTHERS INC Ground <strong>Water</strong> 0.000 >5 Cambridge Sand and Gravel Washing<br />
BAUERLY BROTHERS INC Ground <strong>Water</strong> 0.006 >5 Brainerd Sand and Gravel Washing<br />
BREMIX/MILLE LACS AGGR & CONCRETE Surface <strong>Water</strong> 0.012 >5 Cambridge Sand and Gravel Washing<br />
CENTRAL-ALLIED ENTERPRISES INC Ground <strong>Water</strong> 0.132 >5 Melrose Sand and Gravel Washing<br />
CENTRAL-ALLIED ENTERPRISES INC Surface <strong>Water</strong> 0.000 >5 Willmar Sand and Gravel Washing<br />
CENTRAL-ALLIED ENTERPRISES INC Surface <strong>Water</strong> 0.137 >5 Willmar Sand and Gravel Washing<br />
CHAD MONSON EXCAVATING LLC Surface <strong>Water</strong> 0.000 >5 Willmar Sand and Gravel Washing<br />
DUININCK BROTHERS INC Surface <strong>Water</strong> 0.000 >5 Willmar Sand and Gravel Washing<br />
GERTKEN, RALPH Ground <strong>Water</strong> 0.047 >5 Litchfield Sand and Gravel Washing<br />
GESELL CONCRETE PRODUCTS INC Surface <strong>Water</strong> 0.049 >5 Bemidji Sand and Gravel Washing<br />
GESELL CONCRETE PRODUCTS INC Ground <strong>Water</strong> 0.024 >5 Bemidji Sand and Gravel Washing<br />
GRANITE CITY CONCRETE INC Surface <strong>Water</strong> 0.158 5.00 Little Falls Sand and Gravel Washing<br />
GRANITE CITY CONCRETE OF WATKINS Surface <strong>Water</strong> 0.022 >5 St Cloud Sand and Gravel Washing<br />
GRANITE CITY READY MIX Surface <strong>Water</strong> 0.259 2.50 St Cloud Sand and Gravel Washing<br />
GRANITE CITY READY MIX Ground <strong>Water</strong> 0.068 >5 St Cloud Sand and Gravel Washing<br />
HASSAN SAND & GRAVEL INC Surface <strong>Water</strong> 0.041 2.00 Rogers Sand and Gravel Washing<br />
HENGEL, ELMER JR Ground <strong>Water</strong> 0.001 >5 Brainerd Sand and Gravel Washing<br />
HENGEL, ELMER JR Ground <strong>Water</strong> 0.002 >5 Brainerd Sand and Gravel Washing<br />
HENGEL, ELMER JR Ground <strong>Water</strong> 0.000 >5 Brainerd Sand and Gravel Washing<br />
HENGEL, ELMER JR Ground <strong>Water</strong> 0.001 >5 Brainerd Sand and Gravel Washing<br />
KINGSWAY CONSTRUCTION Surface <strong>Water</strong> 0.005 >5 Little Falls Sand and Gravel Washing<br />
KRAMER EXCAVATING, RANDY Surface <strong>Water</strong> 0.029 >5 St Cloud Sand and Gravel Washing<br />
LEE, MARK Ground <strong>Water</strong> 0.001 1.50 Alexandria Lake Area Sanitary District Sand and Gravel Washing<br />
MORICAL BROTHERS INC Surface <strong>Water</strong> 0.044 >5 Alexandria Lake Area Sanitary District Sand and Gravel Washing<br />
Mississippi_<strong>Industrial</strong> Summary_060106.xls, Tab 3.12c Page6 of 7 6/28/2006
Table 3.12c. Industries in the Mississippi River Headwaters <strong>Water</strong>shed<br />
2004 <strong>Water</strong> <strong>Use</strong>,<br />
Distance<br />
to<br />
WWTP,<br />
Industry Name Resource Name mgd miles Closest WWTP Industry Category<br />
NORTHSTAR MATERIALS, INC Surface <strong>Water</strong> 0.000 >5 Bemidji Sand and Gravel Washing<br />
SCHWARTZ REDI MIX INC Surface <strong>Water</strong> 0.059 4.30 Grand Rapids Sand and Gravel Washing<br />
STOMMES CONSTRUCTION Surface <strong>Water</strong> 0.000 >5 Monticello Sand and Gravel Washing<br />
FOSTER WHEELER TWIN CITIES INC Surface <strong>Water</strong> 0.000 >5 Met Council - Metropolitan STEAM POWER - OTHER THAN COOLING<br />
GREAT RIVER ENERGY Ground <strong>Water</strong> 0.054 1.00 Elk River STEAM POWER - OTHER THAN COOLING<br />
NSP CO DBA XCEL ENERGY Ground <strong>Water</strong> 0.000 >5 Monticello STEAM POWER - OTHER THAN COOLING<br />
NSP CO DBA XCEL ENERGY Ground <strong>Water</strong> 0.131 >5 Monticello STEAM POWER - OTHER THAN COOLING<br />
NSP CO DBA XCEL ENERGY Ground <strong>Water</strong> 0.149 >5 Monticello STEAM POWER - OTHER THAN COOLING<br />
NSP CO DBA XCEL ENERGY Ground <strong>Water</strong> 0.135 >5 Monticello STEAM POWER - OTHER THAN COOLING<br />
NSP CO DBA XCEL ENERGY Ground <strong>Water</strong> 0.299 >5 Monticello STEAM POWER - OTHER THAN COOLING<br />
NSP CO DBA XCEL ENERGY Ground <strong>Water</strong> 0.000 >5 Monticello STEAM POWER - OTHER THAN COOLING<br />
NSP CO DBA XCEL ENERGY Ground <strong>Water</strong> 0.258 >5 Monticello STEAM POWER - OTHER THAN COOLING<br />
NSP CO DBA XCEL ENERGY Ground <strong>Water</strong> 0.224 >5 Monticello STEAM POWER - OTHER THAN COOLING<br />
NSP CO DBA XCEL ENERGY Ground <strong>Water</strong> 0.107 >5 Met Council - Metropolitan STEAM POWER - OTHER THAN COOLING<br />
OTTER TAIL POWER CO Ground <strong>Water</strong> 0.004 >5 Bemidji STEAM POWER - OTHER THAN COOLING<br />
GREAT RIVER ENERGY Surface <strong>Water</strong> 34.728 1.00 Elk River STEAM POWER COOLING - ONCE THROUGH<br />
MINNESOTA POWER Surface <strong>Water</strong> 38.494 >5 Grand Rapids STEAM POWER COOLING - ONCE THROUGH<br />
MINNESOTA POWER Surface <strong>Water</strong> 38.410 >5 Grand Rapids STEAM POWER COOLING - ONCE THROUGH<br />
MINNESOTA POWER Surface <strong>Water</strong> 38.574 >5 Grand Rapids STEAM POWER COOLING - ONCE THROUGH<br />
MINNESOTA POWER Surface <strong>Water</strong> 38.250 >5 Grand Rapids STEAM POWER COOLING - ONCE THROUGH<br />
MINNESOTA POWER Ground <strong>Water</strong> 0.049 >5 Grand Rapids STEAM POWER COOLING - ONCE THROUGH<br />
MINNESOTA POWER Ground <strong>Water</strong> 0.000 >5 Grand Rapids STEAM POWER COOLING - ONCE THROUGH<br />
MINNESOTA POWER Ground <strong>Water</strong> 0.144 >5 Grand Rapids STEAM POWER COOLING - ONCE THROUGH<br />
MINNESOTA POWER Surface <strong>Water</strong> 0.361 >5 Grand Rapids STEAM POWER COOLING - ONCE THROUGH<br />
MINNESOTA POWER Surface <strong>Water</strong> 0.098 >5 Grand Rapids STEAM POWER COOLING - ONCE THROUGH<br />
MINNESOTA POWER Surface <strong>Water</strong> 11.936 >5 Grand Rapids STEAM POWER COOLING - ONCE THROUGH<br />
MINNESOTA POWER Surface <strong>Water</strong> 0.316 >5 Grand Rapids STEAM POWER COOLING - ONCE THROUGH<br />
NSP CO DBA XCEL ENERGY Surface <strong>Water</strong> 126.474 >5 Met Council - Metropolitan STEAM POWER COOLING - ONCE THROUGH<br />
NSP CO DBA XCEL ENERGY Surface <strong>Water</strong> 0.000 >5 Met Council - Metropolitan STEAM POWER COOLING - ONCE THROUGH<br />
NSP CO DBA XCEL ENERGY Surface <strong>Water</strong> 0.000 >5 Met Council - Metropolitan STEAM POWER COOLING - ONCE THROUGH<br />
NSP CO DBA XCEL ENERGY Surface <strong>Water</strong> 0.000 >5 Met Council - Metropolitan STEAM POWER COOLING - ONCE THROUGH<br />
NSP CO DBA XCEL ENERGY Surface <strong>Water</strong> 84.215 >5 Met Council - Metropolitan STEAM POWER COOLING - ONCE THROUGH<br />
NSP CO DBA XCEL ENERGY Surface <strong>Water</strong> 132.737 3.70 Met Council - Metropolitan STEAM POWER COOLING - ONCE THROUGH<br />
NSP CO DBA XCEL ENERGY Surface <strong>Water</strong> 18.467 >5 Monticello STEAM POWER COOLING - WET TOWER<br />
OTTER TAIL POWER CO Ground <strong>Water</strong> 0.002 >5 Bemidji STEAM POWER COOLING - WET TOWER<br />
POTLATCH CORPORATION Ground <strong>Water</strong> 0.182 >5 Bemidji STEAM POWER COOLING - WET TOWER<br />
Mississippi_<strong>Industrial</strong> Summary_060106.xls, Tab 3.12c Page7 of 7 6/28/2006
WATER USE (MGD)<br />
WATER USE (MGD)<br />
35<br />
30<br />
25<br />
20<br />
15<br />
10<br />
5<br />
0<br />
600<br />
500<br />
400<br />
300<br />
200<br />
100<br />
0<br />
241 242 243 244 245 246 247 248 249<br />
USE CODE<br />
221 222 223 225 226 229<br />
USE CODE<br />
Ground <strong>Water</strong><br />
Surface <strong>Water</strong><br />
241 Agricultural Processing<br />
242 Pulp and Paper Processing<br />
243 Mine Processing<br />
244 Sand and Gravel Washing<br />
245 <strong>Industrial</strong> Process Cooling Once -<br />
through<br />
246 Petroleum-chemical processing,<br />
ethanol<br />
247 Metal Processing<br />
248 Non-Metallic Processing<br />
249 <strong>Industrial</strong> Processing<br />
Figure 3.12a. <strong>Industrial</strong> Processing <strong>Water</strong> <strong>Use</strong> in the Mississippi River Headwaters <strong>Water</strong>shed, 2004<br />
Ground <strong>Water</strong><br />
Surface <strong>Water</strong><br />
221 Hydropower<br />
222 Steam Power Cooling - Once through<br />
223 Steam Power Cooling - Wet Tower<br />
225 Steam Power Other than Cooling<br />
226 Nuclear Power Plant<br />
229 Power Generation<br />
Figure 3.12b. Power Generation <strong>Water</strong> <strong>Use</strong> in the Mississippi River Headwaters <strong>Water</strong>shed, 2004
Table 3.13a. <strong>Industrial</strong> <strong>Water</strong> <strong>Use</strong> in the Missouri River <strong>Water</strong>shed<br />
2004 <strong>Water</strong> <strong>Use</strong>, mgd<br />
Industry Category Groundwater Surface <strong>Water</strong> Total<br />
Sand and Gravel Washing 0.00 0.06 0.06<br />
Total 0.00 0.06 0.06<br />
Table 3.13b. WWTPs in the Missouri River <strong>Water</strong>shed<br />
Facility Name<br />
Design<br />
Capacity, mgd<br />
Ann Avg Flow, mgd<br />
2003 2004 2005<br />
Luverne WWTP 1.500 0.865<br />
Total 1.500 0.865<br />
Table 3.13c. Industries in the Missouri River <strong>Water</strong>shed<br />
2004 <strong>Water</strong> <strong>Use</strong>,<br />
Distance<br />
to WWTP, Closest<br />
Industry Name Resource Name mgd miles WWTP Industry Category<br />
NORTHERN CON-AGG INC Surface <strong>Water</strong> 0.000 5.0 Luverne Sand and Gravel Washing<br />
NORTHERN CON-AGG INC Surface <strong>Water</strong> 0.061 2.5 Luverne Sand and Gravel Washing
WATER USE (MGD)<br />
0.07<br />
0.06<br />
0.05<br />
0.04<br />
0.03<br />
0.02<br />
0.01<br />
0<br />
244<br />
USE CODE<br />
Ground <strong>Water</strong><br />
Surface <strong>Water</strong><br />
244 Sand and Gravel Washing<br />
Figure 3.13a. <strong>Industrial</strong> Processing <strong>Water</strong> <strong>Use</strong> in the Missouri River <strong>Water</strong>shed, 2004
Table 3.14a. <strong>Industrial</strong> <strong>Water</strong> <strong>Use</strong> in the Rainy River <strong>Water</strong>shed<br />
2004 <strong>Water</strong> <strong>Use</strong>, mgd<br />
Industry Category Groundwater Surface <strong>Water</strong> Total<br />
Mine Processing 0.00 0.01 0.01<br />
Pulp and Paper Processing 0.07 46.70 46.77<br />
Sand and Gravel Washing 0.00 0.14 0.14<br />
Total 0.07 46.85 46.92<br />
Table 3.14b. WWTPs in the Rainy River <strong>Water</strong>shed<br />
Facility Name<br />
Design<br />
Capacity, mgd<br />
Ann Avg Flow, mgd<br />
2003 2004 2005<br />
NKASD WWTP 2.300 1.264<br />
Ely WWTP 1.500 0.688<br />
Total 3.800 1.952<br />
Table 3.14c. Industries in the Rainy River <strong>Water</strong>shed<br />
2004 <strong>Water</strong> <strong>Use</strong>,<br />
Distance<br />
to WWTP, Closest<br />
Industry Name Resource Name mgd miles WWTP Industry Category<br />
UNITED STATES STEEL CORP Surface <strong>Water</strong> 0.010 >10 Ely Mine Processing<br />
BOISE WHITE PAPER LLC Surface <strong>Water</strong> 26.133 2.3 NKASD Pulp and Paper Processing<br />
BOISE WHITE PAPER LLC Surface <strong>Water</strong> 20.551 2.3 NKASD Pulp and Paper Processing<br />
KNAEBLE TIMBER INC Surface <strong>Water</strong> 0.018 >10 NKASD Pulp and Paper Processing<br />
POTLATCH CORPORATION Ground <strong>Water</strong> 0.067 >10 Ely Pulp and Paper Processing<br />
POTLATCH CORPORATION Ground <strong>Water</strong> 0.000 >10 Ely Pulp and Paper Processing<br />
SEPPI BROS CONCRETE Surface <strong>Water</strong> 0.005 >10 Ely Sand and Gravel Washing<br />
SEPPI BROS CONCRETE Surface <strong>Water</strong> 0.131 >10 Ely Sand and Gravel Washing
WATER USE (MGD)<br />
50<br />
45<br />
40<br />
35<br />
30<br />
25<br />
20<br />
15<br />
10<br />
5<br />
0<br />
242 243<br />
USE CODE<br />
244<br />
Ground <strong>Water</strong><br />
Surface <strong>Water</strong><br />
242 Pulp and Paper Processing<br />
243 Mine Processing<br />
244 Sand and Gravel Washing<br />
Figure 3.14. <strong>Industrial</strong> Processing <strong>Water</strong> <strong>Use</strong> in the Rainy River <strong>Water</strong>shed, 2004
Table 3.15a. <strong>Industrial</strong> <strong>Water</strong> <strong>Use</strong> in the Red River of the North <strong>Water</strong>shed<br />
Industry Category Groundwater<br />
2004 <strong>Water</strong> <strong>Use</strong>, mgd<br />
Surface <strong>Water</strong> Total<br />
Agricultural Processing 0.91 0.09 1.00<br />
Power Generation 0.00 54.43 54.43<br />
Sand & Gravel Washing 1.26 0.69 1.95<br />
Total 2.17 55.21 57.38<br />
Table 3.15b. WWTPs in the Red River of the North <strong>Water</strong>shed<br />
Facility Name<br />
Design Capacity,<br />
mgd<br />
Ann Avg Flow, mgd<br />
2003 2004 2005<br />
Crookston WWTP 1.400 1.117<br />
Detroit Lakes WWTP 3.000 1.256<br />
East Grand Forks WWTP 1.400 1.193<br />
Fergus Falls WWTP 2.810 1.909<br />
Moorhead WWTP 9.000 4.753<br />
Thief River Falls WWTP 2.140 1.447<br />
Total 19.750 11.675
Table 3.15c. Industries in the Red River of the North <strong>Water</strong>shed<br />
2004 <strong>Water</strong> <strong>Use</strong>, Distance to WWTP,<br />
Industry Name Resource Name mgd<br />
miles Closest WWTP Industry Category<br />
AMERICAN CRYSTAL SUGAR CO Surface <strong>Water</strong> 0.000 1 Moorhead WWTP Agricultural Processing<br />
AMERICAN CRYSTAL SUGAR CO Surface <strong>Water</strong> 0.010 1.2 Crookston WWTP Agricultural Processing<br />
AMERICAN CRYSTAL SUGAR CO Surface <strong>Water</strong> 0.000 2 East Grand Forks WWTP Agricultural Processing<br />
AMERICAN CRYSTAL SUGAR CO Surface <strong>Water</strong> 0.077 >10 East Grand Forks WWTP Agricultural Processing<br />
BONGARDS CREAMERIES Ground <strong>Water</strong> 0.122 >10 Detroit Lakes WWTP Agricultural Processing<br />
BONGARDS CREAMERIES Ground <strong>Water</strong> 0.707 >10 Detroit Lakes WWTP Agricultural Processing<br />
NORTHERN FOOD & DAIRY INC Ground <strong>Water</strong> 0.077 >10 Crookston WWTP Agricultural Processing<br />
NORTHERN PRIDE INC Ground <strong>Water</strong> 0.000 2.6 Thief River Falls WWTF Agricultural Processing<br />
AGGREGATE INDUSTRIES-NCR INC Surface <strong>Water</strong> 0.096 >10 Moorhead WWTP Sand and Gravel Washing<br />
AGGREGATE INDUSTRIES-NCR INC Surface <strong>Water</strong> 0.118 >10 Moorhead WWTP Sand and Gravel Washing<br />
AGGREGATE INDUSTRIES-NCR INC Surface <strong>Water</strong> 0.000 >10 Moorhead WWTP Sand and Gravel Washing<br />
AGGREGATE INDUSTRIES-NCR INC Surface <strong>Water</strong> 0.000 >10 Detroit Lakes WWTP Sand and Gravel Washing<br />
AGGREGATE INDUSTRIES-NCR INC Ground <strong>Water</strong> 0.000 >10 Detroit Lakes WWTP Sand and Gravel Washing<br />
AGGREGATE INDUSTRIES-NCR INC Ground <strong>Water</strong> 0.262 >10 Detroit Lakes WWTP Sand and Gravel Washing<br />
AGGREGATE INDUSTRIES-NCR INC Surface <strong>Water</strong> 0.000 >10 Detroit Lakes WWTP Sand and Gravel Washing<br />
AMES SAND & GRAVEL Surface <strong>Water</strong> 0.000 >10 Moorhead WWTP Sand and Gravel Washing<br />
AMES SAND & GRAVEL Surface <strong>Water</strong> 0.195 >10 Moorhead WWTP Sand and Gravel Washing<br />
AMES SAND & GRAVEL Surface <strong>Water</strong> 0.005 >10 Moorhead WWTP Sand and Gravel Washing<br />
BRADSHAW GRAVEL SUP Surface <strong>Water</strong> 0.238 > 10 Crookston WWTP Sand and Gravel Washing<br />
CONTRACTORS LEASING Surface <strong>Water</strong> 0.000 >10 Detroit Lakes WWTP Sand and Gravel Washing<br />
DUNHAM, DAVID Surface <strong>Water</strong> 0.000 >10 Moorhead WWTP Sand and Gravel Washing<br />
MNDAK CONCRETE INC Surface <strong>Water</strong> 0.034 7.5 Thief River Falls WWTF Sand and Gravel Washing<br />
MNDAK CONCRETE INC Ground <strong>Water</strong> 0.025 7.5 Thief River Falls WWTF Sand and Gravel Washing<br />
NORTHSTAR MATERIALS INC Ground <strong>Water</strong> 0.022 >10 Crookston WWTP Sand and Gravel Washing<br />
ROCK RIDGE RESOURCES Surface <strong>Water</strong> 0.000 3 Detroit Lakes WWTP Sand and Gravel Washing<br />
ROCK RIDGE RESOURCES Ground <strong>Water</strong> 0.515 3 Detroit Lakes WWTP Sand and Gravel Washing<br />
ROCK RIDGE RESOURCES Ground <strong>Water</strong> 0.151 3 Detroit Lakes WWTP Sand and Gravel Washing<br />
STRATA CORPORATION Ground <strong>Water</strong> 0.282 > 10 Thief River Falls WWTF Sand and Gravel Washing<br />
MOORHEAD PUBLIC SERVICE Surface <strong>Water</strong> 0.000 1.5 Moorhead WWTP STEAM POWER COOLING - ONCE THROUGH<br />
MOORHEAD PUBLIC SERVICE Surface <strong>Water</strong> 0.000 1.5 Moorhead WWTP STEAM POWER COOLING - ONCE THROUGH<br />
OTTER TAIL POWER CO Surface <strong>Water</strong> 0.000 3.5 Fergus Falls WWTP STEAM POWER COOLING - ONCE THROUGH<br />
OTTER TAIL POWER CO Surface <strong>Water</strong> 54.428 3.5 Fergus Falls WWTP STEAM POWER COOLING - ONCE THROUGH<br />
OTTER TAIL POWER CO Ground <strong>Water</strong> 0.000 3.5 Fergus Falls WWTP STEAM POWER COOLING - WET TOWER<br />
OTTER TAIL POWER CO Ground <strong>Water</strong> 0.000 3.5 Fergus Falls WWTP STEAM POWER COOLING - WET TOWER
WATER USE (MGD)<br />
WATER USE (MGD)<br />
2.5<br />
2<br />
1.5<br />
1<br />
0.5<br />
0<br />
60<br />
50<br />
40<br />
30<br />
20<br />
10<br />
0<br />
241 244<br />
<strong>Use</strong> Code<br />
222<br />
USE CODE<br />
Ground <strong>Water</strong><br />
Surface <strong>Water</strong><br />
241 Agricultural Processing<br />
244 Sand and Gravel<br />
Washing<br />
Figure 3.15a. <strong>Industrial</strong> Processing <strong>Water</strong> <strong>Use</strong> in the Red River of the North <strong>Water</strong>shed, 2004<br />
Ground <strong>Water</strong><br />
Surface <strong>Water</strong><br />
222 Steam Power Cooling - Once<br />
Through<br />
Figure 3.15b. Power Generation <strong>Water</strong> <strong>Use</strong> in the Red River of the North <strong>Water</strong>shed, 2004
Table 3.16a. <strong>Industrial</strong> <strong>Water</strong> <strong>Use</strong> in the St. Croix River <strong>Water</strong>shed<br />
Industry Category Groundwater<br />
2004 <strong>Water</strong> <strong>Use</strong>, mgd<br />
Surface <strong>Water</strong> Total<br />
Non-Metallic Processing 0.59 0.00 0.59<br />
Sand & Gravel Washing 0.33 0.35 0.68<br />
Steam Power Other than Cooling 0.00 325.35 325.35<br />
Total 0.92 325.70 326.62<br />
Table 3.16b. WWTPs in the St. Croix River <strong>Water</strong>shed<br />
Facility Name<br />
Design<br />
Capacity, mgd<br />
Ann Avg Flow, mgd<br />
2003 2004 2005<br />
Chisago Lakes Joint STC 1.26 0.756<br />
Met Council - St Croix Valley WWTP* 4.50 3.126<br />
Total<br />
* Design capacity changed per MCES instructions.<br />
5.76 3.882<br />
Table 3.16c. Industries in the St. Croix River <strong>Water</strong>shed<br />
Resource 2004 <strong>Water</strong> <strong>Use</strong>, Distance to<br />
Industry Name<br />
Name<br />
mgd WWTP, miles Closest WWTP Industry Category<br />
ANDERSEN CORPORATION Ground <strong>Water</strong> 0.303 4 MCES St. Croix Valley NON-METALLIC PROCESSING<br />
ANDERSEN CORPORATION Ground <strong>Water</strong> 0.288 4 MCES St. Croix Valley NON-METALLIC PROCESSING<br />
AGGREGATE INDUSTRIES-NCR INC Ground <strong>Water</strong> 0.135 5 MCES St. Croix Valley SAND & GRAVEL WASHING<br />
AGGREGATE INDUSTRIES-NCR INC Surface <strong>Water</strong> 0.315 9 Chisago Lakes Joint STC SAND & GRAVEL WASHING<br />
AGGREGATE INDUSTRIES-NCR INC Ground <strong>Water</strong> 0.092 9 Chisago Lakes Joint STC SAND & GRAVEL WASHING<br />
BARTON SAND & GRAVEL Ground <strong>Water</strong> 0.004 8 Chisago Lakes Joint STC SAND & GRAVEL WASHING<br />
BARTON SAND & GRAVEL Ground <strong>Water</strong> 0.004 7 MCES St. Croix Valley SAND & GRAVEL WASHING<br />
BAUERLY BROTHERS INC Surface <strong>Water</strong> 0.000 >10 Chisago Lakes Joint STC SAND & GRAVEL WASHING<br />
BAUERLY BROTHERS INC Ground <strong>Water</strong> 0.005 >10 Chisago Lakes Joint STC SAND & GRAVEL WASHING<br />
BLACK DIAMOND INC Ground <strong>Water</strong> 0.079 8 MCES St. Croix Valley SAND & GRAVEL WASHING<br />
BRACHT BROS INC Ground <strong>Water</strong> 0.001 >10 MCES St. Croix Valley SAND & GRAVEL WASHING<br />
HOPKINS SAND & GRAVEL Ground <strong>Water</strong> 0.013 >10 Chisago Lakes Joint STC SAND & GRAVEL WASHING<br />
HOPKINS SAND & GRAVEL Ground <strong>Water</strong> 0.007 >10 Chisago Lakes Joint STC SAND & GRAVEL WASHING<br />
HOPKINS SAND & GRAVEL Ground <strong>Water</strong> 0.002 >10 Chisago Lakes Joint STC SAND & GRAVEL WASHING<br />
STAFNE AND AND GRAVEL LLC Surface <strong>Water</strong> 0.037 >10 Chisago Lakes Joint STC SAND & GRAVEL WASHING<br />
NSP CO DBA XCEL ENERGY Surface <strong>Water</strong> 325.347 5 MCES St. Croix Valley STEAM POWER - OTHER THAN COOLING
WATER USE (MGD)<br />
WATER USE (MGD)<br />
0.8<br />
0.7<br />
0.6<br />
0.5<br />
0.4<br />
0.3<br />
0.2<br />
0.1<br />
0<br />
350<br />
300<br />
250<br />
200<br />
150<br />
100<br />
50<br />
0<br />
244 248<br />
USE CODE<br />
225<br />
USE CODE<br />
Ground <strong>Water</strong><br />
Surface <strong>Water</strong><br />
244 Sand and Gravel Washing<br />
248 Non-Metallic Processing<br />
Figure 3.16a. <strong>Industrial</strong> Processing <strong>Water</strong> <strong>Use</strong> in the St. Croix <strong>Water</strong>shed, 2004<br />
Surface <strong>Water</strong><br />
225 Steam Power Other than<br />
Cooling<br />
Figure 3.16b. Power Generation <strong>Water</strong> <strong>Use</strong> in the St. Croix <strong>Water</strong>shed, 2004
Table 3.17a. <strong>Industrial</strong> <strong>Water</strong> <strong>Use</strong> in the Western Lake Superior <strong>Water</strong>shed<br />
2004 <strong>Water</strong> <strong>Use</strong>, mgd<br />
Industry Category Groundwater Surface <strong>Water</strong> Total<br />
Mine Processing 0.01 296.51 296.52<br />
Non-metallic Processing 0.01 0.00 0.01<br />
Petroleum - Chemical Processing, ethanol 0.00 0.43 0.43<br />
Pulp and Paper Processing 0.00 6.78 6.78<br />
Sand and Gravel Washing 0.01 0.30 0.31<br />
Steam Power Cooling - Once through 0.00 182.35 182.35<br />
Steam Power Cooling - Wet Tower 0.12 0.00 0.12<br />
Total 0.15 486.37 486.52<br />
Table 3.17b. WWTPs in the Western Lake Superior <strong>Water</strong>shed<br />
Facility Name<br />
Design<br />
Capacity, mgd<br />
Ann Avg Flow, mgd<br />
2003 2004 2005<br />
Eveleth WWTP 1.000 0.645<br />
Hibbing WWTP North Plant 3.200 0.000<br />
Hibbing WWTP South Plant 2.000 2.573<br />
Two Harbors WWTP 1.600 0.701<br />
Virginia WWTP 4.300 2.182<br />
WLSSD WWTP 48.800 38.797<br />
Total 60.900 44.898
Table 3.17c. Industries in the Western Lake Superior <strong>Water</strong>shed<br />
2004 <strong>Water</strong> <strong>Use</strong>,<br />
Distance<br />
to WWTP,<br />
Industry Name Resource Name mgd miles Closest WWTP Industry Category<br />
DULUTH, MISSABE & IRON RANGE RAIL Surface <strong>Water</strong> 0.002 1.5 WLSSD Mine Processing<br />
ISPAT INLAND MINING Surface <strong>Water</strong> 0.000 3.5 Virginia Mine Processing<br />
MINNESOTA POWER & CLIFFS ERIE LLC Surface <strong>Water</strong> 0.000 >10 Virginia Mine Processing<br />
MINNESOTA POWER & CLIFFS ERIE LLC Surface <strong>Water</strong> 157.490 >10 Two harbors Mine Processing<br />
NORTHSHORE MINING COMPANY Surface <strong>Water</strong> 128.764 >10 Two harbors Mine Processing<br />
NORTHSHORE MINING COMPANY Surface <strong>Water</strong> 3.665 >10 Two harbors Mine Processing<br />
UNITED STATES STEEL CORP Surface <strong>Water</strong> 0.000 4.0 Virginia Mine Processing<br />
UNITED STATES STEEL CORP Surface <strong>Water</strong> 0.000 6.0 Virginia Mine Processing<br />
UNITED STATES STEEL CORP Surface <strong>Water</strong> 0.010 7.5 Virginia Mine Processing<br />
UNITED TACONITE LLC Surface <strong>Water</strong> 6.575 6.3 Eveleth Mine Processing<br />
UNITED TACONITE LLC Ground <strong>Water</strong> 0.000 1.2 Eveleth Mine Processing<br />
UNITED TACONITE LLC Ground <strong>Water</strong> 0.000 1.2 Eveleth Mine Processing<br />
UNITED TACONITE LLC Ground <strong>Water</strong> 0.000 7.0 WLSSD Mine Processing<br />
UNITED TACONITE LLC Ground <strong>Water</strong> 0.009 7.0 WLSSD Mine Processing<br />
UNITED TACONITE LLC Ground <strong>Water</strong> 0.000 1.5 Virginia Mine Processing<br />
UNITED TACONITE LLC Ground <strong>Water</strong> 0.000 1.5 Virginia Mine Processing<br />
ARROWHEAD CONCRETE WORKS Ground <strong>Water</strong> 0.005 9.9 WLSSD Non-Metallic Processing<br />
ELK RIVER CONCRETE PRODUCTS Ground <strong>Water</strong> 0.001 9.0 Virginia Non-Metallic Processing<br />
TATE & LYLE CITRIC ACID INC Surface <strong>Water</strong> 0.429 5.0 WLSSD Petroleum - Chemical Processing<br />
DIAMOND BRANDS INC Surface <strong>Water</strong> 0.106 >10 WLSSD Pulp and Paper Processing<br />
GEORGIA PACIFIC CORP Surface <strong>Water</strong> 1.228 1.6 WLSSD Pulp and Paper Processing<br />
GEORGIA PACIFIC CORP Surface <strong>Water</strong> 0.000 1.6 WLSSD Pulp and Paper Processing<br />
SAPPI CLOQUET LLC Surface <strong>Water</strong> 3.905 >10 WLSSD Pulp and Paper Processing<br />
USG INTERIORS INC Surface <strong>Water</strong> 1.375 >10 WLSSD Pulp and Paper Processing<br />
USG INTERIORS INC Surface <strong>Water</strong> 0.161 >10 WLSSD Pulp and Paper Processing<br />
COONS AGGREGATE SUPPLY CO Surface <strong>Water</strong> 0.098 >10 WLSSD Sand and Gravel Washing<br />
DULUTH READY MIX CONCRETE Surface <strong>Water</strong> 0.082 >10 WLSSD Sand and Gravel Washing<br />
ISAK HANSON & SONS INC Ground <strong>Water</strong> 0.000 >10 Two harbors Sand and Gravel Washing<br />
ISAK HANSON & SONS INC Ground <strong>Water</strong> 0.007 >10 Two harbors Sand and Gravel Washing<br />
SEPPI BROS CONCRETE Surface <strong>Water</strong> 0.115 2.5 Hibbing North Plant Sand and Gravel Washing<br />
MINNESOTA POWER Surface <strong>Water</strong> 0.321 >10 Virginia STEAM POWER COOLING - ONCE THROUGH<br />
MINNESOTA POWER Surface <strong>Water</strong> 61.531 >10 Virginia STEAM POWER COOLING - ONCE THROUGH<br />
MINNESOTA POWER Surface <strong>Water</strong> 64.498 >10 Virginia STEAM POWER COOLING - ONCE THROUGH<br />
MINNESOTA POWER Surface <strong>Water</strong> 0.058 >10 Virginia STEAM POWER COOLING - ONCE THROUGH<br />
MINNESOTA POWER Surface <strong>Water</strong> 0.001 >10 Virginia STEAM POWER COOLING - ONCE THROUGH<br />
MINNESOTA POWER Surface <strong>Water</strong> 0.000 >10 Virginia STEAM POWER COOLING - ONCE THROUGH<br />
MINNESOTA POWER Surface <strong>Water</strong> 1.439 >10 Virginia STEAM POWER COOLING - ONCE THROUGH<br />
MINNESOTA POWER Surface <strong>Water</strong> 0.000 2.6 WLSSD STEAM POWER COOLING - ONCE THROUGH<br />
MINNESOTA POWER Surface <strong>Water</strong> 0.000 2.6 WLSSD STEAM POWER COOLING - ONCE THROUGH<br />
MINNESOTA POWER Surface <strong>Water</strong> 0.000 2.6 WLSSD STEAM POWER COOLING - ONCE THROUGH<br />
MINNESOTA POWER Surface <strong>Water</strong> 0.000 2.6 WLSSD STEAM POWER COOLING - ONCE THROUGH<br />
MINNESOTA POWER Surface <strong>Water</strong> 43.716 2.6 WLSSD STEAM POWER COOLING - ONCE THROUGH<br />
MINNESOTA POWER Surface <strong>Water</strong> 0.537 2.6 WLSSD STEAM POWER COOLING - ONCE THROUGH<br />
MINNESOTA POWER Surface <strong>Water</strong> 0.013 2.6 WLSSD STEAM POWER COOLING - ONCE THROUGH<br />
MINNESOTA POWER Surface <strong>Water</strong> 0.000 2.6 WLSSD STEAM POWER COOLING - ONCE THROUGH<br />
TWO HARBORS, CITY OF Surface <strong>Water</strong> 0.002 1.0 Two harbors STEAM POWER COOLING - ONCE THROUGH<br />
VIRGINIA PUBLIC UTILITIES Surface <strong>Water</strong> 7.915 2.5 Virginia STEAM POWER COOLING - ONCE THROUGH<br />
VIRGINIA PUBLIC UTILITIES Surface <strong>Water</strong> 2.038 2.5 Virginia STEAM POWER COOLING - ONCE THROUGH<br />
VIRGINIA PUBLIC UTILITIES Surface <strong>Water</strong> 0.276 2.5 Virginia STEAM POWER COOLING - ONCE THROUGH<br />
MINNESOTA POWER Ground <strong>Water</strong> 0.000 9.0 WLSSD STEAM POWER COOLING - WET TOWER<br />
MINNESOTA POWER Ground <strong>Water</strong> 0.001 9.0 WLSSD STEAM POWER COOLING - WET TOWER<br />
MINNESOTA POWER Ground <strong>Water</strong> 0.014 9.0 WLSSD STEAM POWER COOLING - WET TOWER<br />
MINNESOTA POWER Ground <strong>Water</strong> 0.102 3.5 WLSSD STEAM POWER COOLING - WET TOWER
WATER USE (MGD)<br />
WATER USE (MGD)<br />
350<br />
300<br />
250<br />
200<br />
150<br />
100<br />
50<br />
200<br />
180<br />
160<br />
140<br />
120<br />
100<br />
80<br />
60<br />
40<br />
20<br />
0<br />
0<br />
242 243 244<br />
USE CODE<br />
246 248<br />
222 223<br />
USE CODE<br />
Ground <strong>Water</strong><br />
Surface <strong>Water</strong><br />
242 Pulp and Paper Processing<br />
243 Mine Processing<br />
244 Sand and Gravel Washing<br />
246 Petroleum-chemical<br />
processing, ethanol<br />
248 Non-Metallic Processing<br />
Figure 3.17a. <strong>Industrial</strong> Processing <strong>Water</strong> <strong>Use</strong> in the Western Lake Superior <strong>Water</strong>shed, 2004<br />
Ground <strong>Water</strong><br />
Surface <strong>Water</strong><br />
222 Steam Power Cooling - Once<br />
Through<br />
223 Steam Power Cooling - Wet Tower<br />
Figure 3.17b. Power Generation <strong>Water</strong> <strong>Use</strong> in the Western Lake Superior <strong>Water</strong>shed, 2004
MN Permit No Facility<br />
Minnesota <strong>Municipal</strong> WWTP Capacity and 2003-2005 Flow<br />
(Facilities with Permitted Capacity Greater Than 1 mgd)<br />
Source: MPCA Discharge Monitoring Report Database Summary<br />
Permitted<br />
Capacity 1<br />
mgd<br />
2003<br />
Average<br />
Flow<br />
mgd<br />
2004<br />
Average<br />
Flow<br />
mgd<br />
2005<br />
Average<br />
Flow<br />
mgd<br />
MN0030627 Hibbing WWTP North Plant 3.20 0.60 0.50 0.00<br />
MN0025721 Camp Ripley WWTP 1.44 0.16 0.11 0.12<br />
MN0064190 Otsego WWTP East 1.65 0.14 0.19 0.21<br />
MN0021211 Granite Falls WWTP 1.111 0.37 0.41 0.48<br />
MN0024473 Perham WWTP 1.172 0.47 0.49 0.51<br />
MNG580117 Wells Easton Minnesota Lake WWTP 1.088 0.49 0.52 0.52<br />
MN0020681 Stewartville WWTP 1.11 0.62 0.75 0.53<br />
MN0020664 Lake City WWTP 1.52 0.65 0.56 0.56<br />
MN0025267 Winnebago WWTP 1.7 0.32 0.43 0.59<br />
MN0023337 Eveleth WWTP 1 0.65 0.70 0.65<br />
MN0020150 New Prague WWTP 1.378 0.57 0.59 0.66<br />
MN0020508 Ely WWTP 1.5 0.57 0.73 0.69<br />
MN0022233 Glencoe WWTP 2.6 0.69 0.69 0.69<br />
MN0046868 Whitewater River Regional WWTP 1.12 0.70 0.89 0.70<br />
MN0022250 Two Harbors WWTP 1.6 0.61 0.66 0.70<br />
MN0055808 Chisago Lakes Joint STC 1.26 0.82 0.79 0.76<br />
MN0029629 Rogers WWTP 1.602 0.69 0.74 0.77<br />
MN0020222 St Michael WWTP 2.45 0.66 0.62 0.83<br />
MN0020362 Cambridge WWTP 1.92 0.73 0.85 0.85<br />
MN0020141 Luverne WWTP 1.5 0.76 0.83 0.86<br />
MN0025488 Met Council - Rosemount WWTP 7<br />
1.40 0.76 0.82 0.90<br />
MN0024040 Madelia WWTP 1.31 0.67 0.74 0.91<br />
MN0024759 St James WWTP 2.96 0.94 0.85 1.03<br />
App C_MN WWTPs_1+mgd_2005 Flow Summary_060707.xls Page 1 of 4
MN Permit No Facility<br />
Minnesota <strong>Municipal</strong> WWTP Capacity and 2003-2005 Flow<br />
(Facilities with Permitted Capacity Greater Than 1 mgd)<br />
Source: MPCA Discharge Monitoring Report Database Summary<br />
Permitted<br />
Capacity 1<br />
mgd<br />
2003<br />
Average<br />
Flow<br />
mgd<br />
2004<br />
Average<br />
Flow<br />
mgd<br />
2005<br />
Average<br />
Flow<br />
mgd<br />
MN0055361 Plainview-Elgin Sanitary District WWTP 1.421 0.73 0.92 1.05<br />
MN0022462 Bemidji WWTP 2.5 1.09 1.05 1.06<br />
MN0022217 Windom WWTP 1.83 0.98 0.98 1.07<br />
MN0020133 Montevideo WWTP 3 0.88 0.96 1.08<br />
MN0021423 Crookston WWTP 1.4 0.94 1.23 1.12<br />
MN0022535 St Peter WWTP 4.00 0.93 1.40 1.17<br />
MN0020761 Little Falls WWTP 2.4 1.33 1.05 1.18<br />
MN0020788 Elk River WWTP 2.2 1.08 1.14 1.19<br />
MN0020567 Monticello WWTP 2.36 1.08 1.11 1.19<br />
MN0021814 East Grand Forks WWTP 1.4 1.12 1.19 1.19<br />
MN0020192 Detroit Lakes WWTP<br />
North Koochiching Area Sanitary District<br />
3 1.07 1.21 1.26<br />
MN0020257 (NKASD) WWTP 2.3 0.84 1.16 1.26<br />
MN0021431 Thief River Falls WWTP 2.14 1.24 1.40 1.45<br />
MN0023973 Litchfield WWTP 1.9 1.40 1.47 1.51<br />
MN0020796 Waseca WWTP 3.5 1.16 1.56 1.58<br />
MN0029955 Met Council - Hastings WWTP 5<br />
2.69 1.62 1.61 1.59<br />
MN0030112 Fairmont WWTP 3.9 1.10 1.36 1.60<br />
MN0040649 Buffalo WWTP 3.6 1.39 1.40 1.63<br />
MN0050628 Fergus Falls WWTP 2.81 1.73 1.82 1.91<br />
MN0031186 Worthington WWTP 4 1.74 1.83 1.99<br />
MN0020290 Melrose WWTP 2.5 2.10 2.01 2.00<br />
MN0024571 Red Wing WWTP 4 2.51 2.49 2.06<br />
MN0024368 Northfield WWTP 5.2 2.12 2.14 2.07<br />
App C_MN WWTPs_1+mgd_2005 Flow Summary_060707.xls Page 2 of 4
MN Permit No Facility<br />
Minnesota <strong>Municipal</strong> WWTP Capacity and 2003-2005 Flow<br />
(Facilities with Permitted Capacity Greater Than 1 mgd)<br />
Source: MPCA Discharge Monitoring Report Database Summary<br />
Permitted<br />
Capacity 1<br />
mgd<br />
2003<br />
Average<br />
Flow<br />
mgd<br />
2004<br />
Average<br />
Flow<br />
mgd<br />
2005<br />
Average<br />
Flow<br />
mgd<br />
MN0030163 Virginia WWTP 4.3 1.90 2.14 2.18<br />
MN0029904 Met Council - Eagles Point WWTP 3<br />
11.90 1.96 1.98 2.34<br />
MN0049328 Brainerd WWTP 3.13 2.61 2.27 2.44<br />
MN0022179 Marshall WWTP 4.5 2.12 2.29 2.52<br />
MN0030643 Hibbing WWTP South Plant 2 1.41 2.05 2.57<br />
MN0055832 Hutchinson WWTP 4.27 2.18 2.18 2.57<br />
MN0030066 New Ulm WWTP 6.77 2.50 2.57 2.58<br />
MN0040738 Alexandria Lake Area Sanitary District 3.75 2.69 2.72 2.91<br />
MN0029998 Met Council - St Croix Valley WWTP 9<br />
5.80 3.27 3.13 3.13<br />
MN0051284 Owatonna WWTP 5 3.19 3.54 3.53<br />
MN0030121 Faribault WWTP 7 3.84 4.23 3.70<br />
MN0025259 Willmar WWTP 5.04 3.69 3.63 3.81<br />
MN0030147 Winona WWTP 6.5 3.44 3.79 3.95<br />
MN0041092 Albert Lea WWTP 18.38 4.38 4.44 4.23<br />
MN0049069 Moorhead WWTP 9 3.90 4.36 4.75<br />
MN0022683 Austin WWTP 8.475 4.88 5.43 5.42<br />
MN0030171 Mankato WWTP 11.25 5.42 6.64 6.86<br />
MN0022080 Grand Rapids WWTP 15.2 7.61 6.71 7.33<br />
MN0045845 Met Council - Empire WWTP 4<br />
28.61 8.57 8.39 8.46<br />
MN0040878 St Cloud WWTP 13 9.59 9.62 10.36<br />
MN0024619 Rochester <strong>Water</strong> Reclamation Plant 19.1 13.16 15.46 13.46<br />
MN0030007 Met Council - Seneca WWTP 8<br />
MN0029882 Met Council - Blue Lake WWTP 2<br />
38.00 23.67 23.46 23.35<br />
42.00 26.85 27.67 28.42<br />
App C_MN WWTPs_1+mgd_2005 Flow Summary_060707.xls Page 3 of 4
MN Permit No Facility<br />
MN0049786<br />
Minnesota <strong>Municipal</strong> WWTP Capacity and 2003-2005 Flow<br />
(Facilities with Permitted Capacity Greater Than 1 mgd)<br />
Source: MPCA Discharge Monitoring Report Database Summary<br />
Permitted<br />
Capacity 1<br />
mgd<br />
2003<br />
Average<br />
Flow<br />
mgd<br />
2004<br />
Average<br />
Flow<br />
mgd<br />
2005<br />
Average<br />
Flow<br />
mgd<br />
Western Lake Superior Sanitary District<br />
(WLSSD) WWTP 48.8 36.09 38.13 38.80<br />
MN0029815 Met Council - Metropolitan WWTP 6<br />
251 195.09 188.16 187.02<br />
1<br />
The plant capacity as reported in the MPCA database. The permitted capacity listed is typically the average wet<br />
weather flow identified in the National Pollutant Discharge Elimination System (NPDES) Permit. The basis of the<br />
capacity can be verified by review of individual NPDES Permits.<br />
2<br />
The Metropolitan Council's established design capacity <strong>for</strong> this facility is 37 mgd.<br />
3<br />
The Metropolitan Council's established design capacity <strong>for</strong> this facility is 10 mgd.<br />
4<br />
The Metropolitan Council's established design capacity <strong>for</strong> this facility is 24 mgd.<br />
5<br />
The Metropolitan Council's established design capacity <strong>for</strong> this facility is 2.9 mgd.<br />
6<br />
The Metropolitan Council's established design capacity <strong>for</strong> this facility is 251 mgd.<br />
7<br />
The Metropolitan Council's established design capacity <strong>for</strong> this facility is 1.3 mgd.<br />
8<br />
The Metropolitan Council's established design capacity <strong>for</strong> this facility is 39 mgd.<br />
9<br />
The Metropolitan Council's established design capacity <strong>for</strong> this facility is 4.5 mgd.<br />
Source: Minnesota Pollution Control Agency (MPCA), 2005. Minnesota Discharge Monitoring Report Data Summary.<br />
Data summarized <strong>for</strong> dischargers in 2003-2005 were obtained from the MPCA in April 2006. This Technical<br />
Memorandum uses the annual discharge volume reported to MPCA, presented as the average annual water discharged<br />
in million gallons per day (mgd). The annual average flows listed are as reported in the MPCA database and have not<br />
been verified with individual facility records.<br />
App C_MN WWTPs_1+mgd_2005 Flow Summary_060707.xls Page 4 of 4
Craddock Consulting Engineers<br />
In Association with CDM & James Crook<br />
Appendix D<br />
Reference Documents
Craddock Consulting Engineers<br />
In Association with CDM & James Crook
Minnesota<br />
DNR <strong>Water</strong>s<br />
2005<br />
Ground-water resources<br />
vary across the state.<br />
Ground-<strong>Water</strong> Sustainablity<br />
Where Is Ground <strong>Water</strong> and<br />
Is It Available <strong>for</strong> <strong>Use</strong>?<br />
Ground water is everywhere beneath Minnesota’s land surface, but<br />
it is not necessarily available <strong>for</strong> use everywhere. The distribution<br />
of aquifers in the state is uneven. The varying types and layers of<br />
sediment and rock under the land surface in an area determine<br />
whether any aquifers are present from which to pump ground water.<br />
The types of sediment and rock also determine whether an aquifer is capable of supporting large withdrawals<br />
or only able to support limited use.<br />
Minnesota has six ground-water areas that combine<br />
the two general types of bedrock, sedimentary and<br />
fractured igneous and metamorphic, with two<br />
general types of overlying sediments, sandy and<br />
clayey. In the northeast and southeast, overlying<br />
sediment is thin or absent. The layers of sedimentary<br />
limestone and sandstone bedrock that <strong>for</strong>m the<br />
bedrock aquifers in southeastern Minnesota are well<br />
known <strong>for</strong> their good aquifer qualities and are<br />
commonly used. Elsewhere in Minnesota, the<br />
fractured igneous and metamorphic bedrock has<br />
relatively poor aquifer qualities, generally supporting<br />
only limited use.<br />
Much of Minnesota is covered by sediments deposited<br />
by glaciers or streams. Some of those sediments<br />
are sands and gravels that occur as surficial deposits<br />
or they may be buried within clayey glacial deposits.<br />
The sandy glacial deposits that cover much of central<br />
Minnesota include extensive sand and gravel aquifers<br />
at or near the land surface that have good aquifer<br />
qualities. South and west, the glacial sediments are<br />
more clayey, and aquifers within the sediments are<br />
less common and generally more limited in extent.<br />
Many parts of Minnesota are underlain by sediment<br />
and rock that do not make good aquifers. Nonetheless,<br />
that sediment and rock is still important <strong>for</strong><br />
limited ground-water storage. The water stored in<br />
those sediments and rocks is the source of slow<br />
replenishment <strong>for</strong> aquifers and surface waters.<br />
The Resource<br />
Glacial sediment types<br />
Bedrock types<br />
Ground water areas<br />
The Resource<br />
:"-<br />
I<br />
Thin or<br />
Absent<br />
\<br />
FIGURE 1. General availability of ground-water<br />
resources depends on the type of sediment and<br />
rock beneath the land surface.<br />
Page 1
Ground <strong>Water</strong> Contamination Susceptibility: Minnesota DNR<br />
The contamination susceptiblity map was made from digital files available at the<br />
time or were digitized from existing published maps. <strong>Use</strong>able map scale is<br />
approximately 1:500,000 or 1 inch = 8 miles. This map is best used as a regionalscale<br />
screening aid.<br />
Digital data<br />
The digital file of the map is included on the EPIC 2001 CD-ROM from the Land<br />
Management In<strong>for</strong>mation Center, which did the original GIS analysis <strong>for</strong> the<br />
project.<br />
References<br />
Minnesota Pollution Control Agency, 1989, Ground <strong>Water</strong> Contamination<br />
Susceptibility in Minnesota, St. Paul, MN, (poster). Out of print.<br />
Porcher, Eric, 1989, Ground <strong>Water</strong> Contamination Susceptibility in Minnesota<br />
(revised edition), Minnesota Pollution Control Agency, St. Paul, MN, 29 p. Out of<br />
print.<br />
EPPL7/ EPIC 2000 dataset CD-ROM available from the Land Management<br />
In<strong>for</strong>mation Center.<br />
Back to top<br />
© 2006 Minnesota Department of Natural Resources. Copyright Notice.<br />
Web site policies: Accessibility, Linking, Privacy<br />
http://www.dnr.state.mn.us/waters/groundwater_section/mapping/gwcontam_susceptibility....<br />
Page 2 of 2<br />
6/7/2006
Craddock Consulting Engineers<br />
In Association with CDM & James Crook<br />
Appendix E<br />
Metropolitan Council <strong>Industrial</strong><br />
Dischargers – <strong>Water</strong> Demand
Craddock Consulting Engineers<br />
In Association with CDM & James Crook
Permit<br />
No.<br />
Organization<br />
NAICS<br />
Code 1<br />
Metropolitan Council <strong>Industrial</strong> Dischargers <strong>Water</strong> Demand, 2005<br />
Sorted by Business Category and Organization Name<br />
NAICS Description<br />
MCES Business<br />
Category 2<br />
DNR <strong>Use</strong><br />
Code 3<br />
Incoming <strong>Water</strong><br />
Type<br />
Incoming (Gal) Sewered (Gal)<br />
0333 Anchor Block Co 327331 Concrete Block and Brick Manufacturing Building Materials 249 CITY 16,995,000 12,253,002 0.0466<br />
0401 Andersen Corp 321911 Wood Window and Door Manufacturing Building Materials 249 CITY,WELL 377,765,800 61,354,422 1.0350<br />
0957 Bell Lumber & Pole Co (0957) 321114 Wood Preservation Building Materials 249 OTHER 209,880 209,880 0.0006<br />
0287 Certainteed Corp 324122 Asphalt Shingle and Coating Materials Manufacturing Building Materials 249 CITY 320,600,000 271,630,000 0.8784<br />
0415 GAF Materials Corp 324122 Asphalt Shingle and Coating Materials Manufacturing Building Materials 249 CITY,WELL 230,267,232 18,882,273 0.6309<br />
1238 Zenith Products 327331 Concrete Block and Brick Manufacturing Building Materials 249 CITY,WELL 82,000 82,000 0.0002<br />
0809 Determan Brownie Inc 23594 Wrecking and Demolition Contractors Central Treatment 249 CITY,WELL,OTHER 7,314,452 7,119,168 0.0200<br />
1302 Healthcare Waste Solutions 562211 Hazardous Waste Treatment and Disposal Central Treatment 249 CITY 2,014,000 2,001,200 0.0055<br />
0916 Stericycle Inc 562211 Hazardous Waste Treatment and Disposal Central Treatment 249 CITY,OTHER 4,830,746 4,454,836 0.0132<br />
1346 U of M - Animal Digester Central Treatment 249 CITY 1,160,720 1,160,720 0.0032<br />
1017 U of M - Animal Waste Central Treatment 249 CITY 1,898,692 1,303,438 0.0052<br />
1042 U of M - TCEM 562219 Other Nonhazardous Waste Treatment and Disposal Central Treatment 249 CITY 1,116,927 1,086,927 0.0031<br />
0719 U S Filter Recovery Services Inc 22132 Sewage Treatment Facilities Central Treatment 249 CITY,OTHER 32,810,914 31,298,658 0.0899<br />
0995 Alpha Ceramics Inc 327113 Porcelain Electrical Supply Manufacturing Chemical Products 248 CITY 3,986,405 3,985,823 0.0109<br />
1311 Apex International Mfg (1311) 32562 Toilet Preparation Manufacturing Chemical Products 248 CITY 56,180,000 20,342,435 0.1539<br />
0926 Aveda Corp 32562 Toilet Preparation Manufacturing Chemical Products 248 CITY 30,534,780 24,608,676 0.0837<br />
1175 Boomerang Laboratories Inc 32562 Toilet Preparation Manufacturing Chemical Products 248 CITY,OTHER 14,452,400 6,512,042 0.0396<br />
0801 Brenntag Great Lakes LLC 42269 Other Chemical and Allied Products Wholesalers Chemical Products 248 CITY 334,678 160,588 0.0009<br />
1066 C & H Chemical Inc 325612 Polish and Other Sanitation Good Manufacturing Chemical Products 248 CITY 332,000 531,998 0.0009<br />
0575 Chaska Chemical Co Inc 325612 Polish and Other Sanitation Good Manufacturing Chemical Products 248 CITY 750,863 252,002 0.0021<br />
0570 Conklin Co 325612 Polish and Other Sanitation Good Manufacturing Chemical Products 248 CITY 57,427,080 6,297,000 0.1573<br />
1294 Conwed Plastics 326199 All Other Plastics Product Manufacturing Chemical Products 248 CITY 8,574,324 6,799,140 0.0235<br />
0928 Cortec Corp 325998 All Other Miscellaneous Chemical Product and Preparation Manufacturing Chemical Products 248 CITY 1,246,338 476,538 0.0034<br />
0239 Davis-Frost Inc 311223 Other Oilseed Processing Chemical Products 248 CITY 4,986,660 3,490,664 0.0137<br />
0964 Degussa Building Systems (0964) 32552 Adhesive Manufacturing Chemical Products 248 CITY 6,176,698 1,512,186 0.0169<br />
0088 Diamond Products Co 32562 Toilet Preparation Manufacturing Chemical Products 248 CITY,OTHER 156,428,996 54,188,072 0.4286<br />
1055 Diversified Mfg Corp 325611 Soap and Other Detergent Manufacturing Chemical Products 248 CITY 4,949,700 1,671,207 0.0136<br />
0006 Ecolab Inc 325613 Surface Active Agent Manufacturing Chemical Products 248 CITY 12,775,000 60,531,054 0.0350 *<br />
1044 Electrochemicals Inc 325998 All Other Miscellaneous Chemical Product and Preparation Manufacturing Chemical Products 248 CITY 6,100,890 3,996,300 0.0167<br />
0429 FilmTec Corp (0429) 32613 Laminated Plastics Plate, Sheet, and Shape Manufacturing Chemical Products 248 CITY,WELL 262,314,624 262,314,768 0.7187<br />
1085 Fox Packaging Inc 325612 Polish and Other Sanitation Good Manufacturing Chemical Products 248 CITY 40,351,608 679,728 0.1106<br />
0268 Fremont Industries Inc 325612 Polish and Other Sanitation Good Manufacturing Chemical Products 248 WELL 11,628,000 4,851,468 0.0319<br />
0949 GreenMan Technologies of MN Inc 56292 Materials Recovery Facilities Chemical Products 248 CITY,WELL 1,301,980 1,301,980 0.0036<br />
1097 Greenway Research Lab 32562 Toilet Preparation Manufacturing Chemical Products 248 CITY 5,040,000 2,804,979 0.0138<br />
0937 H B Fuller Co #0937 32552 Adhesive Manufacturing Chemical Products 248 CITY 6,401,700 4,779,302 0.0175<br />
1021 H B Fuller Co #1021 32552 Adhesive Manufacturing Chemical Products 248 CITY,WELL 73,776,000 3,920,076 0.2021<br />
1049 H B Fuller Co #1049 32551 Paint and Coating Manufacturing Chemical Products 248 CITY 1,137,330 1,039,140 0.0031<br />
0450 Hawkins Chemical Inc 325998 All Other Miscellaneous Chemical Product and Preparation Manufacturing Chemical Products 248 CITY 26,171,376 22,168,080 0.0717<br />
1250 Hawkins Chemical Inc 325181 Alkalies and Chlorine Manufacturing Chemical Products 248 CITY 44,480,568 4,753,782 0.1219<br />
1002 Hawkins Chemical Inc-Terminal I 325181 Alkalies and Chlorine Manufacturing Chemical Products 248 CITY 36,940,728 12,064,020 0.1012<br />
1171 Hoffman Enclosure (SCO) 326199 All Other Plastics Product Manufacturing Chemical Products 248 CITY 6,248,096 5,516,226 0.0171<br />
II-1_App E_MCES IU Data-2005 <strong>Water</strong> Demand.xls Page 1 of 14 7/6/2007<br />
Incoming<br />
(mgd)
Permit<br />
No.<br />
Organization<br />
NAICS<br />
Code 1<br />
Metropolitan Council <strong>Industrial</strong> Dischargers <strong>Water</strong> Demand, 2005<br />
Sorted by Business Category and Organization Name<br />
NAICS Description<br />
MCES Business<br />
Category 2<br />
DNR <strong>Use</strong><br />
Code 3<br />
Incoming <strong>Water</strong><br />
Type<br />
Incoming (Gal) Sewered (Gal)<br />
1228 Illbruck Foamtec Inc 32615 Urethane and Other Foam Product (except Polystyrene) Manufacturing Chemical Products 248 CITY 954,448 890,448 0.0026<br />
1192 Intek Plastics Inc Chemical Products 248 CITY 1,724,400 858,716 0.0047<br />
1125 Intek Plastics Inc 326199 All Other Plastics Product Manufacturing Chemical Products 248 CITY 7,120,800 4,870,446 0.0195<br />
0244 Interplastic Corp 325211 Plastics Material and Resin Manufacturing Chemical Products 248 CITY,OTHER 33,551,088 25,832,283 0.0919<br />
1328 IonBond Inc Chemical Products 248 CITY 12,297,120 12,174,148 0.0337<br />
0816 KIK Minnesota 325612 Polish and Other Sanitation Good Manufacturing Chemical Products 248 CITY 31,038,000 1,257,040 0.0850<br />
0969 Kohl & Madden Printing Ink Corp 32591 Printing Ink Manufacturing Chemical Products 248 CITY 13,119,266 13,119,266 0.0359<br />
1331 LSI Corp of America Chemical Products 248 CITY 5,330,000 4,784,000 0.0146<br />
0792 McLaughlin Gormley King Co 32532 Pesticide and Other Agricultural Chemical Manufacturing Chemical Products 248 CITY 4,300,140 540,160 0.0118<br />
1353 Minnesota Petroleum Service Chemical Products 248 CITY,OTHER 149,684 149,684 0.0004<br />
0354 Minntech Corp 325412 Pharmaceutical Preparation Manufacturing Chemical Products 248 CITY 102,546,840 26,791,324 0.2810<br />
0906 Multi-Clean Inc 325612 Polish and Other Sanitation Good Manufacturing Chemical Products 248 CITY 2,852,000 857,224 0.0078<br />
1026 NatureWorks LLC 325211 Plastics Material and Resin Manufacturing Chemical Products 248 CITY 25,400 25,400 0.0001<br />
1288 Norwesco Inc 326199 All Other Plastics Product Manufacturing Chemical Products 248 CITY 3,313,206 2,302,743 0.0091<br />
1344 Novus Inc Chemical Products 248 CITY 1,064,820 1,013,979 0.0029<br />
1282 Nu Coat Inc 32551 Paint and Coating Manufacturing Chemical Products 248 CITY 1,675,200 878,642 0.0046<br />
1227 Par Aide Products Co (1227) 33992 Sporting and Athletic Goods Manufacturing Chemical Products 248 CITY 167,000 166,600 0.0005<br />
1314 Porous Media 339999 All Other Miscellaneous Manufacturing Chemical Products 248 CITY 23,109,000 19,191,000 0.0633<br />
1322 Powder Coating Technologies Inc Chemical Products 248 CITY 487,632 487,632 0.0013<br />
0953 Pump & Meter Services Inc 562211 Hazardous Waste Treatment and Disposal Chemical Products 248 CITY,OTHER 227,934 225,434 0.0006<br />
1124 Quality Mfg Inc Chemical Products 248 WELL 204,550 204,232 0.0006<br />
0371 Release Coatings of Minneapolis Inc 81131 Commercial and <strong>Industrial</strong> Machinery and Equipment (except Automotive and Electronic) RepaChemical Products 248 CITY 1,607,000 1,607,000 0.0044<br />
1292 Ritrama Inc 322222 Coated and Laminated Paper Manufacturing Chemical Products 248 CITY 6,217,791 6,188,226 0.0170<br />
0198 Rubber Industries Inc 326291 Rubber Product Manufacturing <strong>for</strong> Mechanical <strong>Use</strong> Chemical Products 248 CITY 550,000 466,230 0.0015<br />
0558 Sierra Corp 32551 Paint and Coating Manufacturing Chemical Products 248 CITY 2,871,570 1,990,158 0.0079<br />
0992 Silver Pockets Inc 42193 Recyclable Material Wholesalers Chemical Products 248 CITY,OTHER 2,212 2,212 0.0000<br />
1325 Sunburst Chemicals Inc Chemical Products 248 CITY 6,855,000 5,065,926 0.0188<br />
0110 Univar USA Inc 42269 Other Chemical and Allied Products Wholesalers Chemical Products 248 CITY 1,313,200 521,400 0.0036<br />
1183 Uponor Wirsbo 325211 Plastics Material and Resin Manufacturing Chemical Products 248 CITY 13,682,760 13,202,760 0.0375<br />
1122 Vision-Ease Lens 339115 Ophthalmic Goods Manufacturing Chemical Products 248 CITY 74,440,134 45,598,569 0.2039<br />
1146 XSYS Print Solutions Inks, LLC Chemical Products 248 CITY 712,000 712,000 0.0020<br />
0830 XSYS Print Solutions Inks, LLC 32591 Printing Ink Manufacturing Chemical Products 248 CITY 1,540,000 1,510,557 0.0042<br />
1129 Zomax Optical Media Chemical Products 248 CITY 7,007,960 3,199,760 0.0192<br />
1218 Owens Corning (1218) 324122 Asphalt Shingle and Coating Materials Manufacturing Contaminated Groundwater 249 CITY 78,946,992 69,511,806 0.2163<br />
0056 AaCron Inc 332813 Electroplating, Plating, Polishing, Anodizing, and Coloring Electronic Products 247 CITY,WELL,OTHER 107,231,242 61,461,344 0.2938<br />
0024 AbelConn LLC 335931 Current-Carrying Wiring Device Manufacturing Electronic Products 247 CITY 9,786,120 9,778,780 0.0268<br />
1102 ABW Plating Service Inc 332813 Electroplating, Plating, Polishing, Anodizing, and Coloring Electronic Products 247 CITY,OTHER 1,285,510 1,231,510 0.0035<br />
0806 Added Value Technology 334412 Bare Printed Circuit Board Manufacturing Electronic Products 247 CITY 1,669,500 1,669,500 0.0046<br />
1299 APA Enterprises Inc 333314 Optical Instrument and Lens Manufacturing Electronic Products 247 CITY 1,285,126 891,816 0.0035<br />
0748 Arrow Cryogenics Inc #748 332813 Electroplating, Plating, Polishing, Anodizing, and Coloring Electronic Products 247 CITY 10,672,254 10,672,254 0.0292<br />
0583 Aztec Electronics Inc 334418 Printed Circuit Assembly (Electronic Assembly) Manufacturing Electronic Products 247 CITY 1,514,081 1,514,081 0.0041<br />
II-1_App E_MCES IU Data-2005 <strong>Water</strong> Demand.xls Page 2 of 14 7/6/2007<br />
Incoming<br />
(mgd)
Permit<br />
No.<br />
Organization<br />
NAICS<br />
Code 1<br />
Metropolitan Council <strong>Industrial</strong> Dischargers <strong>Water</strong> Demand, 2005<br />
Sorted by Business Category and Organization Name<br />
NAICS Description<br />
MCES Business<br />
Category 2<br />
DNR <strong>Use</strong><br />
Code 3<br />
Incoming <strong>Water</strong><br />
Type<br />
Incoming (Gal) Sewered (Gal)<br />
1306 BOC Edwards Inc 333295 Semiconductor Machinery Manufacturing Electronic Products 247 CITY 2,721,680 2,721,680 0.0075<br />
0134 Co-Operative Plating 332813 Electroplating, Plating, Polishing, Anodizing, and Coloring Electronic Products 247 CITY,WELL 40,107,760 36,068,414 0.1099<br />
0814 Cypress Semi-Conductor (MN) Inc 334413 Semiconductor and Related Device Manufacturing Electronic Products 247 CITY,WELL 729,422,000 68,120,000 1.9984<br />
0139 Douglas Corp, Plating Div 332813 Electroplating, Plating, Polishing, Anodizing, and Coloring Electronic Products 247 CITY 72,130,440 71,137,380 0.1976<br />
1242 Eaglemaster Inc 332813 Electroplating, Plating, Polishing, Anodizing, and Coloring Electronic Products 247 CITY 1,066,573 1,030,141 0.0029<br />
0007 Electronic Industries Inc 334418 Printed Circuit Assembly (Electronic Assembly) Manufacturing Electronic Products 247 CITY 2,684,686 2,619,536 0.0074<br />
1107 FSI International Inc (1107) 333295 Semiconductor Machinery Manufacturing Electronic Products 247 CITY 75,887,460 66,769,614 0.2079<br />
0221 General Dynamics Advanced In<strong>for</strong>mation Systems 334511 Search, Detection, Navigation, Guidance, Aeronautical, and Nautical System and Instrument MElectronic Products 247 CITY 13,679,400 6,644,000 0.0375<br />
1206 Gustafson Finishing Corp 332813 Electroplating, Plating, Polishing, Anodizing, and Coloring Electronic Products 247 CITY 172,400 172,400 0.0005<br />
0089 Hard Chrome Inc 332813 Electroplating, Plating, Polishing, Anodizing, and Coloring Electronic Products 247 CITY,WELL,OTHER 22,625,473 22,194,241 0.0620<br />
0248 Hiawatha Metalcraft Inc (Plant #1) 332813 Electroplating, Plating, Polishing, Anodizing, and Coloring Electronic Products 247 CITY,WELL 44,630,086 25,988,452 0.1223<br />
0210 Holaday Circuits Inc 334412 Bare Printed Circuit Board Manufacturing Electronic Products 247 CITY,OTHER 37,134,797 28,484,336 0.1017<br />
0066 Honeywell Inc (0066) 334413 Semiconductor and Related Device Manufacturing Electronic Products 247 CITY,WELL 77,875,193 48,084,000 0.2134<br />
1202 Innovex Inc 334413 Semiconductor and Related Device Manufacturing Electronic Products 247 CITY 17,150,322 15,799,060 0.0470<br />
1169 IntraSpec Solutions 332813 Electroplating, Plating, Polishing, Anodizing, and Coloring Electronic Products 247 CITY,OTHER 9,590,500 9,524,095 0.0263<br />
0663 Kangas Enameling Inc 332813 Electroplating, Plating, Polishing, Anodizing, and Coloring Electronic Products 247 CITY 154,180 154,180 0.0004<br />
0320 Ken's Metal Finishing Inc 332813 Electroplating, Plating, Polishing, Anodizing, and Coloring Electronic Products 247 CITY,OTHER 478,328 454,788 0.0013<br />
0176 Leaf Industries Inc 332813 Electroplating, Plating, Polishing, Anodizing, and Coloring Electronic Products 247 CITY 2,667,000 1,834,000 0.0073<br />
0787 Lin<strong>for</strong> Inc 332813 Electroplating, Plating, Polishing, Anodizing, and Coloring Electronic Products 247 CITY 5,448,000 5,448,000 0.0149<br />
1180 M & D Metal Finishing Inc (1180) 332813 Electroplating, Plating, Polishing, Anodizing, and Coloring Electronic Products 247 CITY 1,639,196 1,472,596 0.0045<br />
0129 Micom Corp 334418 Printed Circuit Assembly (Electronic Assembly) Manufacturing Electronic Products 247 CITY 68,202,270 50,090,340 0.1869<br />
1194 Micro Control Co 334418 Printed Circuit Assembly (Electronic Assembly) Manufacturing Electronic Products 247 CITY 207,317 207,317 0.0006<br />
0736 Micro Finish Co 332813 Electroplating, Plating, Polishing, Anodizing, and Coloring Electronic Products 247 CITY 63,378 63,378 0.0002<br />
1196 Midwest Finishing Inc 332813 Electroplating, Plating, Polishing, Anodizing, and Coloring Electronic Products 247 CITY 11,818,800 11,316,760 0.0324<br />
1111 Minco Products Inc 334412 Bare Printed Circuit Board Manufacturing Electronic Products 247 CITY 19,194,200 19,194,200 0.0526<br />
0163 Minco Products Inc 334412 Bare Printed Circuit Board Manufacturing Electronic Products 247 CITY 35,662,000 35,662,000 0.0977<br />
1347 Minnesota Metal Finishing Inc 332813 Electroplating, Plating, Polishing, Anodizing, and Coloring Electronic Products 247 CITY 8,310,216 8,151,456 0.0228<br />
0206 Nor-Ell Inc 332813 Electroplating, Plating, Polishing, Anodizing, and Coloring Electronic Products 247 CITY,WELL 11,600,736 11,136,706 0.0318<br />
1093 NVE Corp 334413 Semiconductor and Related Device Manufacturing Electronic Products 247 CITY 319,812 319,812 0.0009<br />
0112 Pioneer Metal Finishing 332813 Electroplating, Plating, Polishing, Anodizing, and Coloring Electronic Products 247 CITY,WELL,OTHER 164,627,572 121,380,400 0.4510<br />
0229 Polar Semiconductor Inc 335931 Current-Carrying Wiring Device Manufacturing Electronic Products 247 CITY,WELL 98,550,000 404,042,460 0.2700 *<br />
0253 Printed Circuits Inc 334419 Other Electronic Component Manufacturing Electronic Products 247 CITY 17,401,410 17,364,330 0.0477<br />
1295 Production Technologies Inc Electronic Products 247 CITY 370,000 369,600 0.0010<br />
1221 Pro-Tech Interconnect Solutions, LLC 334412 Bare Printed Circuit Board Manufacturing Electronic Products 247 CITY 13,237,000 13,237,000 0.0363<br />
0962 RMS Co 334417 Electronic Connector Manufacturing Electronic Products 247 CITY 18,815,600 16,738,108 0.0515<br />
1257 Ron-Vik Inc 332618 Other Fabricated Wire Product Manufacturing Electronic Products 247 CITY 2,012,000 1,988,000 0.0055<br />
0108 Rosemount Aerospace Inc 332813 Electroplating, Plating, Polishing, Anodizing, and Coloring Electronic Products 247 CITY 4,701,800 2,887,916 0.0129<br />
0109 Rosemount Aerospace Inc 332813 Electroplating, Plating, Polishing, Anodizing, and Coloring Electronic Products 247 CITY,WELL 98,041,800 41,704,464 0.2686<br />
0107 Rosemount Inc #0107 334513 Instruments and Related Products Manufacturing <strong>for</strong> Measuring, Displaying, and Controlling IndElectronic Products 247 CITY,WELL 221,213,640 154,606,044 0.6061<br />
0878 Rosemount Inc #0878 334513 Instruments and Related Products Manufacturing <strong>for</strong> Measuring, Displaying, and Controlling IndElectronic Products 247 CITY 45,078,000 30,068,040 0.1235<br />
1204 Seagate Technology LLC 334112 Computer Storage Device Manufacturing Electronic Products 247 CITY,OTHER 58,838,028 14,665,797 0.1612<br />
II-1_App E_MCES IU Data-2005 <strong>Water</strong> Demand.xls Page 3 of 14 7/6/2007<br />
Incoming<br />
(mgd)
Permit<br />
No.<br />
Organization<br />
NAICS<br />
Code 1<br />
Metropolitan Council <strong>Industrial</strong> Dischargers <strong>Water</strong> Demand, 2005<br />
Sorted by Business Category and Organization Name<br />
NAICS Description<br />
MCES Business<br />
Category 2<br />
DNR <strong>Use</strong><br />
Code 3<br />
Incoming <strong>Water</strong><br />
Type<br />
Incoming (Gal) Sewered (Gal)<br />
0205 Seagate Technology LLC 334112 Computer Storage Device Manufacturing Electronic Products 247 CITY 123,483,720 244,058,696 0.3383 *<br />
0702 TRC Circuits Inc 334418 Printed Circuit Assembly (Electronic Assembly) Manufacturing Electronic Products 247 CITY 3,118,268 2,970,030 0.0085<br />
1095 Twin Star Electronics Inc 334412 Bare Printed Circuit Board Manufacturing Electronic Products 247 CITY 455,860 455,860 0.0012<br />
0714 Universal Circuits Inc 334418 Printed Circuit Assembly (Electronic Assembly) Manufacturing Electronic Products 247 CITY 49,392,000 47,758,228 0.1353<br />
0138 Wolkerstorfer Co Inc 332813 Electroplating, Plating, Polishing, Anodizing, and Coloring Electronic Products 247 CITY 17,353,460 16,977,540 0.0475<br />
1003 ADM Milling 311211 Flour Milling Food Products 241 CITY 7,977,645 2,804,238 0.0219<br />
1224 American Fish & Seafood 42242 Packaged Frozen Food Wholesalers Food Products 241 CITY 868,344 631,000 0.0024<br />
0273 Anamax Corp (0273) 311613 Rendering and Meat Byproduct Processing Food Products 241 CITY,OTHER 192,136,941 189,253,431 0.5264<br />
0637 Arden International Kitchens LLC 311412 Frozen Specialty Food Manufacturing Food Products 241 CITY 26,429,640 21,873,108 0.0724<br />
0590 Best Brands Inc 311211 Flour Milling Food Products 241 CITY 30,932,400 24,186,920 0.0847<br />
1297 Bix Produce Co 44523 Fruit and Vegetable Markets Food Products 241 CITY 40,398,144 36,846,144 0.1107<br />
1178 Buddy's Kitchen Inc 72231 Food Service Contractors Food Products 241 CITY 5,307,000 5,307,000 0.0145<br />
1336 Calco Sprouts Inc Food Products 241 CITY,WELL 5,564,072 1,406,444 0.0152<br />
0448 Captain Ken's Foods Inc 311991 Perishable Prepared Food Manufacturing Food Products 241 WELL 7,171,200 5,399,097 0.0196<br />
1208 Cargill Inc-Process Development Facility 54171 Research and Development in the Physical, Engineering, and Life Sciences Food Products 241 CITY 833,770 833,770 0.0023<br />
0363 Central Livestock Association 42252 Livestock Wholesalers Food Products 241 CITY,OTHER 51,837,900 47,149,400 0.1420<br />
0923 Chef Solutions 311812 Commercial Bakeries Food Products 241 CITY 12,702,500 6,405,643 0.0348<br />
0810 Conagra Foods-Snack Food Group 311919 Other Snack Food Manufacturing Food Products 241 CITY 2,538,537 1,613,049 0.0070<br />
1334 Cre 8 It Inc Food Products 241 CITY 837,000 837,000 0.0023<br />
1333 Cre 8 It Inc Food Products 241 CITY 8,084,613 8,084,613 0.0221<br />
0428 Dakota Growers Pasta Co - MN Div 311823 Dry Pasta Manufacturing Food Products 241 CITY 21,278,000 3,706,000 0.0583<br />
0312 Dakota Premium Foods LLC 311611 Animal (except Poultry) Slaughtering Food Products 241 CITY 206,366,000 200,212,800 0.5654<br />
0296 Dean Foods Woodbury 311511 Fluid Milk Manufacturing Food Products 241 CITY 67,671,000 61,235,952 0.1854<br />
0884 Domino's National Commissary Corp 311822 Flour Mixes and Dough Manufacturing from Purchased Flour Food Products 241 CITY 7,377,000 4,871,379 0.0202<br />
0076 E A Sween Co dba Deli Express 311991 Perishable Prepared Food Manufacturing Food Products 241 CITY 12,540,474 11,094,183 0.0344<br />
0625 Earthgrains / Metz Baking Co 311812 Commercial Bakeries Food Products 241 CITY 53,250,000 38,553,070 0.1459<br />
0323 Everfresh Food Corp 311823 Dry Pasta Manufacturing Food Products 241 CITY,OTHER 899,876 727,892 0.0025<br />
0782 Fischer's United Supply Inc 311421 Fruit and Vegetable Canning Food Products 241 CITY 652,500 467,037 0.0018<br />
0849 General Mills Inc - Bakeries & Foodservice 311812 Commercial Bakeries Food Products 241 CITY 214,401,474 115,621,602 0.5874<br />
0034 General Mills Inc - Purity Oats 311211 Flour Milling Food Products 241 CITY,OTHER 4,644,132 938,134 0.0127<br />
0002 General Mills Inc (JFBTC) 311211 Flour Milling Food Products 241 CITY,WELL 56,043,000 41,150,700 0.1535<br />
0848 General Mills Operations Inc 311211 Flour Milling Food Products 241 CITY 19,028,250 8,440,911 0.0521<br />
0362 General Mills Technology Center E 54171 Research and Development in the Physical, Engineering, and Life Sciences Food Products 241 CITY 15,461,016 8,849,074 0.0424<br />
0326 Glenwood-Inglewood Co 312112 Bottled <strong>Water</strong> Manufacturing Food Products 241 CITY,WELL,OTHER 20,523,736 10,324,142 0.0562<br />
1104 Haagen-Dazs R & D 31152 Ice Cream and Frozen Dessert Manufacturing Food Products 241 CITY 2,142,660 2,132,760 0.0059<br />
1084 Happy's Potato Chip Co 311919 Other Snack Food Manufacturing Food Products 241 CITY 36,656,900 34,959,356 0.1004<br />
0058 Hastings Coop Creamery 311511 Fluid Milk Manufacturing Food Products 241 CITY 10,829,000 8,867,000 0.0297<br />
1298 Johnson Brothers Liquor Co 42282 Wine and Distilled Alcoholic Beverage Wholesalers Food Products 241 CITY 4,393,752 1,620,896 0.0120<br />
0064 Kemps LLC 311511 Fluid Milk Manufacturing Food Products 241 CITY,WELL 93,467,000 63,191,200 0.2561<br />
0589 King's Deluxe Foods (0589) 42242 Packaged Frozen Food Wholesalers Food Products 241 CITY 19,557,750 10,857,750 0.0536<br />
0480 Land O'Lakes Inc 311511 Fluid Milk Manufacturing Food Products 241 CITY 19,692,800 15,215,000 0.0540<br />
II-1_App E_MCES IU Data-2005 <strong>Water</strong> Demand.xls Page 4 of 14 7/6/2007<br />
Incoming<br />
(mgd)
Permit<br />
No.<br />
Organization<br />
NAICS<br />
Code 1<br />
Metropolitan Council <strong>Industrial</strong> Dischargers <strong>Water</strong> Demand, 2005<br />
Sorted by Business Category and Organization Name<br />
NAICS Description<br />
MCES Business<br />
Category 2<br />
DNR <strong>Use</strong><br />
Code 3<br />
Incoming <strong>Water</strong><br />
Type<br />
Incoming (Gal) Sewered (Gal)<br />
1283 Leeann Chin Inc 72231 Food Service Contractors Food Products 241 CITY 3,198,500 2,822,460 0.0088<br />
1358 Lettieri's Inc Food Products 241 CITY 6,557,700 6,323,700 0.0180<br />
0793 Lloyd's Barbeque Co 311613 Rendering and Meat Byproduct Processing Food Products 241 CITY 92,279,000 57,723,125 0.2528<br />
0942 Loft House Bakery Products Inc 311812 Commercial Bakeries Food Products 241 CITY 57,975,900 33,059,535 0.1588<br />
0820 LSG/Sky Chef 72232 Frozen Specialty Food Manufacturing Food Products 241 CITY,OTHER 188,147,112 172,559,160 0.5155<br />
1348 Lunds Mitchell Road LLC Food Products 241 CITY 33,816,300 18,461,727 0.0926<br />
0014 M - Foods Dairy LLC 311511 Fluid Milk Manufacturing Food Products 241 CITY,WELL 679,061,886 143,923,464 1.8604<br />
0630 Marcom Services Inc Food Products 241 CITY 2,137,000 2,137,000 0.0059<br />
0264 Marigold Foods Inc - Mpls Plant 311511 Fluid Milk Manufacturing Food Products 241 CITY 296,410,352 289,063,656 0.8121<br />
0272 Midwest Coca Cola Bottling Inc (0272) 312111 Soft Drink Manufacturing Food Products 241 CITY,WELL 245,280,000 161,733,376 0.6720 *<br />
1134 Mission Foods 31183 Tortilla Manufacturing Food Products 241 CITY 11,366,000 7,734,324 0.0311<br />
0059 Northern Star Co 311411 Frozen Fruit, Juice, and Vegetable Manufacturing Food Products 241 CITY,WELL 289,044,104 280,372,298 0.7919<br />
0873 Novartis Nutrition Corp 311999 All Other Miscellaneous Food Manufacturing Food Products 241 CITY 13,992,310 6,317,830 0.0383<br />
0634 Novartis Nutrition Corp Food Products 241 CITY 559,697,385 419,159,635 1.5334<br />
0116 Old Dutch Foods Inc 311919 Other Snack Food Manufacturing Food Products 241 CITY,WELL 59,345,600 58,649,200 0.1626<br />
0322 Old Home Foods Inc 311511 Fluid Milk Manufacturing Food Products 241 CITY,OTHER 19,129,352 15,690,178 0.0524<br />
1166 Olsen Fish Co Food Products 241 CITY 874,997 788,213 0.0024<br />
0298 Pearson Candy Co 31133 Confectionery Manufacturing from Purchased Chocolate Food Products 241 CITY,WELL 21,237,213 14,099,208 0.0582<br />
0366 Pepsi Bottling Group LLC 312111 Soft Drink Manufacturing Food Products 241 CITY,WELL 703,974,000 181,752,420 1.9287<br />
0817 Quali-Tech Inc 311999 All Other Miscellaneous Food Manufacturing Food Products 241 CITY 1,849,000 1,386,750 0.0051<br />
1293 Quality Ingredients Corp 311514 Dry, Condensed, and Evaporated Dairy Product Manufacturing Food Products 241 CITY 17,876,000 13,474,788 0.0490<br />
0036 Rahr Malting Co 311213 Malt Manufacturing Food Products 241 CITY,WELL 359,151,462 359,152,382 0.9840<br />
0413 Ry-Krisp Plant, Ralston Foods 311821 Cookie and Cracker Manufacturing Food Products 241 CITY 1,066,094 692,871 0.0029<br />
0300 Schroeder Milk Co Inc 311511 Fluid Milk Manufacturing Food Products 241 CITY 328,940,000 279,263,404 0.9012<br />
0373 Schumacher Wholesale Meats Inc 311612 Meat Processed from Carcasses Food Products 241 CITY 7,925,100 7,925,100 0.0217<br />
1182 Siyeza Creative Foods LLC 311412 Frozen Specialty Food Manufacturing Food Products 241 CITY 21,228,836 19,698,992 0.0582<br />
1051 Stock Yards Meat Packing Co 42247 Meat and Meat Product Wholesalers Food Products 241 CITY 1,290,000 1,290,000 0.0035<br />
1161 Summit Brewing Co Food Products 241 CITY 19,412,096 12,643,804 0.0532<br />
0844 SuperMom's LLC 311812 Commercial Bakeries Food Products 241 CITY 11,207,400 7,369,166 0.0307<br />
1029 Swanson Meats Inc 42242 Packaged Frozen Food Wholesalers Food Products 241 CITY 1,084,500 925,140 0.0030<br />
1327 The New French Bakery Inc 311812 Commercial Bakeries Food Products 241 CITY 5,453,284 4,086,064 0.0149<br />
0114 United Sugars Corp 311313 Beet Sugar Manufacturing Food Products 241 WELL 29,606,600 3,373,290 0.0811<br />
1281 Upscale Foods 311412 Frozen Specialty Food Manufacturing Food Products 241 CITY 1,080,000 1,056,000 0.0030<br />
0826 VICOM (0826) 311813 Frozen Cakes, Pies, and Other Pastries Manufacturing Food Products 241 CITY,OTHER 16,327,800 13,137,116 0.0447<br />
0999 Waymouth Farms Inc 311511 Fluid Milk Manufacturing Food Products 241 CITY 3,001,100 3,001,100 0.0082<br />
0960 Anchor Glass Container Corp 327213 Glass Container Manufacturing Glass Products 248 CITY,WELL 21,138,600 4,157,998 0.0579<br />
1074 Twin City Optical 339115 Ophthalmic Goods Manufacturing Glass Products 248 CITY 3,332,000 3,327,000 0.0091<br />
0501 Abbott Northwestern Hospital 62211 General Medical and Surgical Hospitals Health Care 213 CITY,WELL 150,813,450 137,791,318 0.4132<br />
0517 Children's Hospitals/Clinics - Mpls 62211 General Medical and Surgical Hospitals Health Care 213 CITY 109,828,500 109,366,500 0.3009<br />
0840 Fairview Ridges Hospital 62211 General Medical and Surgical Hospitals Health Care 213 CITY 15,943,000 13,670,000 0.0437<br />
0509 Fairview Southdale Hospital 62211 General Medical and Surgical Hospitals Health Care 213 CITY,WELL 148,723,269 120,309,441 0.4075<br />
II-1_App E_MCES IU Data-2005 <strong>Water</strong> Demand.xls Page 5 of 14 7/6/2007<br />
Incoming<br />
(mgd)
Permit<br />
No.<br />
Organization<br />
NAICS<br />
Code 1<br />
Metropolitan Council <strong>Industrial</strong> Dischargers <strong>Water</strong> Demand, 2005<br />
Sorted by Business Category and Organization Name<br />
NAICS Description<br />
MCES Business<br />
Category 2<br />
DNR <strong>Use</strong><br />
Code 3<br />
Incoming <strong>Water</strong><br />
Type<br />
Incoming (Gal) Sewered (Gal)<br />
0535 Fairview University Medical Center 62211 General Medical and Surgical Hospitals Health Care 213 CITY,WELL 98,481,900 89,726,550 0.2698<br />
0507 Fairview University Medical Center 62211 General Medical and Surgical Hospitals Health Care 213 CITY 143,342,106 128,535,374 0.3927<br />
0511 Hennepin County Medical Center 62211 General Medical and Surgical Hospitals Health Care 213 CITY 81,663,648 81,663,648 0.2237<br />
0023 Lakeview Memorial Hospital 62211 General Medical and Surgical Hospitals Health Care 213 CITY 32,013,000 22,782,504 0.0877<br />
0513 Mercy Hospital 62211 General Medical and Surgical Hospitals Health Care 213 CITY 30,689,000 22,828,847 0.0841<br />
0514 Methodist Hospital 62211 General Medical and Surgical Hospitals Health Care 213 CITY,WELL 60,682,000 52,724,400 0.1663<br />
0520 North Memorial Health Care 62211 General Medical and Surgical Hospitals Health Care 213 CITY 197,314,424 158,060,872 0.5406<br />
0522 Regina Medical Center 62211 General Medical and Surgical Hospitals Health Care 213 CITY 29,010,000 24,129,884 0.0795<br />
0526 Regions Hospital 62211 General Medical and Surgical Hospitals Health Care 213 CITY 102,180,870 84,680,504 0.2799<br />
0533 Ridgeview Medical Center 62211 General Medical and Surgical Hospitals Health Care 213 CITY 16,145,000 15,264,452 0.0442<br />
1114 St Francis Regional Medical Center 62211 General Medical and Surgical Hospitals Health Care 213 CITY 17,085,720 12,813,472 0.0468<br />
0829 St John's Hospital NE 62211 General Medical and Surgical Hospitals Health Care 213 CITY 20,582,790 14,688,806 0.0564<br />
0524 St Joseph's Hospital 62211 General Medical and Surgical Hospitals Health Care 213 CITY 29,914,764 27,834,016 0.0820<br />
0530 United Hospital 62211 General Medical and Surgical Hospitals Health Care 213 CITY 141,926,268 136,368,768 0.3888<br />
0531 Unity Hospital 62211 General Medical and Surgical Hospitals Health Care 213 CITY 31,926,180 25,133,305 0.0875<br />
0532 V A Medical Center 62211 General Medical and Surgical Hospitals Health Care 213 CITY,WELL 867,189,000 156,372,000 2.3759<br />
1231 Woodwinds Health Campus 62211 General Medical and Surgical Hospitals Health Care 213 CITY 10,756,330 8,031,980 0.0295<br />
1214 Biovest International Inc 54171 Research and Development in the Physical, Engineering, and Life Sciences Laboratory 213 CITY 1,849,500 1,849,500 0.0051<br />
0402 Birchwood Laboratories Inc Laboratory 213 CITY,WELL 1,219,804 745,120 0.0033<br />
1246 Boos Dental Laboratory Laboratory 213 CITY 813,491 813,491 0.0022<br />
0835 R & D Systems Inc (0835) 325413 In-Vitro Diagnostic Substance Manufacturing Laboratory 213 CITY 9,793,000 6,673,786 0.0268<br />
0041 Ameripride Services (0041) 812332 <strong>Industrial</strong> Launderers Laundry 213 CITY,WELL 63,921,750 43,427,268 0.1751<br />
1136 Aramark Uni<strong>for</strong>m Services Inc 812332 <strong>Industrial</strong> Launderers Laundry 213 CITY 106,660,000 95,994,000 0.2922<br />
0656 Cintas Corp - Eagan 812332 <strong>Industrial</strong> Launderers Laundry 213 CITY 30,720,000 28,569,600 0.0842<br />
1199 Cintas Corp - Maple Grove 812332 <strong>Industrial</strong> Launderers Laundry 213 CITY 65,097,000 60,312,150 0.1783<br />
1207 G & K Services 812332 <strong>Industrial</strong> Launderers Laundry 213 CITY 7,108,992 6,540,089 0.0195<br />
0341 G & K Services 812332 <strong>Industrial</strong> Launderers Laundry 213 CITY,WELL 23,262,026 21,701,076 0.0637<br />
0443 G & K Services 812332 <strong>Industrial</strong> Launderers Laundry 213 CITY,WELL 38,990,026 38,990,026 0.1068<br />
1341 Health Systems Cooperative Laundries 81232 Drycleaning and Laundry Services (except Coin-Operated) Laundry 213 CITY 212,120,832 173,677,628 0.5812<br />
1094 Huebsch Laundry Co 812332 <strong>Industrial</strong> Launderers Laundry 213 CITY 2,428,000 2,384,196 0.0067<br />
0259 Leef Brothers Inc 812332 <strong>Industrial</strong> Launderers Laundry 213 CITY,WELL 52,757,708 45,566,268 0.1445<br />
1254 Mid City <strong>Industrial</strong> Laundry 812332 <strong>Industrial</strong> Launderers Laundry 213 CITY 1,106,500 1,029,045 0.0030<br />
1148 Spruce Co 812332 <strong>Industrial</strong> Launderers Laundry 213 CITY 3,972,000 3,696,450 0.0109<br />
1309 Tek Products 812332 <strong>Industrial</strong> Launderers Laundry 213 CITY 6,695,200 6,356,440 0.0183<br />
0048 Twin City Hide Inc (0048) 42259 Other Farm Product Raw Material Wholesalers Leather Products 248 CITY 20,393,344 18,801,110 0.0559<br />
0784 Twin City Tanning Co (0784) 31611 Leather and Hide Tanning and Finishing Leather Products 248 CITY 304,869,000 249,551,235 0.8353<br />
1267 Accellent Inc 339112 Surgical and Medical Instrument Manufacturing Medical Products 248 CITY 2,378,090 2,216,880 0.0065<br />
1141 American Medical Systems Medical Products 248 CITY 7,196,090 3,521,540 0.0197<br />
1273 ATS Medical Inc 339113 Surgical Appliance and Supplies Manufacturing Medical Products 248 CITY 1,934,400 1,934,400 0.0053<br />
0291 Beckman Coulter Inc 325412 Pharmaceutical Preparation Manufacturing Medical Products 248 CITY 14,078,322 11,280,588 0.0386<br />
0843 Boston Scientific Corporation (0843) 339112 Surgical and Medical Instrument Manufacturing Medical Products 248 CITY,OTHER 260,943,900 146,066,055 0.7149<br />
II-1_App E_MCES IU Data-2005 <strong>Water</strong> Demand.xls Page 6 of 14 7/6/2007<br />
Incoming<br />
(mgd)
Permit<br />
No.<br />
Organization<br />
NAICS<br />
Code 1<br />
Metropolitan Council <strong>Industrial</strong> Dischargers <strong>Water</strong> Demand, 2005<br />
Sorted by Business Category and Organization Name<br />
NAICS Description<br />
MCES Business<br />
Category 2<br />
DNR <strong>Use</strong><br />
Code 3<br />
Incoming <strong>Water</strong><br />
Type<br />
Incoming (Gal) Sewered (Gal)<br />
1223 Boston Scientific Corporation (1223) 339112 Surgical and Medical Instrument Manufacturing Medical Products 248 CITY 165,848,000 111,874,772 0.4544<br />
1260 Cima Labs Inc 325412 Pharmaceutical Preparation Manufacturing Medical Products 248 CITY 9,480,000 9,417,000 0.0260<br />
0397 DiaSorin Inc Medical Products 248 CITY 8,906,000 7,152,520 0.0244<br />
0412 Guidant 334510 Electromedical and Electrotherapeutic Apparatus Manufacturing Medical Products 248 CITY 26,128,654 12,994,084 0.0716<br />
0915 Lifecore Biomedical (0915) 339113 Surgical Appliance and Supplies Manufacturing Medical Products 248 CITY 10,082,200 8,237,008 0.0276<br />
1154 Medtronic Perfusion Systems Medical Products 248 CITY,OTHER 10,781,100 7,313,160 0.0295<br />
1010 Mentor Corp Minnesota 339113 Surgical Appliance and Supplies Manufacturing Medical Products 248 CITY 23,316,285 23,316,285 0.0639<br />
1256 Micro-Matics LLC 332721 Precision Turned Product Manufacturing Medical Products 248 CITY 186,000 156,400 0.0005<br />
1290 ProtaTek International Inc 325414 Biological Product (except Diagnostic) Manufacturing Medical Products 248 CITY 1,535,000 1,535,000 0.0042<br />
1195 Protein Design Labs Inc 325412 Pharmaceutical Preparation Manufacturing Medical Products 248 CITY 8,411,600 8,411,600 0.0230<br />
0973 St Jude Medical Inc 339113 Surgical Appliance and Supplies Manufacturing Medical Products 248 CITY 9,832,000 9,720,082 0.0269<br />
1137 Upsher-Smith Laboratories Inc (1137) Medical Products 248 CITY 2,550,910 1,723,336 0.0070<br />
1313 Upsher-Smith Laboratories Inc (1313) Medical Products 248 CITY 2,712,000 2,712,000 0.0074<br />
1269 ViroGen Inc 325414 Biological Product (except Diagnostic) Manufacturing Medical Products 248 CITY 366,350 366,350 0.0010<br />
0924 3M Co Metal Products 247 CITY 4,517,436 2,799,800 0.0124<br />
1268 A & E Metal Finishing Inc Metal Products 247 CITY 303,600 272,860 0.0008<br />
1251 A W Beadblasting Co Metal Products 247 CITY 147,356 134,506 0.0004<br />
1138 ADC Telecommunications Inc 332999 All Other Miscellaneous Fabricated Metal Product Manufacturing Metal Products 247 CITY 32,120,000 445,173,300 0.0880 *<br />
1153 ADDCO Inc 33429 Other Communications Equipment Manufacturing Metal Products 247 CITY 3,964,400 2,824,224 0.0109<br />
1258 Advance Corp #1258 33995 Sign Manufacturing Metal Products 247 CITY 3,995,000 1,861,000 0.0109<br />
1275 Aljon Tool Inc 332999 All Other Miscellaneous Fabricated Metal Product Manufacturing Metal Products 247 CITY 309,000 309,000 0.0008<br />
1198 Alliance Steel Service Co 42193 Recyclable Material Wholesalers Metal Products 247 CITY,OTHER 355,966 355,966 0.0010<br />
1081 Alumiplate Inc 332813 Electroplating, Plating, Polishing, Anodizing, and Coloring Metal Products 247 CITY 1,086,346 1,084,346 0.0030<br />
1310 AmeriStar Laser Cutting Inc 33271 Machine Shops Metal Products 247 CITY 1,381,500 1,311,500 0.0038<br />
0951 Anotech Inc 332813 Electroplating, Plating, Polishing, Anodizing, and Coloring Metal Products 247 CITY 4,408,244 4,082,484 0.0121<br />
0996 APG Cash Drawer 332439 Other Metal Container Manufacturing Metal Products 247 CITY 8,583,600 8,366,700 0.0235<br />
1211 Aspen Equipment Co 332999 All Other Miscellaneous Fabricated Metal Product Manufacturing Metal Products 247 CITY 2,463,000 2,265,600 0.0067<br />
0169 Avtec Finishing Systems 332813 Electroplating, Plating, Polishing, Anodizing, and Coloring Metal Products 247 CITY 25,471,200 24,754,516 0.0698<br />
0081 BAE Systems Land and Armaments (0081) 332995 Other Ordnance and Accessories Manufacturing Metal Products 247 CITY 131,896,000 76,731,720 0.3614<br />
0187 Bauer Welding & Metal Fabricators Inc 332996 Fabricated Pipe and Pipe Fitting Manufacturing Metal Products 247 CITY 10,666,400 5,162,264 0.0292<br />
0374 Bepex International LLC 333298 All Other <strong>Industrial</strong> Machinery Manufacturing Metal Products 247 CITY 1,329,280 1,329,280 0.0036<br />
0990 Bermo Inc #0990 332116 Metal Stamping Metal Products 247 CITY 8,060,736 5,894,652 0.0221<br />
1263 Better Parts Co 33271 Machine Shops Metal Products 247 CITY 326,000 323,600 0.0009<br />
0178 Bo-Decor Metal Finishing Inc 332813 Electroplating, Plating, Polishing, Anodizing, and Coloring Metal Products 247 CITY 2,498,000 2,178,000 0.0068<br />
0912 Bodycote Thermal Processing Co 332811 Metal Heat Treating Metal Products 247 CITY 3,915,000 3,014,749 0.0107<br />
1060 Boker's Inc #1060 332116 Metal Stamping Metal Products 247 CITY 135,020 135,020 0.0004<br />
1233 Boker's Inc #1233 332116 Metal Stamping Metal Products 247 CITY 1,414,984 1,414,984 0.0039<br />
1070 Brady Worldwide Inc 333293 Printing Machinery and Equipment Manufacturing Metal Products 247 CITY 1,125,000 370,984 0.0031<br />
0919 BSM/CORAM North America, Inc. 332999 All Other Miscellaneous Fabricated Metal Product Manufacturing Metal Products 247 CITY 279,670 176,609 0.0008<br />
0633 Buhler Inc 33242 Metal Tank (Heavy Gauge) Manufacturing Metal Products 247 CITY 1,878,660 1,878,660 0.0051<br />
0827 Burr Technology Inc 332813 Electroplating, Plating, Polishing, Anodizing, and Coloring Metal Products 247 CITY 378,000 378,000 0.0010<br />
II-1_App E_MCES IU Data-2005 <strong>Water</strong> Demand.xls Page 7 of 14 7/6/2007<br />
Incoming<br />
(mgd)
Permit<br />
No.<br />
Organization<br />
NAICS<br />
Code 1<br />
Metropolitan Council <strong>Industrial</strong> Dischargers <strong>Water</strong> Demand, 2005<br />
Sorted by Business Category and Organization Name<br />
NAICS Description<br />
MCES Business<br />
Category 2<br />
DNR <strong>Use</strong><br />
Code 3<br />
Incoming <strong>Water</strong><br />
Type<br />
Incoming (Gal) Sewered (Gal)<br />
1181 Cannon Equipment 333922 Conveyor and Conveying Equipment Manufacturing Metal Products 247 CITY 3,479,679 870,879 0.0095<br />
1279 Carley Foundry Inc Metal Products 247 CITY 3,262,598 2,918,500 0.0089<br />
1167 Carter Day International Inc 333111 Farm Machinery and Equipment Manufacturing Metal Products 247 CITY 397,000 397,000 0.0011<br />
0029 Caterpillar Paving Products Inc 333924 <strong>Industrial</strong> Truck, Tractor, Trailer, and Stacker Machinery Manufacturing Metal Products 247 CITY 13,921,500 11,238,300 0.0381<br />
0755 Certified Painting Inc 332813 Electroplating, Plating, Polishing, Anodizing, and Coloring Metal Products 247 CITY 922,530 922,530 0.0025<br />
0136 Circuit Science Inc Metal Products 247 CITY 26,923,000 26,923,000 0.0738<br />
1342 Consolidated Container Company 81131 Commercial and <strong>Industrial</strong> Machinery and Equipment (except Automotive and Electronic) RepaMetal Products 247 CITY 1,484,132 1,484,132 0.0041<br />
0460 Continental Machines 333911 Pump and Pumping Equipment Manufacturing Metal Products 247 CITY 1,611,438 1,611,438 0.0044<br />
0536 Continental Machines 333512 Machine Tool (Metal Cutting Types) Manufacturing Metal Products 247 CITY 3,030,100 3,030,100 0.0083<br />
1105 Dayton Rogers Mfg Co 332116 Metal Stamping Metal Products 247 CITY 4,808,854 1,886,388 0.0132<br />
0572 Deburring Inc 33271 Machine Shops Metal Products 247 CITY 815,000 815,000 0.0022<br />
0557 Detector Electronics Corp 334419 Other Electronic Component Manufacturing Metal Products 247 CITY 2,450,000 1,277,543 0.0067<br />
0750 Donaldson Co Inc Metal Products 247 CITY 18,462,000 13,074,000 0.0506<br />
0694 Douglas Corp 332812 Metal Coating, Engraving (except Jewelry and Silverware), and Allied Services to ManufacturerMetal Products 247 CITY 10,288,000 10,264,000 0.0282<br />
0145 Dugas Bowers Plating Co 332813 Electroplating, Plating, Polishing, Anodizing, and Coloring Metal Products 247 CITY 13,729,400 12,341,640 0.0376<br />
0666 E/M Corp 332813 Electroplating, Plating, Polishing, Anodizing, and Coloring Metal Products 247 CITY 7,360,000 7,360,000 0.0202<br />
0743 Eaton MDH Inc, Eden Prairie Plant 333999 All Other Miscellaneous General Purpose Machinery Manufacturing Metal Products 247 WELL 96,809,628 42,235,152 0.2652<br />
1034 ECO Finishing Inc 332813 Electroplating, Plating, Polishing, Anodizing, and Coloring Metal Products 247 CITY 33,783,000 30,299,764 0.0926<br />
0151 Edco Products Inc 332320 Metal Products 247 CITY 16,259,160 9,178,044 0.0445<br />
1200 Electro Static Corp 332812 Metal Coating, Engraving (except Jewelry and Silverware), and Allied Services to ManufacturerMetal Products 247 CITY 2,268,684 1,898,325 0.0062<br />
1280 Electro-Mechanical Industries Inc 335313 Switchgear and Switchboard Apparatus Manufacturing Metal Products 247 CITY,OTHER 345,920 345,920 0.0009<br />
0693 ELO Engineering 332812 Metal Coating, Engraving (except Jewelry and Silverware), and Allied Services to ManufacturerMetal Products 247 CITY 1,720,060 1,720,060 0.0047<br />
1345 Engineered Finishing Corp 33271 Machine Shops Metal Products 247 CITY 591,614 369,040 0.0016<br />
0670 Excel Metal Finishing 332813 Electroplating, Plating, Polishing, Anodizing, and Coloring Metal Products 247 CITY 373,000 373,000 0.0010<br />
1261 Fed Tech Metal Products 247 CITY 2,874,000 1,598,880 0.0079<br />
0211 Federal Cartridge Co - ATK 332992 Small Arms Ammunition Manufacturing Metal Products 247 CITY,WELL 56,940,000 218,337,808 0.1560 *<br />
0384 Flame Metals Processing Corp 332811 Metal Heat Treating Metal Products 247 CITY,WELL 502,000 487,700 0.0014<br />
1139 FMS Corp 332117 Powder Metallurgy Part Manufacturing Metal Products 247 CITY 3,940,000 3,940,000 0.0108<br />
0142 Ford Motor Co 336112 Light Truck and Utility Vehicle Manufacturing Metal Products 247 CITY,OTHER 747,922,308 207,205,533 2.0491<br />
0399 GE Osmonics Inc 333319 Other Commercial and Service Industry Machinery Manufacturing Metal Products 247 CITY 63,039,000 36,933,000 0.1727<br />
1106 Gerdau Ameristeel US Inc - St Paul Mill Metal Products 247 CITY,WELL 219,247,191 66,444,633 0.6007<br />
1340 Gopher Motor Rebuilding Inc Metal Products 247 CITY 1,396,000 744,000 0.0038<br />
0626 Gopher Resource Corp 331492 Secondary Smelting, Refining, and Alloying of Nonferrous Metal (except Copper and AluminumMetal Products 247 CITY,WELL,OTHER 169,854,336 122,535,993 0.4654<br />
0358 Graco Inc 333911 Pump and Pumping Equipment Manufacturing Metal Products 247 CITY 4,808,668 4,703,275 0.0132<br />
0360 Graco Inc 333911 Pump and Pumping Equipment Manufacturing Metal Products 247 CITY 5,957,813 1,434,933 0.0163<br />
1179 Great Lakes Engineering Inc Metal Products 247 CITY 1,321,260 1,246,425 0.0036<br />
0181 Gross-Given Mfg Co 333311 Automatic Vending Machine Manufacturing Metal Products 247 CITY 7,099,930 7,099,930 0.0195<br />
0012 H D Hudson Mfg Co 333111 Farm Machinery and Equipment Manufacturing Metal Products 247 CITY 3,965,400 3,925,746 0.0109<br />
0740 H&B Elevators Inc. 333921 Elevator and Moving Stairway Manufacturing Metal Products 247 CITY 336,472 388,236 0.0009<br />
1128 Hard Anodize Inc Metal Products 247 CITY,OTHER 508,701 410,381 0.0014<br />
0370 Hardcoat Inc 332813 Electroplating, Plating, Polishing, Anodizing, and Coloring Metal Products 247 CITY 222,850 219,850 0.0006<br />
II-1_App E_MCES IU Data-2005 <strong>Water</strong> Demand.xls Page 8 of 14 7/6/2007<br />
Incoming<br />
(mgd)
Permit<br />
No.<br />
Organization<br />
NAICS<br />
Code 1<br />
Metropolitan Council <strong>Industrial</strong> Dischargers <strong>Water</strong> Demand, 2005<br />
Sorted by Business Category and Organization Name<br />
NAICS Description<br />
MCES Business<br />
Category 2<br />
DNR <strong>Use</strong><br />
Code 3<br />
Incoming <strong>Water</strong><br />
Type<br />
Incoming (Gal) Sewered (Gal)<br />
0039 Hiawatha Metalcraft Inc (Plant #3) 332813 Electroplating, Plating, Polishing, Anodizing, and Coloring Metal Products 247 CITY,WELL 181,006,641 30,297,357 0.4959<br />
0364 Hitchcock Industries Inc 331521 Aluminum Die-Casting Foundries Metal Products 247 CITY 16,327,400 14,830,872 0.0447<br />
1210 Hoffman Enclosures 332322 Sheet Metal Work Manufacturing Metal Products 247 CITY 79,255,275 50,699,463 0.2171<br />
0130 Honeywell Inc (0130) 334511 Search, Detection, Navigation, Guidance, Aeronautical, and Nautical System and Instrument MMetal Products 247 CITY,WELL 133,083,164 26,438,060 0.3646<br />
0189 Honeywell Inc (0189) 334512 Automatic Environmental Control Manufacturing <strong>for</strong> Residential, Commercial, and Appliance UsMetal Products 247 CITY,WELL 175,200,000 182,299,520 0.4800 *<br />
1152 Huot Mfg Co #1152 Metal Products 247 CITY 658,240 658,240 0.0018<br />
1119 Hutchinson Technology Inc 33271 Machine Shops Metal Products 247 CITY 30,095,200 19,997,722 0.0825<br />
0061 Intermet Co Metal Products 247 CITY 26,484,400 20,388,844 0.0726<br />
1131 Inthermo Inc Metal Products 247 CITY 447,000 263,725 0.0012<br />
0735 Invest-Cast Inc 331512 Steel Investment Foundries Metal Products 247 CITY 1,244,240 1,099,752 0.0034<br />
1043 J & E Mfg 332812 Metal Coating, Engraving (except Jewelry and Silverware), and Allied Services to ManufacturerMetal Products 247 CITY 1,826,000 1,826,000 0.0050<br />
1220 J & L Wire Cloth Co Inc 332618 Other Fabricated Wire Product Manufacturing Metal Products 247 CITY 2,381,440 1,581,480 0.0065<br />
1087 J I T Powder Coating 332812 Metal Coating, Engraving (except Jewelry and Silverware), and Allied Services to ManufacturerMetal Products 247 CITY 5,050,000 4,924,400 0.0138<br />
1277 J L Industries 337215 Showcase, Partition, Shelving, and Locker Manufacturing Metal Products 247 CITY 1,470,000 1,460,000 0.0040<br />
1132 J R Williams Co Inc 332812 Metal Coating, Engraving (except Jewelry and Silverware), and Allied Services to ManufacturerMetal Products 247 CITY 154,832 143,942 0.0004<br />
0303 Johnson Screens (0303) 333319 Other Commercial and Service Industry Machinery Manufacturing Metal Products 247 CITY 35,040,000 35,040,000 0.0960<br />
0117 Joyner's Silver & Electroplating 332813 Electroplating, Plating, Polishing, Anodizing, and Coloring Metal Products 247 WELL 13,342,920 13,048,920 0.0366<br />
1337 Kirchbaum-Krupp Metal Co Metal Products 247 CITY,OTHER 403,671 403,671 0.0011<br />
1323 Kurt Mfg Co Metal Products 247 CITY 15,312,880 15,310,080 0.0420<br />
0746 Kurt Mfg Co 332813 Electroplating, Plating, Polishing, Anodizing, and Coloring Metal Products 247 CITY,WELL 41,662,800 41,662,800 0.1141<br />
0909 Kurt Mfg Co - Die Cast Div 331521 Aluminum Die-Casting Foundries Metal Products 247 CITY 2,037,900 1,039,090 0.0056<br />
0790 Kurt Mfg Co (0790) 333515 Cutting Tool and Machine Tool Accessory Manufacturing Metal Products 247 CITY 3,593,392 3,247,020 0.0098<br />
0742 Kwik-File Inc 337214 Office Furniture (except Wood) Manufacturing Metal Products 247 CITY 3,845,740 3,845,740 0.0105<br />
1286 L & S Electric, Inc 811412 Appliance Repair and Maintenance Metal Products 247 CITY 975,000 975,000 0.0027<br />
1239 LAI Midwest Inc 332999 All Other Miscellaneous Fabricated Metal Product Manufacturing Metal Products 247 CITY 9,284,000 7,427,200 0.0254<br />
0406 Lake Air Metal Stampings LLC 33637 Motor Vehicle Metal Stamping Metal Products 247 CITY 416,000 416,000 0.0011<br />
1005 Lake Engineering Inc 33271 Machine Shops Metal Products 247 CITY 1,973,370 1,934,457 0.0054<br />
1110 LeJeune Bolt Co 332812 Metal Coating, Engraving (except Jewelry and Silverware), and Allied Services to ManufacturerMetal Products 247 CITY 142,890 142,890 0.0004<br />
0988 Life Fitness Consumer Div 332999 All Other Miscellaneous Fabricated Metal Product Manufacturing Metal Products 247 CITY 23,188,500 16,305,327 0.0635<br />
0177 Lowell Inc 332721 Precision Turned Product Manufacturing Metal Products 247 CITY 3,498,000 1,188,000 0.0096<br />
0661 Maguire & Strickland Refining Inc Metal Products 247 CITY 166,000 142,948 0.0005<br />
1249 Mate Precision Tooling 333514 Special Die and Tool, Die Set, Jig, and Fixture Manufacturing Metal Products 247 CITY 4,346,182 4,346,182 0.0119<br />
1054 McLean Midwest 333415 Air-Conditioning and Warm Air Heating Equipment and Commercial and <strong>Industrial</strong> RefrigerationMetal Products 247 CITY 14,257,220 27,842,000 0.0391<br />
0438 Med Tek Inc 332811 Metal Heat Treating Metal Products 247 CITY 2,134,700 1,067,350 0.0058<br />
0607 Medtronic Inc 334510 Electromedical and Electrotherapeutic Apparatus Manufacturing Metal Products 247 CITY 8,161,380 1,350,720 0.0224<br />
0598 Medtronic Inc 334510 Electromedical and Electrotherapeutic Apparatus Manufacturing Metal Products 247 CITY 17,011,000 5,297,437 0.0466<br />
0608 Medtronic Inc 54171 Research and Development in the Physical, Engineering, and Life Sciences Metal Products 247 CITY 24,361,280 19,112,600 0.0667<br />
1164 Metal Treaters Inc Metal Products 247 CITY 2,108,858 1,772,258 0.0058<br />
0032 Metal-Matic Inc 33121 Iron and Steel Pipe and Tube Manufacturing from Purchased Steel Metal Products 247 CITY,WELL 163,309,270 11,547,790 0.4474<br />
0643 Metal-Tronics Inc 337214 Office Furniture (except Wood) Manufacturing Metal Products 247 CITY 284,000 228,565 0.0008<br />
0126 Micro Parts Inc 332812 Metal Coating, Engraving (except Jewelry and Silverware), and Allied Services to ManufacturerMetal Products 247 CITY 6,748,000 6,748,000 0.0185<br />
II-1_App E_MCES IU Data-2005 <strong>Water</strong> Demand.xls Page 9 of 14 7/6/2007<br />
Incoming<br />
(mgd)
Permit<br />
No.<br />
Organization<br />
NAICS<br />
Code 1<br />
Metropolitan Council <strong>Industrial</strong> Dischargers <strong>Water</strong> Demand, 2005<br />
Sorted by Business Category and Organization Name<br />
NAICS Description<br />
MCES Business<br />
Category 2<br />
DNR <strong>Use</strong><br />
Code 3<br />
Incoming <strong>Water</strong><br />
Type<br />
Incoming (Gal) Sewered (Gal)<br />
1203 Mid Minnesota Wire & Mfg Inc Metal Products 247 CITY 748,000 346,600 0.0020<br />
0563 Mid-Continent Engineering 332439 Other Metal Container Manufacturing Metal Products 247 CITY 80,178,750 77,429,850 0.2197<br />
1289 Midwest Powdercoating & Screen Printing 332812 Metal Coating, Engraving (except Jewelry and Silverware), and Allied Services to ManufacturerMetal Products 247 CITY 1,363,880 1,083,880 0.0037<br />
0258 Minnesota Metal Finishing Inc 332813 Electroplating, Plating, Polishing, Anodizing, and Coloring Metal Products 247 CITY,WELL 24,676,520 24,464,840 0.0676<br />
0998 Modern Tool 332116 Metal Stamping Metal Products 247 CITY 5,622,400 4,628,840 0.0154<br />
0127 Molex Inc Copper Flex Products Metal Products 247 CITY 38,861,592 38,609,724 0.1065<br />
0691 Morrissey Inc Metal Products 247 CITY 1,468,000 1,352,800 0.0040<br />
0218 NiCo Products Inc #3 332813 Electroplating, Plating, Polishing, Anodizing, and Coloring Metal Products 247 CITY 89,522,136 77,300,568 0.2453<br />
0941 Nilfisk - Advance Inc 42183 <strong>Industrial</strong> Machinery and Equipment Wholesalers Metal Products 247 CITY 15,260,700 12,632,772 0.0418<br />
0571 Nor-Ell Inc, Powder Coating Div 332812 Metal Coating, Engraving (except Jewelry and Silverware), and Allied Services to ManufacturerMetal Products 247 CITY 5,341,170 5,122,027 0.0146<br />
0765 Northern Screw Machine Co 332721 Precision Turned Product Manufacturing Metal Products 247 CITY 300,726 300,726 0.0008<br />
0328 Northland Aluminum Products Inc 332214 Kitchen Utensil, Pot, and Pan Manufacturing Metal Products 247 CITY,OTHER 18,112,446 16,375,854 0.0496<br />
0759 Northwest Swiss-Matic Inc 332721 Precision Turned Product Manufacturing Metal Products 247 CITY 1,784,728 1,752,488 0.0049<br />
1329 Nystrom Inc Metal Products 247 CITY 4,980,000 3,510,000 0.0136<br />
1173 Oildyne Inc (1173) 333995 Fluid Power Cylinder and Actuator Manufacturing Metal Products 247 CITY 3,163,560 3,088,560 0.0087<br />
0318 Onan - Main Plant 335312 Motor and Generator Manufacturing Metal Products 247 CITY 69,249,400 40,954,820 0.1897<br />
0319 Onan - Technical Center 335312 Motor and Generator Manufacturing Metal Products 247 CITY,OTHER 3,278,380 2,842,680 0.0090<br />
1059 Per<strong>for</strong>mance <strong>Industrial</strong> Coatings Inc Metal Products 247 CITY 3,437,000 3,437,000 0.0094<br />
1032 Phillips & Temro Industries Inc 336322 Other Motor Vehicle Electrical and Electronic Equipment Manufacturing Metal Products 247 CITY 1,106,000 399,000 0.0030<br />
1174 Phillips & Temro Industries Inc 33271 Machine Shops Metal Products 247 CITY,OTHER 1,699,227 520,764 0.0047<br />
0128 Plating Inc 332813 Electroplating, Plating, Polishing, Anodizing, and Coloring Metal Products 247 CITY,WELL 24,643,131 24,643,131 0.0675<br />
1252 Powder Specialties 332812 Metal Coating, Engraving (except Jewelry and Silverware), and Allied Services to ManufacturerMetal Products 247 CITY 39,420 38,143 0.0001<br />
1209 Power Coat Metal Products 247 CITY 846,792 762,114 0.0023<br />
1213 Precise Products Corp Metal Products 247 CITY 1,118,264 622,214 0.0031<br />
1319 Precision Associates Inc Metal Products 247 CITY 4,874,000 3,933,000 0.0134<br />
1190 Production Engineering Corp 33271 Machine Shops Metal Products 247 CITY 786,305 499,073 0.0022<br />
0642 Professional Plating Inc (0642) 332813 Electroplating, Plating, Polishing, Anodizing, and Coloring Metal Products 247 CITY 10,995,390 10,138,908 0.0301<br />
0800 Progress Casting Group (0800) 331521 Aluminum Die-Casting Foundries Metal Products 247 CITY 19,537,980 12,210,891 0.0535<br />
0274 Prospect Foundry Inc 331511 Iron Foundries Metal Products 247 CITY 25,097,368 17,594,956 0.0688<br />
0703 Quality Metals Inc 332813 Electroplating, Plating, Polishing, Anodizing, and Coloring Metal Products 247 CITY,WELL 3,846,692 3,846,692 0.0105<br />
0188 Quality Painting & Metal Finishing 332812 Metal Coating, Engraving (except Jewelry and Silverware), and Allied Services to ManufacturerMetal Products 247 CITY 2,160,000 2,097,420 0.0059<br />
1326 RAO Mfg Metal Products 247 CITY 1,774,000 1,064,000 0.0049<br />
1205 Remmele Engineering Inc 333514 Special Die and Tool, Die Set, Jig, and Fixture Manufacturing Metal Products 247 CITY 2,879,600 1,117,114 0.0079<br />
0028 Rexam Beverage Can 332431 Metal Can Manufacturing Metal Products 247 CITY 82,393,836 82,395,036 0.2257<br />
0707 Richald Metal Finishing Inc 332812 Metal Coating, Engraving (except Jewelry and Silverware), and Allied Services to ManufacturerMetal Products 247 CITY 254,440 254,440 0.0007<br />
0918 Sifco Custom Machining Co 336412 Aircraft Engine and Engine Parts Manufacturing Metal Products 247 CITY,OTHER 6,361,960 5,918,154 0.0174<br />
0407 Silgan Containers Mfg Corp 332431 Metal Can Manufacturing Metal Products 247 CITY 3,251,068 2,620,666 0.0089<br />
1177 Skyline Exhibits 33995 Sign Manufacturing Metal Products 247 CITY,OTHER 1,785,500 1,357,250 0.0049<br />
1117 Spec Plating Corp 332813 Electroplating, Plating, Polishing, Anodizing, and Coloring Metal Products 247 CITY 60,430,920 46,718,312 0.1656<br />
1230 Springs Inc 332722 Bolt, Nut, Screw, Rivet, and Washer Manufacturing Metal Products 247 CITY 420,000 420,000 0.0012<br />
0331 St Paul Metalcraft Inc (0331) 331528 Other Nonferrous Foundries (except Die-Casting) Metal Products 247 CITY,OTHER 5,763,400 2,481,080 0.0158<br />
II-1_App E_MCES IU Data-2005 <strong>Water</strong> Demand.xls Page 10 of 14 7/6/2007<br />
Incoming<br />
(mgd)
Permit<br />
No.<br />
Organization<br />
NAICS<br />
Code 1<br />
Metropolitan Council <strong>Industrial</strong> Dischargers <strong>Water</strong> Demand, 2005<br />
Sorted by Business Category and Organization Name<br />
NAICS Description<br />
MCES Business<br />
Category 2<br />
DNR <strong>Use</strong><br />
Code 3<br />
Incoming <strong>Water</strong><br />
Type<br />
Incoming (Gal) Sewered (Gal)<br />
0044 States Electric Mfg Co 335313 Switchgear and Switchboard Apparatus Manufacturing Metal Products 247 CITY 305,000 305,000 0.0008<br />
0068 Stylmark 337215 Showcase, Partition, Shelving, and Locker Manufacturing Metal Products 247 CITY,WELL 27,734,550 23,808,550 0.0760<br />
1321 Super Radiator Coils #1321 Metal Products 247 CITY 4,686,000 4,217,400 0.0128<br />
0135 Superior Plating Inc (0135) 332813 Electroplating, Plating, Polishing, Anodizing, and Coloring Metal Products 247 CITY,WELL 152,009,910 152,009,910 0.4165<br />
0788 TCR Engineered Components LLC 332722 Bolt, Nut, Screw, Rivet, and Washer Manufacturing Metal Products 247 CITY,OTHER 9,435,152 9,435,152 0.0258<br />
0879 Technical Plating Inc 332813 Electroplating, Plating, Polishing, Anodizing, and Coloring Metal Products 247 CITY 18,668,000 16,759,900 0.0511<br />
1142 Tempco Mfg Co Inc Metal Products 247 CITY 1,755,032 1,238,700 0.0048<br />
0283 Tennant Co 333319 Other Commercial and Service Industry Machinery Manufacturing Metal Products 247 CITY,WELL 1,926,200 1,374,320 0.0053<br />
0185 Tennant Co 333319 Other Commercial and Service Industry Machinery Manufacturing Metal Products 247 CITY 18,658,400 18,317,244 0.0511<br />
0156 Thermo King Corp 333415 Air-Conditioning and Warm Air Heating Equipment and Commercial and <strong>Industrial</strong> RefrigerationMetal Products 247 CITY 17,861,400 10,095,420 0.0489<br />
0255 Thomas Engineering Co 332116 Metal Stamping Metal Products 247 CITY 1,100,000 1,097,452 0.0030<br />
0466 Timmerman Finishing 332812 Metal Coating, Engraving (except Jewelry and Silverware), and Allied Services to ManufacturerMetal Products 247 CITY 740,000 479,648 0.0020<br />
0430 Toro Co 333112 Lawn and Garden Tractor and Home Lawn and Garden Equipment Manufacturing Metal Products 247 CITY 9,806,700 7,038,000 0.0269<br />
1274 Twin City Metalseal 332812 Metal Coating, Engraving (except Jewelry and Silverware), and Allied Services to ManufacturerMetal Products 247 CITY 149,230 149,230 0.0004<br />
0190 Twin City Plating Co 332813 Electroplating, Plating, Polishing, Anodizing, and Coloring Metal Products 247 CITY 1,867,500 739,704 0.0051<br />
0220 Universal Plating Co Inc 332813 Electroplating, Plating, Polishing, Anodizing, and Coloring Metal Products 247 CITY 17,226,924 16,986,924 0.0472<br />
1045 UPI Mech Plating & Galvanizing 332812 Metal Coating, Engraving (except Jewelry and Silverware), and Allied Services to ManufacturerMetal Products 247 CITY 86,778 86,778 0.0002<br />
0191 Valmont / Applied Coating Technology #0191 332812 Metal Coating, Engraving (except Jewelry and Silverware), and Allied Services to ManufacturerMetal Products 247 CITY 16,619,690 14,366,242 0.0455<br />
1022 Valmont/Lexington 332323 Ornamental and Architectural Metal Work Manufacturing Metal Products 247 CITY 1,438,000 420,300 0.0039<br />
1068 Versa Die Cast Inc 331521 Aluminum Die-Casting Foundries Metal Products 247 CITY 2,537,462 980,016 0.0070<br />
0753 Versa Iron & Machine 331511 Iron Foundries Metal Products 247 CITY,WELL 47,140,671 2,451,312 0.1292<br />
1067 Viking Drill & Tool Inc 333515 Cutting Tool and Machine Tool Accessory Manufacturing Metal Products 247 CITY 4,928,288 2,036,698 0.0135<br />
1189 Waltek 331512 Steel Investment Foundries Metal Products 247 CITY 467,166 467,166 0.0013<br />
0421 <strong>Water</strong>ous Co 333911 Pump and Pumping Equipment Manufacturing Metal Products 247 CITY 4,900,000 3,400,000 0.0134<br />
1100 Weather Rite Inc 333412 <strong>Industrial</strong> and Commercial Fan and Blower Manufacturing Metal Products 247 CITY 1,720,052 1,720,052 0.0047<br />
0891 Wipaire Inc 48819 Other Support Activities <strong>for</strong> Air Transportation Metal Products 247 CITY 530,880 506,280 0.0015<br />
0219 World Aerospace Corp 332999 All Other Miscellaneous Fabricated Metal Product Manufacturing Metal Products 247 CITY 6,510,000 5,211,000 0.0178<br />
1126 Wrico Stamping Co of MN Metal Products 247 CITY 2,904,000 2,129,776 0.0080<br />
0369 Ziegler Inc 42181 Construction and Mining (except Oil Well) Machinery and Equipment Wholesalers Metal Products 247 CITY 4,601,900 4,078,200 0.0126<br />
0104 Culligan Soft <strong>Water</strong> Service Co 56199 All Other Support Services Other 213 CITY 27,320,000 27,320,000 0.0748<br />
1186 Culligan <strong>Water</strong> Conditioning #1186 333319 Other Commercial and Service Industry Machinery Manufacturing Other 213 CITY 6,793,440 6,793,440 0.0186<br />
0487 Ecowater Corp 333319 Other Commercial and Service Industry Machinery Manufacturing Other 213 CITY 25,002,400 20,649,600 0.0685<br />
0855 Smith Engineering Inc 333319 Other Commercial and Service Industry Machinery Manufacturing Other 213 CITY 4,100,680 4,100,680 0.0112<br />
1215 Sterling <strong>Water</strong> Inc dba Culligan 56199 All Other Support Services Other 213 CITY 1,046,000 968,000 0.0029<br />
1351 Wigen <strong>Water</strong> Technologies Other 213 CITY 196,648 196,648 0.0005<br />
0105 Americraft Carton Inc 322211 Corrugated and Solid Fiber Box Manufacturing Paper/Packaging 249 CITY 1,800,000 1,800,000 0.0049<br />
1248 B.F. Nelson Corporation 322211 Corrugated and Solid Fiber Box Manufacturing Paper/Packaging 249 CITY 2,192,000 1,924,961 0.0060<br />
1229 Central Container Corp 322211 Corrugated and Solid Fiber Box Manufacturing Paper/Packaging 249 CITY 2,060,000 2,060,000 0.0056<br />
1212 Creative Carton Corp 322211 Corrugated and Solid Fiber Box Manufacturing Paper/Packaging 249 CITY 4,160,000 3,242,000 0.0114<br />
1024 Green Bay Packaging Inc-Twintown 322211 Corrugated and Solid Fiber Box Manufacturing Paper/Packaging 249 CITY 16,423,910 8,331,624 0.0450<br />
0392 Greif Bros Corp 322224 Uncoated Paper and Multiwall Bag Manufacturing Paper/Packaging 249 CITY 13,821,003 13,275,003 0.0379<br />
II-1_App E_MCES IU Data-2005 <strong>Water</strong> Demand.xls Page 11 of 14 7/6/2007<br />
Incoming<br />
(mgd)
Permit<br />
No.<br />
Organization<br />
NAICS<br />
Code 1<br />
Metropolitan Council <strong>Industrial</strong> Dischargers <strong>Water</strong> Demand, 2005<br />
Sorted by Business Category and Organization Name<br />
NAICS Description<br />
MCES Business<br />
Category 2<br />
DNR <strong>Use</strong><br />
Code 3<br />
Incoming <strong>Water</strong><br />
Type<br />
Incoming (Gal) Sewered (Gal)<br />
0266 Heinrich Envelope Corp 322232 Envelope Manufacturing Paper/Packaging 249 CITY 12,490,400 12,490,400 0.0342<br />
0271 International Paper Co 322211 Corrugated and Solid Fiber Box Manufacturing Paper/Packaging 249 CITY 18,718,200 9,020,685 0.0513<br />
1019 Liberty Carton Co 322211 Corrugated and Solid Fiber Box Manufacturing Paper/Packaging 249 CITY 10,884,200 8,686,646 0.0298<br />
0974 Longview Fibre Co 322211 Corrugated and Solid Fiber Box Manufacturing Paper/Packaging 249 CITY 55,315,000 30,913,945 0.1515<br />
0113 Menasha Corp 322211 Corrugated and Solid Fiber Box Manufacturing Paper/Packaging 249 CITY 4,180,000 1,869,000 0.0115<br />
0925 Menasha Packaging Co 322211 Corrugated and Solid Fiber Box Manufacturing Paper/Packaging 249 CITY 1,190,000 1,138,000 0.0033<br />
0950 Northwest Packaging Inc 323110 Setup Paperboard Box Manufacturing Paper/Packaging 249 CITY 2,963,160 2,038,272 0.0081<br />
0073 Packaging Corp of America 322211 Corrugated and Solid Fiber Box Manufacturing Paper/Packaging 249 CITY 2,129,830 1,311,964 0.0058<br />
0022 Packaging Corp of America 322211 Corrugated and Solid Fiber Box Manufacturing Paper/Packaging 249 CITY 3,763,994 1,873,312 0.0103<br />
0409 Smurfit-Stone Container Enterprises Inc 322211 Corrugated and Solid Fiber Box Manufacturing Paper/Packaging 249 CITY 9,107,904 4,510,377 0.0250<br />
0388 Stone Container Corp #0388 322211 Corrugated and Solid Fiber Box Manufacturing Paper/Packaging 249 CITY 17,809,698 13,811,832 0.0488<br />
0260 Temple-Inland 322211 Corrugated and Solid Fiber Box Manufacturing Paper/Packaging 249 WELL 33,627,400 4,036,578 0.0921<br />
0591 Waldorf Corporation (dba Rock-Tenn Co) 32213 Paperboard Mills Paper/Packaging 249 CITY,WELL,OTHER 580,350,000 1,202,584,765 1.5900 *<br />
0889 Weyerhaeuser Co 322211 Corrugated and Solid Fiber Box Manufacturing Paper/Packaging 249 CITY 13,531,320 8,366,490 0.0371<br />
0038 Weyerhaeuser Co 322211 Corrugated and Solid Fiber Box Manufacturing Paper/Packaging 249 CITY 15,920,190 10,963,800 0.0436<br />
0556 Colorhouse / Mail-Well 323122 Prepress Services Photofinishing 249 CITY 3,972,000 2,831,520 0.0109<br />
1184 DIGIgraphics/Photos Inc 812921 Photofinishing Laboratories (except One-Hour) Photofinishing 249 CITY 1,795,651 1,223,872 0.0049<br />
1355 FilmTec Corp (1355) Photofinishing 249 CITY,WELL 10,103,582 10,103,582 0.0277<br />
1144 Fuji Color Processing Photofinishing 249 CITY,OTHER 7,945,232 7,945,232 0.0218<br />
1305 Lennon, Bausman & Fitzgerald Inc 541922 Commercial Photography Photofinishing 249 CITY 336,000 336,000 0.0009<br />
0055 Lifetouch Inc (NSS Division) 541921 Photography Studios, Portrait Photofinishing 249 CITY 13,864,600 9,714,450 0.0380<br />
0539 Acme Tag and Label Co 323112 Commercial Flexographic Printing Printed Products 249 CITY 200,478 200,478 0.0005<br />
1143 Ad Graphics Printed Products 249 CITY 7,952,000 5,233,068 0.0218<br />
0773 American Spirit Graphics 323110 Commercial Lithographic Printing Printed Products 249 CITY 3,307,400 3,307,400 0.0091<br />
0943 Banta Book Group - Eden Prairie 323110 Commercial Lithographic Printing Printed Products 249 CITY 2,817,040 1,886,416 0.0077<br />
0944 Banta Catalog Group - Mpls 323110 Commercial Lithographic Printing Printed Products 249 CITY 77,160,000 42,767,800 0.2114<br />
1082 Bureau of Engraving-Printing Div 323110 Commercial Lithographic Printing Printed Products 249 CITY 4,019,446 1,724,544 0.0110<br />
0845 Clariant Corp - Master Batches Div Printed Products 249 CITY 4,794,652 3,542,256 0.0131<br />
0868 Container Graphics 323122 Prepress Services Printed Products 249 CITY 2,141,734 774,630 0.0059<br />
0895 Custom Business Forms 323116 Manifold Business Forms Printing Printed Products 249 CITY 426,644 421,644 0.0012<br />
1191 Gannett Offset - Minneapolis 323110 Commercial Lithographic Printing Printed Products 249 CITY 8,700,000 7,328,000 0.0238<br />
0797 GML Inc Printed Products 249 CITY 1,024,468 503,100 0.0028<br />
1350 Immedia Inc Printed Products 249 CITY 797,431 796,917 0.0022<br />
0955 Impressions Inc 323110 Commercial Lithographic Printing Printed Products 249 CITY 2,169,200 1,626,070 0.0059<br />
1255 Inno-Flex Corp 323112 Commercial Flexographic Printing Printed Products 249 CITY 2,228,000 2,228,000 0.0061<br />
0854 IWCO Direct 323110 Commercial Lithographic Printing Printed Products 249 CITY 18,375,000 11,599,158 0.0503<br />
1133 Japs-Olson Co 323110 Commercial Lithographic Printing Printed Products 249 CITY 13,290,000 13,290,000 0.0364<br />
1264 Liberty Carton Co 32213 Paperboard Mills Printed Products 249 CITY 3,735,000 3,735,000 0.0102<br />
0562 Litho Technical Service 323110 Commercial Lithographic Printing Printed Products 249 CITY 486,000 420,000 0.0013<br />
0063 MacKay Envelope Co Printed Products 249 CITY 4,218,750 2,933,750 0.0116<br />
1216 Maximum Graphics Inc 323121 Tradebinding and Related Work Printed Products 249 CITY 5,932,815 5,098,896 0.0163<br />
II-1_App E_MCES IU Data-2005 <strong>Water</strong> Demand.xls Page 12 of 14 7/6/2007<br />
Incoming<br />
(mgd)
Permit<br />
No.<br />
Organization<br />
NAICS<br />
Code 1<br />
Metropolitan Council <strong>Industrial</strong> Dischargers <strong>Water</strong> Demand, 2005<br />
Sorted by Business Category and Organization Name<br />
NAICS Description<br />
MCES Business<br />
Category 2<br />
DNR <strong>Use</strong><br />
Code 3<br />
Incoming <strong>Water</strong><br />
Type<br />
Incoming (Gal) Sewered (Gal)<br />
0993 Meyers Printing Co 323110 Commercial Lithographic Printing Printed Products 249 CITY 26,952,600 18,423,900 0.0738<br />
1276 Modernistic Inc Printed Products 249 CITY 1,376,320 1,376,320 0.0038<br />
0934 Northstar Financial Forms 323116 Manifold Business Forms Printing Printed Products 249 CITY 4,156,640 3,794,960 0.0114<br />
0968 Phoenix Packaging 322215 Nonfolding Sanitary Food Container Manufacturing Printed Products 249 CITY 4,732,000 3,616,000 0.0130<br />
1284 Process Displays Company 323110 Commercial Lithographic Printing Printed Products 249 CITY 3,983,800 1,669,800 0.0109<br />
1076 Random Specialties 323110 Commercial Lithographic Printing Printed Products 249 CITY,WELL 2,542,200 1,290,300 0.0070<br />
0917 Rayven Inc 326113 Unsupported Plastics Film and Sheet (except Packaging) Manufacturing Printed Products 249 CITY 794,376 531,876 0.0022<br />
0819 Schawk Minneapolis 323115 Digital Printing Printed Products 249 CITY 1,098,255 1,076,255 0.0030<br />
1318 Sefar Printing Solutions Inc. 334419 Other Electronic Component Manufacturing Printed Products 249 OTHER 201,498 199,978 0.0006<br />
0858 Sexton Printing Inc 323116 Manifold Business Forms Printing Printed Products 249 CITY 912,621 860,200 0.0025<br />
0760 Shakopee Valley Printing 323110 Commercial Lithographic Printing Printed Products 249 CITY 5,033,000 2,621,766 0.0138<br />
0445 Smead Mfg Co 323116 Manifold Business Forms Printing Printed Products 249 CITY 5,186,000 4,452,000 0.0142<br />
0042 Smyth Companies Inc 323110 Commercial Lithographic Printing Printed Products 249 CITY 8,740,380 8,135,895 0.0239<br />
0644 St Paul Pioneer Press Dispatch 51111 Newspaper Publishers Printed Products 249 CITY 9,344,016 2,775,954 0.0256<br />
0493 St Paul Pioneer Press Dispatch 51111 Newspaper Publishers Printed Products 249 CITY,WELL 200,750,000 3,956,920 0.5500 *<br />
0803 Star Tribune 51111 Newspaper Publishers Printed Products 249 CITY 6,515,250 4,348,500 0.0179<br />
0091 Thomson West - Eagan Production Facility 51113 Book Publishers Printed Products 249 CITY,OTHER 33,893,200 22,527,464 0.0929<br />
1226 Travel Tags 323112 Commercial Flexographic Printing Printed Products 249 CITY 10,632,000 5,821,440 0.0291<br />
0597 Minnesota Correctional Facility 92214 Correctional Institutions Public Facilities 211 CITY,WELL 357,361,500 357,061,500 0.9791<br />
1315 US Air Force Reserve - 934th Airlift Wing Public Facilities 211 CITY 21,573,072 21,573,072 0.0591<br />
0348 3M Co - 3M Center 54171 Research and Development in the Physical, Engineering, and Life Sciences Research & Developement 213 CITY 319,081,945 223,527,155 0.8742 *<br />
0379 Cargill Research Center (0379) 54171 Research and Development in the Physical, Engineering, and Life Sciences Research & Developement 213 CITY,WELL 4,095,000 3,395,000 0.0112<br />
1187 Dyneon, Subsidiary of 3M Co 54171 Research and Development in the Physical, Engineering, and Life Sciences Research & Developement 213 CITY 3,314,000 3,314,000 0.0091<br />
1354 Ecolab Schuman Campus Research & Developement 213 CITY 39,335,007 39,335,007 0.1078<br />
1162 Imation Corp 54171 Research and Development in the Physical, Engineering, and Life Sciences Research & Developement 213 CITY 13,786,561 6,169,181 0.0378<br />
0874 NatureWorks LLC 54171 Research and Development in the Physical, Engineering, and Life Sciences Research & Developement 213 CITY 861,900 861,900 0.0024<br />
0606 Computype Inc 561499 All Other Business Support Services Service 213 CITY 3,246,000 3,246,000 0.0089<br />
1349 E-Z <strong>Recycling</strong>, Inc. Service 213 CITY,OTHER 522,404 522,404 0.0014<br />
1237 Lason Inc 51421 Data Processing Services Service 213 CITY 559,800 559,800 0.0015<br />
1339 M J Ingber Co Inc/RBR Co Service 213 CITY,OTHER 613,432 613,432 0.0017<br />
1343 Mosaic Crop Nutrition LLC Service 213 WELL 145,863 145,863 0.0004<br />
0355 Minnesota Knitting Mills 315191 Outerwear Knitting Mills Textiles 248 CITY 6,722,276 5,200,471 0.0184<br />
1232 Buesing Bulk Transport Inc 811192 Car Washes Transportation 247 CITY 2,785,200 2,785,200 0.0076<br />
0434 Canadian Pacific Railway 482111 Line-Haul Railroads Transportation 247 CITY,OTHER 12,826,984 12,826,984 0.0351<br />
0776 Cleanco Truck Wash 811192 Car Washes Transportation 247 CITY 2,692,000 2,422,800 0.0074<br />
1121 Interstate Detroit Diesel 48849 Other Support Activities <strong>for</strong> Road Transportation Transportation 247 CITY 2,390,100 1,581,183 0.0065<br />
1304 Jefferson Partners L P 48849 Other Support Activities <strong>for</strong> Road Transportation Transportation 247 CITY 1,697,667 1,625,667 0.0047<br />
1262 Metro Transit 485113 Bus and Other Motor Vehicle Transit Systems Transportation 247 CITY 2,339,617 1,872,865 0.0064<br />
0614 Metro Transit 485113 Bus and Other Motor Vehicle Transit Systems Transportation 247 CITY 4,209,744 3,879,128 0.0115<br />
0613 Metro Transit 485113 Bus and Other Motor Vehicle Transit Systems Transportation 247 CITY 4,753,353 4,364,393 0.0130<br />
0611 Metro Transit 485113 Bus and Other Motor Vehicle Transit Systems Transportation 247 CITY 5,764,799 5,756,219 0.0158<br />
II-1_App E_MCES IU Data-2005 <strong>Water</strong> Demand.xls Page 13 of 14 7/6/2007<br />
Incoming<br />
(mgd)
Permit<br />
No.<br />
Organization<br />
NAICS<br />
Code 1<br />
Metropolitan Council <strong>Industrial</strong> Dischargers <strong>Water</strong> Demand, 2005<br />
Sorted by Business Category and Organization Name<br />
NAICS Description<br />
MCES Business<br />
Category 2<br />
DNR <strong>Use</strong><br />
Code 3<br />
Incoming <strong>Water</strong><br />
Type<br />
Incoming (Gal) Sewered (Gal)<br />
0615 Metro Transit 485113 Bus and Other Motor Vehicle Transit Systems Transportation 247 CITY 6,902,120 6,124,200 0.0189<br />
0616 Metro Transit 485113 Bus and Other Motor Vehicle Transit Systems Transportation 247 CITY 9,273,928 8,654,023 0.0254<br />
1000 Metropolitan Airports Commission 48819 Other Support Activities <strong>for</strong> Air Transportation Transportation 247 13,487,344 0.0000<br />
0200 Northwest Airlines Inc (MB) 200 48819 Other Support Activities <strong>for</strong> Air Transportation Transportation 247 WELL 216,470,888 286,339,144 0.5931<br />
0050 Northwest Airlines Inc (OB) 334412 Bare Printed Circuit Board Manufacturing Transportation 247 CITY 109,024,592 89,277,556 0.2987<br />
1062 Penske Truck Leasing Co 53212 Truck, Utility Trailer, and RV (Recreational Vehicle) Rental and Leasing Transportation 247 CITY 804,000 804,000 0.0022<br />
0975 Servisair & Shell Fuel Services 48819 Other Support Activities <strong>for</strong> Air Transportation Transportation 247 CITY,OTHER 2,460,688 2,460,688 0.0067<br />
1316 South St Paul Truck Wash 562998 All Other Miscellaneous Waste Management Services Transportation 247 CITY 7,050,000 7,050,000 0.0193<br />
0003 The BNSF Railway Co 482111 Line-Haul Railroads Transportation 247 CITY,OTHER 24,321,000 9,684,900 0.0666<br />
0979 Upper River Services Inc 483211 Inland <strong>Water</strong> Freight Transportation Transportation 247 WELL,OTHER 1,261,300 1,199,650 0.0035<br />
0015 Upper River Services Inc 483211 Inland <strong>Water</strong> Freight Transportation Transportation 247 OTHER 4,483,509 4,178,130 0.0123<br />
1320 Wayne Transports Inc Transportation 247 CITY,WELL 10,751,662 10,751,662 0.0295<br />
0887 City of Apple Valley (0887) 22131 <strong>Water</strong> Supply and Irrigation Systems Utilities 211 WELL 4,679,914,000 4,786,600 12.8217<br />
1222 City of Champlin (1222) 22131 <strong>Water</strong> Supply and Irrigation Systems Utilities 211 WELL 4,738,640,000 11,650,800 12.9826<br />
0985 City of Eagan (0985) 22131 <strong>Water</strong> Supply and Irrigation Systems Utilities 211 CITY 18,951,018,000 63,936,000 51.9206<br />
0984 City of Edina (0984) 22131 <strong>Water</strong> Supply and Irrigation Systems Utilities 211 CITY 3,342,954,000 11,691,600 9.1588<br />
0852 City of Fridley (0852) 22131 <strong>Water</strong> Supply and Irrigation Systems Utilities 211 WELL 1,204,423,000 12,664,975 3.2998<br />
0959 City of New Brighton (0959) 22131 <strong>Water</strong> Supply and Irrigation Systems Utilities 211 WELL 10,491,344,000 53,768,000 28.7434<br />
1006 City of Orono (1006) 22131 <strong>Water</strong> Supply and Irrigation Systems Utilities 211 WELL 280,296,000 2,241,600 0.7679<br />
0709 City of St Louis Park (0709) 22131 <strong>Water</strong> Supply and Irrigation Systems Utilities 211 WELL 2,229,384,000 2,403,000 6.1079<br />
1016 City of St Louis Park (1016) 22131 <strong>Water</strong> Supply and Irrigation Systems Utilities 211 WELL 114,877,340 348,000 0.3147<br />
1172 Foster Wheeler Twin Cities Inc 61131 Colleges, Universities, and Professional Schools Utilities 211 CITY 50,976,000 26,502,000 0.1397<br />
0922 Minneapolis <strong>Water</strong> Works 22131 <strong>Water</strong> Supply and Irrigation Systems Utilities 211 OTHER 22,618,000,000 1,639,500 61.9671<br />
0018 Robbinsdale 22131 <strong>Water</strong> Supply and Irrigation Systems Utilities 211 CITY 4,510,000 4,510,000 0.0124<br />
0576 NSP, dba Xcel Energy (0576) 221112 Fossil Fuel Electric Power Generation Utilities-Power 229 CITY,WELL 322,278,339 73,429,761 0.8830<br />
0824 NSP, dba Xcel Energy (0824) 221112 Fossil Fuel Electric Power Generation Utilities-Power 229 CITY 1,098,149 456,420 0.0030<br />
1324 St Paul Cogeneration LLC Utilities-Power 229 CITY,WELL 265,064,032 92,240,086 0.7262<br />
0770 Covanta Hennepin Energy Resource Co LP 562213 Solid Waste Combustors and Incinerators Utilities-Steam&AirCond 230 CITY 1,220,870,232 16,816,812 3.3448<br />
0474 District Energy St Paul Inc 22133 Steam and Air-Conditioning Supply Utilities-Steam&AirCond 230 CITY 99,472,496 13,422,776 0.2725<br />
1057 Foster Wheeler Twin Cities Inc 22133 Steam and Air-Conditioning Supply Utilities-Steam&AirCond 230 CITY 19,138,000 13,126,000 0.0524<br />
1236 Hennepin County Energy Center 22133 Steam and Air-Conditioning Supply Utilities-Steam&AirCond 230 CITY 44,004,029 10,327,341 0.1206<br />
1241 NRG Energy Center Minneapolis LLC 22133 Steam and Air-Conditioning Supply Utilities-Steam&AirCond 230 CITY 8,387,806 1,591,125 0.0230<br />
0900 NRG Energy Center Minneapolis LLC 22133 Steam and Air-Conditioning Supply Utilities-Steam&AirCond 230 CITY 16,460,068 2,136,750 0.0451<br />
1240 NRG Energy Center Minneapolis LLC 22133 Steam and Air-Conditioning Supply Utilities-Steam&AirCond 230 CITY 20,381,591 4,708,391 0.0558<br />
0603 NRG Energy Center Minneapolis LLC 22133 Steam and Air-Conditioning Supply Utilities-Steam&AirCond 230 CITY,WELL 150,910,825 39,227,540 0.4135<br />
1 North American Industry Classification System (NAICS) code system category <strong>for</strong> each industrial discharger<br />
2 Business or industry categories established by Metropolit Council Environmental Services<br />
3<br />
<strong>Water</strong> use code established by Minnesota DNR and assigned to MCES <strong>Industrial</strong> Discharge permittees to view both databases under one classification system<br />
*Incoming water (gallons) reported to MCES with permit in<strong>for</strong>mation was different than reported in the Industry <strong>Water</strong> <strong>Use</strong> Survey conducted <strong>for</strong> the <strong>Recycling</strong> <strong>Treated</strong> <strong>Municipal</strong> <strong>Wastewater</strong> <strong>for</strong> <strong>Industrial</strong> <strong>Water</strong> <strong>Use</strong> project.<br />
This table lists the value reported in the survey, which in some cases is not consistent with the value recorded <strong>for</strong> "Sewered". Further use of the in<strong>for</strong>mation should be verified with the industry and MCES.<br />
II-1_App E_MCES IU Data-2005 <strong>Water</strong> Demand.xls Page 14 of 14 7/6/2007<br />
Incoming<br />
(mgd)
Metropolitan Council<br />
<strong>Recycling</strong> <strong>Treated</strong> <strong>Municipal</strong><br />
<strong>Wastewater</strong> <strong>for</strong> <strong>Industrial</strong> <strong>Water</strong> <strong>Use</strong><br />
LCMR05-07d<br />
MCES Project Number 070186<br />
TECHNICAL MEMORANDUM 2<br />
Sampling Plan and Results<br />
June 30, 2007<br />
Craddock Consulting Engineers<br />
In Association with<br />
CDM and James Crook
Craddock Consulting Engineers 1<br />
In Association with CDM & James Crook<br />
TM2-Sampling_0707.doc<br />
Technical Memorandum 2<br />
Sampling Plan and Results<br />
1.0 Introduction<br />
This technical memorandum is the second in a series of memoranda developed under<br />
a Metropolitan Council (Council) project titled “<strong>Recycling</strong> <strong>Treated</strong> <strong>Municipal</strong><br />
<strong>Wastewater</strong> <strong>for</strong> <strong>Industrial</strong> <strong>Water</strong> <strong>Use</strong>.” Funding <strong>for</strong> this project was recommended by<br />
the Legislative Commission on Minnesota Resources (LCMR) from the Minnesota<br />
Environment and Natural Resources Trust Fund. The Council is providing additional<br />
funding <strong>for</strong> the project through in-kind contributions of staff time. Other state<br />
agencies are participating via stakeholder meetings and technical review and input.<br />
The project proposal to LCMR included the provision <strong>for</strong> the sampling of Council<br />
WWTPs if early project tasks determined that additional in<strong>for</strong>mation was needed.<br />
Following completion of Task 1 of the project in June 2006, it was decided that the<br />
project would benefit from a better characterization of water quality constituents of<br />
concern applicable to a range of industries. This memorandum documents the<br />
sampling plan and the results.<br />
1.1 Objectives<br />
The goal of the sampling program was to define the concentrations of constituents of<br />
concern <strong>for</strong> industrial water use practices that are the more dominant uses of water in<br />
the state of Minnesota and <strong>for</strong> which use of reclaimed water is more likely. The<br />
sampling program targeted constituents that are not typically monitored in WWTP<br />
effluent.<br />
1.2 Constituents of Concern<br />
The historic water quality record of WWTP effluent is extensive <strong>for</strong> constituents of<br />
concern to the receiving waters. These constituents include carbonaceous or total<br />
biochemical oxygen demand (CBOD, TBOD, or BOD), total suspended solids (TSS),<br />
ammonia (NH3), total phosphorus (TP), and fecal coli<strong>for</strong>m. These parameters are also<br />
important in characterizing the effluent quality and applicability <strong>for</strong> industrial use.<br />
However, there are many other constituents of concern <strong>for</strong> industrial applications and<br />
the majority of these are not commonly characterized in municipal WWTP effluent.<br />
Additional sampling is needed to accurately define the concentrations of these<br />
constituents in the WWTP effluent.<br />
The industrial demand analysis of Technical Memorandum 1 of this project, titled<br />
“Implementation Issues and Customer Inventory”, identified the major uses of water<br />
by industries in Minnesota and in more detail <strong>for</strong> the Minneapolis/St. Paul<br />
metropolitan area (metro area). One significant use of water in Minnesota is <strong>for</strong><br />
cooling at power generation facilities and <strong>for</strong> other industrial processes. <strong>Use</strong> of<br />
reclaimed water <strong>for</strong> cooling water is common in states with established wastewater
TM2: Sampling Plan and Results<br />
<strong>Recycling</strong> <strong>Treated</strong> <strong>Municipal</strong> <strong>Wastewater</strong> <strong>for</strong> <strong>Industrial</strong> <strong>Water</strong> <strong>Use</strong><br />
reuse practices. The use of the Mankato WWTP treated effluent <strong>for</strong> cooling water use<br />
at the new Mankato Energy Center facility demonstrates that this practice has strong<br />
potential in Minnesota.<br />
In addition to constituents of concern <strong>for</strong> cooling water, other constituents will be<br />
analyzed <strong>for</strong> boiler feed water use, and other industrial categories, such as pulp &<br />
paper (indicative of requirements <strong>for</strong> paper and print production, a significant water<br />
use in the metro area), general chemical processing, and materials production<br />
(cement). Table 1 lists cooling water and industrial process water quality<br />
requirements <strong>for</strong> several industries.<br />
1.3 Study Boundaries<br />
The work program contained in the Agreement between the LCMR and Met Council<br />
limited the sampling program to Council facilities. With eight facilities of varying<br />
sizes, ground and surface community water supplies, a range of industrial<br />
dischargers, and different treatment processes, the sampling results will provide a<br />
range of values that can generally be applied across the state.<br />
The effluent quality of a municipal WWTP is affected by many factors, including: the<br />
source water used by the community; industrial, commercial and domestic discharges<br />
to the WWTP; and the wastewater treatment processes (and recycles) of the WWTP.<br />
The range of concentrations <strong>for</strong> the constituents listed in Table 1 is expected to vary<br />
significantly over the state or even <strong>for</strong> WWTPs of communities using the same water<br />
supply. It is critical that a specific WWTP effluent be analyzed <strong>for</strong> the constituents of<br />
concern <strong>for</strong> each industry considering use of that reclaimed water supply.<br />
While the sampling results of one facility can not be assumed directly <strong>for</strong> another<br />
facility, a potential range of concentrations can be assumed. A better understanding of<br />
variability in WWTP effluent quality <strong>for</strong> different plants will assist in determining the<br />
applicability of reclaimed water <strong>for</strong> a specific industry at a specific plant. The results<br />
can also help to identify where more sampling is required and can streamline<br />
additional sampling ef<strong>for</strong>ts.<br />
2.0 Sampling Plan<br />
2.1 Constituents of Concern<br />
The constituents selected <strong>for</strong> the sampling program include those identified as a<br />
concern <strong>for</strong> general water uses or industry categories, as listed in Table 1, plus<br />
constituents that are anticipated to be regulated through a permit. The state of<br />
Minnesota uses the Cali<strong>for</strong>nia <strong>Water</strong> <strong>Recycling</strong> Criteria <strong>for</strong> its regulatory review of<br />
water reuse practices, which includes limits <strong>for</strong> pathogens, organics, and solids. Total<br />
coli<strong>for</strong>ms are the only regulated constituent <strong>for</strong> industrial water uses in the Cali<strong>for</strong>nia<br />
<strong>Water</strong> <strong>Recycling</strong> Criteria. Table 2 lists all the constituents included <strong>for</strong> this sampling<br />
program.<br />
2 Craddock Consulting Engineers<br />
In Association with CDM & James Crook<br />
TM2-Sampling_0707.doc
Table 1. Generalized <strong>Water</strong> Quality Criteria <strong>for</strong> Select <strong>Industrial</strong> <strong>Use</strong>s<br />
Cooling <strong>Water</strong> Boiler Feed <strong>Water</strong> Pulp & Paper<br />
Petrochem Textiles<br />
(Makeup <strong>for</strong><br />
Medium High<br />
Pulp & Chemical<br />
& Coal<br />
Scouring, Cement<br />
Recirculating Low Pressure Pressure (150- Pressure Mechanical Chemical, Paper,<br />
Sizing Bleach &<br />
Constituent (in mg/L)<br />
Systems)* (700 psig) Piping Unbleached Bleached<br />
Suspension Dye<br />
Alkalinity (as CaCO3) 20-350 350 100 40 -- -- -- 125 -- -- -- 400<br />
Aluminum (Al) 0.1 5 0.1 0.01 -- -- -- -- -- -- -- --<br />
Calcium (Ca) 50 -- 0.4 0.01 -- 20 20 70 75 -- -- --<br />
Chemical Oxygen Demand (COD) 45 5 5 1 -- -- -- -- -- -- -- --<br />
Chloride (Cl) 100-500 -- -- -- 1,000 200 200 500 300 -- -- 250<br />
Color (units) -- 30 30 10 20 25 5 5 --<br />
Copper (Cu) -- 0.5 0.05 0.05 -- -- -- -- 0.05 0.01 -- --<br />
Dissolved Oxygen (DO) -- 2.5 0.007 0.007 -- -- -- -- -- -- -- --<br />
Iron (Fe) 0.5 1 0.3 0.05 0.3 1 0.1 0.1 1 0.3 0.1 2.5<br />
Hardness (as CaCO3) 130-650 350 1 0.07 -- 100 100 250 350 25 25 --<br />
Bicarbonate (HCO3) 25-200 170 120 48 -- -- -- 130 450 -- -- --<br />
Magnesium (Mg) -- -- 0.25 0.01 -- 12 12 20 30 -- -- --<br />
Manganese (Mn) 0.5 0.3 0.1 0.01 0.1 0.5 0.05 0.1 -- 0.05 0.01 0.5<br />
Ammonia (NH3) 24 0.1 0.1 0.1 -- -- -- -- 40 -- -- --<br />
Nitrate (NO3) -- -- -- -- -- -- -- 5 10 -- -- --<br />
Phosphorus (total: TP) 1 -- -- -- -- -- -- -- -- -- -- -pH<br />
(units) -- -- -- -- 6 – 10 6 – 10 6 – 10 5.5-9.0 6 – 9 -- -- 6.5 – 8.5<br />
Silicondioxide (SiO2) 50 30 10 0.7 -- 50 50 50 60 -- -- 35<br />
Sulfate (SO4) 200 -- -- -- -- -- -- 100 600 -- -- 250<br />
Total Dissolved Solids (TDS) 500 700 500 200 -- -- -- 1,000 1,000 100 100 600<br />
Total Suspended Solids (TSS) 100 10 5 0.5 -- 10 10 5 10 5 5 500<br />
Zinc (Zn) -- -- 0.01 0.01 -- -- -- -- -- -- -- --<br />
*Maximum of value range refers to concentration in final cooling stream discharge.<br />
Source: Adapted from <strong>Water</strong> Pollution Control Federation, 1989; Goldstein et al, 1970; Metcalf & Eddy, 2007.
TM2: Sampling Plan and Results<br />
<strong>Recycling</strong> <strong>Treated</strong> <strong>Municipal</strong> <strong>Wastewater</strong> <strong>for</strong> <strong>Industrial</strong> <strong>Water</strong> <strong>Use</strong><br />
As shown in Table 2, there are several constituents that are routinely analyzed by<br />
Council, typically as part of their NPDES Permit requirements. The sampling<br />
program funded under this project included only those constituents not routinely<br />
sampled at each WWTP, listed in Table 3.<br />
Table 2. Constituents to Characterize in Sampling Program<br />
Constituent Unit<br />
Alkalinity (as CaCO3) mg/L<br />
Aluminum (Al) mg/L<br />
Calcium (Ca) mg/L<br />
Routinely<br />
Sampled<br />
(x=yes)<br />
Carbonaceous Biochemical Oxygen Demand<br />
(CBOD) mg/L X<br />
Chemical Oxygen Demand (COD) mg/L X<br />
Chloride (Cl) mg/L<br />
Color units<br />
Dissolved Oxygen (DO) mg/L X<br />
E. Coli -<br />
Fecal Coli<strong>for</strong>m No./100 ml X<br />
Iron (Fe) mg/L<br />
Hardness (as CaCO3) mg/L<br />
Bicarbonate (HCO3) mg/L<br />
Magnesium (Mg) mg/L<br />
Manganese (Mn) mg/L<br />
Ammonia (NH3) mg/L X<br />
Nitrate (NO3) mg/L X<br />
Orthophosphate (PO4) mg/L X<br />
Phosphorus (total: TP) mg/L X<br />
pH units X<br />
Silicon Dioxide (SiO2) mg/L<br />
Sulfate (SO4) mg/L<br />
Total Coli<strong>for</strong>m No./100 ml<br />
Total Dissolved Solids (TDS) mg/L<br />
Total Organic Carbon (TOC) mg/L<br />
Total Suspended Solids (TSS) mg/L X<br />
Turbidity NTU<br />
4 Craddock Consulting Engineers<br />
In Association with CDM & James Crook<br />
TM2-Sampling_0707.doc
TM2: Sampling Plan and Results<br />
<strong>Recycling</strong> <strong>Treated</strong> <strong>Municipal</strong> <strong>Wastewater</strong> <strong>for</strong> <strong>Industrial</strong> <strong>Water</strong> <strong>Use</strong><br />
Craddock Consulting Engineers 5<br />
In Association with CDM & James Crook<br />
TM2-Sampling_0707.doc<br />
Table 3. Sampling Program Constituents<br />
Alkalinity (as CaCO3)<br />
Aluminum (Al)<br />
Bicarbonate (HCO3)<br />
Calcium (Ca)<br />
Chloride (Cl)<br />
Color<br />
E. Coli<br />
Iron (Fe)<br />
Hardness (as CaCO3)<br />
Magnesium (Mg)<br />
Manganese (Mn)<br />
Silicondioxide (SiO2)<br />
Sulfate (SO4)<br />
Total Coli<strong>for</strong>m<br />
Total Dissolved Solids (TDS)<br />
Total Organic Carbon (TOC)<br />
Turbidity<br />
2.2 Sample Type, Collection, and Location<br />
The Council handled all sampling and laboratory analyses. Samples were collected at<br />
the same location used to characterize the final effluent <strong>for</strong> permit monitoring. The<br />
routinely collected daily sample at the Metro Plant was used <strong>for</strong> this project’s<br />
sampling program. An additional sampler was required at the other three plants<br />
because there is an insufficient sample volume routinely collected at those facilities<br />
<strong>for</strong> the additional analyses required by this sampling program. The samplers collected<br />
flow-weighted 24-hour composite samples, except at the Empire WWTP, which<br />
provided a time-weighted composite sample. The Council’s <strong>Industrial</strong> Waste<br />
department staff setup and managed the sampler operation. Operators at each plant<br />
collected this program’s samples at the same time as they collected the routine<br />
effluent samples.<br />
The first sampling period included 8-15 samples collected over a three week period in<br />
late October to early November. Samples were collected on weekdays and weekends<br />
whenever routine samples were collected. After review of the Fall 2006 results it was<br />
determined that additional sampling would strengthen confidence in understanding<br />
constituent variability. A spring sampling schedule was per<strong>for</strong>med: during the first<br />
three weeks of April, 8-12 samples were analyzed <strong>for</strong> the constituents listed in Table 3.<br />
All available data <strong>for</strong> the routine monitoring program were obtained <strong>for</strong> the similar<br />
time periods. The sample count varied with each plant based on the NPDES permit<br />
requirements.
TM2: Sampling Plan and Results<br />
<strong>Recycling</strong> <strong>Treated</strong> <strong>Municipal</strong> <strong>Wastewater</strong> <strong>for</strong> <strong>Industrial</strong> <strong>Water</strong> <strong>Use</strong><br />
Samples were collected at four Council WWTPs:<br />
Blue Lake<br />
Empire<br />
Metropolitan<br />
Seneca<br />
3.0 Sampling Results<br />
The sampling program developed <strong>for</strong> this project provided an initial base of<br />
in<strong>for</strong>mation that was used <strong>for</strong> various tasks in the project, including:<br />
general characterizations of effluent water quality <strong>for</strong> Minnesota WWTPs<br />
plant-specific in<strong>for</strong>mation to compare the effluent quality of the Council’s four<br />
largest WWTPs<br />
This technical memorandum serves to document the data and provide summary<br />
in<strong>for</strong>mation on the effluent quality of the four Council WWTPs evaluated.<br />
3.1 General Summary<br />
The constituents analyzed in this project’s sampling program, indicate that hardness<br />
and salt concentrations occur at concentration thresholds of concern <strong>for</strong> a range of<br />
industrial water uses. Similar to the results of Technical Memorandum 5, <strong>Wastewater</strong><br />
Treatment Plant Effluent Quality, which reviewed general water quality parameters <strong>for</strong><br />
all of Minnesota’s WWTPs, the NPDES permitted constituents <strong>for</strong> the four WWTPs<br />
were well below required limits and had low variability in the samples measured.<br />
Table 4 provides the mean and standard deviation of the samples collected <strong>for</strong> the Fall<br />
2006 and Spring 2007 sampling periods. The recommended limits <strong>for</strong> each constituent<br />
as it relates to cooling water uses, is provided in the third column. Exhibit A provides<br />
additional statistics <strong>for</strong> this table, such as minimum and maximum values, and the<br />
number of samples the statistics are based upon. It also contains recommended limits<br />
<strong>for</strong> various industrial water uses in a <strong>for</strong>mat similar to Table 4. Exhibits B-D provide<br />
data <strong>for</strong> each WWTP.<br />
The Fall 2006 sampling data were evaluated with time series plots to look <strong>for</strong> any<br />
outliers and see if any trends existed. Given that this is a small data set (8-28 samples),<br />
this ef<strong>for</strong>t was used more to screen and identify any gross trends. Additional data will<br />
need to be reviewed over a longer period of time to define any trends.<br />
6 Craddock Consulting Engineers<br />
In Association with CDM & James Crook<br />
TM2-Sampling_0707.doc
Table 4. <strong>Wastewater</strong> <strong>Recycling</strong> Sampling Program Summary Results 1<br />
Constituent Unit Limit 2<br />
Alkalinity (as CaCO3) mg/L 20-350<br />
Mean St Dev 3<br />
Mean St Dev Mean St Dev Mean St Dev<br />
293 10 246 20 157 15 184 14<br />
Aluminum (Al) mg/L 0.1 0.022 0.008 0.023 0.006 0.030 0.004 0.024 0.002<br />
Ammonia (NH3) mg/L 24 0.182 0.068 0.2 0.3 0.216 0.34 0.117 0.110<br />
Bicarbonate (HCO 3)<br />
mg/L as<br />
CaCO 3<br />
25-200<br />
300 8 256 31 157 20 182 6<br />
Calcium (Ca) mg/L 50 93.2 3.8 82.2 4.5 72.2 4.4 62.9 5.3<br />
Carbonaceous Biochemical<br />
Oxygen Demand (CBOD) mg/L
TM2: Sampling Plan and Results<br />
<strong>Recycling</strong> <strong>Treated</strong> <strong>Municipal</strong> <strong>Wastewater</strong> <strong>for</strong> <strong>Industrial</strong> <strong>Water</strong> <strong>Use</strong><br />
3.2 Specific Constituents of Concern<br />
Constituents exceeding the recommended limits <strong>for</strong> cooling water use or higher water<br />
quality uses were evaluated in more detail. The mean and standard deviation <strong>for</strong> the<br />
following constituents are summarized in Figures 1-8 at the end of the memorandum:<br />
Alkalinity<br />
Bicarbonate<br />
Calcium<br />
Chloride<br />
Hardness<br />
Silica<br />
Sulfate<br />
TDS<br />
Lower hardness, alkalinity, calcium and bicarbonate concentrations would be<br />
expected <strong>for</strong> softer source water areas. A large percentage of the Metropolitan<br />
WWTP’s service area is provided lime softened water by Minneapolis and St. Paul.<br />
The City of Bloomington has a lime softened water supply and contributes to a<br />
significant portion of the Seneca WWTP’s influent. The Seneca WWTP also had lower<br />
average values <strong>for</strong> constituents characterizing hardness, as shown in Figures 1-4.<br />
High WWTP effluent chloride concentrations often occur in areas with hard source<br />
water because of the increased loadings to the WWTP from the brine discharges of<br />
domestic water softeners or the concentrate streams from commercial or industrial<br />
softening systems. Figure 5 indicates this inference applies to the Council facilities<br />
evaluated. The Metro WWTP chloride concentration averaged 240 mg/L and never<br />
exceeded 265 mg/L. The Seneca WWTP had chloride concentrations averaging<br />
around 300 mg/L. The Empire and Blue Lake WWTP chloride concentrations<br />
averaged nearly 400 mg/L and had a wider range of variability.<br />
All four WWTPs exceed chloride concentrations required <strong>for</strong> cooling water with<br />
systems recycling water more than 2 times. At concentrations greater than 500 mg/L<br />
there is concern with corrosion. This threshold will vary with materials of<br />
construction, and is referenced <strong>for</strong> 316 stainless steel condenser tubes (personal<br />
communication with D. Taylor, Great River Energy).<br />
Chloride concentration in WWTP effluent has also been linked to the influence of<br />
infiltration and inflow (I&I) and chlorides imparted from road salt. The City of<br />
Oconomowoc, Wisconsin has monitored chlorides <strong>for</strong> ten years and found evidence of<br />
significant chloride contributions from chloride in soil below roadbeds that<br />
accumulated from road salting (personal communications with Tom Steinbach, City<br />
of Oconomowoc). The longer-term monitoring indicated that the highly variable<br />
loadings of chlorides can be inaccurately characterized with limited sampling (e.g.<br />
one sample each quarter).<br />
8 Craddock Consulting Engineers<br />
In Association with CDM & James Crook<br />
TM2-Sampling_0707.doc
TM2: Sampling Plan and Results<br />
<strong>Recycling</strong> <strong>Treated</strong> <strong>Municipal</strong> <strong>Wastewater</strong> <strong>for</strong> <strong>Industrial</strong> <strong>Water</strong> <strong>Use</strong><br />
Craddock Consulting Engineers 9<br />
In Association with CDM & James Crook<br />
TM2-Sampling_0707.doc<br />
Total dissolved solids (TDS) concentrations, which often follow chloride<br />
concentrations, did not have as extreme a difference between the WWTPs, as shown<br />
in Figure 6. The Metro WWTP was the lowest and had fairly low variability,<br />
averaging 800 mg/L of TDS. The Seneca WWTP had the highest average<br />
concentration with a high variability (no outliers were removed), averaging over 1,300<br />
mg/L. The Blue Lake and Empire WWTPs averaged around 1,100 mg/L and the<br />
Metro WWTP was the lowest at 800 mg/L. All the facilities exceed recommended<br />
limits <strong>for</strong> a variety of industrial water uses. TDS concentrations over 1,000 mg/L are<br />
also not recommended <strong>for</strong> some irrigation practices, which includes landscape<br />
irrigation by an industry. If multiple-use options are considered and urban or<br />
agricultural irrigation is integrated with an industrial reuse system, a more detailed<br />
analysis of the dissolved solids would be required.<br />
Silica concentrations averaged about 20 mg/L <strong>for</strong> all the facilities. These were<br />
acceptable levels <strong>for</strong> cooling water uses, but other uses, as <strong>for</strong> boiler feed water,<br />
would require silica removal to meet levels below 1 mg/L. Sulfate was not a concern<br />
at any of the plants except Seneca. The sulfate concentrations were highly variable,<br />
averaging 375 mg/L with a standard deviation of 200 mg/L. The implications of high<br />
sulfates would depend on the application <strong>for</strong> cooling water and could affect the<br />
treatment process selection. It is also a constituent that could be controlled at the<br />
WWTP or through source control if there is a known industrial contributor.<br />
3.3 Results Summary and Next Steps<br />
The sampling program initiated by this study provides a basis <strong>for</strong> the Council to<br />
consider a more routine sampling program <strong>for</strong> constituents that are poorly<br />
characterized in their WWTP effluent. It also provides in<strong>for</strong>mation to other facilities<br />
that are considering wastewater recycling applications, particularly the parameters<br />
they should target.<br />
The sampling results demonstrated how the Metropolitan WWTP’s larger size<br />
dampens the variability. The standard deviations <strong>for</strong> most constituents were the<br />
lowest at the Metropolitan Plant. The concentrations of the constituents documented<br />
in Section 3.2 were also the lowest at the Metropolitan WWTP. This was likely a<br />
function of the source water (softened) and also the ability to dampen any industry or<br />
other specific discharges with more consistent quality sources.<br />
It is recommended that additional data review and coordination with specific<br />
industries be conducted to establish a shorter list of parameters and identify those<br />
needing more samples to characterize variability. Incorporation of constituents of<br />
concern <strong>for</strong> potential treatment technologies should also be included in future<br />
sampling programs. For example, membrane modeling and pilot studies rely on<br />
specific ions as limiting factors to measure membrane per<strong>for</strong>mance. These dissolved<br />
ions may not be considered a concern <strong>for</strong> the industry, but are important in assessing<br />
treatment options.
TM2: Sampling Plan and Results<br />
<strong>Recycling</strong> <strong>Treated</strong> <strong>Municipal</strong> <strong>Wastewater</strong> <strong>for</strong> <strong>Industrial</strong> <strong>Water</strong> <strong>Use</strong><br />
The variability in the approximately 25 samples analyzed <strong>for</strong> each plant in this study<br />
indicates that additional sampling is warranted. At a minimum, chloride and TDS<br />
should be monitored, with a frequency of twice a week or more. These constituents<br />
have a higher variability at each plant than most constituents and are important<br />
parameters in assessing the application <strong>for</strong> a variety of water uses, as well as<br />
membrane system sizing. The WWTP effluent sampling program can add other<br />
parameters once more defined goals are in place on the potential uses of reclaimed<br />
water and the treatment technologies under consideration.<br />
10 Craddock Consulting Engineers<br />
In Association with CDM & James Crook<br />
TM2-Sampling_0707.doc
TM2: Sampling Plan and Results<br />
<strong>Recycling</strong> <strong>Treated</strong> <strong>Municipal</strong> <strong>Wastewater</strong> <strong>for</strong> <strong>Industrial</strong> <strong>Water</strong> <strong>Use</strong><br />
Craddock Consulting Engineers 11<br />
In Association with CDM & James Crook<br />
TM2-Sampling_0707.doc<br />
Alkalinity, mg/L as CaCO3<br />
Hardness, mg/L as CaCO3<br />
350<br />
300<br />
250<br />
200<br />
150<br />
100<br />
380<br />
360<br />
340<br />
320<br />
300<br />
280<br />
260<br />
240<br />
220<br />
200<br />
Error bars represent one standard deviation<br />
Blue Lake Empire Metro Seneca<br />
Figure 1. Average Alkalinity Concentration<br />
Error bars represent one standard deviation<br />
Blue Lake Empire Metro Seneca<br />
Figure 2. Average Hardness Concentration
TM2: Sampling Plan and Results<br />
<strong>Recycling</strong> <strong>Treated</strong> <strong>Municipal</strong> <strong>Wastewater</strong> <strong>for</strong> <strong>Industrial</strong> <strong>Water</strong> <strong>Use</strong><br />
Calcium, mg/L<br />
Bicarbonate, mg/L as CaCO3<br />
100.0<br />
90.0<br />
80.0<br />
70.0<br />
60.0<br />
50.0<br />
350<br />
300<br />
250<br />
200<br />
150<br />
100<br />
Error bars represent one standard deviation<br />
Blue Lake Empire Metro Seneca<br />
Figure 3. Average Calcium Concentration<br />
Error bars represent one standard deviation<br />
Blue Lake Empire Metro Seneca<br />
Figure 4. Average Bicarbonate Concentration<br />
12 Craddock Consulting Engineers<br />
In Association with CDM & James Crook<br />
TM2-Sampling_0707.doc
TM2: Sampling Plan and Results<br />
<strong>Recycling</strong> <strong>Treated</strong> <strong>Municipal</strong> <strong>Wastewater</strong> <strong>for</strong> <strong>Industrial</strong> <strong>Water</strong> <strong>Use</strong><br />
Craddock Consulting Engineers 13<br />
In Association with CDM & James Crook<br />
TM2-Sampling_0707.doc<br />
Chloride, mg/L<br />
Total Dissolved Solids, mg/L<br />
450<br />
400<br />
350<br />
300<br />
250<br />
200<br />
1800<br />
1600<br />
1400<br />
1200<br />
1000<br />
800<br />
600<br />
Error bars represent one standard deviation<br />
Blue Lake Empire Metro Seneca<br />
Figure 5. Average Chloride Concentration<br />
Error bars represent one standard deviation<br />
Blue Lake Empire Metro Seneca<br />
Figure 6. Average Total Dissolved Solids Concentration
TM2: Sampling Plan and Results<br />
<strong>Recycling</strong> <strong>Treated</strong> <strong>Municipal</strong> <strong>Wastewater</strong> <strong>for</strong> <strong>Industrial</strong> <strong>Water</strong> <strong>Use</strong><br />
Sulfate, mg/L<br />
Silica, mg/L<br />
25<br />
24<br />
23<br />
22<br />
21<br />
20<br />
19<br />
18<br />
17<br />
16<br />
15<br />
700<br />
600<br />
500<br />
400<br />
300<br />
200<br />
100<br />
0<br />
Error bars represent one standard deviation<br />
Blue Lake Empire Metro Seneca<br />
Figure 7. Average Silica Concentration<br />
Error bars represent one standard deviation<br />
Blue Lake Empire Metro Seneca<br />
Figure 8. Average Sulfate Concentration<br />
14 Craddock Consulting Engineers<br />
In Association with CDM & James Crook<br />
TM2-Sampling_0707.doc
Exhibit A<br />
Summary Results
Recommended Limits <strong>for</strong> Various <strong>Industrial</strong> <strong>Water</strong> <strong>Use</strong>s<br />
Constituent Unit Limit 1 Limit 2 Limit 3 Limit 4 Limit 5 Limit 6 Limit 7 Limit 8 Limit 9<br />
Alkalinity (as CaCO3) mg/L 20-350<br />
Limit 10<br />
Limit 11<br />
Limit 12<br />
350 100 40 * * * 125 * * * 400 20<br />
Aluminum (Al) mg/L 0.1 5 0.1 0.01 * * * * * * * * 0.5<br />
Ammonia (NH3) mg/L 24 0.1 0.1 0.1 * * * * * * * * *<br />
Bicarbonate (HCO 3) mg/L 25-200 170 120 48 * * * 128 * * * * *<br />
Calcium (Ca) mg/L 50 * 0.4 0.01 * 20 20 68 75 * * * *<br />
Carbonaceous Biochemical<br />
Oxygen Demand (CBOD) mg/L * * * * * * * * * * * * *<br />
Chemical Oxygen Demand (COD)<br />
Chloride (Cl)<br />
mg/L * 5 5 1 * * * * * * * * *<br />
mg/L 500 * * * 1000 200 200 500 300 * * 250 2<br />
Color * * * * 30 30 10 20 * 5 5 * *<br />
Copper (Cu) mg/L * * * * * * * * 0.05 0.01 * * *<br />
Dissolved Oxygen (DO) mg/L * 2.5 0.007 0.007 * * * * * * * * *<br />
E. Coli * * * * * * * * * * * * *<br />
Fecal Coli<strong>for</strong>m * * * * * * * * * * * * *<br />
130-<br />
Hardness (as CaCO3) mg/L 650 350 1 0.07 * 100 100 250 350 25 25 * 20<br />
Iron (Fe) mg/L 0.5 1 0.3 0.05 0.3 1 0.1 0.1 1 0.3 0.1 2.5 0.05<br />
Magnesium (Mg) mg/L * * 0.25 0.01 * 12 12 19 30 * * * *<br />
Manganese (Mn) mg/L 0.5 0.3 0.1 0.01 0.1 0.5 0.05 0.1 * 0.05 0.01 0.5 0.01<br />
Nitrate (NO 3) mg/L * * * * * * * 5 * * * * *<br />
Orthophosphate (PO 4) mg/L * * * * * * * * * * * * *<br />
Phosphorus (total: TP) mg/L 1 * * * * * * * * * * * 1<br />
pH * * * * 6-10 6-10 6-10 6.2-8.3 6-9 * * 6.5-8.5 6.5-8.5<br />
Silicondioxide (SiO 2) or Silica mg/L 50 30 10 0.7 * 50 50 50 * * * 35 *<br />
Sulfate (SO 4) mg/L 200 * * * * * * 100 * * * 250 3<br />
Total Coli<strong>for</strong>m * * * * * * * * * * * * *<br />
Total Dissolved Solids (TDS) mg/L 500 700 500 200 * * * 1000 1000 100 100 600 *<br />
Total Organic Carbon (TOC) mg/L * * * * * * * * * * * * 6<br />
Total Suspended Solids (TSS) mg/L 100 10 5 0.5 * 10 10 5 10 5 5 500 0.5<br />
Turbidity * * * * * * * * * * * * *<br />
Zinc (Zn) mg/L * * 0.01 0.01 * * * * * * * * *<br />
2 Cooling <strong>Water</strong> (USEPA, 2004); variable range related to amount of recycling and materials of construction; high range is typically maximum in blowdown/final water<br />
2 <strong>Industrial</strong> Boiler Feed <strong>Water</strong> (low pressure) (Table 2-8, Technical Memorandum "<strong>Recycling</strong> <strong>Treated</strong> <strong>Wastewater</strong> <strong>for</strong> <strong>Industrial</strong> <strong>Water</strong> <strong>Use</strong> in Minneosta: Implementation Issues and Customer Inventory)<br />
3 <strong>Industrial</strong> Boiler Feed <strong>Water</strong> (medium pressure) (Table 2-8, Technical Memorandum "<strong>Recycling</strong> <strong>Treated</strong> <strong>Wastewater</strong> <strong>for</strong> <strong>Industrial</strong> <strong>Water</strong> <strong>Use</strong> in Minneosta: Implementation Issues and Customer Invento<br />
4 <strong>Industrial</strong> Boiler Feed <strong>Water</strong> (high pressure) (Table 2-8, Technical Memorandum "<strong>Recycling</strong> <strong>Treated</strong> <strong>Wastewater</strong> <strong>for</strong> <strong>Industrial</strong> <strong>Water</strong> <strong>Use</strong> in Minneosta: Implementation Issues and Customer Inventory)<br />
5 Pulp & Paper (Mechanical Pulping) (USEPA, 2004)<br />
6 Pulp & Paper (Chemical, Unbleached)(USEPA, 2004)<br />
7 Pulp & Paper (bleached) (USEPA, 2004)<br />
8 Chemical Processing (USEPA, 2004)<br />
9 Petrochem & Coal (USEPA, 2004)<br />
10 Textile (Sizing Suspension) (USEPA, 2004)<br />
11 Textile (Scouring, Bleach & Dye) (USEPA, 2004)<br />
12 Cement (USEPA, 2004)<br />
13 Ethanol process water (personal communications with undisclosed ethanol plant developers)<br />
Reuse Sampling Data Summary_0707-<strong>for</strong> TM2.xls, Limits Page 1 of 1 7/7/2007 1:32 PM<br />
Limit 13
<strong>Wastewater</strong> <strong>Recycling</strong> Sampling Program Summary Results 1<br />
Constituent Unit Limit 2 Limit 3<br />
Mean St Dev 4<br />
Min Max Number Mean St Dev Min Max Number Mean St Dev Min Max Number Mean St Dev Min Max Number<br />
Alkalinity (as CaCO3) mg/L 20-350 40 293 10 274 311 24 246 20 179 274 27 157 15 141 202 29 184 14 169 242 25<br />
Aluminum (Al) mg/L 0.1 0.01 0.022 0.008 0.012 0.051 24 0.023 0.006 0.013 0.034 27 0.030 0.004 0.020 0.037 29 0.024 0.002 0.018 0.028 25<br />
Ammonia (NH3) mg/L 24 0.1 0.182 0.068 0.060 0.330 37 0.2 0.3 0.1 2.0 43 0.216 0.338 0.020 2.320 61 0.117 0.110 0.030 0.620 40<br />
Bicarbonate (HCO 3)<br />
mg/L as<br />
CaCO 3 25-200 48 300 8 272 309 19 256 31 214 367 19 157 20 84 185 19 182 6 174 193 19<br />
Calcium (Ca) mg/L 50 0.01 93.2 3.8 87.3 101.0 24 82.2 4.5 65.4 88.0 27 72.2 4.4 67.2 80.2 29 62.9 5.3 58.5 86.6 25<br />
Carbonaceous Biochemical<br />
Oxygen Demand (CBOD) mg/L * * 3.0 0.0 3.0 3.0 30 3.2 0.9 3.0 8.0 35 3.2 0.5 3.0 5.0 61 3.3 1.4 3.0 11.0 33<br />
Chemical Oxygen Demand (COD) mg/L * 1 34.1 5.1 21.0 48.0 37 37.4 5.0 24.0 52.0 39 32.2 3.4 22.0 39.0 61 34.1 4.4 28.0 48.0 40<br />
Chloride (Cl)<br />
mg/L 500 * 387 34 280 426 24 387 28 295 419 24 239 11 208 262 29 285 27 261 402 24<br />
Color * * 51 7 36 61 12 58 7 47 77 12 45 8 33 62 12 61 13 41 78 12<br />
Copper (Cu) mg/L * * - - - - - - - - - - 5.06 0.45 4.5 5.7 5 - - - - -<br />
Dissolved Oxygen (DO) mg/L * 0.007 8.63 0.43 7.50 10.40 50 8.6 0.5 7.5 10.1 54 5.8 0.9 3.0 8.5 61 8.88 0.55 8.01 10.02 54<br />
E. Coli No./100ml * * 731 572 96 2092 26 7 5 3 22 14 283 349 1 3973 22 57 120 4 548 22<br />
Fecal Coli<strong>for</strong>m No./100ml * * 75 66 7 260 36 15 17 2 54 29 68 80 2 500 54 33 55 2 290 38<br />
Hardness (as CaCO 3)<br />
mg/L as<br />
CaCO 3<br />
130-<br />
650 0.07 351 17 324 384 24 293 16 240 312 27 258 15 242 290 29 243 14 228 302 25<br />
Iron (Fe) mg/L 0.5 0.05 0.076 0.015 0.048 0.100 24 0.105 0.023 0.074 0.192 27 0.068 0.018 0.049 0.150 29 0.133 0.043 0.084 0.256 25<br />
Magnesium (Mg) mg/L * 0.01 35.9 1.8 30.1 39.3 24 27.6 1.3 24.8 29.4 27 24.0 0.6 22.7 25.0 29 25.4 1.2 23.5 29.8 25<br />
Manganese (Mn) mg/L 0.5 0.01 0.015 0.004 0.009 0.027 24 0.038 0.023 0.008 0.097 27 0.016 0.003 0.010 0.023 29 0.035 0.024 0.011 0.094 25<br />
Nitrate (NO 3) mg/L * * 10.97 0.83 8.99 12.6 37 15.8 2.5 11.5 20.3 24 16.4 1.8 11.9 19.0 45 15.9 1.4 14.1 19.2 40<br />
Orthophosphate (PO 4) mg/L * * 0.406 0.289 0.167 1.370 24 0.057 0.125 0.006 0.614 27 0.259 0.197 0.093 0.810 29 0.968 0.801 0.019 3.050 25<br />
Phosphorus (total: TP) mg/L 1 * 0.485 0.164 0.290 0.860 37 0.340 0.109 0.190 0.710 28 0.457 0.246 0.200 1.500 61 1.500 0.855 0.560 3.700 40<br />
pH * * 7.3 0.2 7.0 7.8 50 7.0 0.1 6.6 7.4 54 7.0 0.1 6.7 7.3 59 7.1 0.1 6.5 7.3 54<br />
Silicondioxide (SiO 2) or Silica mg/L 50 0.7 22 2 13 23 24 19 1 16 20 27 17 0 16 18 29 18 2 16 22 25<br />
Sulfate (SO 4) mg/L 200 * 51.1 9.2 39.7 83.1 24 39.8 4.5 23.8 47.1 26 74.7 6.7 63.4 93.8 29 374.3 200.3 39.7 724.2 25<br />
Total Coli<strong>for</strong>m * * 3,496 1,150 2,450 4,920 22 499 721 104 2,450 10 3,798 2,655 1,300 10,000 17 2,491 2,175 106 8,812 18<br />
Total Dissolved Solids (TDS) mg/L 500 200 1,097 80 875 1,260 24 1,130 166 961 1,920 27 805 37 716 907 29 1,326 299 900 1,960 25<br />
Total Organic Carbon (TOC) mg/L * * 8.1 0.7 7.0 10.0 23 9.4 1.0 7.6 11.8 27 8.0 0.6 7.0 9.2 29 8.4 0.7 7.3 9.6 25<br />
Total Suspended Solids (TSS) mg/L 100 0.5 1.7 1.0 1.0 6.0 37 3 2 1 15 43 2.4 0.8 1.0 4.0 61 3.1 1.2 1.0 7.0 40<br />
Turbidity * * 2 0 1 3 24 4 1 1 5 27 2 0 1 3 29 3 1 2 5 25<br />
1<br />
Based on Fall 2006 and Spring 2007 sampling periods; see other Exhibits <strong>for</strong> daily data<br />
2<br />
Cooling <strong>Water</strong> (USEPA, 2004); variable range related to amount of recycling and materials of construction; high range is typically maximum in blowdown/final water<br />
3 <strong>Industrial</strong> Boiler Feed <strong>Water</strong> (high pressure) (Table 2-8, Technical Memorandum "<strong>Recycling</strong> <strong>Treated</strong> <strong>Wastewater</strong> <strong>for</strong> <strong>Industrial</strong> <strong>Water</strong> <strong>Use</strong> in Minneosta: Implementation Issues and Customer Inventory)<br />
4 St Dev = one standard deviation<br />
Blue Lake Empire Metro<br />
Reuse Sampling Data Summary_0707-<strong>for</strong> TM2.xls, Fall 2006 & Spring 2007_<strong>for</strong>ExhA Page 1 of 1 7/7/2007 1:28 PM<br />
Seneca
Exhibit B<br />
Blue Lake WWTP Sampling Results
MCES Blue Lake Plant Final Effluent Sampling Results<br />
<strong>Recycling</strong> <strong>Treated</strong> <strong>Municipal</strong> <strong>Wastewater</strong> <strong>for</strong> <strong>Industrial</strong> <strong>Water</strong> <strong>Use</strong><br />
Date Day of Wk Flow Alkalinity Aluminum Ammonia Bicarbonate Calcium CBOD<br />
mgd mg/L CaCO3 mg/L mg/L mg/L CaCO3 mg/L mg/L<br />
10/8/06 Sunday 25.92 288 0.019 0.26 306 92.9 3<br />
10/9/06 Monday 26.78 286 0.018 0.26 303 90.6
MCES Blue Lake Plant Final Effluent Sampling Results<br />
<strong>Recycling</strong> <strong>Treated</strong> <strong>Municipal</strong> <strong>Wastewater</strong> <strong>for</strong> <strong>Industrial</strong> <strong>Water</strong> <strong>Use</strong><br />
Date Day of Wk Flow Alkalinity Aluminum Ammonia Bicarbonate Calcium CBOD<br />
mgd mg/L CaCO3 mg/L mg/L mg/L CaCO3 mg/L mg/L<br />
4/28/07 Saturday 28.22<br />
4/29/07 Sunday 27.98 0.12 3<br />
4/30/07 Monday 28.63 0.12
Date Day of Wk<br />
MCES Blue Lake Plant Final Effluent Sampling Results<br />
<strong>Recycling</strong> <strong>Treated</strong> <strong>Municipal</strong> <strong>Wastewater</strong> <strong>for</strong> <strong>Industrial</strong> <strong>Water</strong> <strong>Use</strong><br />
10/8/06 Sunday<br />
10/9/06 Monday<br />
10/10/06 Tuesday<br />
10/11/06 Wednesday<br />
10/12/06 Thursday<br />
10/13/06 Friday<br />
10/14/06 Saturday<br />
10/15/06 Sunday<br />
10/16/06 Monday<br />
10/17/06 Tuesday<br />
10/18/06 Wednesday<br />
10/19/06 Thursday<br />
10/20/06 Friday<br />
10/21/06 Saturday<br />
10/22/06 Sunday<br />
10/23/06 Monday<br />
10/24/06 Tuesday<br />
10/25/06 Wednesday<br />
10/26/06 Thursday<br />
10/27/06 Friday<br />
4/1/07 Sunday<br />
4/2/07 Monday<br />
4/3/07 Tuesday<br />
4/4/07 Wednesday<br />
4/5/07 Thursday<br />
4/6/07 Friday<br />
4/7/07 Saturday<br />
4/8/07 Sunday<br />
4/9/07 Monday<br />
4/10/07 Tuesday<br />
4/11/07 Wednesday<br />
4/12/07 Thursday<br />
4/13/07 Friday<br />
4/14/07 Saturday<br />
4/15/07 Sunday<br />
4/16/07 Monday<br />
4/17/07 Tuesday<br />
4/18/07 Wednesday<br />
4/19/07 Thursday<br />
4/20/07 Friday<br />
4/21/07 Saturday<br />
4/22/07 Sunday<br />
4/23/07 Monday<br />
4/24/07 Tuesday<br />
4/25/07 Wednesday<br />
4/26/07 Thursday<br />
4/27/07 Friday<br />
COD<br />
Chloride<br />
ion Color Copper DO E. coli Fecal Coli Hardness<br />
mg/L mg/L units mg/L mg/L mpn/100ml mpn/100ml mg/L CaCO3<br />
34 415 8.2 360<br />
29 410 8.6 38 344<br />
32 407 8.7 38 334<br />
31 419 8.33 66 356<br />
38 426 8.4 1373 92 346<br />
8.8<br />
9<br />
2092 150<br />
25 411 54 7.5 342<br />
31 400 50 8.05 411 48 334<br />
33 397 50 7.96 96 64 332<br />
36 407 61 8.17 35 338<br />
33 405 57 8.3 822 57 346<br />
8.2<br />
8.2<br />
250 30<br />
34 401 56 8.6 342<br />
40 393 53 8.5 122 24 338<br />
26 387 8.7 144 39 324<br />
21 410 8.48 106 33 340<br />
26 409 49 8.5 120 32 346<br />
8.5 311 35<br />
33 8<br />
32 280 36 8.67 230 336<br />
32 8.53 361 50<br />
34 332 9.03 816 130 368<br />
35 350 52 9.1 185 46 384<br />
9.1<br />
8.7<br />
921 160<br />
32 353 8.6 378<br />
48 351 37 8.97 461 77 366<br />
37 9.2 613 150<br />
36 381 52 9.37 1986 240 366<br />
40 10.4 1553 260<br />
9.2<br />
9<br />
921 150<br />
38 375 8.8 372<br />
34 369 8.71 903 48 358<br />
33 8.73 816 69<br />
36 8.74 727 47<br />
33 400 8.83 770 43 377<br />
8.6<br />
8.66<br />
1516 42<br />
36 8.43<br />
30 8.42 613 57<br />
44 8.69 22<br />
37 8.7 29<br />
36 8.58 37<br />
8.61 8<br />
MCES WWTP Effluent Quality_Blue Lake_Fall 2006 & Spring 2007_0707.xls, Blue Lake Data Page 3 of 8
Date Day of Wk<br />
MCES Blue Lake Plant Final Effluent Sampling Results<br />
<strong>Recycling</strong> <strong>Treated</strong> <strong>Municipal</strong> <strong>Wastewater</strong> <strong>for</strong> <strong>Industrial</strong> <strong>Water</strong> <strong>Use</strong><br />
4/28/07 Saturday<br />
4/29/07 Sunday<br />
4/30/07 Monday<br />
Mean<br />
Standard Deviation<br />
Min<br />
Max<br />
No. of Samples<br />
* Not included in statistics<br />
COD<br />
Chloride<br />
ion Color Copper DO E. coli Fecal Coli Hardness<br />
mg/L mg/L units mg/L mg/L<br />
8.55<br />
mpn/100ml mpn/100ml mg/L CaCO3<br />
40 8.43<br />
36 8.54 7<br />
34.08 387.00 50.58 8.63 731 75 351.13<br />
5.10 33.65 7.39 0.43 572 66 16.77<br />
21 280 36 7.5 96 7 324<br />
48 426 61 10.4 2092 260 384<br />
37 24 12 50 26 36 24<br />
MCES WWTP Effluent Quality_Blue Lake_Fall 2006 & Spring 2007_0707.xls, Blue Lake Data Page 4 of 8
Date Day of Wk<br />
MCES Blue Lake Plant Final Effluent Sampling Results<br />
<strong>Recycling</strong> <strong>Treated</strong> <strong>Municipal</strong> <strong>Wastewater</strong> <strong>for</strong> <strong>Industrial</strong> <strong>Water</strong> <strong>Use</strong><br />
10/8/06 Sunday<br />
10/9/06 Monday<br />
10/10/06 Tuesday<br />
10/11/06 Wednesday<br />
10/12/06 Thursday<br />
10/13/06 Friday<br />
10/14/06 Saturday<br />
10/15/06 Sunday<br />
10/16/06 Monday<br />
10/17/06 Tuesday<br />
10/18/06 Wednesday<br />
10/19/06 Thursday<br />
10/20/06 Friday<br />
10/21/06 Saturday<br />
10/22/06 Sunday<br />
10/23/06 Monday<br />
10/24/06 Tuesday<br />
10/25/06 Wednesday<br />
10/26/06 Thursday<br />
10/27/06 Friday<br />
4/1/07 Sunday<br />
4/2/07 Monday<br />
4/3/07 Tuesday<br />
4/4/07 Wednesday<br />
4/5/07 Thursday<br />
4/6/07 Friday<br />
4/7/07 Saturday<br />
4/8/07 Sunday<br />
4/9/07 Monday<br />
4/10/07 Tuesday<br />
4/11/07 Wednesday<br />
4/12/07 Thursday<br />
4/13/07 Friday<br />
4/14/07 Saturday<br />
4/15/07 Sunday<br />
4/16/07 Monday<br />
4/17/07 Tuesday<br />
4/18/07 Wednesday<br />
4/19/07 Thursday<br />
4/20/07 Friday<br />
4/21/07 Saturday<br />
4/22/07 Sunday<br />
4/23/07 Monday<br />
4/24/07 Tuesday<br />
4/25/07 Wednesday<br />
4/26/07 Thursday<br />
4/27/07 Friday<br />
Iron Magnesium Manganese Nitrate Nitrite Ortho P TP pH Silica<br />
mg/L mg/L mg/L mg/L mg/L mg/L mg/L mg/L<br />
0.096 37.3 0.018 12.6 0.64 0.83 7.4 23<br />
0.08 36.7 0.016 12 1.12 0.86 7.3 18<br />
0.078 36 0.014 11.9 0.59 0.8 7.2 22<br />
0.079 36.5 0.015 11.2 0.49 0.62 7.5 23<br />
0.08 36.5 0.016 11.4 0.365 0.56 7.5 23<br />
7.5<br />
7.4<br />
0.08 36.6 0.014 11 0.27 0.43 7.4 22<br />
0.076 35.2 0.014 11.6 0.322 0.45 7.3 22<br />
0.078 35.2 0.014 12 0.347 0.52 7.3 22<br />
0.1 34.8 0.02 11 1.37 0.43 7.4 22<br />
0.093 36.1 0.023 10.8 0.275 0.42 7.4 22<br />
7.4<br />
7.4<br />
0.083 36.9 0.013 10.4 0.294 0.35 7.4 13<br />
0.093 34.7 0.027 11.2 0.25 0.42 7.7 22<br />
0.076 33.8 0.014 12 0.271 0.4 7.8 22<br />
0.071 34.2 0.011 11.4 0.3 0.38 7.3 22<br />
0.085 35 0.012 11.1 0.255 0.37 7.4 22<br />
7.4<br />
8.99 0.07 0.29 7.3<br />
0.051 30.1 0.0085 9.25
Date Day of Wk<br />
MCES Blue Lake Plant Final Effluent Sampling Results<br />
<strong>Recycling</strong> <strong>Treated</strong> <strong>Municipal</strong> <strong>Wastewater</strong> <strong>for</strong> <strong>Industrial</strong> <strong>Water</strong> <strong>Use</strong><br />
4/28/07 Saturday<br />
4/29/07 Sunday<br />
4/30/07 Monday<br />
Mean<br />
Standard Deviation<br />
Min<br />
Max<br />
No. of Samples<br />
* Not included in statistics<br />
Iron Magnesium Manganese Nitrate Nitrite Ortho P TP pH Silica<br />
mg/L mg/L mg/L mg/L mg/L mg/L mg/L mg/L<br />
7.1<br />
11.4 0.05 0.37 7.1<br />
11.4 0.05 0.36 7<br />
0.08 35.94 0.01 10.97 0.12 0.41 0.49 7.25 21.63<br />
0.02 1.79 0.00 0.83 0.07 0.29 0.16 0.18 2.06<br />
0.048 30.1 0.0085 8.99 0.03 0.167 0.29 7 13<br />
0.1 39.3 0.027 12.6 0.23 1.37 0.86 7.8 23<br />
24 24 24 37 22 24 37 50 24<br />
MCES WWTP Effluent Quality_Blue Lake_Fall 2006 & Spring 2007_0707.xls, Blue Lake Data Page 6 of 8
Date Day of Wk<br />
MCES Blue Lake Plant Final Effluent Sampling Results<br />
<strong>Recycling</strong> <strong>Treated</strong> <strong>Municipal</strong> <strong>Wastewater</strong> <strong>for</strong> <strong>Industrial</strong> <strong>Water</strong> <strong>Use</strong><br />
10/8/06 Sunday<br />
10/9/06 Monday<br />
10/10/06 Tuesday<br />
10/11/06 Wednesday<br />
10/12/06 Thursday<br />
10/13/06 Friday<br />
10/14/06 Saturday<br />
10/15/06 Sunday<br />
10/16/06 Monday<br />
10/17/06 Tuesday<br />
10/18/06 Wednesday<br />
10/19/06 Thursday<br />
10/20/06 Friday<br />
10/21/06 Saturday<br />
10/22/06 Sunday<br />
10/23/06 Monday<br />
10/24/06 Tuesday<br />
10/25/06 Wednesday<br />
10/26/06 Thursday<br />
10/27/06 Friday<br />
4/1/07 Sunday<br />
4/2/07 Monday<br />
4/3/07 Tuesday<br />
4/4/07 Wednesday<br />
4/5/07 Thursday<br />
4/6/07 Friday<br />
4/7/07 Saturday<br />
4/8/07 Sunday<br />
4/9/07 Monday<br />
4/10/07 Tuesday<br />
4/11/07 Wednesday<br />
4/12/07 Thursday<br />
4/13/07 Friday<br />
4/14/07 Saturday<br />
4/15/07 Sunday<br />
4/16/07 Monday<br />
4/17/07 Tuesday<br />
4/18/07 Wednesday<br />
4/19/07 Thursday<br />
4/20/07 Friday<br />
4/21/07 Saturday<br />
4/22/07 Sunday<br />
4/23/07 Monday<br />
4/24/07 Tuesday<br />
4/25/07 Wednesday<br />
4/26/07 Thursday<br />
4/27/07 Friday<br />
Sulfate Temp (Inf)<br />
Total<br />
Coli<strong>for</strong>m TKN TDS TOC TSS Turbidity<br />
mg/L Deg C mpn/100ml mg/L mg/L mg/L mg/L NTU<br />
47.11 1190 8.5 ~2 2<br />
43.98 1260 7.7 ~2 2<br />
53.76 1140 7.6 ~2 2<br />
58.93 1150 7.9 ~1 2<br />
55.86 >4840<br />
>4838<br />
1160 8.4 ~1 2<br />
45.67 1130 8.6 ~1 1<br />
39.65 >4839 1110 7.1 4839 1090 7.5 4839<br />
52.9 1130 8.5 ~1 2<br />
55.26 3466 1110 7.7 6 2<br />
42.47 4920 1090 7.4 ~1 2<br />
57.49 4839 1150 7.8 2420<br />
9<br />
50.7 9 4.1 1050 8.7 ~2 1<br />
64.8 10.5 >2420 4.3 1030 7 ~2 2<br />
10.5 >2420 4.9 ~2<br />
83.1 11 >2420 4.9 1080 8.4 ~2 2<br />
10 >2420 4.6 ~2<br />
10 >2420<br />
10<br />
47.9 10 4.4 968 10 ~1 2<br />
43 11 >2420 3.6 1060 9 ~1 2<br />
11.5 >2420 4.1 ~2<br />
11 >2420 4 ~1<br />
51.7 11 >2420 5.4 1140 ~2 2<br />
11.5<br />
11.5<br />
11 4.5 ~1<br />
11.5 >2420 3.6 ~2<br />
11.5 4.1 ~2<br />
11.5 4 ~2<br />
11.5 4.3 ~1<br />
12<br />
MCES WWTP Effluent Quality_Blue Lake_Fall 2006 & Spring 2007_0707.xls, Blue Lake Data Page 7 of 8
Date Day of Wk<br />
MCES Blue Lake Plant Final Effluent Sampling Results<br />
<strong>Recycling</strong> <strong>Treated</strong> <strong>Municipal</strong> <strong>Wastewater</strong> <strong>for</strong> <strong>Industrial</strong> <strong>Water</strong> <strong>Use</strong><br />
4/28/07 Saturday<br />
4/29/07 Sunday<br />
4/30/07 Monday<br />
Mean<br />
Standard Deviation<br />
Min<br />
Max<br />
No. of Samples<br />
* Not included in statistics<br />
Sulfate Temp (Inf)<br />
Total<br />
Coli<strong>for</strong>m TKN TDS TOC TSS Turbidity<br />
mg/L Deg C<br />
12<br />
mpn/100ml mg/L mg/L mg/L mg/L NTU<br />
11.5 4.7 4<br />
11.5 4.5 ~2<br />
51.12 10.73 3496 4.17 1096.92 8.13 1.70 1.83<br />
9.17 0.86 1150 0.55 79.83 0.71 0.97 0.48<br />
39.65 9 2450 3 875 7 1 1<br />
83.1 12 4920 5.4 1260 10 6 3<br />
24 30 22 22 24 23 37 24<br />
MCES WWTP Effluent Quality_Blue Lake_Fall 2006 & Spring 2007_0707.xls, Blue Lake Data Page 8 of 8
Exhibit C<br />
Empire WWTP Sampling Results
MCES Empire Plant Final Effluent Sampling Results<br />
<strong>Recycling</strong> <strong>Treated</strong> <strong>Municipal</strong> <strong>Wastewater</strong> <strong>for</strong> <strong>Industrial</strong> <strong>Water</strong> <strong>Use</strong><br />
Date Day of Wk Flow Alkalinity Aluminum Ammonia Bicarbonate Calcium CBOD COD<br />
mgd mg/L CaCO3 mg/L mg/L mg/L CaCO3 mg/L mg/L mg/L<br />
10/24/06 Tuesday 8.01 230 0.027 0.31 244 84.5 3 36<br />
10/25/06 Wednesday 7.96 0.53 4 31<br />
10/26/06 Thursday 7.87 264 0.025 0.08 276 81.4 24<br />
10/27/06 Friday 7.86<br />
10/28/06 Saturday 8.48<br />
10/29/06 Sunday 8.94 246 0.027 0.42 367 79.2 4 34<br />
10/30/06 Monday 8.13 237 0.034 0.54 245 80 4 42<br />
10/31/06 Tuesday 7.78 243 0.027 0.7 243 86 3 40<br />
11/1/06 Wednesday 8.3 274 0.028 0.06 275 86.6
MCES Empire Plant Final Effluent Sampling Results<br />
<strong>Recycling</strong> <strong>Treated</strong> <strong>Municipal</strong> <strong>Wastewater</strong> <strong>for</strong> <strong>Industrial</strong> <strong>Water</strong> <strong>Use</strong><br />
Date Day of Wk Flow Alkalinity Aluminum Ammonia Bicarbonate Calcium CBOD COD<br />
mgd mg/L CaCO3 mg/L mg/L mg/L CaCO3 mg/L mg/L mg/L<br />
4/26/07 Thursday 8.4 0.09 40<br />
4/27/07 Friday 8.64<br />
4/28/07 Saturday 9.13<br />
4/29/07 Sunday 9.41 0.09
Date Day of Wk<br />
10/24/06 Tuesday<br />
10/25/06 Wednesday<br />
10/26/06 Thursday<br />
10/27/06 Friday<br />
10/28/06 Saturday<br />
10/29/06 Sunday<br />
10/30/06 Monday<br />
10/31/06 Tuesday<br />
11/1/06 Wednesday<br />
11/2/06 Thursday<br />
11/3/06 Friday<br />
11/4/06 Saturday<br />
11/5/06 Sunday<br />
11/6/06 Monday<br />
11/7/06 Tuesday<br />
11/8/06 Wednesday<br />
11/9/06 Thursday<br />
11/10/06 Friday<br />
11/11/06 Saturday<br />
11/12/06 Sunday<br />
11/13/06 Monday<br />
11/14/06 Tuesday<br />
11/15/06 Wednesday<br />
11/16/06 Thursday<br />
4/1/07 Sunday<br />
4/2/07 Monday<br />
4/3/07 Tuesday<br />
4/4/07 Wednesday<br />
4/5/07 Thursday<br />
4/6/07 Friday<br />
4/7/07 Saturday<br />
4/8/07 Sunday<br />
4/9/07 Monday<br />
4/10/07 Tuesday<br />
4/11/07 Wednesday<br />
4/12/07 Thursday<br />
4/13/07 Friday<br />
4/14/07 Saturday<br />
4/15/07 Sunday<br />
4/16/07 Monday<br />
4/17/07 Tuesday<br />
4/18/07 Wednesday<br />
4/19/07 Thursday<br />
4/20/07 Friday<br />
4/21/07 Saturday<br />
4/22/07 Sunday<br />
4/23/07 Monday<br />
4/24/07 Tuesday<br />
4/25/07 Wednesday<br />
MCES Empire Plant Final Effluent Sampling Results<br />
<strong>Recycling</strong> <strong>Treated</strong> <strong>Municipal</strong> <strong>Wastewater</strong> <strong>for</strong> <strong>Industrial</strong> <strong>Water</strong> <strong>Use</strong><br />
Chloride ion Color Copper DO E. coli Fecal Coli. Hardness Iron<br />
mg/L units mg/L mg/L mpn/100ml mpn/100 mL mg/L CaCO3 mg/L<br />
406 77 9.2 42 302 0.094<br />
7.5 48<br />
348 64 8.2 54 278 0.099<br />
8.3 45<br />
8.1<br />
371 8.1 282 0.122<br />
383 8.3 50 288 0.128<br />
418 8 36 304 0.106<br />
402 8.1 304 0.096<br />
392 8 306 0.101<br />
8.2<br />
8.3<br />
400 8.3 292 0.104<br />
386 8 276 0.102<br />
419 52 8 290 0.094<br />
8<br />
410 54 8.1 59* 298 0.115<br />
8.2<br />
399 60 8.5 274 0.127<br />
9.1<br />
406 56 8.6 270 0.096<br />
8.2<br />
404 59 8 292 0.11<br />
406 59 8 294 0.13<br />
8.8<br />
339 56 8.5 6 282 0.116<br />
8.9 9 4<br />
374 8.8 11 6 312 0.084<br />
379 47 10.09 7 8 310 0.076<br />
9.1 4 3<br />
9.1<br />
379 9 304 0.087<br />
384 54 9.4 5 298 0.074<br />
9.8 3 4<br />
393 55 8.85 5 302 0.082<br />
9 4 7<br />
9.1 5 6<br />
9.1 4<br />
394 8.9 37 298 0.105<br />
398 8.1 22 10 294 0.089<br />
8.3 9 4<br />
8.5 9 8<br />
295 8.6 5 5 240 0.192<br />
9.2 5 3 306 0.106<br />
8.8 300 0.093<br />
9.1 308 0.106<br />
8.79 3 7<br />
8.69 4<br />
8.78 3 5<br />
MCES WWTP Effluent Quality_Empire_Fall 2006 & Spring 2007_0707.xls, Empire Data Page 3 of 8
Date Day of Wk<br />
4/26/07 Thursday<br />
4/27/07 Friday<br />
4/28/07 Saturday<br />
4/29/07 Sunday<br />
4/30/07 Monday<br />
Mean<br />
Standard Deviation<br />
Min<br />
Max<br />
No. of Samples<br />
* Not included in statistics<br />
MCES Empire Plant Final Effluent Sampling Results<br />
<strong>Recycling</strong> <strong>Treated</strong> <strong>Municipal</strong> <strong>Wastewater</strong> <strong>for</strong> <strong>Industrial</strong> <strong>Water</strong> <strong>Use</strong><br />
Chloride ion Color Copper DO E. coli Fecal Coli. Hardness Iron<br />
mg/L units mg/L mg/L mpn/100ml mpn/100 mL mg/L CaCO3 mg/L<br />
9 7<br />
8.9 2<br />
8.8<br />
8.3<br />
8.74 3<br />
386.88 57.75 8.60 7 15 292.74 0.10<br />
27.60 7.44 0.51 5 17 15.63 0.02<br />
295 47 7.5 3 2 240 0.074<br />
419 77 10.09 22 54 312 0.192<br />
24 12 54 14 29 27 27<br />
MCES WWTP Effluent Quality_Empire_Fall 2006 & Spring 2007_0707.xls, Empire Data Page 4 of 8
Date Day of Wk<br />
10/24/06 Tuesday<br />
10/25/06 Wednesday<br />
10/26/06 Thursday<br />
10/27/06 Friday<br />
10/28/06 Saturday<br />
10/29/06 Sunday<br />
10/30/06 Monday<br />
10/31/06 Tuesday<br />
11/1/06 Wednesday<br />
11/2/06 Thursday<br />
11/3/06 Friday<br />
11/4/06 Saturday<br />
11/5/06 Sunday<br />
11/6/06 Monday<br />
11/7/06 Tuesday<br />
11/8/06 Wednesday<br />
11/9/06 Thursday<br />
11/10/06 Friday<br />
11/11/06 Saturday<br />
11/12/06 Sunday<br />
11/13/06 Monday<br />
11/14/06 Tuesday<br />
11/15/06 Wednesday<br />
11/16/06 Thursday<br />
4/1/07 Sunday<br />
4/2/07 Monday<br />
4/3/07 Tuesday<br />
4/4/07 Wednesday<br />
4/5/07 Thursday<br />
4/6/07 Friday<br />
4/7/07 Saturday<br />
4/8/07 Sunday<br />
4/9/07 Monday<br />
4/10/07 Tuesday<br />
4/11/07 Wednesday<br />
4/12/07 Thursday<br />
4/13/07 Friday<br />
4/14/07 Saturday<br />
4/15/07 Sunday<br />
4/16/07 Monday<br />
4/17/07 Tuesday<br />
4/18/07 Wednesday<br />
4/19/07 Thursday<br />
4/20/07 Friday<br />
4/21/07 Saturday<br />
4/22/07 Sunday<br />
4/23/07 Monday<br />
4/24/07 Tuesday<br />
4/25/07 Wednesday<br />
MCES Empire Plant Final Effluent Sampling Results<br />
<strong>Recycling</strong> <strong>Treated</strong> <strong>Municipal</strong> <strong>Wastewater</strong> <strong>for</strong> <strong>Industrial</strong> <strong>Water</strong> <strong>Use</strong><br />
Magnesium Manganese Nitrate Nitrite Ortho P TP pH Silica Sulfate<br />
mg/L mg/L mg/L mg/L mg/L mg/L mg/L mg/L<br />
25.9 0.025 18 0.295 0.71 7 19 41.07<br />
7<br />
24.8 0.035 11.8 0.016 0.39 7 19 45.86<br />
6.8<br />
6.9<br />
26.9 0.044 11.8 0.056 0.32 7 20 40.02<br />
27.2 0.03 0.017 6.8 19 42.77<br />
28.2 0.041 18.7 0.015 0.32 7 20 45.93<br />
28 0.041 0.017 7 20 43.54<br />
28.2 0.05 11.5 0.014 0.54 7.2 19 41.64<br />
6.9<br />
6.9<br />
27.1 0.014 16.2 0.015 0.29 6.9 20 39.31<br />
27.1 0.008 0.018 7.1 19 37.54<br />
28 0.01 19.1 0.019 0.35 7.3 19 36.62<br />
18.2 0.32 7<br />
28 0.097 0.021 0.33 7.1 20 37.61<br />
0.3 7<br />
26.3 0.047 0.027 7 20 34.55<br />
17.7 0.38 6.9<br />
24.9 0.015 0.011 7 20 37.43<br />
17 0.36 7<br />
28.3 0.058 0.019 7.1 19 40.59<br />
28.3 0.082 17.1 0.038 0.53 7.1 20 38.88<br />
17.1 0.07 0.32 6.9<br />
24.9 0.068 0.017 6.6 17 43.1<br />
15.2 0.03 0.27 7.1<br />
28 0.052 0.011 6.9 18 43.8<br />
27.5 0.054 12.1
Date Day of Wk<br />
4/26/07 Thursday<br />
4/27/07 Friday<br />
4/28/07 Saturday<br />
4/29/07 Sunday<br />
4/30/07 Monday<br />
Mean<br />
Standard Deviation<br />
Min<br />
Max<br />
No. of Samples<br />
* Not included in statistics<br />
MCES Empire Plant Final Effluent Sampling Results<br />
<strong>Recycling</strong> <strong>Treated</strong> <strong>Municipal</strong> <strong>Wastewater</strong> <strong>for</strong> <strong>Industrial</strong> <strong>Water</strong> <strong>Use</strong><br />
Magnesium Manganese Nitrate Nitrite Ortho P TP pH Silica Sulfate<br />
mg/L mg/L mg/L mg/L mg/L mg/L mg/L mg/L<br />
12.6
Date Day of Wk<br />
10/24/06 Tuesday<br />
10/25/06 Wednesday<br />
10/26/06 Thursday<br />
10/27/06 Friday<br />
10/28/06 Saturday<br />
10/29/06 Sunday<br />
10/30/06 Monday<br />
10/31/06 Tuesday<br />
11/1/06 Wednesday<br />
11/2/06 Thursday<br />
11/3/06 Friday<br />
11/4/06 Saturday<br />
11/5/06 Sunday<br />
11/6/06 Monday<br />
11/7/06 Tuesday<br />
11/8/06 Wednesday<br />
11/9/06 Thursday<br />
11/10/06 Friday<br />
11/11/06 Saturday<br />
11/12/06 Sunday<br />
11/13/06 Monday<br />
11/14/06 Tuesday<br />
11/15/06 Wednesday<br />
11/16/06 Thursday<br />
4/1/07 Sunday<br />
4/2/07 Monday<br />
4/3/07 Tuesday<br />
4/4/07 Wednesday<br />
4/5/07 Thursday<br />
4/6/07 Friday<br />
4/7/07 Saturday<br />
4/8/07 Sunday<br />
4/9/07 Monday<br />
4/10/07 Tuesday<br />
4/11/07 Wednesday<br />
4/12/07 Thursday<br />
4/13/07 Friday<br />
4/14/07 Saturday<br />
4/15/07 Sunday<br />
4/16/07 Monday<br />
4/17/07 Tuesday<br />
4/18/07 Wednesday<br />
4/19/07 Thursday<br />
4/20/07 Friday<br />
4/21/07 Saturday<br />
4/22/07 Sunday<br />
4/23/07 Monday<br />
4/24/07 Tuesday<br />
4/25/07 Wednesday<br />
MCES Empire Plant Final Effluent Sampling Results<br />
<strong>Recycling</strong> <strong>Treated</strong> <strong>Municipal</strong> <strong>Wastewater</strong> <strong>for</strong> <strong>Industrial</strong> <strong>Water</strong> <strong>Use</strong><br />
Temp (Inf)<br />
Total<br />
coli<strong>for</strong>m TKN TDS TOC TSS Turbidity<br />
Deg C mpn/100ml mg/L mg/L mg/L mg/L NTU<br />
1120 8.7 5<br />
6<br />
5<br />
1040 10.2 3 4<br />
1060 10.2 3 5<br />
1070 9.2 7 5<br />
1150 9.8 4 5<br />
1140 9.4 3 4<br />
1110 8.9 3 4<br />
1120 10.6 ~1 4<br />
1090 9.7 ~2 4<br />
1140 10.4 ~2 4<br />
~2<br />
>9678* 1150 10.4 8 4<br />
~2<br />
1110 11.8 4<br />
3<br />
1130 11.1 ~2 4<br />
3<br />
1120 9.8 3 4<br />
1160 9.4 3 4<br />
13.5 3.8 4<br />
13.5 961 8.9 ~1 5<br />
13.5 4.7 3<br />
12.5 1050 7.6 3 3<br />
12.5 3.2 1050 7.7 7 1<br />
12.5<br />
12<br />
12 4 1050 8.1 ~2 2<br />
13.5 1070 8.2 ~2 2<br />
12.5 179 4.4 ~2<br />
13.5 172 1080 8.6 ~2 3<br />
13.5 104 3.7 3<br />
13.5 772 4.1 3<br />
13.5 4.4 ~2<br />
13.5 3.6 1220 9.9 ~2 3<br />
13.2 150 1090 9.3 ~2 3<br />
13 173 4.3 4<br />
13.5 >2420 15<br />
13 613 4.6 1920 9.4 ~2 4<br />
13.5 1080 8.3 2<br />
13.5 1110 8.7 3<br />
12.5 6.1 1110 8.2 ~2 2<br />
14.5 196 3<br />
13.7 4.4 4<br />
13.4 179 ~2<br />
MCES WWTP Effluent Quality_Empire_Fall 2006 & Spring 2007_0707.xls, Empire Data Page 7 of 8
Date Day of Wk<br />
4/26/07 Thursday<br />
4/27/07 Friday<br />
4/28/07 Saturday<br />
4/29/07 Sunday<br />
4/30/07 Monday<br />
Mean<br />
Standard Deviation<br />
Min<br />
Max<br />
No. of Samples<br />
* Not included in statistics<br />
MCES Empire Plant Final Effluent Sampling Results<br />
<strong>Recycling</strong> <strong>Treated</strong> <strong>Municipal</strong> <strong>Wastewater</strong> <strong>for</strong> <strong>Industrial</strong> <strong>Water</strong> <strong>Use</strong><br />
Temp (Inf)<br />
Total<br />
coli<strong>for</strong>m TKN TDS TOC TSS Turbidity<br />
Deg C mpn/100ml mg/L mg/L mg/L mg/L NTU<br />
13.5<br />
13.5<br />
13.5<br />
4.3 ~2<br />
13.5 4.5 ~2<br />
14.5 ~2<br />
13.26 499 4.27 1129.67 9.35 3.28 3.59<br />
0.60 721 0.65 165.50 1.04 2.39 1.08<br />
12 104 3.2 961 7.6 1 1<br />
14.5 2450 6.1 1920 11.8 15 5<br />
30 10 15 27 27 43 27<br />
MCES WWTP Effluent Quality_Empire_Fall 2006 & Spring 2007_0707.xls, Empire Data Page 8 of 8
Exhibit D<br />
Metropolitan (Metro) WWTP<br />
Sampling Results
MCES Metropolitan Plant Final Effluent Sampling Results<br />
<strong>Recycling</strong> <strong>Treated</strong> <strong>Municipal</strong> <strong>Wastewater</strong> <strong>for</strong> <strong>Industrial</strong> <strong>Water</strong> <strong>Use</strong><br />
Date Day of Wk Flow Alkalinity Aluminum Ammonia Bicarbonate Calcium CBOD<br />
mgd mg/L CaCO3 mg/L mg/L mg/L CaCO3 mg/L mg/L<br />
10/8/06 Sunday 174.01 152 0.036 0.09 163 70.3 4<br />
10/9/06 Monday 183.52 0.1 3<br />
10/10/06 Tuesday 179.59 0.08
MCES Metropolitan Plant Final Effluent Sampling Results<br />
<strong>Recycling</strong> <strong>Treated</strong> <strong>Municipal</strong> <strong>Wastewater</strong> <strong>for</strong> <strong>Industrial</strong> <strong>Water</strong> <strong>Use</strong><br />
Date Day of Wk Flow Alkalinity Aluminum Ammonia Bicarbonate Calcium CBOD<br />
mgd mg/L CaCO3 mg/L mg/L mg/L CaCO3 mg/L mg/L<br />
4/19/07 Thursday 200.19 152 0.029 0.26 77.1 3<br />
4/20/07 Friday 202.49 0.26 3<br />
4/21/07 Saturday 197.82 0.11 4<br />
4/22/07 Sunday 206.28 0.14 3<br />
4/23/07 Monday 215.74 0.32
Date Day of Wk<br />
10/8/06 Sunday<br />
10/9/06 Monday<br />
10/10/06 Tuesday<br />
10/11/06 Wednesday<br />
10/12/06 Thursday<br />
10/13/06 Friday<br />
10/14/06 Saturday<br />
10/15/06 Sunday<br />
10/16/06 Monday<br />
10/17/06 Tuesday<br />
10/18/06 Wednesday<br />
10/19/06 Thursday<br />
10/20/06 Friday<br />
10/21/06 Saturday<br />
10/22/06 Sunday<br />
10/23/06 Monday<br />
10/24/06 Tuesday<br />
10/25/06 Wednesday<br />
10/26/06 Thursday<br />
10/27/06 Friday<br />
10/28/06 Saturday<br />
10/29/06 Sunday<br />
10/30/06 Monday<br />
10/31/06 Tuesday<br />
11/1/06 Wednesday<br />
11/2/06 Thursday<br />
11/3/06 Friday<br />
11/4/06 Saturday<br />
11/5/06 Sunday<br />
11/6/06 Monday<br />
11/7/06 Tuesday<br />
4/1/07 Sunday<br />
4/2/07 Monday<br />
4/3/07 Tuesday<br />
4/4/07 Wednesday<br />
4/5/07 Thursday<br />
4/6/07 Friday<br />
4/7/07 Saturday<br />
4/8/07 Sunday<br />
4/9/07 Monday<br />
4/10/07 Tuesday<br />
4/11/07 Wednesday<br />
4/12/07 Thursday<br />
4/13/07 Friday<br />
4/14/07 Saturday<br />
4/15/07 Sunday<br />
4/16/07 Monday<br />
4/17/07 Tuesday<br />
4/18/07 Wednesday<br />
MCES Metropolitan Plant Final Effluent Sampling Results<br />
<strong>Recycling</strong> <strong>Treated</strong> <strong>Municipal</strong> <strong>Wastewater</strong> <strong>for</strong> <strong>Industrial</strong> <strong>Water</strong> <strong>Use</strong><br />
COD<br />
Chloride<br />
ion Color Copper DO E. coli Fecal Coli. Hardness<br />
mg/L mg/L units mg/L mg/L mpn/100ml mpn/100ml mg/L CaCO3<br />
27 238 5.81 86 258<br />
29 6.12 54<br />
35 6.07 90<br />
30 6.11 72<br />
32 8.17 130<br />
29 8.49 120<br />
32 6.12 35<br />
26 6.04 110<br />
33 236 49 5.98 41 244<br />
33 246 52 5.73 68 254<br />
34 248 56 6.22 61 252<br />
32 243 46 5.85 35 244<br />
32 5.83 36<br />
34 5.93 44<br />
27 240 43 6.08 44 252<br />
31 223 62 6.12 170 48 242<br />
27 244 6.32 160 248<br />
22 249 42 5.93 551 68 246<br />
30 247 45 6.12 798 100 248<br />
29 242 6.32 413 93 246<br />
29 245 6.08 95 248<br />
30 233 6.15 100 250<br />
32 231 6.04 952 110 242<br />
34 239 6.32 3973* 400* 256<br />
33 254 5.96 254<br />
33 6.05<br />
33 247 5.71 248<br />
34 6.37<br />
33 233 6.29 246<br />
32 224 6.49 242<br />
29 242 6.29 252<br />
29 4.5 4.63 28<br />
28 208 33 5.76 57 22 282<br />
36 5.53 411 50<br />
31 239 4.77 28 9 290<br />
37 244 38 4.98 1 2 288<br />
31 4.78 98 10<br />
37 5.06 10<br />
30 235 4.8 4.34 27 278<br />
32 223 38 5.64 150 34 274<br />
38 2.99 6 4<br />
34 262 41 3.84 11 7 276<br />
30 3.9 93 27<br />
31 3.67 10<br />
30 4.41 24<br />
31 236 5.1 6 320 276<br />
28 231 5.81 118 56 272<br />
33 6.09 93 20<br />
34 5.81 291 68<br />
MCES WWTP Effluent Quality_Metro_Fall 2006 & Spring 2007_0707.xls, Metro Data Page 3 of 8
Date Day of Wk<br />
4/19/07 Thursday<br />
4/20/07 Friday<br />
4/21/07 Saturday<br />
4/22/07 Sunday<br />
4/23/07 Monday<br />
4/24/07 Tuesday<br />
4/25/07 Wednesday<br />
4/26/2007 Thursday<br />
4/27/2007 Friday<br />
4/28/2007 Saturday<br />
4/29/2007 Sunday<br />
4/30/2007 Monday<br />
Mean<br />
Stan Dev<br />
Min<br />
Max<br />
No. Samples<br />
* Not included in statistics<br />
MCES Metropolitan Plant Final Effluent Sampling Results<br />
<strong>Recycling</strong> <strong>Treated</strong> <strong>Municipal</strong> <strong>Wastewater</strong> <strong>for</strong> <strong>Industrial</strong> <strong>Water</strong> <strong>Use</strong><br />
COD<br />
Chloride<br />
ion Color Copper DO E. coli Fecal Coli. Hardness<br />
mg/L mg/L units mg/L mg/L mpn/100ml mpn/100ml mg/L CaCO3<br />
34 255 6.52 86 20 272<br />
36 5.84 130 40<br />
37 5.96 32<br />
31 5.7 6.8 61<br />
33 6.06 1300 500<br />
34 5.45 20<br />
38 5.37 196 38<br />
37 5.66 120<br />
38 4.54 94<br />
38 5.76 52<br />
36 5.2 6.31 66<br />
39 5.81 42<br />
32.25 239.21 45.42 5.06 5.76 283 68 257.93<br />
3.45 11.05 8.23 0.45 0.90 349 80 15.11<br />
22 208 33 4.5 2.99 1 2 242<br />
39 262 62 5.7 8.49 1300 500 290<br />
61 29 12 5 61 21 53 29<br />
MCES WWTP Effluent Quality_Metro_Fall 2006 & Spring 2007_0707.xls, Metro Data Page 4 of 8
Date Day of Wk<br />
10/8/06 Sunday<br />
10/9/06 Monday<br />
10/10/06 Tuesday<br />
10/11/06 Wednesday<br />
10/12/06 Thursday<br />
10/13/06 Friday<br />
10/14/06 Saturday<br />
10/15/06 Sunday<br />
10/16/06 Monday<br />
10/17/06 Tuesday<br />
10/18/06 Wednesday<br />
10/19/06 Thursday<br />
10/20/06 Friday<br />
10/21/06 Saturday<br />
10/22/06 Sunday<br />
10/23/06 Monday<br />
10/24/06 Tuesday<br />
10/25/06 Wednesday<br />
10/26/06 Thursday<br />
10/27/06 Friday<br />
10/28/06 Saturday<br />
10/29/06 Sunday<br />
10/30/06 Monday<br />
10/31/06 Tuesday<br />
11/1/06 Wednesday<br />
11/2/06 Thursday<br />
11/3/06 Friday<br />
11/4/06 Saturday<br />
11/5/06 Sunday<br />
11/6/06 Monday<br />
11/7/06 Tuesday<br />
4/1/07 Sunday<br />
4/2/07 Monday<br />
4/3/07 Tuesday<br />
4/4/07 Wednesday<br />
4/5/07 Thursday<br />
4/6/07 Friday<br />
4/7/07 Saturday<br />
4/8/07 Sunday<br />
4/9/07 Monday<br />
4/10/07 Tuesday<br />
4/11/07 Wednesday<br />
4/12/07 Thursday<br />
4/13/07 Friday<br />
4/14/07 Saturday<br />
4/15/07 Sunday<br />
4/16/07 Monday<br />
4/17/07 Tuesday<br />
4/18/07 Wednesday<br />
MCES Metropolitan Plant Final Effluent Sampling Results<br />
<strong>Recycling</strong> <strong>Treated</strong> <strong>Municipal</strong> <strong>Wastewater</strong> <strong>for</strong> <strong>Industrial</strong> <strong>Water</strong> <strong>Use</strong><br />
Iron Magnesium Manganese Nitrate Nitrite Ortho P TP pH Silica<br />
mg/L mg/L mg/L mg/L mg/L mg/L mg/L mg/L<br />
0.15 24.1 0.019 17.68 0.224 0.4 7 17<br />
17.37 0.4 6.9<br />
18.24 0.5 7.2<br />
18.57 0.4 7.1<br />
18.73 0.4 7.1<br />
0.4 7.2<br />
0.4 7.1<br />
17.29 0.4 7.1<br />
0.063 23.5 0.016 16.99 0.223 0.4 6.9 17<br />
0.066 24.4 0.019 18.99 0.273 0.5 7 17<br />
0.066 24.6 0.021 18.88 0.227 0.4 7 17<br />
0.07 23.6 0.022 18.17 0.333 0.6 6.9 17<br />
0.7 7<br />
1 7<br />
0.055 24.4 0.018 17.52 0.765 1 7.1 18<br />
0.056 23.9 0.017 17.17 0.81 1.3 7 18<br />
0.063 22.9 0.018 18.55 0.59 1.5 7 17<br />
0.064 23.3 0.014 18.08 0.56 0.7 6.9 17<br />
0.07 22.7 0.016 17.33 0.43 0.7 7 17<br />
0.07 23.2 0.014 0.402 0.6 7 17<br />
0.072 24.1 0.016 0.33 0.5 7 17<br />
0.062 24.1 0.013 16.79 0.202 0.4 7 17<br />
0.059 23.9 0.01 16.4 0.162 0.4 7 17<br />
0.072 24.1 0.013 17.45 0.159 0.3 7 17<br />
0.073 23.4 0.015 17.75 0.153 0.3 6.94 17<br />
18.06 0.5 6.9<br />
0.071 23.6 0.012 0.141 0.5 6.8 17<br />
0.4 7<br />
0.068 24.3 0.013 16.23 0.184 0.4 7 17<br />
0.07 24 0.012 15.9 0.178 0.4 7 17<br />
0.09 24.7 0.014 17.69 0.193 0.4 7 17<br />
11.86 0.07 0.3<br />
0.056 23.2 0.013 13.22 0.06 0.102 0.2 7.1 17<br />
13.82 0.17 0.3 6.9<br />
0.049 23.8 0.017 14.89 0.26 0.093 0.3 6.9 17<br />
0.057 24.8 0.023 13.45 0.73 0.114 0.3 7 17<br />
0.3 6.7<br />
0.3<br />
0.058 24.9 0.014 13.29 0.13 0.133 0.4 7.3 17<br />
0.059 24.3 0.019 13.92 0.43 0.12 0.5 6.8 17<br />
15.59 0.3 0.9 7.2<br />
0.064 24.9 0.02 15.62 0.35 0.113 0.4 7.1 17<br />
17.59 0.5 0.3 7.2<br />
0.3 7.1<br />
0.3 7.2<br />
0.078 25 0.015 14.65
Date Day of Wk<br />
4/19/07 Thursday<br />
4/20/07 Friday<br />
4/21/07 Saturday<br />
4/22/07 Sunday<br />
4/23/07 Monday<br />
4/24/07 Tuesday<br />
4/25/07 Wednesday<br />
4/26/2007 Thursday<br />
4/27/2007 Friday<br />
4/28/2007 Saturday<br />
4/29/2007 Sunday<br />
4/30/2007 Monday<br />
Mean<br />
Stan Dev<br />
Min<br />
Max<br />
No. Samples<br />
* Not included in statistics<br />
MCES Metropolitan Plant Final Effluent Sampling Results<br />
<strong>Recycling</strong> <strong>Treated</strong> <strong>Municipal</strong> <strong>Wastewater</strong> <strong>for</strong> <strong>Industrial</strong> <strong>Water</strong> <strong>Use</strong><br />
Iron Magnesium Manganese Nitrate Nitrite Ortho P TP pH Silica<br />
mg/L mg/L mg/L mg/L mg/L mg/L mg/L mg/L<br />
0.06 24.8 0.018 17.61 0.21 0.107 0.3 7 16<br />
0.3 7.3<br />
0.3 7<br />
15.21 0.07 0.2 7<br />
14.5 0.16 0.3 7<br />
16.72 0.13 0.3 7.2<br />
16.81 0.06 0.4 6.9<br />
16.36 0.13 0.3 7<br />
0.3 6.9<br />
0.3 7.2<br />
15.2
Date Day of Wk<br />
10/8/06 Sunday<br />
10/9/06 Monday<br />
10/10/06 Tuesday<br />
10/11/06 Wednesday<br />
10/12/06 Thursday<br />
10/13/06 Friday<br />
10/14/06 Saturday<br />
10/15/06 Sunday<br />
10/16/06 Monday<br />
10/17/06 Tuesday<br />
10/18/06 Wednesday<br />
10/19/06 Thursday<br />
10/20/06 Friday<br />
10/21/06 Saturday<br />
10/22/06 Sunday<br />
10/23/06 Monday<br />
10/24/06 Tuesday<br />
10/25/06 Wednesday<br />
10/26/06 Thursday<br />
10/27/06 Friday<br />
10/28/06 Saturday<br />
10/29/06 Sunday<br />
10/30/06 Monday<br />
10/31/06 Tuesday<br />
11/1/06 Wednesday<br />
11/2/06 Thursday<br />
11/3/06 Friday<br />
11/4/06 Saturday<br />
11/5/06 Sunday<br />
11/6/06 Monday<br />
11/7/06 Tuesday<br />
4/1/07 Sunday<br />
4/2/07 Monday<br />
4/3/07 Tuesday<br />
4/4/07 Wednesday<br />
4/5/07 Thursday<br />
4/6/07 Friday<br />
4/7/07 Saturday<br />
4/8/07 Sunday<br />
4/9/07 Monday<br />
4/10/07 Tuesday<br />
4/11/07 Wednesday<br />
4/12/07 Thursday<br />
4/13/07 Friday<br />
4/14/07 Saturday<br />
4/15/07 Sunday<br />
4/16/07 Monday<br />
4/17/07 Tuesday<br />
4/18/07 Wednesday<br />
MCES Metropolitan Plant Final Effluent Sampling Results<br />
<strong>Recycling</strong> <strong>Treated</strong> <strong>Municipal</strong> <strong>Wastewater</strong> <strong>for</strong> <strong>Industrial</strong> <strong>Water</strong> <strong>Use</strong><br />
Sulfate Temp (Inf)<br />
Total<br />
Coli<strong>for</strong>m TKN TDS TOC TSS Turbidity<br />
mg/L Deg C mpn/100ml mg/L mg/L mg/L mg/L NTU<br />
66.24 800 7.4 2<br />
2<br />
1<br />
3<br />
3<br />
1<br />
4<br />
2<br />
2<br />
72.44 760 8.2 3 2<br />
81.22 821 8.7 2 2<br />
82.81 833 8.1 2 2<br />
83.12 831 7.7 3<br />
2<br />
2<br />
2<br />
76.69 797 7.3 3 2<br />
73.83 >4839 768 7.8 2 2<br />
72.24 821 8 3 3<br />
74.74 >4839 826 7.9 2 2<br />
74.73 >9678 838 8.1 2 2<br />
76.9 >4839 791 8.1 1 2<br />
77.68 808 7.9 2 2<br />
72.24 780 7.5 2 2<br />
64.28 >9678 753 7.5 3 2<br />
74.04 >9678* 797 8.2 2 2<br />
80.68 840 8.3 2<br />
3<br />
3<br />
78.72 824 8.7 2<br />
3<br />
2<br />
71.58 790 7.9 3 2<br />
65.96 774 8.3 4 2<br />
76.98 824 8.6 3 2<br />
13 3.1 2<br />
63.4 13 3.1 716 7 3 2<br />
13 3.4 2<br />
78.4 13 3.3 812 7.5 2 2<br />
76.9 13 3.7 820 7.4 2 2<br />
13 >2420 4.2 2<br />
13 4 3<br />
70.2 3.8 783 7 2 1<br />
67.4 13 >2420 4.1 764 7.3 2 2<br />
13 1300 4 2<br />
93.8 13 2420 4.3 856 8 3 3<br />
13 >2420 5.4 2<br />
14 3.8 2<br />
13 3.6 2<br />
70.4 14 3.4 907 9.2 4 2<br />
67.6 14 >2420 3 780 8.9 2 2<br />
14 >2420 3.9 3<br />
14 >2420 3.6 3<br />
MCES WWTP Effluent Quality_Metro_Fall 2006 & Spring 2007_0707.xls, Metro Data Page 7 of 8
Date Day of Wk<br />
4/19/07 Thursday<br />
4/20/07 Friday<br />
4/21/07 Saturday<br />
4/22/07 Sunday<br />
4/23/07 Monday<br />
4/24/07 Tuesday<br />
4/25/07 Wednesday<br />
4/26/2007 Thursday<br />
4/27/2007 Friday<br />
4/28/2007 Saturday<br />
4/29/2007 Sunday<br />
4/30/2007 Monday<br />
Mean<br />
Stan Dev<br />
Min<br />
Max<br />
No. Samples<br />
* Not included in statistics<br />
MCES Metropolitan Plant Final Effluent Sampling Results<br />
<strong>Recycling</strong> <strong>Treated</strong> <strong>Municipal</strong> <strong>Wastewater</strong> <strong>for</strong> <strong>Industrial</strong> <strong>Water</strong> <strong>Use</strong><br />
Sulfate Temp (Inf)<br />
Total<br />
Coli<strong>for</strong>m TKN TDS TOC TSS Turbidity<br />
mg/L Deg C mpn/100ml mg/L mg/L mg/L mg/L NTU<br />
82 14 >2420 4 824 8.6 2 2<br />
15 3.7 3<br />
14 4.1 3<br />
4 1<br />
14 >2420 3.5 4<br />
15 3.5 2<br />
15 >2420 3.3 4<br />
15 3.9 2<br />
15 3.8 2<br />
15 3.7 2<br />
15 4.2 1<br />
15 6.3 3<br />
74.73 13.86 3798 3.86 804.76 7.97 2.39 2.07<br />
6.67 0.85 2655 0.65 36.87 0.56 0.76 0.37<br />
63.4 13 1300 3 716 7 1 1<br />
93.8 15 10000 6.3 907 9.2 4 3<br />
29 28 17 30 29 29 61 29<br />
MCES WWTP Effluent Quality_Metro_Fall 2006 & Spring 2007_0707.xls, Metro Data Page 8 of 8
Exhibit E<br />
Seneca WWTP Sampling Results
MCES Seneca Plant Final Effluent Sampling Results<br />
<strong>Recycling</strong> <strong>Treated</strong> <strong>Municipal</strong> <strong>Wastewater</strong> <strong>for</strong> <strong>Industrial</strong> <strong>Water</strong> <strong>Use</strong><br />
Date Day of Wk Flow Alkalinity Aluminum Ammonia Bicarbonate Calcium CBOD COD<br />
mgd mg/L CaCO3 mg/L mg/L mg/L CaCO3 mg/L mg/L mg/L<br />
10/8/06 Sunday 23.03 173 0.023 0.09 177 60.5
MCES Seneca Plant Final Effluent Sampling Results<br />
<strong>Recycling</strong> <strong>Treated</strong> <strong>Municipal</strong> <strong>Wastewater</strong> <strong>for</strong> <strong>Industrial</strong> <strong>Water</strong> <strong>Use</strong><br />
Date Day of Wk Flow Alkalinity Aluminum Ammonia Bicarbonate Calcium CBOD COD<br />
mgd mg/L CaCO3 mg/L mg/L mg/L CaCO3 mg/L mg/L mg/L<br />
4/25/07 Wednesday 23.46 0.11 3 38<br />
4/26/07 Thursday 22.72 0.62 44<br />
4/27/07 Friday 22.88<br />
4/28/07 Saturday 23.2<br />
4/29/07 Sunday 22.86 0.11
Date Day of Wk<br />
10/8/06 Sunday<br />
10/9/06 Monday<br />
10/10/06 Tuesday<br />
10/11/06 Wednesday<br />
10/12/06 Thursday<br />
10/13/06 Friday<br />
10/14/06 Saturday<br />
10/15/06 Sunday<br />
10/16/06 Monday<br />
10/17/06 Tuesday<br />
10/18/06 Wednesday<br />
10/19/06 Thursday<br />
10/20/06 Friday<br />
10/21/06 Saturday<br />
10/22/06 Sunday<br />
10/23/06 Monday<br />
10/24/06 Tuesday<br />
10/25/06 Wednesday<br />
10/26/06 Thursday<br />
10/27/06 Friday<br />
10/28/06 Saturday<br />
10/29/06 Sunday<br />
10/30/06 Monday<br />
10/31/06 Tuesday<br />
4/1/07 Sunday<br />
4/2/07 Monday<br />
4/3/07 Tuesday<br />
4/4/07 Wednesday<br />
4/5/07 Thursday<br />
4/6/07 Friday<br />
4/7/07 Saturday<br />
4/8/07 Sunday<br />
4/9/07 Monday<br />
4/10/07 Tuesday<br />
4/11/07 Wednesday<br />
4/12/07 Thursday<br />
4/13/07 Friday<br />
4/14/07 Saturday<br />
4/15/07 Sunday<br />
4/16/07 Monday<br />
4/17/07 Tuesday<br />
4/18/07 Wednesday<br />
4/19/07 Thursday<br />
4/20/07 Friday<br />
4/21/07 Saturday<br />
4/22/07 Sunday<br />
4/23/07 Monday<br />
4/24/07 Tuesday<br />
MCES Seneca Plant Final Effluent Sampling Results<br />
<strong>Recycling</strong> <strong>Treated</strong> <strong>Municipal</strong> <strong>Wastewater</strong> <strong>for</strong> <strong>Industrial</strong> <strong>Water</strong> <strong>Use</strong><br />
Chloride ion Color Copper DO E. coli Fecal Coli Hardness Iron<br />
mg/L units mg/L mg/L mpn/100ml mpn/100 mL mg/L CaCO3 mg/L<br />
294 8.32 236 0.123<br />
280 8.6 10 234 0.096<br />
297 8.66 20 242 0.095<br />
278 8.41 20 246 0.118<br />
269 8.44 26 20 232 0.111<br />
8.3 38 22<br />
8.45<br />
268 61 8.42 240 0.116<br />
273 59 8.17 32 31 236 0.087<br />
279 75 8.06 14 20 238 0.103<br />
279 78 8.28 40 242 0.129<br />
283 70 8.25 30 248 0.119<br />
8.2 33<br />
8.42<br />
286 76 8.24 228 0.127<br />
274 67 8.5 20 236 0.084<br />
289 8.78 20 248 0.121<br />
299 8.01 52 27 252 0.14<br />
297 61 8.81 44 246 0.13<br />
8.2 29 21<br />
8.33<br />
8.3<br />
8.28 8<br />
8.36 14 7<br />
9.19<br />
261 44 10.02 2 242 0.105<br />
9.83 13 10<br />
275 9.51 33 20 246 0.133<br />
272 54 10 18 10 248 0.182<br />
9.82 548 290<br />
9.74<br />
266 9.52 240 0.189<br />
268 41 9.62 4 4 238 0.123<br />
9.32 47 28<br />
282 48 9.01 15 10 238 0.143<br />
9.2 238 160<br />
9.27 18 20<br />
9.04<br />
285 9.04 238 0.226<br />
274 9.11 6 20 232 0.183<br />
9.26 5 9<br />
9.44 6 10<br />
402 9.49 71 47 302 0.095<br />
9.17 23 20<br />
8.98<br />
8.99<br />
8.98 170 246 0.256<br />
9.1 10<br />
MCES WWTP Effluent Quality_Seneca_Fall 2006 & Spring 2007_0707.xls, Seneca Data Page 3 of 8
Date Day of Wk<br />
4/25/07 Wednesday<br />
4/26/07 Thursday<br />
4/27/07 Friday<br />
4/28/07 Saturday<br />
4/29/07 Sunday<br />
4/30/07 Monday<br />
Mean<br />
Standard Deviation<br />
Min<br />
Max<br />
No. of Samples<br />
* Not included in statistics<br />
MCES Seneca Plant Final Effluent Sampling Results<br />
<strong>Recycling</strong> <strong>Treated</strong> <strong>Municipal</strong> <strong>Wastewater</strong> <strong>for</strong> <strong>Industrial</strong> <strong>Water</strong> <strong>Use</strong><br />
Chloride ion Color Copper DO E. coli Fecal Coli Hardness Iron<br />
mg/L units mg/L mg/L mpn/100ml mpn/100 mL mg/L CaCO3 mg/L<br />
9.13 5 5<br />
9.49 3<br />
8.68 10<br />
8.59<br />
9.32<br />
8.76 2<br />
284.58 61.17 8.88 57 33 242.96 0.13<br />
27.07 12.57 0.55 120 55 13.68 0.04<br />
261 41 8.01 4 2 228 0.084<br />
402 78 10.02 548 290 302 0.256<br />
24 12 54 22 38 25 25<br />
MCES WWTP Effluent Quality_Seneca_Fall 2006 & Spring 2007_0707.xls, Seneca Data Page 4 of 8
Date Day of Wk<br />
10/8/06 Sunday<br />
10/9/06 Monday<br />
10/10/06 Tuesday<br />
10/11/06 Wednesday<br />
10/12/06 Thursday<br />
10/13/06 Friday<br />
10/14/06 Saturday<br />
10/15/06 Sunday<br />
10/16/06 Monday<br />
10/17/06 Tuesday<br />
10/18/06 Wednesday<br />
10/19/06 Thursday<br />
10/20/06 Friday<br />
10/21/06 Saturday<br />
10/22/06 Sunday<br />
10/23/06 Monday<br />
10/24/06 Tuesday<br />
10/25/06 Wednesday<br />
10/26/06 Thursday<br />
10/27/06 Friday<br />
10/28/06 Saturday<br />
10/29/06 Sunday<br />
10/30/06 Monday<br />
10/31/06 Tuesday<br />
4/1/07 Sunday<br />
4/2/07 Monday<br />
4/3/07 Tuesday<br />
4/4/07 Wednesday<br />
4/5/07 Thursday<br />
4/6/07 Friday<br />
4/7/07 Saturday<br />
4/8/07 Sunday<br />
4/9/07 Monday<br />
4/10/07 Tuesday<br />
4/11/07 Wednesday<br />
4/12/07 Thursday<br />
4/13/07 Friday<br />
4/14/07 Saturday<br />
4/15/07 Sunday<br />
4/16/07 Monday<br />
4/17/07 Tuesday<br />
4/18/07 Wednesday<br />
4/19/07 Thursday<br />
4/20/07 Friday<br />
4/21/07 Saturday<br />
4/22/07 Sunday<br />
4/23/07 Monday<br />
4/24/07 Tuesday<br />
MCES Seneca Plant Final Effluent Sampling Results<br />
<strong>Recycling</strong> <strong>Treated</strong> <strong>Municipal</strong> <strong>Wastewater</strong> <strong>for</strong> <strong>Industrial</strong> <strong>Water</strong> <strong>Use</strong><br />
Magnesium Manganese Nitrate Nitrite Ortho P TP pH Silica Sulfate<br />
mg/L mg/L mg/L mg/L mg/L mg/L mg/L mg/L<br />
25.5 0.018 18.3 1.6 2.4 7.1 18 447.82<br />
25.5 0.012 16.9 0.55 1.5 7.2 22 286.15<br />
26.1 0.012 17.2 0.44 0.78 7.2 18 380.42<br />
25.9 0.011 18.7 0.32 0.59 7.1 18 417.92<br />
24.9 0.013 19.2 0.195 0.56 7.1 18 195.87<br />
7.1<br />
7<br />
26.1 0.039 17.8 0.328 0.58 7.1 18 103.04<br />
26.2 0.012 16.6 0.461 0.8 7.1 18 85.9<br />
26.9 0.014 17.7 0.388 0.76 7.2 18 94.23<br />
25.8 0.017 18.1 0.371 1.8 7.1 18 287.04<br />
25.7 0.025 17.7 1.9 2.6 7.1 18 518.02<br />
7.2<br />
7.1<br />
25.3 0.036 16 1.99 2.8 6.9 22 387.76<br />
25.2 0.016 15.4 2.02 2.5 7.1 17 238.86<br />
25.5 0.016 15.5 2.05 2.7 7.1 18 531.07<br />
25.3 0.018 16.2 2.31 3 7.2 18 663.65<br />
25 0.022 16.4 3.05 3.7 7.2 19 724.17<br />
7.1<br />
7.2<br />
17.3 3 7.1<br />
15.9 2.2 7.2<br />
16.8 3.3 7.3<br />
14.3 0.11 1.4 7<br />
23.5 0.063 14.4
Date Day of Wk<br />
4/25/07 Wednesday<br />
4/26/07 Thursday<br />
4/27/07 Friday<br />
4/28/07 Saturday<br />
4/29/07 Sunday<br />
4/30/07 Monday<br />
Mean<br />
Standard Deviation<br />
Min<br />
Max<br />
No. of Samples<br />
* Not included in statistics<br />
MCES Seneca Plant Final Effluent Sampling Results<br />
<strong>Recycling</strong> <strong>Treated</strong> <strong>Municipal</strong> <strong>Wastewater</strong> <strong>for</strong> <strong>Industrial</strong> <strong>Water</strong> <strong>Use</strong><br />
Magnesium Manganese Nitrate Nitrite Ortho P TP pH Silica Sulfate<br />
mg/L mg/L mg/L mg/L mg/L mg/L mg/L mg/L<br />
16.1 0.03 0.85 7.1<br />
14.2 0.08 0.91 7.1<br />
7.2<br />
7.1<br />
15.3
Date Day of Wk<br />
10/8/06 Sunday<br />
10/9/06 Monday<br />
10/10/06 Tuesday<br />
10/11/06 Wednesday<br />
10/12/06 Thursday<br />
10/13/06 Friday<br />
10/14/06 Saturday<br />
10/15/06 Sunday<br />
10/16/06 Monday<br />
10/17/06 Tuesday<br />
10/18/06 Wednesday<br />
10/19/06 Thursday<br />
10/20/06 Friday<br />
10/21/06 Saturday<br />
10/22/06 Sunday<br />
10/23/06 Monday<br />
10/24/06 Tuesday<br />
10/25/06 Wednesday<br />
10/26/06 Thursday<br />
10/27/06 Friday<br />
10/28/06 Saturday<br />
10/29/06 Sunday<br />
10/30/06 Monday<br />
10/31/06 Tuesday<br />
4/1/07 Sunday<br />
4/2/07 Monday<br />
4/3/07 Tuesday<br />
4/4/07 Wednesday<br />
4/5/07 Thursday<br />
4/6/07 Friday<br />
4/7/07 Saturday<br />
4/8/07 Sunday<br />
4/9/07 Monday<br />
4/10/07 Tuesday<br />
4/11/07 Wednesday<br />
4/12/07 Thursday<br />
4/13/07 Friday<br />
4/14/07 Saturday<br />
4/15/07 Sunday<br />
4/16/07 Monday<br />
4/17/07 Tuesday<br />
4/18/07 Wednesday<br />
4/19/07 Thursday<br />
4/20/07 Friday<br />
4/21/07 Saturday<br />
4/22/07 Sunday<br />
4/23/07 Monday<br />
4/24/07 Tuesday<br />
MCES Seneca Plant Final Effluent Sampling Results<br />
<strong>Recycling</strong> <strong>Treated</strong> <strong>Municipal</strong> <strong>Wastewater</strong> <strong>for</strong> <strong>Industrial</strong> <strong>Water</strong> <strong>Use</strong><br />
Temp (Inf)<br />
Total<br />
coli<strong>for</strong>m TKN TDS TOC TSS Turbidity<br />
Deg C mpn/100ml mg/L mg/L mg/L mg/L NTU<br />
1460 8.6 ~2 3<br />
1150 7.5 ~2 2<br />
1400 8.2 ~2 3<br />
1310 8 ~1 3<br />
3973<br />
1670<br />
1070 7.4 ~2 3<br />
917 8.5 3 3<br />
3466 900 8.5 3 2<br />
3973 910 9 ~2 3<br />
1070 8.6 ~2 3<br />
1560 9.2 3 3<br />
1400 9.3 4 3<br />
1120 7.9 3 3<br />
1570 9.2 ~2 3<br />
>4839 1840 8.9 ~3 3<br />
1960 9.4 ~2 2<br />
3719<br />
3<br />
6<br />
8812 ~2<br />
16 3.6 5<br />
18 3.4 1130 7.3 ~3 2<br />
17 4 3<br />
16 4.1 1720 7.8 3 2<br />
16 3.5 1740 7.7 4 2<br />
15.5 >2420<br />
15.5<br />
15.7 3.9 1140 7.6 4 2<br />
16 106 3.7 1090 7.4 3 2<br />
15.8 1986 4.1 ~2<br />
18 649 4.8 1580 8.2 ~3 3<br />
16 >2420 3.8 4<br />
16.5 2420<br />
16.8<br />
16.9 3.9 1270 9.3 3 2<br />
17 313 4.2 1250 9 ~2 3<br />
17.4 261 4.2 ~2<br />
17.2 866 4.3 3<br />
17.4 >2420 4.5 1090 9.6 3 3<br />
17<br />
17<br />
16.9 4.4 5<br />
17 4.4 1500 7.8 4 5<br />
17 4.2 3<br />
MCES WWTP Effluent Quality_Seneca_Fall 2006 & Spring 2007_0707.xls, Seneca Data Page 7 of 8
Date Day of Wk<br />
4/25/07 Wednesday<br />
4/26/07 Thursday<br />
4/27/07 Friday<br />
4/28/07 Saturday<br />
4/29/07 Sunday<br />
4/30/07 Monday<br />
Mean<br />
Standard Deviation<br />
Min<br />
Max<br />
No. of Samples<br />
* Not included in statistics<br />
MCES Seneca Plant Final Effluent Sampling Results<br />
<strong>Recycling</strong> <strong>Treated</strong> <strong>Municipal</strong> <strong>Wastewater</strong> <strong>for</strong> <strong>Industrial</strong> <strong>Water</strong> <strong>Use</strong><br />
Temp (Inf)<br />
Total<br />
coli<strong>for</strong>m TKN TDS TOC TSS Turbidity<br />
Deg C mpn/100ml mg/L mg/L mg/L mg/L NTU<br />
17 272 4.5 3<br />
17<br />
16.8<br />
16.5<br />
6 3<br />
17 4.9 5<br />
18 3.8 7<br />
16.73 2491 4.19 1325.88 8.40 3.10 2.72<br />
0.70 2175 0.56 299.35 0.73 1.22 0.68<br />
15.5 106 3.4 900 7.3 1 2<br />
18 8812 6 1960 9.6 7 5<br />
30 18 22 25 25 40 25<br />
MCES WWTP Effluent Quality_Seneca_Fall 2006 & Spring 2007_0707.xls, Seneca Data Page 8 of 8
Metropolitan Council<br />
<strong>Recycling</strong> <strong>Treated</strong> <strong>Municipal</strong><br />
<strong>Wastewater</strong> <strong>for</strong> <strong>Industrial</strong> <strong>Water</strong> <strong>Use</strong><br />
LCMR05-07d<br />
MCES Project Number 070186<br />
TECHNICAL MEMORANDUM 3<br />
Recycled <strong>Wastewater</strong> System<br />
Components and Costs<br />
June 14, 2007<br />
Craddock Consulting Engineers<br />
In Association with<br />
CDM and James Crook
Contents<br />
Section 1 – Introduction<br />
1.1 Objectives...................................................................................................................... 1<br />
1.2 Memorandum Contents.............................................................................................. 1<br />
Section 2 – <strong>Water</strong> Reuse System Components<br />
2.1 Overview ..................................................................................................................... 2<br />
2.2 Basis <strong>for</strong> this Study ..................................................................................................... 3<br />
2.3 Conceptual Model ...................................................................................................... 3<br />
Section 3 – Treatment<br />
3.1 <strong>Industrial</strong> <strong>Water</strong> Quality Requirements .................................................................. 5<br />
3.1.1 Regulatory Requirements ........................................................................... 5<br />
3.1.2 <strong>Use</strong>r-Specific Requirements ........................................................................ 6<br />
3.2 <strong>Water</strong> Reuse Treatment Technologies ...................................................................... 7<br />
3.2.1 Overview ........................................................................................................ 7<br />
3.2.2 Enhanced Suspended and Dissolved Solids Removal<br />
(Chemical Addition/Softening) .................................................................. 9<br />
3.2.3 Residual Suspended and Colloidal Solids Removal (Filtration) .......... 10<br />
3.2.4 Residual Dissolved Solids Removal (Demineralization/Softening).... 13<br />
3.2.5 Residual and Specific Trace Constituent Removal<br />
(Multiple Processes) ................................................................................... 15<br />
3.2.6 Disinfection (Microorganism Removal /Inactivation) .......................... 17<br />
3.3 <strong>Municipal</strong> WWTP Processes and <strong>Water</strong> Quality .................................................. 18<br />
3.3.1 Overview ...................................................................................................... 18<br />
3.3.2 Base WWTP Definition and Effluent Quality.......................................... 18<br />
3.3.3 Base WWTP Unit Processes ....................................................................... 19<br />
3.4 Selection of <strong>Water</strong> Reuse Treatment Technologies <strong>for</strong> Specific <strong>Industrial</strong><br />
<strong>Water</strong> <strong>Use</strong>s ................................................................................................................. 22<br />
3.4.1 Factors to Consider ..................................................................................... 22<br />
3.4.2 Technologies by Target Constituent......................................................... 22<br />
3.4.3 Treatment Technologies <strong>for</strong> Minnesota Industry Reuse<br />
Applications............................................................................................... 23<br />
Section 4 – Storage and Transmission<br />
4.1 Overview .................................................................................................................... 27<br />
4.2 Storage......................................................................................................................... 27<br />
4.3 Pumping...................................................................................................................... 28<br />
4.4 Transmission Pipelines ............................................................................................. 28<br />
Craddock Consulting Engineers i<br />
In Association with CDM & James Crook
Section 5 – Costs<br />
Table of Contents<br />
TM3: Recycled <strong>Wastewater</strong> System Components and Costs<br />
<strong>Recycling</strong> <strong>Treated</strong> <strong>Municipal</strong> <strong>Wastewater</strong> <strong>for</strong> <strong>Industrial</strong> <strong>Water</strong> <strong>Use</strong><br />
5.1 Overview ................................................................................................................... 28<br />
5.2 Cost Basis and Assumptions.................................................................................... 29<br />
5.3 Cost Model.................................................................................................................. 30<br />
5.4 Base <strong>Water</strong> Reuse System Costs .............................................................................. 31<br />
5.4.1 Treatment ..................................................................................................... 31<br />
5.4.2 Storage .......................................................................................................... 31<br />
5.4.3 Pump Station................................................................................................ 31<br />
5.4.4 Transmission Piping ................................................................................... 32<br />
Capital Costs................................................................................................... 32<br />
O&M Costs ..................................................................................................... 33<br />
5.4.5 Base <strong>Water</strong> Reuse System Cost Analysis Results ................................... 34<br />
5.5 Storage System Costs ................................................................................................ 35<br />
5.6 Alternative <strong>Water</strong> Reuse System Costs .................................................................. 35<br />
5.6.1 Overview ...................................................................................................... 35<br />
5.6.2 Tertiary 1-Conventional ............................................................................. 36<br />
5.6.3 Tertiary 2-Membrane Filtration................................................................. 37<br />
5.6.4 Tertiary 3-Membrane Softening ................................................................ 37<br />
5.6.5 Tertiary 4-Advanced................................................................................... 38<br />
5.6.6 Treatment Cost Summary .......................................................................... 40<br />
5.7 Cost Summary............................................................................................................. 41<br />
Section 6 – References<br />
Appendices<br />
Appendix A: <strong>Water</strong> Reuse Regulatory Exhibits<br />
Appendix B: Transmission System Cost Analysis<br />
Appendix C: <strong>Water</strong> Reuse System Cost Model<br />
Base System Cost of Service Summary Tables<br />
Appendix D: <strong>Water</strong> Reuse System Alternative Quality Supplies<br />
Cost of Service Summary In<strong>for</strong>mation and<br />
Treatment Process Schematics<br />
Craddock Consulting Engineers ii<br />
In Association with CDM & James Crook
Technical Memorandum 3<br />
Recycled <strong>Wastewater</strong> System Components<br />
and Costs<br />
1.0 Introduction<br />
This technical memorandum is the third in a series of memoranda developed under a<br />
Metropolitan Council (Council) project titled “<strong>Recycling</strong> <strong>Treated</strong> <strong>Municipal</strong><br />
<strong>Wastewater</strong> <strong>for</strong> <strong>Industrial</strong> <strong>Water</strong> <strong>Use</strong>.” Funding <strong>for</strong> this project was recommended by<br />
the Legislative Commission on Minnesota Resources (LCMR) from the Minnesota<br />
Environment and Natural Resources Trust Fund. The Met Council is providing<br />
additional funding <strong>for</strong> the project through in-kind contributions of staff time. Other<br />
state agencies are participating via stakeholder meetings and technical review and<br />
input.<br />
The terms “recycled wastewater”, “water reuse”, and “reclaimed water” are<br />
synonymous and used interchangeably in this document and related project documents.<br />
1.1 Objectives<br />
There are three main objectives of this memorandum:<br />
Provide an overview of water reuse system components and the various<br />
technologies to treat wastewater effluent <strong>for</strong> a range of industrial water uses.<br />
Define water reuse system components and technologies as the basis <strong>for</strong> the<br />
estimation of the cost of service to supply reclaimed water to Minnesota<br />
industries.<br />
Estimate the water reuse system costs to provide a base level of water quality and<br />
alternative quality water supplies to industries.<br />
1.2 Memorandum Contents<br />
The memorandum is structured to provide overview in<strong>for</strong>mation as a context <strong>for</strong><br />
assumptions made to define water reuse systems serving Minnesota industries and<br />
the associated costs. A “base” level water quality is established, which in turn defines<br />
the treatment processes required, and with other system component assumptions<br />
<strong>for</strong>m a “base water reuse system” (base system). Costs are developed <strong>for</strong> the base<br />
system and alternatives to meet a range of water quality goals. The memorandum is<br />
organized by the following subsections:<br />
<strong>Water</strong> Reuse System Components<br />
o Identifies the basic equipment and structures in a water reuse system.<br />
o Establishes a conceptual model that this study uses as a basis <strong>for</strong> the costs<br />
estimated <strong>for</strong> a water reuse system.<br />
Craddock Consulting Engineers 1<br />
In Association with CDM & James Crook<br />
TM3-Component&Costs_0707
TM3: Recycled <strong>Wastewater</strong> System Components and Costs<br />
<strong>Recycling</strong> <strong>Treated</strong> <strong>Municipal</strong> <strong>Wastewater</strong> <strong>for</strong> <strong>Industrial</strong> <strong>Water</strong> <strong>Use</strong><br />
Treatment<br />
o Defines the water quality requirements <strong>for</strong> industrial water uses and to meet<br />
regulatory requirements.<br />
o Provides an overview of treatment technologies to meet reclaimed water<br />
quality requirements.<br />
o Establishes the wastewater treatment plant (WWTP) processes <strong>for</strong> a “base”<br />
level of treatment.<br />
o Identifies treatment technologies <strong>for</strong> specific industrial uses, with a focus on<br />
those with optimum application in Minnesota.<br />
Storage and Transmission<br />
o Provides an overview of considerations <strong>for</strong> storage, pumping, and<br />
transmission piping in a water reuse system.<br />
o Defines the assumptions used to establish storage and transmission costs.<br />
Costs<br />
o Defines the financial criteria, other cost assumptions, and describes the cost<br />
model developed <strong>for</strong> this study.<br />
o Presents the cost of service <strong>for</strong> a “base system” and alternative reclaimed<br />
water quality supplies.<br />
o Summarizes the cost in<strong>for</strong>mation and relevance to implementation of water<br />
reuse systems with industries in Minnesota.<br />
2.0 <strong>Water</strong> Reuse System Components<br />
2.1 Overview<br />
<strong>Water</strong> reuse systems are generally categorized as a centralized system, satellite system<br />
or decentralized system. In a centralized water reuse system, all wastewater flow is<br />
collected and treated at a central WWTP and distributed to customers from this<br />
facility. In a satellite system, a portion of the raw wastewater is diverted to a separate<br />
facility <strong>for</strong> treatment and distribution of reclaimed water. The sludge and waste<br />
streams from the satellite treatment facility may be directed back to the collection<br />
system <strong>for</strong> treatment at the main WWTP. Satellite systems are typically located in the<br />
upper reaches of the service area where there is a concentrated demand <strong>for</strong> reclaimed<br />
water. Satellite systems provide the reclaimed supply in close proximity to the<br />
customer and avoid the longer transmission mains required to supply water from the<br />
central WWTP, plus free up capacity in the collection system and central WWTP.<br />
Decentralized systems consist of the collection, treatment, and reuse of wastewater<br />
from individual homes, isolated communities, industries, institutional facilities, or<br />
portions of existing communities near the point of wastewater generation. Treatment<br />
of the wastewater and management of sludge and waste streams is all onsite and is<br />
separate from a central collection and treatment system (Metcalf & Eddy, 2007). These<br />
three configurations are illustrated in Figure 1.<br />
2 Craddock Consulting Engineers<br />
In Association with CDM & James Crook<br />
TM3-Component&Costs_0707
<strong>Wastewater</strong><br />
collection<br />
system<br />
Diversion from<br />
Collection System<br />
Return of Sludge<br />
& Waste Streams<br />
<strong>Water</strong><br />
Reclamation<br />
Facility<br />
Solids Residuals<br />
Central<br />
WWTP<br />
Solids Residuals<br />
<strong>Water</strong><br />
Reclamation<br />
Facility<br />
Central<br />
WWTP<br />
Solids Residuals<br />
Central<br />
WWTP<br />
Solids Residuals<br />
Centralized System<br />
Reclaimed <strong>Water</strong><br />
to Reuse Sites<br />
Effluent Discharge<br />
Satellite System<br />
Reclaimed <strong>Water</strong><br />
to Reuse Sites<br />
Effluent Discharge<br />
Decentralized System<br />
Reclaimed <strong>Water</strong><br />
to Reuse Sites<br />
Effluent Discharge<br />
Figure 1. <strong>Water</strong> Reuse System Configurations
TM3: Recycled <strong>Wastewater</strong> System Components and Costs<br />
<strong>Recycling</strong> <strong>Treated</strong> <strong>Municipal</strong> <strong>Wastewater</strong> <strong>for</strong> <strong>Industrial</strong> <strong>Water</strong> <strong>Use</strong><br />
There are four main components of a typical water reuse system, regardless of the<br />
system configuration: treatment, pumping, storage, and transmission pipelines.<br />
Storage needs depend heavily on the demand patterns of the customer. Some systems<br />
may not require separate reclaimed water storage facilities because the wastewater<br />
treatment facility has a base wastewater flow greater than the reuse demand or<br />
internal process storage to meet the demand. Storage at or near the point of use can be<br />
used to reduce the size of pumping and transmission facilities (associated with capital<br />
costs) by avoiding the need to pump at peak demand flow rates.<br />
For centralized treatment, an existing WWTP may or may not need additional<br />
treatment facilities, depending on the water quality requirements of the reclaimed<br />
water user(s). For a new WWTP, the quality requirements <strong>for</strong> reclaimed water can be<br />
incorporated into the design, and also into the siting of the facility to account <strong>for</strong> the<br />
transmission costs of the reclaimed water. New treatment facilities will be required<br />
<strong>for</strong> satellite and decentralized systems.<br />
All system types will require pumping and transmission piping, with centralized<br />
systems typically requiring longer transmission pipelines.<br />
2.2 Basis <strong>for</strong> this Study<br />
The technologies used to treat and convey water are similar <strong>for</strong> the centralized,<br />
satellite, and decentralized systems. The system model used in this study to estimate<br />
reclaimed system costs typifies the centralized system configuration. The reuse<br />
system starts with the final effluent of an existing municipal WWTP and the end point<br />
is an industry with a specific water supply quantity and quality requirement.<br />
Transmission distances of 1 to 10 miles are evaluated. Satellite systems will have<br />
similar facilities, but the longer transmission distances are not as likely to be<br />
applicable. Decentralized systems will require considerations <strong>for</strong> solids residual<br />
handling, which is assumed to be processed at the WWTP <strong>for</strong> centralized and satellite<br />
systems.<br />
It is important to note that many industries already reuse water from their onsite<br />
industrial wastewater treatment systems. In most instances, onsite treatment is the<br />
cost-effective alternative <strong>for</strong> those with sufficient space <strong>for</strong> new facilities and qualified<br />
staff to operate the treatment systems. In addition, many industries also treat their<br />
water supply prior to specific uses, such as <strong>for</strong> boiler feed water. The technologies<br />
presented in this memorandum are also generally applicable to treatment of an<br />
industrial wastewater and/or water supply.<br />
2.3 Conceptual Model<br />
A basic model of a water reuse or reclaimed water system includes facilities, as<br />
depicted in Figure 2, and noted by the component number (1-7) on the schematic:<br />
Craddock Consulting Engineers 3<br />
In Association with CDM & James Crook<br />
TM3-Component&Costs_0707
TM3: Recycled <strong>Wastewater</strong> System Components and Costs<br />
<strong>Recycling</strong> <strong>Treated</strong> <strong>Municipal</strong> <strong>Wastewater</strong> <strong>for</strong> <strong>Industrial</strong> <strong>Water</strong> <strong>Use</strong><br />
Treatment of WWTP Effluent (1)<br />
o New processes in addition to existing WWTP unit processes, if needed.<br />
These processes can be sized <strong>for</strong> the portion of the plant flow serving<br />
water reuse customers.<br />
o New WWTP processes to replace existing processes during a plant<br />
upgrade, such as membrane filtration which replaces clarification.<br />
Additional Disinfection (2)<br />
o A residual disinfectant is often used in the transmission system to<br />
minimize bacterial growth. Chlorine is assumed <strong>for</strong> this study.<br />
o Additional disinfection is required <strong>for</strong> year-round disinfection and<br />
more stringent pathogen limits. The existing facilities may be able to<br />
achieve this, but it is assumed new equipment is required.<br />
Non-Seasonal Storage (3)<br />
o In some instances, storage will be required to balance the diurnal or<br />
other WWTP flow variations, with the requirements of a specific<br />
industrial demand <strong>for</strong> different peak hour, weekly or other dominant<br />
demand patterns.<br />
o Storage will likely be required <strong>for</strong> WWTPs that reclaim over 50 percent<br />
of their flow. Smaller facilities, with less equalization capacity, are<br />
more likely to need storage.<br />
o This model assumes no seasonal storage requirements.<br />
Pump Station (4)<br />
o A pump station located onsite at the WWTP.<br />
o Assumes delivery of supply to industry at 40 psi and same elevation as<br />
the WWTP.<br />
Reclaimed <strong>Water</strong> Transmission System (5)<br />
o Transmission main and branch transmission lines supplying water to<br />
industrial users of reclaimed water.<br />
o Variable flows and distances.<br />
Booster Pumps (6)<br />
o Some industries may require booster pumps depending on their<br />
location and delivery pressure requirements.<br />
o Industries A-D shown on the schematic represent potential<br />
configurations <strong>for</strong> pumping and treatment facilities not located on the<br />
WWTP site (either at the industry or in the conveyance system).<br />
<strong>Industrial</strong> Site Treatment (7)<br />
o Some industries already treat their existing supply (ground or surface<br />
water withdrawals or a potable supply) to meet specific water quality<br />
requirements. These same processes or modifications may be required<br />
with a reclaimed supply.<br />
o Some industries may require new treatment processes with a reclaimed<br />
supply. This may be the most cost-effective approach if there are<br />
multiple users in a system with different water quality requirements.<br />
4 Craddock Consulting Engineers<br />
In Association with CDM & James Crook<br />
TM3-Component&Costs_0707
WWTP<br />
1 -<br />
2 -<br />
3 -<br />
4 -<br />
5 -<br />
1<br />
Treatment<br />
Existing Facilities<br />
Potential New Facilities<br />
New or Refurbished Facilities<br />
2<br />
Additional<br />
Disinfection<br />
Non-<br />
Seasonal<br />
Storage<br />
Additional treatment processes to meet industrial<br />
water supply requirements<br />
Additional disinfection <strong>for</strong> reclaimed regulatory limits<br />
and residual in the transmission system<br />
Storage <strong>for</strong> smaller WWTPs and where industrial<br />
demand does not match WW flow<br />
Pump station to supply industries<br />
Reclaimed water transmission main and branch<br />
transmission lines<br />
3<br />
4<br />
5<br />
Pump Station<br />
Industry A<br />
Industry C<br />
Industry B<br />
WWTP Site Transmission<br />
Area/Industry Site<br />
6 -<br />
7 -<br />
6<br />
7<br />
Treatment<br />
Treatment<br />
Industry D<br />
Booster pump <strong>for</strong> transmission<br />
to some industries<br />
Industry on-site treatment<br />
Schematic shows possible<br />
combination of facilities <strong>for</strong><br />
Industries A-D supplied from<br />
reclaimed water transmission<br />
main line<br />
Figure 2. <strong>Water</strong> Reuse System Conceptual Model
3.0 Treatment<br />
3.1 <strong>Industrial</strong> <strong>Water</strong> Quality Requirements<br />
TM3: Recycled <strong>Wastewater</strong> System Components and Costs<br />
<strong>Recycling</strong> <strong>Treated</strong> <strong>Municipal</strong> <strong>Wastewater</strong> <strong>for</strong> <strong>Industrial</strong> <strong>Water</strong> <strong>Use</strong><br />
There are two water quality drivers that affect the treatment requirements <strong>for</strong><br />
reclaimed water:<br />
The regulatory requirements which are typically <strong>for</strong> the protection of public<br />
health and the environment and focus on microbiological parameters.<br />
The user-specific requirements <strong>for</strong> the water supply, which in the case of<br />
industries is a very specific set of water quality criteria <strong>for</strong> a given facility.<br />
3.1.1 Regulatory Requirements<br />
Reclaimed water <strong>for</strong> industrial use in Minnesota is currently required to meet<br />
regulatory limits based on the Cali<strong>for</strong>nia <strong>Water</strong> <strong>Recycling</strong> Criteria, Title 22 Cali<strong>for</strong>nia<br />
Code of Regulations (Title 22). The complete list of criteria is included in Appendix A,<br />
Exhibit 1. The criteria specific to industrial applications (excluding any irrigation uses)<br />
are listed in Table 1. The Minnesota Pollution Control Agency (MPCA) handles<br />
permitting recycled wastewater as part of the National Pollutant Discharge<br />
Elimination System (NPDES) permit process. The MPCA establishes recycled<br />
wastewater water quality criteria on a case-by-case basis and bases its assessment on<br />
the Title 22 criteria. There<strong>for</strong>e, the Title 22 criteria will serve as the basis <strong>for</strong> selection<br />
of treatment technologies to meet regulatory requirements in this study.<br />
Table 1. Cali<strong>for</strong>nia <strong>Water</strong> <strong>Recycling</strong> Criteria (<strong>Industrial</strong> <strong>Use</strong>s)<br />
Type of <strong>Use</strong><br />
Total Coli<strong>for</strong>m<br />
Limits<br />
Treatment<br />
Required<br />
Cooling water where no mist created<br />
≤ 23/100 ml<br />
Process water where no worker contact<br />
Boiler feed<br />
Mixing concrete<br />
1<br />
≤ 240/100 ml<br />
Secondary<br />
(max in any 30- Disinfection<br />
day period)<br />
Cooling water where mist created 2<br />
Process water where worker contact<br />
likely<br />
≤ 2.2/100 ml 1<br />
≤ 23/100 ml<br />
(max in any 30day<br />
period)<br />
Secondary<br />
Coagulation 3<br />
Filtration<br />
Disinfection<br />
Source: Adapted from State of Cali<strong>for</strong>nia [2000a].<br />
1<br />
Based on running 7-day median; daily sampling is required.<br />
2<br />
Drift eliminator required; chlorine or other biocide required to treat cooling water to control Legionella<br />
and other microorganisms.<br />
3<br />
Not required under certain conditions.<br />
Craddock Consulting Engineers 5<br />
In Association with CDM & James Crook<br />
TM3-Component&Costs_0707
TM3: Recycled <strong>Wastewater</strong> System Components and Costs<br />
<strong>Recycling</strong> <strong>Treated</strong> <strong>Municipal</strong> <strong>Wastewater</strong> <strong>for</strong> <strong>Industrial</strong> <strong>Water</strong> <strong>Use</strong><br />
In addition to the specific constituent limits established by the Title 22 criteria, which<br />
are only <strong>for</strong> total coli<strong>for</strong>m, there are also best practices that must be employed <strong>for</strong><br />
specific uses. Title 22 defines the water quality/treatment technology criteria applied<br />
to reclaimed water <strong>for</strong> industrial uses under two general categories:<br />
Disinfected secondary-23 recycled water (secondary-23 recycled water)<br />
Disinfected tertiary recycled water (tertiary recycled water)<br />
Secondary-23 recycled water is wastewater processed through a secondary treatment<br />
system that is disinfected to meet a total coli<strong>for</strong>m limit of 23/100 ml, based on a<br />
running 7-day median, and does not exceed 240/100 ml total coli<strong>for</strong>ms in any 30-day<br />
period. There are no specific treatment requirements following secondary treatment<br />
or <strong>for</strong> disinfection practices. Any technologies employed must be on the Title 22<br />
approved list or demonstrated to be effective as defined in the regulations. Appendix<br />
A, Exhibit 2 contains the list of approved technologies.<br />
Tertiary recycled water must meet a total coli<strong>for</strong>m limit of 2.2/100 ml, based on a<br />
running 7-day median, and cannot exceed 23/100 ml total coli<strong>for</strong>ms in any 30-day<br />
period. The secondary treatment system effluent must be filtered using any Title 22<br />
approved filtration technology. Disinfection by chlorination requires a 90-minute<br />
contact time, based on peak dry weather design flow, with a dose that provides a CT<br />
(the product of total chlorine residual and modal contact time measured at the same<br />
point) value of not less than 450 mg-min/l at all times. Other disinfection processes,<br />
when combined with the filtration process, must demonstrate inactivation and/or<br />
removal of 99.999 percent of the plaque-<strong>for</strong>ming units of F-specific bacteriophage<br />
MS2, or polio virus in the wastewater. A virus that is at least as resistant to<br />
disinfection as polio virus may be used <strong>for</strong> purposes of the demonstration. In<br />
addition, if the tertiary recycled water is used as cooling water in a process with<br />
cooling towers or other equipment that produces a mist, a drift eliminator and use of<br />
chlorine or a biocide to control Legionella and other microorganisms are required.<br />
3.1.2 <strong>Use</strong>r-Specific Requirements<br />
The total coli<strong>for</strong>m limits imposed by the Title 22 regulations are the regulatory criteria<br />
assumed <strong>for</strong> all Minnesota industrial reclaimed water uses. The other water quality<br />
criteria that will drive the treatment process selection will vary with the specific use of<br />
the water. These use-specific criteria do not need to meet a regulatory permit limit,<br />
but would likely be listed as site-specific water quality standards in a user agreement.<br />
Generalized water quality limits <strong>for</strong> various industrial uses are provided in Table 2.<br />
While this is a limited list, it is the mid-range of quality expected <strong>for</strong> use by each<br />
industry group listed. Industries such as sand and gravel washing operations would<br />
have less stringent criteria, while electronics production typically requires much more<br />
stringent criteria.<br />
6 Craddock Consulting Engineers<br />
In Association with CDM & James Crook<br />
TM3-Component&Costs_0707
3.2 <strong>Water</strong> Reuse Treatment Technologies<br />
3.2.1 Overview<br />
TM3: Recycled <strong>Wastewater</strong> System Components and Costs<br />
<strong>Recycling</strong> <strong>Treated</strong> <strong>Municipal</strong> <strong>Wastewater</strong> <strong>for</strong> <strong>Industrial</strong> <strong>Water</strong> <strong>Use</strong><br />
Treatment requirements <strong>for</strong> specific industrial reuse applications are based on<br />
multiple factors including: the quality of the source water used by a community,<br />
chemicals discharged to the WWTP, the WWTP’s existing process train, water reuse<br />
regulations, the intended use of the water by the industry, and the quantity of water<br />
reclaimed at an individual facility. The treatment technology selected will depend in<br />
part on whether treatment is incorporated at the centralized WWTP, onsite at the<br />
industry, or at a satellite facility along the distribution line. If storage is required,<br />
additional treatment may be required <strong>for</strong> algae growth and by-products and <strong>for</strong><br />
residual disinfection. With all these variables, the treatment process and transmission<br />
system selected is a site and case-specific one.<br />
Treatment process requirements <strong>for</strong> reclaimed water beyond standard secondary<br />
treatment processes can be categorized by the target parameter (adapted from Metcalf<br />
& Eddy, 2007):<br />
Enhanced suspended and dissolved solids removal (chemical addition/softening)<br />
Residual suspended solids removal (filtration)<br />
Residual colloidal solids removal (membrane filtration)<br />
Residual dissolved solids removal (demineralization/softening)<br />
Residual and specific trace constituent removal (multiple processes)<br />
Disinfection (microorganim removal/inactivation)<br />
The relationship of various treatment technologies that can be used to achieve a<br />
desired reclaimed water quality is depicted in Figure 3. The treatment process<br />
schematic assumes a WWTP secondary effluent as the beginning point of the<br />
treatment train. The schematic shows the potential use of one or more of the<br />
processes targeting a specific parameter. A treatment train would consist of several of<br />
the processes shown, but would not include all processes shown.<br />
The effluent quality of various treatment trains is compared in Table 3 to provide a<br />
perspective on the additional removals obtained with different levels of treatment.<br />
Secondary effluent from an activated sludge facility with and without nutrient<br />
removal are listed in the first two columns of the table and represent a quality <strong>for</strong><br />
non-contact industrial activities without concern <strong>for</strong> hardness and dissolved solids.<br />
An example industrial water use application <strong>for</strong> secondary treatment water is sand<br />
and gravel washing operations or site dust control. Advanced secondary treatment<br />
water, which has reduced levels of phosphorus and ammonia, could be used <strong>for</strong><br />
cooling water purposes if the hardness and dissolved salt concentrations are not too<br />
high or an industry provides their own additional onsite treatment. For these process<br />
Craddock Consulting Engineers 7<br />
In Association with CDM & James Crook<br />
TM3-Component&Costs_0707
TM3: Recycled <strong>Wastewater</strong> System Components and Costs<br />
<strong>Recycling</strong> <strong>Treated</strong> <strong>Municipal</strong> <strong>Wastewater</strong> <strong>for</strong> <strong>Industrial</strong> <strong>Water</strong> <strong>Use</strong><br />
trains (referring to Figure 3) the only processes required would be the disinfection<br />
process to meet regulatory standards (<strong>for</strong> health effects) <strong>for</strong> micororgansims.<br />
Table 3. Typical <strong>Wastewater</strong> Treatment Plant Effluent Quality 1<br />
Constituent Secondary<br />
Treatment<br />
Effluent Constituent Concentration by Treatment Level<br />
Advanced<br />
Secondary<br />
Treatment 2<br />
(Base WWTP)<br />
AST with<br />
Filtration 3<br />
AST with<br />
Chemical<br />
Addition<br />
&<br />
Filtration 4<br />
Membrane<br />
Bioreactor 5<br />
Advanced<br />
Tertiary<br />
Processes 6<br />
BOD, mg/L 5-20 5-10
Secondary<br />
Treatment<br />
Assumptions<br />
Suspended,<br />
Colloidal &<br />
Dissolved<br />
Solids<br />
Removal<br />
Residual<br />
Suspended<br />
Solids<br />
Removal<br />
Residual<br />
Colloidal<br />
Solids<br />
Removal<br />
Residual<br />
Dissolved<br />
Solids<br />
Removal<br />
Residual and<br />
Specific Trace<br />
Constituent<br />
Removal<br />
Disinfection<br />
Adapted from Metcalf & Eddy, 2007<br />
Conventional Secondary Treatment<br />
Facility with Nutrient Removal<br />
(Base WWTP)<br />
Microfiltration Depth<br />
Filtration<br />
Coagulation/Flocculation/<br />
Sedimentation<br />
Surface<br />
Filtration<br />
Microfiltration Ultrafiltration<br />
Membrane Secondary Treatment<br />
Facility with Nutrient Removal<br />
Dissolved Air<br />
Flotation<br />
Nanofiltration Reverse Osmosis Electrodialysis<br />
Ion Exchange Carbon Adsorption Advanced Oxidation<br />
Chlorination Ultraviolet Radiation Ozone<br />
Residual Disinfection<br />
<strong>Water</strong> to Reuse Customer<br />
Figure 3. Schematic of Available Treatment Technologies <strong>for</strong> <strong>Water</strong> Reuse
TM3: Recycled <strong>Wastewater</strong> System Components and Costs<br />
<strong>Recycling</strong> <strong>Treated</strong> <strong>Municipal</strong> <strong>Wastewater</strong> <strong>for</strong> <strong>Industrial</strong> <strong>Water</strong> <strong>Use</strong><br />
dissolved salts. The sedimentation process would be followed by filtration and<br />
disinfection. Another alternative is a microfiltration process followed by membrane<br />
softening, which could also serve industries that need nearly complete removal of<br />
dissolved salts, as with boiler feed water. Removal of dissolved salts can also be<br />
handled with an ion exchange unit process after a softening/filtration process.<br />
A secondary membrane WWTP (membrane bioreactor) would be an option <strong>for</strong> a new<br />
or expanding WWTP that expects a significant reclaimed water use. Disinfection<br />
requirements would be less and the majority of other constituents are markedly lower<br />
than with conventional secondary treatment. Trace constituent removal can also be<br />
achieved with carbon adsoprtion and advanced oxidation processes, as discussed in<br />
subsequent sections.<br />
If Minnesota continues to adhere to the Title 22 Cali<strong>for</strong>nia <strong>Water</strong> <strong>Recycling</strong> Criteria<br />
and the reuse application requires a recycled tertiary water (<strong>for</strong> potential human<br />
contact uses such as recycle water in cooling towers), most existing WWTPs would<br />
need to add a filtration process to supply reclaimed water. The requirement <strong>for</strong> a<br />
chemical addition/flocculation/ sedimentation process will be site-specific and in<br />
some cases will depend on the types and size of particles in the secondary effluent<br />
and effectiveness of the disinfection process. Some facilities may include the chemical<br />
addition process system to meet phosphorus removal goals <strong>for</strong> both the NPDES<br />
permit and specific reclaimed water requirements <strong>for</strong> the industry served. The<br />
treatment technologies approved to meet the Title 22 criteria are listed in Appendix A,<br />
Exhibit 2.<br />
The following subsections provide an introduction to unit processes to remove<br />
specific categorical constituents. The technologies presented are principally <strong>for</strong><br />
applications onsite at WWTPs. However, the processes could be used alone or in<br />
combination with treatment facilities on the industrial site, particularly where a single<br />
user has a unique water quality. Package systems (multiple process units) supplied by<br />
manufacturers, applicable to industries with smaller demands and/or to target<br />
specific constituents, are not identified in this study. Some proprietary processes are<br />
identified <strong>for</strong> specific unit processes to present the variety of technologies available.<br />
3.2.2 Enhanced Suspended and Dissolved Solids Removal (Chemical<br />
Addition/Softening)<br />
With hard, high salt waters common in Minnesota, treatment may be required to<br />
lower hardness and dissolved solids in the reclaimed supply to an industry.<br />
Traditional chemical addition/coagulation/flocculation/sedimentation processes can<br />
be used to reduce dissolved solids, as well as remove suspended solids in the effluent.<br />
In addition, a coagulation process may be required to meet the Title 22 regulations <strong>for</strong><br />
process requirements.<br />
If the industrial water demand uses the majority of the municipal effluent generated,<br />
it may be cost-effective to locate the treatment process at the WWTP. Additional<br />
benefits can also be realized by the municipality if the planning <strong>for</strong> a reclaimed<br />
supply coincides with expansion and/or improvements planning to meet new<br />
Craddock Consulting Engineers 9<br />
In Association with CDM & James Crook<br />
TM3-Component&Costs_0707
TM3: Recycled <strong>Wastewater</strong> System Components and Costs<br />
<strong>Recycling</strong> <strong>Treated</strong> <strong>Municipal</strong> <strong>Wastewater</strong> <strong>for</strong> <strong>Industrial</strong> <strong>Water</strong> <strong>Use</strong><br />
discharge limits, notably <strong>for</strong> phosphorus. The WWTP can incorporate a unit process<br />
that optimizes chemical addition <strong>for</strong> phosphorus removal and achieves some other<br />
dissolved solids removal. While lime softening is what is needed <strong>for</strong> hardness<br />
removal; metal salts, the chemical of choice <strong>for</strong> phosphorus removal, can achieve<br />
some reduction in dissolved solids. In addition it provides a polishing step to ensure<br />
that phosphorus concentrations in the reclaimed supply are consistently below 1<br />
mg/L.<br />
The facilities <strong>for</strong> chemical addition through sedimentation can be package or<br />
proprietary systems or designed systems, typically with in-ground tanks. The<br />
proprietary systems are typically more compact and well suited <strong>for</strong> a reduced<br />
footprint. Two process systems commonly used <strong>for</strong> coagulation, flocculation and<br />
sedimentation are the Kruger Actiflo and Infilco Densadeg. For larger flows, it is<br />
likely that specifically designed facilities would be used. The sedimentation process<br />
would be followed by a filtration process, as described in Section 3.2.3.<br />
3.2.3 Residual Suspended and Colloidal Solids Removal (Filtration)<br />
The removal of suspended solids from WWTP secondary effluent is a physical<br />
process typically per<strong>for</strong>med by one of the following technologies: depth filtration,<br />
surface filtration, membrane filtration, and dissolved air flotation (DAF). Membrane<br />
filtration is also used <strong>for</strong> colloidal solids removal.<br />
Depth Filtration<br />
Depth filtration is used in water reuse applications <strong>for</strong> a variety of purposes<br />
including: additional removal of particles <strong>for</strong> more effective disinfection; as part of the<br />
process train following lime softening or chemical precipitation of phosphorus; and as<br />
a pretreatment step <strong>for</strong> additional treatment processes such as membrane filtration,<br />
carbon adsorption or advanced oxidation.<br />
Depth filtration has a long history of use in the treatment of potable water. The same<br />
principles and design features are used in the treatment of wastewater effluent.<br />
Particulate material is removed by passing the water through a filter bed of granular<br />
or compressible filter media. There are a variety of depth filters used <strong>for</strong> reclaimed<br />
water applications (Metcalf & Eddy, 2007; as adapted from Tchobanoglous et al, 2003)<br />
and include:<br />
Conventional downflow – consists of a single, dual or multimedia filter material<br />
(sand and anthracite are most common)<br />
Deep-bed downflow – a deeper bed filter than conventional downflow filters;<br />
allows <strong>for</strong> extended run lengths<br />
Pressure filters – operate as conventional gravity filters, but in a closed vessel<br />
under pressurized conditions achieved by pumping; achieve longer filter runs and<br />
are typically used <strong>for</strong> smaller systems<br />
Proprietary Filters<br />
o Deep-bed upflow continuous backwash<br />
o Pulsed-bed<br />
o Traveling bridge<br />
10 Craddock Consulting Engineers<br />
In Association with CDM & James Crook<br />
TM3-Component&Costs_0707
o Synthetic medium<br />
o Two-stage<br />
Surface Filtration<br />
TM3: Recycled <strong>Wastewater</strong> System Components and Costs<br />
<strong>Recycling</strong> <strong>Treated</strong> <strong>Municipal</strong> <strong>Wastewater</strong> <strong>for</strong> <strong>Industrial</strong> <strong>Water</strong> <strong>Use</strong><br />
Surface filtration has been used <strong>for</strong> the same purposes as depth filtration, with more<br />
specific application in the removal of algae and other suspended solids from<br />
stabilization pond effluents. In surface filtration, particulate matter is removed by<br />
passing water through a filter material, in a mechanical sieving process. Cloth fabrics,<br />
woven metal fabrics, and various synthetic materials have been used as the filter<br />
material. This subsection focuses on the cloth media filters. Membranes and cartridge<br />
filters are also surface filters and are discussed in subsequent subsections.<br />
The cloth media surface filters used are known under the names of Cloth-Media Filter<br />
(CMF), Discfilter (DF), and the diamond cloth-media filter (DCMF). The CMF, by<br />
Aqua-Aerobic Systems under the trademark name AquaDisk, uses either a needle felt<br />
cloth of polyester or a synthetic pile fabric cloth. The cloth covers several disks<br />
mounted vertically in a tank. <strong>Water</strong> flows by gravity from the exterior of the disks<br />
through the filter media to an internal collection system. The DF, by Veolia <strong>Water</strong><br />
Systems under the trademark name Hydrotech, brings water through the central feed<br />
tube and the effluent exits on the exterior of the disks. The cloth screen material is<br />
either polyester or Type 304 or 316 stainless steel. A more recent product on the<br />
market is the DCMF. The cloth filter elements, which have a diamond shaped cross<br />
pattern, are cleaned by a vacuum sweep moving along the length of the filter.<br />
Membrane Filtration<br />
Membrane filtration is a fast-growing sector of the filtration market <strong>for</strong> potable water<br />
treatment, wastewater treatment, and water reuse applications. The number of<br />
potable water systems in the upper Midwest has increased dramatically over the past<br />
decade. Full-scale membrane bioreactor (MBR) WWTPs are also in operation and are<br />
an integral part of the facility planning <strong>for</strong> new and expanding WWTPs in Minnesota.<br />
Factors influencing the use of membranes at WWTPs include: a smaller footprint is<br />
required, a reduction (or elimination) of chemicals or energy use <strong>for</strong> disinfection, and<br />
use of secondary effluent <strong>for</strong> water reuse applications.<br />
Membrane filtration is a general term that encompasses a wide range of filtration<br />
types. The common feature is the use of a thin membrane <strong>for</strong> the purpose of removing<br />
constituents from water. Membrane processes include microfiltration (MF),<br />
ultrafiltration (UF), nanofiltration (NF), reverse osmosis (RO), and electrodialysis<br />
(ED). This subsection focuses on MF and UF as unit processes in place of depth and<br />
surface filtration <strong>for</strong> removal of suspended particulates. NF, RO, and ED are processes<br />
that also remove dissolved solids, as depicted in Figure 4, and discussed in<br />
subsequent sections.<br />
Craddock Consulting Engineers 11<br />
In Association with CDM & James Crook<br />
TM3-Component&Costs_0707
TM3: Recycled <strong>Wastewater</strong> System Components and Costs<br />
<strong>Recycling</strong> <strong>Treated</strong> <strong>Municipal</strong> <strong>Wastewater</strong> <strong>for</strong> <strong>Industrial</strong> <strong>Water</strong> <strong>Use</strong><br />
Table 4. Comparison of Microfiltration/Ultrafiltration to Depth/Surface Filtration 1<br />
Advantages<br />
Better microorganism removal: removes protozoans, cysts, oocysts, and helminthes;<br />
partial removal of bacteria and viruses; could result in lower costs <strong>for</strong> disinfection.<br />
Smaller footprint <strong>for</strong> equipment; typically 50-80 percent less.<br />
As an MBR, can be cost-competitive to conventional secondary treatment processes.<br />
Disadvantages<br />
Higher O&M costs associated with:<br />
o Energy<br />
o Membrane replacement (approximately every 5 yrs)<br />
o Monitoring <strong>for</strong> per<strong>for</strong>mance (membrane integrity testing)<br />
o Residuals handling and disposal of concentrate (<strong>for</strong> some facilities)<br />
Pretreatment may be required to prevent fouling, adding to footprint and overall costs.<br />
Scale <strong>for</strong>mation can lead to problems.<br />
Less flow variation capability.<br />
1Adapted from Metcalf & Eddy, 2007<br />
The DAF process relies on the <strong>for</strong>mation of microbubbles released after air dissolved<br />
under pressure in the water is brought to standard conditions. The bubbles surround<br />
slow-settling particles and float them to the surface. The float layer accumulates solids<br />
and thickens and is removed by mechanical skimming systems. Clarified water is<br />
removed from below the surface.<br />
3.2.4 Residual Dissolved Solids Removal (Demineralization/ Softening)<br />
Reclaimed supplies from areas with traditionally hard source waters and high<br />
dissolved salts may require some type of softening or demineralization process to<br />
meet the requirements of certain industrial water uses. Most of Minnesota’s water<br />
supplies are of medium to high hardness and are higher in dissolved salts. However,<br />
some waters may have an adequate balance of anions and cations and depending on<br />
the use of the water, could be of adequate quality without the need <strong>for</strong> additional<br />
treatment. A complete analysis of the secondary effluent is required to assess the<br />
additional treatment needs. The applicable technologies addressed in this study are<br />
limited to membrane processes and VRTX, a hydrodynamic cavitation process, since<br />
lime softening was summarized in Section 3.2.2. Reuse applications include recycled<br />
cooling water uses and electronics production.<br />
There are two basic membrane separation processes: pressure driven and electrically<br />
driven. Nanofiltration (NF) and reverse osmosis (RO) are pressure driven processes<br />
and require hydrostatic pressure to overcome the osmotic pressure of the feed stream.<br />
Reverse osmosis provides the most complete removal of constituents of concern <strong>for</strong><br />
industrial water use applications, such as TDS, hardness, nitrate, and dissolved<br />
organic compounds. The removal rate of these constituents is between 90-98 percent<br />
<strong>for</strong> osmosis and half that <strong>for</strong> nanofiltration (Wong, 2003). Electrodialysis has removal<br />
rates of 50-95 percent <strong>for</strong> multivalent ions and does not remove smaller organic<br />
compounds. Microorganism removal (bacteria, protozoa, viruses) is considered to be<br />
4-7 log removal <strong>for</strong> RO and 3-6 log removal <strong>for</strong> NF. No log removal credit is given <strong>for</strong><br />
Craddock Consulting Engineers 13<br />
In Association with CDM & James Crook<br />
TM3-Component&Costs_0707
TM3: Recycled <strong>Wastewater</strong> System Components and Costs<br />
<strong>Recycling</strong> <strong>Treated</strong> <strong>Municipal</strong> <strong>Wastewater</strong> <strong>for</strong> <strong>Industrial</strong> <strong>Water</strong> <strong>Use</strong><br />
ED. Table 5 summarizes removal rates <strong>for</strong> the three membrane technologies, as well<br />
as other factors related to the process and application uses pertinent to reuse.<br />
Table 5. Factors and Applications <strong>for</strong> Dissolved Solids Removal Membrane Processes1 Factor/Application<br />
Factors<br />
Nanofiltration Reverse Osmosis Electrodialysis<br />
Typical constituents • small molecules • very small<br />
• charged ionic<br />
removed<br />
• color<br />
molecules<br />
solutes<br />
• some hardness • color<br />
• bacteria, viruses • hardness<br />
• proteins<br />
• sulfates<br />
• nitrate, sodium<br />
• other ions<br />
• bacteria, viruses<br />
Molecular weight cutoff 300-1000
TM3: Recycled <strong>Wastewater</strong> System Components and Costs<br />
<strong>Recycling</strong> <strong>Treated</strong> <strong>Municipal</strong> <strong>Wastewater</strong> <strong>for</strong> <strong>Industrial</strong> <strong>Water</strong> <strong>Use</strong><br />
effluent quality and type of membrane selected. Pretreatment processes can be<br />
required <strong>for</strong> iron and manganese removal (to avoid scaling on the membranes),<br />
disinfection to avoid biofouling (some membranes are sensitive to chlorine), pH<br />
adjustment to avoid scale <strong>for</strong>mation, and antiscalants. ED membranes have the least<br />
pretreatment requirements, with cartridge filtration recommended.<br />
In addition to pretreatment considerations, there is the management and disposal of<br />
the waste streams. The amount of product water resulting from the treatment of the<br />
incoming water, also called recovery, can range from 50-85 percent <strong>for</strong> RO, 70-90<br />
percent <strong>for</strong> NF facilities, and 80-90 percent <strong>for</strong> ED. Disposal options <strong>for</strong> the<br />
concentrated waste streams vary from energy intensive thermal evaporation<br />
processes to ocean discharge. As concern <strong>for</strong> trace constituents grows, surface water<br />
discharges may be less likely. Concentrate disposal and flexibility of options should<br />
be incorporated in the planning stages to assure it is the optimum choice <strong>for</strong> a specific<br />
site and application.<br />
VRTX Technologies has a product that prevents scale and biofouling in cooling water<br />
systems without the use of chemicals. It relies on localized effects of hydrodynamic<br />
cavitation to create high temperatures and pressures that break the bonds between the<br />
dissolved mineral and water. Minerals (including calcium) are precipitated out of the<br />
water stream as solids <strong>for</strong> disposal. Most microbiological cells are also destroyed at<br />
these extreme temperatures and pressures and dissolved gases leading to corrosion<br />
are stripped away. This technology may be an appropriate application <strong>for</strong> reclaimed<br />
waters where hardness is an issue; but may not apply to high dissolved salt waters.<br />
This unit process will likely be located on the industry site. A major benefit of the<br />
technology is the reduction in chemical use. If it is at the WWTP site, then disinfectant<br />
may need to be added <strong>for</strong> transmission to the industry, which may not be costeffective<br />
or meet other industry goals.<br />
3.2.5 Residual and Specific Trace Constituent Removal (Multiple Processes)<br />
Residual amount of organic and inorganic constituents can still remain after reverse<br />
osmosis and may need to be removed <strong>for</strong> specific industrial applications. Other<br />
constituents occur in trace amount in conventionally treated secondary effluent. These<br />
trace constituents are of concern because of known or suspected toxicity. Of<br />
heightened interest, is the environmental impact of several emerging contaminants of<br />
concern, such as:<br />
pharmaceutically active chemicals (PhACs)<br />
endocrine disrupting compounds (EDCs)<br />
disinfection by products (DBPs) such as N-nitrosodimethylamine (NDMA)<br />
a host of groundwater supply contaminants such as 1,4-dioxane and methyl<br />
tertiary-butyl ether (MTBE)<br />
new and reemerging pathogenic microorganisms such as Legionella pneumophila,<br />
Cryptosporidium, and Giardia<br />
Craddock Consulting Engineers 15<br />
In Association with CDM & James Crook<br />
TM3-Component&Costs_0707
TM3: Recycled <strong>Wastewater</strong> System Components and Costs<br />
<strong>Recycling</strong> <strong>Treated</strong> <strong>Municipal</strong> <strong>Wastewater</strong> <strong>for</strong> <strong>Industrial</strong> <strong>Water</strong> <strong>Use</strong><br />
These emerging contaminants of concern have been an issue <strong>for</strong> aquifer recharge and<br />
reuse applications that affect potable water supplies. They are likely not an issue <strong>for</strong><br />
industrial water reuse except <strong>for</strong> applications with potential <strong>for</strong> human or animal<br />
consumption. They are mentioned because it is a concern <strong>for</strong> potable water treatment<br />
and water reuse in general and could affect future regulations and the direction <strong>for</strong><br />
best management practices that would impact the entire water reuse industry.<br />
While NF and RO are able to remove or reduce most of these emerging contaminant<br />
compounds, there are some processes and groups of processes that may be more<br />
effective and/or economical. The treatment processes with the widest range of<br />
application include:<br />
Adsorption<br />
Ion Exchange<br />
Advanced Oxidation – hydrogen peroxide, ultraviolet radiation (UV), and ozone<br />
Other processes used to destroy or remove trace constituents include: distillation,<br />
chemical oxidation, photolysis and advanced biological treatment.<br />
Adsorption<br />
Activated carbon is the most commonly used adsorbent in water reuse treatment<br />
systems and will serve as the general reference <strong>for</strong> adsorption technologies.<br />
Adsorption is used in water reuse treatment systems <strong>for</strong> either the continuous<br />
removal of compounds or as a barrier to protect against breakthrough from other unit<br />
processes. Organic compounds are the most commonly removed constituent with<br />
adsorption processes, but adsorption has been used to remove nitrogen, sulfides,<br />
heavy metals, and odor compounds.<br />
A fixed-bed downflow reactor configuration is the most typical <strong>for</strong> activated carbon<br />
adsorption. This configuration is assumed <strong>for</strong> the cost in<strong>for</strong>mation presented in<br />
Section 4.<br />
Ion Exchange<br />
Ion exchange involves the replacement of an ion in the aqueous phase <strong>for</strong> an ion in<br />
the solid phase. In the case of water reuse systems, the goal is to remove specific ions<br />
from the treated wastewater effluent to the solid material in the ion exchange column.<br />
The applications expected <strong>for</strong> water reuse systems supplying industries include:<br />
Softening: <strong>Industrial</strong> water uses such as recycled cooling water require removal<br />
of calcium and magnesium ions. Ion exchange units with a cationic exchange<br />
resin, exchange sodium <strong>for</strong> calcium and magnesium ions in the water. Several<br />
industries surveyed <strong>for</strong> this project used softening ion exchange units <strong>for</strong> various<br />
uses including cooling water.<br />
Nitrogen Control: Typically synthetic resins are used to remove ammonium and<br />
nitrate.<br />
16 Craddock Consulting Engineers<br />
In Association with CDM & James Crook<br />
TM3-Component&Costs_0707
TM3: Recycled <strong>Wastewater</strong> System Components and Costs<br />
<strong>Recycling</strong> <strong>Treated</strong> <strong>Municipal</strong> <strong>Wastewater</strong> <strong>for</strong> <strong>Industrial</strong> <strong>Water</strong> <strong>Use</strong><br />
Heavy Metals Removal: <strong>Industrial</strong> processes have historically used ion exchange<br />
to recover heavy metals. A variety of natural an synthetic resins are available with<br />
selectivity <strong>for</strong> specific metals.<br />
Total Dissolved Solids Removal: Anionic and cationic exchange units used in a<br />
series can be used to remove TDS or demineralize the water.<br />
Reduction of Organics: Ion exchange can be used to remove the highly ionized<br />
organics in the water. Specifically prepared resins have been used to reduce TOC<br />
levels by 50 percent.<br />
Advanced Oxidation Processes (AOPs)<br />
Advanced oxidation processes destroy trace constituents that are not completely<br />
oxidized by conventional oxidation processes. There are a host of processes and<br />
groupings of processes that have been used, principally in the drinking water<br />
industry and research stages, to handle specific contaminants and the emerging<br />
contaminants of concern. These processes are all applicable to treatment of water <strong>for</strong><br />
reuse.<br />
The primary AOPs that have application to water reuse systems include:<br />
Hydrogen Peroxide/Ultraviolet Light (H2O2/UV)<br />
Hydrogen Peroxide/Ozone (H2O2/Ozone)<br />
Ozone/Ultraviolet Light (Ozone/UV)<br />
The UV processes are the most promising <strong>for</strong> Minnesota application, where UV<br />
radiation is becoming amore common <strong>for</strong>m of disinfection. UV facilities could be<br />
retrofitted or planned <strong>for</strong> new construction to handle any specific removal of trace<br />
constituents.<br />
The use of AOPs will be a very site-specific application or is a consideration <strong>for</strong> future<br />
management of trace constituents. The technology is identified in this study to<br />
emphasize that applications do exist and research is ongoing to prepare <strong>for</strong> handling<br />
the treatment of these constituents.<br />
3.2.6 Disinfection (Microorganism Removal/Inactivation)<br />
Most Minnesota WWTPs disinfect with chlorine or UV. The main compounds used<br />
<strong>for</strong> chlorination are gaseous chlorine (Cl2) and liquid sodium hypochlorite (NaOCl).<br />
Because of safety concerns and regulatory requirements, many WWTPs have moved<br />
from chlorine gas to sodium hypochlorite. Other disinfectants (not emphasized in this<br />
study) include ozone, chlorine dioxide, and calcium hypochlorite (<strong>for</strong> smaller<br />
WWTPs). Membranes also provide a barrier to microorganisms and reduce or can<br />
potentially remove the need <strong>for</strong> chemical or UV disinfection.<br />
Given the elevated potential <strong>for</strong> human contact, disinfection is an essential part of the<br />
process train in treating water <strong>for</strong> reuse. Disinfection requirements <strong>for</strong> reuse under the<br />
Title 22 criteria are greater than <strong>for</strong> discharge to the receiving stream under most<br />
Minnesota NPDES permits. Specific needs <strong>for</strong> Minnesota’s wastewater treatment<br />
Craddock Consulting Engineers 17<br />
In Association with CDM & James Crook<br />
TM3-Component&Costs_0707
TM3: Recycled <strong>Wastewater</strong> System Components and Costs<br />
<strong>Recycling</strong> <strong>Treated</strong> <strong>Municipal</strong> <strong>Wastewater</strong> <strong>for</strong> <strong>Industrial</strong> <strong>Water</strong> <strong>Use</strong><br />
facilities to achieve microbial limits to protect public health are discussed under<br />
Section 3.3.<br />
3.3 <strong>Municipal</strong> WWTP Processes and <strong>Water</strong> Quality<br />
3.3.1 Overview<br />
Assumptions were made to define a starting point <strong>for</strong> treatment requirements to meet<br />
regulatory and industrial specific uses of a reclaimed water supply. For this project, it<br />
is assumed that the WWTP is supplying an effluent from a secondary treatment<br />
system. The secondary system is an activated sludge system with nitrification and<br />
phosphorus removal, defined <strong>for</strong> this project as ‘advanced secondary treatment’.<br />
While some Minnesota municipal facilities may have total nitrogen removal or the<br />
capability, the majority do not. Hence, in this study only ammonia nitrogen removal<br />
is assumed under the term ‘advanced secondary treatment’ or when the term nutrient<br />
removal is used.<br />
The majority of Minnesota’s larger WWTPs have an advanced secondary treatment<br />
process or will have this capability as Total Maximum Daily Loads (TMDLs) are<br />
developed across the state. New facilities and major expansions permitted in the state<br />
are anticipated to have nutrient limits that would dictate this assumed process train.<br />
In addition, because one of the largest and most likely industrial uses of reclaimed<br />
water is <strong>for</strong> cooling water, which requires minimal levels of phosphorus and<br />
ammonia – use of an advanced secondary treatment system effluent is an optimum<br />
starting point. This assumption does not exclude consideration of other types of<br />
wastewater treatment facilities <strong>for</strong> water reclamation, such as fixed film systems<br />
(trickling filters and rotating biological contactors), stabilization ponds,<br />
chemical/physical package systems, or natural systems (wetland treatment).<br />
However, it is likely that additional processes would need to be added to meet the<br />
water quality requirements of a specific industry and the regulatory requirements.<br />
3.3.2 Base WWTP Definition and Effluent Quality<br />
A “base level” water quality produced by a “base WWTP” was assumed <strong>for</strong> purposes<br />
of estimating costs of service <strong>for</strong> a municipality to supply an industry with reclaimed<br />
water. The base level reclaimed water quality is defined <strong>for</strong> this study as a hard water<br />
that meets regulatory standards <strong>for</strong> non-contact industrial water uses. The base level<br />
water quality is assumed to have the constituent concentrations listed in Table 6, as<br />
typical of an advanced secondary wastewater facility effluent. This list includes<br />
constituents in most Minnesota NPDES permits (<strong>for</strong> discharge to a receiving water),<br />
those required by the Cali<strong>for</strong>nia Title 22 regulations, and others that relate to specific<br />
industrial water uses, such as total dissolved solids (TDS).<br />
If a facility has advanced secondary treatment, the first seven constituents listed in<br />
Table 6 (through fecal coli<strong>for</strong>m) are expected to be included in the facility’s NPDES<br />
permit, with the exception of nitrate. The concentrations listed <strong>for</strong> these seven<br />
parameters are considered “typical” effluent concentrations, based on a review of<br />
Minnesota WWTP discharge reports and typical operations of similar secondary<br />
WWTPs across the U.S. The BOD and TSS concentrations listed are typically less than<br />
18 Craddock Consulting Engineers<br />
In Association with CDM & James Crook<br />
TM3-Component&Costs_0707
TM3: Recycled <strong>Wastewater</strong> System Components and Costs<br />
<strong>Recycling</strong> <strong>Treated</strong> <strong>Municipal</strong> <strong>Wastewater</strong> <strong>for</strong> <strong>Industrial</strong> <strong>Water</strong> <strong>Use</strong><br />
the concentration limits in the existing NPDES permit, which are commonly 20 mg/L<br />
and 30 mg/L, respectively.<br />
The total coli<strong>for</strong>m limit is based on the Title 22 criteria <strong>for</strong> a secondary-23 recycled<br />
water and assumes a use of the water that does not contact humans. The remainder of<br />
the constituents listed are those used in treatment technology selection and sizing of<br />
equipment/processes <strong>for</strong> removal of residual colloidal/dissolved solids and trace<br />
constituents. The concentrations listed reflect the variability in the source waters in<br />
Minnesota. In general, Minnesota has hard water with high salt concentrations. These<br />
concentrations increase with domestic practices, particularly home softening units.<br />
Average (Source A) and Hard (Source B) water quality types are assumed <strong>for</strong> cost<br />
analyses.<br />
Table 6. Assumed Base WWTP Effluent Quality<br />
Constituent Effluent<br />
Concentration 1<br />
BOD, mg/L
TM3: Recycled <strong>Wastewater</strong> System Components and Costs<br />
<strong>Recycling</strong> <strong>Treated</strong> <strong>Municipal</strong> <strong>Wastewater</strong> <strong>for</strong> <strong>Industrial</strong> <strong>Water</strong> <strong>Use</strong><br />
quality effluent. Membrane bioreactors are included in Figure 3, recognizing it as a<br />
future technology <strong>for</strong> Minnesota.<br />
The type of phosphorus removal is not identified in the Base WWTP. A facility could<br />
use chemical or biological phosphorus removal to achieve a 1 mg/L total phosphorus<br />
limit. Certain technologies could be selected because of benefits to the phosphorus<br />
removal mechanism. For example, if a facility uses chemical phosphorus removal, the<br />
use of a chemical softening process with coagulation, flocculation, and sedimentation<br />
could provide a more optimum use of chemicals <strong>for</strong> phosphorus removal, provide<br />
flexibility in chemical addition points, and reduce suspended solids and hardness. For<br />
example, the City of Mankato considered these benefits in the selection of their<br />
processes to produce reclaimed water <strong>for</strong> the cooling towers of the Mankato Energy<br />
Center.<br />
Additional Disinfection Requirements<br />
The base WWTP assumes the facility has disinfection equipment and structures to<br />
meet Minnesota’s seasonal fecal coli<strong>for</strong>m limits. The majority of Minnesota’s WWTPS<br />
are permitted to disinfect from April through October and is the assumed period of<br />
disinfection <strong>for</strong> this study. There are three disinfection system improvements required<br />
to produce a reclaimed supply from WWTPs in Minnesota <strong>for</strong> a non-contact industrial<br />
water use:<br />
Year-round disinfection<br />
Higher levels of disinfection to meet reclaimed water pathogen limits<br />
Transmission system residual disinfection<br />
In Minnesota, disinfection <strong>for</strong> pathogens in WWTP effluent is required only from<br />
April through October. For a reclaimed supply, disinfection must occur year-round<br />
or any time during which reclaimed water is delivered to users. While the existing<br />
facilities will be adequate to disinfect the WWTP effluent year-round to the levels<br />
required by the NPDES permit limit (typically a fecal coli<strong>for</strong>m limit of 200/100 ml)<br />
there will be additional O&M costs associated with the extra five months of<br />
disinfection a year.<br />
The Cali<strong>for</strong>nia <strong>Water</strong> <strong>Recycling</strong> Criteria include a total coli<strong>for</strong>m limit of 23/100 ml <strong>for</strong><br />
the base system reclaimed supply. Most Minnesota WWTPs use chlorination or UV<br />
radiation <strong>for</strong> disinfection. In the case of chlorination systems, higher levels of<br />
disinfection can be achieved by increasing the concentration of chlorine in the effluent<br />
while using the same contact tanks. With UV radiation, the need to upgrade or add<br />
equipment will depend on the peaking factor criteria used to design the system and<br />
other flexibilities designed in the system.<br />
The other disinfection requirement is the presence of a residual disinfectant in the<br />
transmission system. The most common practice is the use of sodium hypochlorite<br />
which is the practice assumed <strong>for</strong> this study. While some systems may have adequate<br />
capacity to add a residual with their existing chlorination system, those with UV<br />
radiation processes will need new facilities and equipment.<br />
20 Craddock Consulting Engineers<br />
In Association with CDM & James Crook<br />
TM3-Component&Costs_0707
TM3: Recycled <strong>Wastewater</strong> System Components and Costs<br />
<strong>Recycling</strong> <strong>Treated</strong> <strong>Municipal</strong> <strong>Wastewater</strong> <strong>for</strong> <strong>Industrial</strong> <strong>Water</strong> <strong>Use</strong><br />
Sodium hypochlorite feed systems provide a unit process that can meet the three<br />
disinfection system improvement requirements: to meet a year-round disinfectant,<br />
provide a higher level of disinfection, and maintain a residual in the transmission<br />
system. A conservative assumption is made that all WWTPs will require new<br />
equipment <strong>for</strong> application of sodium hypochlorite. It is assumed that the chlorine<br />
dose can be elevated sufficiently to meet the disinfection requirements without the<br />
need <strong>for</strong> additional detention time (new contact tanks).<br />
Chlorine doses were assumed as follows <strong>for</strong> the two annual operating practices and<br />
residual disinfection:<br />
April-October months with disinfection practiced by Minnesota WWTPs, where<br />
chlorination provides incremental disinfection from the NPDES pathogen limit to<br />
the reclaimed water pathogen limit.<br />
November-March months with no disinfection practiced by Minnesota WWTPs to<br />
provide disinfection to the reclaimed water pathogen limit.<br />
A chlorine dose of 2.5 mg/L was selected to achieve adequate residual through<br />
the transmission system. This is a dose commonly used by reclaimed systems<br />
across the country.<br />
Chlorination practices at MCES facilities and facilities with reuse systems were<br />
reviewed to identify chlorine doses <strong>for</strong> existing systems to meet NPDES permit limits<br />
and to meet a variety of state reclaimed water criteria. For MCES facilities, average<br />
chlorine doses to meet NPDES discharge limits range from 2-4 mg/L with peak<br />
demands requiring 6 mg/L of chlorine. A reclaimed system in Cary, North Carolina<br />
reported the use of an 8 mg/L dose to meet pathogen kill and residual disinfection<br />
requirements. <strong>Use</strong> of the Refined Collins-Selleck Model to estimate chlorine dosages<br />
<strong>for</strong> disinfection of a nitrified secondary effluent (White, 1999) to meet a 23/100 ml<br />
total coli<strong>for</strong>m limit indicates that <strong>for</strong> a contact time of 15 minutes (the contact tank<br />
design criteria typically used in Minnesota), a dose of 4-15 mg/L is required<br />
depending on the nitrification process (ammonia at concentrations from 0.5 – 2<br />
mg/L).<br />
For this study, it is assumed that a chlorine dose of 6.5 mg/L applied to an advanced<br />
secondary treatment system effluent is required to meet a total coli<strong>for</strong>m limit of<br />
23/100 ml. For the disinfection season months of April through October it is assumed<br />
that WWTPs have a disinfection process equivalent to a chlorination system with an<br />
average dose of 3 mg/L. There<strong>for</strong>e, an additional 3.5 mg/L chlorine is required to<br />
meet the more stringent reclaimed water pathogen limit from April to October. When<br />
the 2.5 mg/L chlorine dose <strong>for</strong> disinfection residual is included, the chlorine doses are<br />
as follows:<br />
April-October (7 months): 3.5 mg/L + 2.5 mg/L = 6 mg/L<br />
November-March (5 months): 6.5 mg/L + 3.5 mg/L = 9 mg/L<br />
Average Annual (based on weighted average, rounded) = 7 mg/L<br />
Craddock Consulting Engineers 21<br />
In Association with CDM & James Crook<br />
TM3-Component&Costs_0707
TM3: Recycled <strong>Wastewater</strong> System Components and Costs<br />
<strong>Recycling</strong> <strong>Treated</strong> <strong>Municipal</strong> <strong>Wastewater</strong> <strong>for</strong> <strong>Industrial</strong> <strong>Water</strong> <strong>Use</strong><br />
3.4 Selection of <strong>Water</strong> Reuse Treatment Technologies <strong>for</strong><br />
Specific <strong>Industrial</strong> <strong>Water</strong> <strong>Use</strong>s<br />
3.4.1 Factors to Consider<br />
There are a host of factors to consider in selecting a treatment process train <strong>for</strong> water<br />
reuse applications. The main factors have been discussed in this document and were<br />
used to define the base level water quality and base WWTP processes, including:<br />
<strong>Water</strong> reuse quality goals<br />
Effluent wastewater characteristics<br />
Type of water reuse application (purpose of water supply)<br />
The other factors to consider <strong>for</strong> specific applications are those typical of any planning<br />
study:<br />
Integration with existing facility processes, hydraulics, and site conditions<br />
Future facility or other service area expansions and proximity and treatment<br />
requirements <strong>for</strong> water reuse applications<br />
Process flexibility (<strong>for</strong> new and existing processes)<br />
Environmental issues<br />
Operation and maintenance (O&M) requirements including energy, chemicals,<br />
labor, automation, laboratory, and general maintenance.<br />
3.4.2 Technologies by Target Constituents<br />
Section 3.2.1 presented the treatment processes typically used to produce different<br />
levels of quality <strong>for</strong> water reuse applications. Table 7 lists these processes and<br />
identifies the specific categories of constituents they remove. The base WWTP defined<br />
<strong>for</strong> this study removes suspended solids, dissolved organic matter, ammonianitrogen,<br />
phosphorus, and pathogens (advanced secondary treatment). This supply<br />
may be adequate <strong>for</strong> some industries without additional treatment.<br />
The next level of treatment is usually filtration <strong>for</strong> consistent disinfection practices<br />
and/or additional particulate removal. Filtration is required by Title 22 <strong>for</strong> water used<br />
in cooling towers, or other applications with the potential <strong>for</strong> human contact.<br />
Particulate matter includes: suspended solids, colloidal, and/or organic matter and<br />
the related phosphorus (cell content). Filtration reduces particulates, including<br />
pathogens (bacteria, protozoan cysts, and oocysts), and also improves the disinfection<br />
process by removing particles that shield pathogens from the disinfectant (chlorine,<br />
UV, ozone).<br />
The next level of treatment will typically require some degree of dissolved constituent<br />
removal or additional nutrient removal. Hardness, related salts, metals, silica, and<br />
color were some of the constituents identified in Table 2 that required limited<br />
concentrations <strong>for</strong> various industrial uses. The treatment technology selected will<br />
depend on the exact constituents and amount to be removed, as well as the other<br />
processes used <strong>for</strong> the main WWTP and reclamation-specific processes.<br />
22 Craddock Consulting Engineers<br />
In Association with CDM & James Crook<br />
TM3-Component&Costs_0707
TM3: Recycled <strong>Wastewater</strong> System Components and Costs<br />
<strong>Recycling</strong> <strong>Treated</strong> <strong>Municipal</strong> <strong>Wastewater</strong> <strong>for</strong> <strong>Industrial</strong> <strong>Water</strong> <strong>Use</strong><br />
Table 7. Treatment Technologies/Processes <strong>for</strong> Removal of Constituents in <strong>Wastewater</strong> <strong>for</strong> <strong>Water</strong> Reuse Applications<br />
Unit Operation or Process Suspended<br />
Solids<br />
Colloidal<br />
Solids<br />
Particulate<br />
Organic Matter<br />
Coventional Secondary Treatment x x<br />
Dissolved<br />
Organic Matter<br />
Advanced Secondary Treatment x x x x<br />
Nitrogen<br />
Phosphorus<br />
Trace<br />
Constituents<br />
Coagulation/Flocculation/Sedimentation x x x x x x<br />
Total<br />
Dissolved<br />
Solids<br />
Depth Filtration x x<br />
Surface Filtration x x x<br />
Microfiltration x x x x<br />
Ultrafiltration x x x x<br />
Dissolved Air Flotation x x x x<br />
Nanofiltration x x x x x<br />
Reverse Osmosis x x x x x x<br />
Electrodialysis x x<br />
Carbon Adsorption x x<br />
Ion Exchange x x x<br />
Advanced Oxidation x x x x<br />
Disinfection x x<br />
Source: Adapted from Metcalf & Eddy, 2007.<br />
Pathogens
TM3: Recycled <strong>Wastewater</strong> System Components and Costs<br />
<strong>Recycling</strong> <strong>Treated</strong> <strong>Municipal</strong> <strong>Wastewater</strong> <strong>for</strong> <strong>Industrial</strong> <strong>Water</strong> <strong>Use</strong><br />
Specific industrial applications may require the removal of trace constituents in the<br />
wastewater. The technology selected will vary with the constituent and specific<br />
application.<br />
3.4.3 Treatment Technologies <strong>for</strong> Minnesota Industry Reuse Applications<br />
Approach<br />
One of the objectives of this technical memorandum is to define water reuse system<br />
requirements and costs <strong>for</strong> Minnesota’s industries. Given the diversity of source water<br />
quality characteristics and varying requirements of the industries in Minnesota, a<br />
technology-based approach is used. Industry-specific water quality requirements are<br />
compared to a set of reclaimed water system supplies, with defined water quality<br />
constituents and concentrations. The different reclaimed supplies are defined by<br />
specific treatment technologies, which provide the basis <strong>for</strong> estimating costs. A range<br />
of treatment requirements and costs can then be applied to industry categories.<br />
Five types of reclaimed water, listed in Table 8, are used to categorize the reclaimed<br />
water quality options available <strong>for</strong> specific industrial water supply requirements. The<br />
classification is based on a train of treatment technologies to meet a set of water<br />
quality goals. This classification system is based on treatment of the base WWTP<br />
effluent, which is a secondary activated sludge system with nitrification and<br />
phosphorus removal. New facilities or major expansions could incorporate membrane<br />
bioreactors, which are not considered in this classification system. For comparison<br />
purposes, the effluent quality of membrane bioreactors would be similar to Tertiary 2-<br />
Membrane Filtration. Table 9 identifies the typical water quality constituent<br />
concentrations <strong>for</strong> the five classes of reclaimed water.<br />
Industry Treatment Requirements<br />
<strong>Water</strong> use <strong>for</strong> a significant portion of Minnesota’s industries is tracked through the<br />
Minnesota Department of Natural Resources’ (MDNR) <strong>Water</strong> Appropriations Permit<br />
program. The water demand analysis of Minnesota’s industries, documented in<br />
Technical Memorandum 1 (June 2006) of this project, used the industry categories<br />
established <strong>for</strong> the permit program’s database. These same categories are used to<br />
document the treatment requirements and costs <strong>for</strong> Minnesota’s industries.<br />
Many industries have multiple uses <strong>for</strong> their total water supply. The quality<br />
requirements can vary with the type of use and many industries currently use<br />
different water supplies to meet their various needs. One of the most significant<br />
industrial uses of water is <strong>for</strong> cooling. <strong>Water</strong> can also be used in the industry’s<br />
manufacturing or washing processes, as boiler feed water, <strong>for</strong> landscape irrigation, or<br />
typical potable uses <strong>for</strong> employees. Table 10 lists the dominant water uses and the<br />
reclaimed water quality (based on the classification systems defined in Tables 8 and 9)<br />
required <strong>for</strong> Minnesota industries. Table 11 provides the subcategories <strong>for</strong> major<br />
industry categories that have a wide range of industry types.<br />
Craddock Consulting Engineers 23<br />
In Association with CDM & James Crook<br />
TM3-Component&Costs_0707
TM3: Recycled <strong>Wastewater</strong> System Components and Costs<br />
<strong>Recycling</strong> <strong>Treated</strong> <strong>Municipal</strong> <strong>Wastewater</strong> <strong>for</strong> <strong>Industrial</strong> <strong>Water</strong> <strong>Use</strong><br />
Table 8. Reclaimed <strong>Water</strong> Classifications<br />
Classification Characteristics<br />
Advanced Secondary • For non-contact industrial uses with low concern <strong>for</strong><br />
hardness and dissolved solids<br />
• Base WWTP process train<br />
• Meets secondary-23 recycled water criteria<br />
Tertiary 1<br />
Conventional<br />
Tertiary 2<br />
Membrane Filtration<br />
Tertiary 3<br />
Membrane Softening<br />
Tertiary 4<br />
Advanced<br />
• For industrial uses with human contact potential and/or<br />
industries that require partial hardness and dissolved<br />
salt removal<br />
• Requires a coagulation/flocculation/sedimentation<br />
process with filtration<br />
• Removes some hardness and dissolved salts; provides<br />
some soluble organic removal and color removal<br />
• Meets tertiary recycled water criteria<br />
• For industrial uses with human contact potential and/or<br />
industries that can use hard/high salt water<br />
• Provides soluble organic removal and color removal<br />
• Provides pathogen removal and reduces disinfection<br />
requirements<br />
• Meets tertiary recycled water criteria<br />
• For industries requiring low dissolved salts<br />
• Requires Tertiary 2 water followed by softening with RO<br />
or ED depending on the target constituents<br />
• Meets tertiary recycled water criteria<br />
• For industries requiring low dissolved salts and removal<br />
of trace constituents<br />
• Requires Tertiary 3 water with RO and either ion<br />
exchange, carbon adsorption or advanced oxidation<br />
processes, depending on the target constituent.<br />
• Meets tertiary recycled water criteria<br />
As shown in Table 10, a significant portion of industries use their water supply as<br />
cooling water. For most industries that require water as a cooling source <strong>for</strong> various<br />
equipment and processes, cooling water accounts <strong>for</strong> 30-95% of the water use.<br />
Existing facilities still use once-through cooling and some of these facilities could use<br />
the base quality supply, depending on the hardness and salt concentrations. As<br />
industrial facilities upgrade, once-through systems are being replaced by recirculating<br />
systems that use less water. Most new facilities with a ground water supply source<br />
use recirculating systems, in keeping with Minnesota water appropriations permit<br />
guidelines.<br />
Recirculating systems have limits on the concentration of dissolved salts in the<br />
cooling water, where excessive concentrations result in scaling and corrosion<br />
problems. There are different unit processes and groupings of processes that can<br />
remove salts and provide a softened supply <strong>for</strong> cooling water uses. Both Tertiary 1<br />
24 Craddock Consulting Engineers<br />
In Association with CDM & James Crook<br />
TM3-Component&Costs_0707
TM3: Recycled <strong>Wastewater</strong> System Components and Costs<br />
<strong>Recycling</strong> <strong>Treated</strong> <strong>Municipal</strong> <strong>Wastewater</strong> <strong>for</strong> <strong>Industrial</strong> <strong>Water</strong> <strong>Use</strong><br />
and 3 could provide an adequate supply <strong>for</strong> cooling water, depending on the source<br />
water quality and the cycles of concentration required <strong>for</strong> the cooling water system. It<br />
is also possible that the base reclaimed supply with or without filtration could meet<br />
cooling water requirements if the industry uses chemicals to keep the water in the<br />
right ionic balance to prevent scaling. Potable supplies with medium to high hardness<br />
are often treated with scalants <strong>for</strong> use as cooling water. The generally high hardness<br />
and high salt concentrations in Minnesota waters and wastewater make it plausible<br />
that Tertiary 1 and 3 level water may be required <strong>for</strong> recirculating cooling water use<br />
in Minnesota.<br />
Table 9. <strong>Water</strong> Quality <strong>for</strong> the Reclaimed <strong>Water</strong> Classifications 1<br />
Constituent Advanced<br />
Secondary<br />
Reclaimed <strong>Water</strong> Concentration 2<br />
Tertiary 1<br />
Conven-<br />
tional<br />
Tertiary 2<br />
Membrane<br />
Filtration<br />
Tertiary 3<br />
Membrane<br />
Softening<br />
Tertiary 4<br />
Advanced<br />
BOD, mg/L 5-10
TM3: Recycled <strong>Wastewater</strong> System Components and Costs<br />
<strong>Recycling</strong> <strong>Treated</strong> <strong>Municipal</strong> <strong>Wastewater</strong> <strong>for</strong> <strong>Industrial</strong> <strong>Water</strong> <strong>Use</strong><br />
Table 10. <strong>Water</strong> Quality and Treatment Requirements by Industry Category<br />
Reclaimed <strong>Water</strong> Quality Classification Required<br />
Tertiary Tertiary Tertiary Tertiary<br />
Base 1 2 3 4<br />
Type of <strong>Water</strong> Advanced Conven- Membrane Membrane Advanced<br />
Industry Category <strong>Use</strong> Secondary tional Filtration Softening Processes<br />
Agricultural<br />
Cooling, Boiler<br />
Feed<br />
x x x<br />
Pulp & Paper<br />
Process, Boiler<br />
Feed<br />
x x x x<br />
Mining<br />
Process, Boiler<br />
Feed<br />
x x x x<br />
Sand & Gravel<br />
Washing<br />
Process x<br />
<strong>Industrial</strong> Cooling-<br />
Once-Through<br />
Cooling x x x<br />
Petroleum,<br />
Chemical & Ethanol<br />
Cooling, Process,<br />
Boiler Feed<br />
x x x<br />
Metals<br />
Process, Cooling,<br />
Boiler Feed<br />
x x x<br />
Non-Metals<br />
Process, Cooling,<br />
Boiler Feed<br />
x x x x x<br />
Other Process x x x x x<br />
Power Cooling-<br />
Once Through/Other<br />
Cooling, Boiler<br />
Feed<br />
x x x x x<br />
Power Cooling-<br />
Recirculating<br />
Cooling, Boiler<br />
Feed<br />
x x x x<br />
Table 11. Select Industry Subcategories<br />
Agricultural Pulp and Paper<br />
Food Production Mills<br />
Beverage Production Paper and Packaging<br />
Non-Metals Printed Products<br />
Building Materials Metals<br />
Glass Products Foundries<br />
Leather Products Metal Product Fabrication<br />
Plastics Machine and Tool Shops<br />
Rubber Products Electronic and Computer Products<br />
Miscellaneous Non-Metal Products<br />
Other<br />
Other Industries (not defined above)<br />
Electroplating<br />
26 Craddock Consulting Engineers<br />
In Association with CDM & James Crook<br />
TM3-Component&Costs_0707
TM3: Recycled <strong>Wastewater</strong> System Components and Costs<br />
<strong>Recycling</strong> <strong>Treated</strong> <strong>Municipal</strong> <strong>Wastewater</strong> <strong>for</strong> <strong>Industrial</strong> <strong>Water</strong> <strong>Use</strong><br />
Process water quality requirements can dictate a range of treatment requirements. For<br />
the industry categories represented in Table 10, the base supply is sufficient <strong>for</strong> sand<br />
and gravel washing. It could also be an acceptable source <strong>for</strong> use in other processes<br />
that are not concerned with hardness and dissolved salts, as in the Non-Metals and<br />
Other industry categories. Process water is not listed <strong>for</strong> agricultural processing<br />
because most of these products are <strong>for</strong> human consumption and similar to some<br />
state’s practices, is expected to be lower on the list of practices <strong>for</strong> approval. If<br />
reclaimed water is used in food products, Tertiary 4 water with final UV would likely<br />
be required.<br />
Reclaimed water with tertiary treatment is expected to be required <strong>for</strong> water supplies<br />
used by the pulp and paper, mining, petroleum, chemical, ethanol, and metals<br />
industries. It is possible that a base supply could be used in the iron mining industry,<br />
but the separation processes <strong>for</strong> iron ore include use of chemicals and excessive<br />
dissolved constituents may cause problems. Likewise, some processes in pulp and<br />
paper production could use a base reclaimed water supply, but typically dissolved<br />
constituents are not desired because of potential effects on attributes such as color<br />
quality. These industries, along with petroleum, chemical, ethanol, and metals<br />
industries typically require process water with low dissolved solids and the absence<br />
of trace constituents. Tertiary processes such as reverse osmosis followed by GAC, ion<br />
exchange or other technologies may be required.<br />
4.0 Storage and Transmission<br />
4.1 Overview<br />
An integral part of the planning, operation, and maintenance of water reuse systems<br />
is <strong>for</strong> the transmission of the reclaimed water to the customer. Transmission costs,<br />
both capital and O&M, are often the largest cost component of projects <strong>for</strong> centralized<br />
systems. Transmission systems include on-site storage, pump station(s), piping, offsite<br />
storage, diversion structures to off-site storage ponds, service connections, and<br />
metering. Most states with regulations and guidelines include standards <strong>for</strong> the<br />
design, installation, operation, and maintenance of the transmission systems. There<br />
are very specific guidelines <strong>for</strong> prevention of cross-connections to other systems,<br />
including use of backflow preventions devices and other plumbing features.<br />
4.2 Storage<br />
This study assumes only storage <strong>for</strong> diurnal, daily or weekly industrial demand<br />
patterns that the WWTP cannot meet with their continuous supply. The conceptual<br />
water reuse system presented in Figure 1 provides <strong>for</strong> storage facilities on the WWTP<br />
to meet a range of storage volumes. The base water reuse system assumes that no<br />
storage is required. This assumption is valid <strong>for</strong> a larger WWTP serving smaller<br />
industrial demands.<br />
Storage requirements <strong>for</strong> industrial applications can vary widely. Some industries<br />
may have adequate storage to meet peak hour requirements, but most would not<br />
have storage to handle significant volumes. The need <strong>for</strong> storage is most likely with<br />
Craddock Consulting Engineers 27<br />
In Association with CDM & James Crook<br />
TM3-Component&Costs_0707
TM3: Recycled <strong>Wastewater</strong> System Components and Costs<br />
<strong>Recycling</strong> <strong>Treated</strong> <strong>Municipal</strong> <strong>Wastewater</strong> <strong>for</strong> <strong>Industrial</strong> <strong>Water</strong> <strong>Use</strong><br />
smaller WWTPs where the diurnal flows could drop below the required demand of<br />
an industry or group of industries. Weekly demand patterns of industry could also<br />
change and should be accounted <strong>for</strong> when establishing storage requirements.<br />
This study does not consider any seasonal storage requirements <strong>for</strong> a reclaimed<br />
supply. Seasonal storage would be required <strong>for</strong> WWTPs that incorporate reuse<br />
practices to reduce their discharges to waterways and supply seasonal customers.<br />
These facilities would need to store effluent during periods when the seasonal reuse<br />
customers do not use water. These are cases where the WWTP’s NPDES permit limits<br />
are more stringent in the warmer months and rather than upgrade treatment facilities<br />
to meet the lower seasonal mass limits, a portion of the plant effluent is reused and<br />
not discharged to the receiving stream. Seasonal storage may also be required to meet<br />
a seasonal water demand, where peak demands cannot be consistently matched by<br />
the WWTP flow. The majority of Minnesota’s industries have year-round water<br />
demands, with the exclusion of agricultural processing industries that may depend on<br />
seasonal crops, industries that use reclaimed water <strong>for</strong> landscape irrigation, and some<br />
cooling water applications. Seasonal storage facilities are more commonly used in<br />
water reuse systems <strong>for</strong> irrigation practices.<br />
Reclaimed water storage can also provide system reliability with a short-term supply<br />
if there is a process disruption, as well as additional contact time <strong>for</strong> chlorine<br />
disinfection.<br />
4.3 Pumping<br />
The model <strong>for</strong> this study assumes a pump station is located on the WWTP site and is<br />
owned by the municipality. The pump station will include redundancy and reliability<br />
features consistent with state water supply requirements. The pump station is sized<br />
<strong>for</strong> peak flow and a residual pressure at the end of the pipe line of 40 psi, assuming<br />
delivery at the same elevation as the WWTP.<br />
4.4 Transmission Pipelines<br />
The majority of reclaimed transmission piping is polyvinyl chloride pipe (PVC) or<br />
ductile iron pipe (DIP) meeting specific industry standards. For this study, the<br />
transmission system is assumed to be all <strong>for</strong>cemain: pipe with a diameter of 24 inches<br />
or less is PVC, DR 18, Class 150. Greater than 24 inch diameter pipe is assumed to be<br />
DIP, Class 51 with push-on joints. Pipelines are sized to carry the peak hour demand<br />
(peaking factor of 3) of a given industry at a target velocity of 5 to 7 fps.<br />
5.0 Costs<br />
5.1 Overview<br />
This section presents the estimated cost of service <strong>for</strong> a municipal water reuse system<br />
to serve a “base level” water quality and “alternative” water quality supplies to<br />
industries. The base level quality is defined as a hard water that meets regulatory<br />
standards <strong>for</strong> non-contact industrial water uses. The processes needed to produce the<br />
base level water quality define a “base WWTP” <strong>for</strong> water reuse to which other<br />
28 Craddock Consulting Engineers<br />
In Association with CDM & James Crook<br />
TM3-Component&Costs_0707
TM3: Recycled <strong>Wastewater</strong> System Components and Costs<br />
<strong>Recycling</strong> <strong>Treated</strong> <strong>Municipal</strong> <strong>Wastewater</strong> <strong>for</strong> <strong>Industrial</strong> <strong>Water</strong> <strong>Use</strong><br />
processes and their associated costs can be added to meet the specific needs of an<br />
industry. The “base water reuse system” includes treatment processes and the<br />
transmission system <strong>for</strong> delivery from the WWTP to the industry. “Alternative water<br />
reuse systems” differ from the base system in the treatment processes used to produce<br />
a prescribed set of water quality goals.<br />
Costs are presented as the cost of service in $ /1000 gallons. The cost of service is the<br />
annualized capital cost over 20-years plus the annual O&M cost. Cost curves are used<br />
to provide the cost of service to supply a given demand <strong>for</strong> a 10-mile range from the<br />
WWTP. The base water reuse system costs are presented followed by systems<br />
providing alternative water quality supplies and storage facilities.<br />
5.2 Cost Basis and Assumptions<br />
The estimated capital and O&M costs and the cost of service ($/1000 gallons<br />
supplied) are based on cost in<strong>for</strong>mation obtained from equipment manufacturers,<br />
constructed projects, peer-reviewed publications, as well as the financial analysis<br />
guidance set by Council. Redundancy and reliability criteria follow the Council’s<br />
recommendations <strong>for</strong> WWTPs (which incorporates MPCA guidelines), standard<br />
potable water system practices, and documented reuse system practices. The major<br />
criteria and assumptions are listed in Table 12.<br />
Table 12. Cost Criteria and Assumptions<br />
Description<br />
Rates & Planning In<strong>for</strong>mation<br />
Value<br />
Discount Rate 5.0%<br />
Planning Period 20 years<br />
Present Year Sep 2006 (ENR=7763)<br />
Debt Financing Issuance Costs<br />
<strong>Use</strong>ful Lives<br />
1% capital cost<br />
Force mains 40 years<br />
Process Piping 30 years<br />
Equipment<br />
Redundancy & Reliability<br />
20 years<br />
Equipment 1 unit out of service at peak hour flow<br />
Piping Single <strong>for</strong>ce main<br />
Capital Cost Assumptions<br />
Undeveloped Design Details 50% of Construction Cost<br />
Engineering, Admin & Legal<br />
Operations & Maintenance Assumptions<br />
20% of Construction Cost<br />
Electricity $0.045/kwh<br />
Sodium Hypochlorite, 12.5% $0.70/gallon<br />
Pump System Equipment 1% capital cost/yr<br />
Treatment System Equipment 5% capital cost/yr<br />
Transmission System $5,500/mile/yr<br />
Craddock Consulting Engineers 29<br />
In Association with CDM & James Crook<br />
TM3-Component&Costs_0707
TM3: Recycled <strong>Wastewater</strong> System Components and Costs<br />
<strong>Recycling</strong> <strong>Treated</strong> <strong>Municipal</strong> <strong>Wastewater</strong> <strong>for</strong> <strong>Industrial</strong> <strong>Water</strong> <strong>Use</strong><br />
5.3 Cost Model<br />
A cost estimating tool was developed to evaluate the costs <strong>for</strong> a range of reclaimed<br />
water systems to serve industries a water supply. The cost tool is based on the<br />
conceptual system model shown in Figure 1, <strong>for</strong> those facilities on or originating on<br />
the WWTP site. There are four major facility components to the cost model:<br />
Treatment (includes residual disinfection)<br />
Storage<br />
Pump Station<br />
Piping (transmission)<br />
Each of these facility components is addressed in a separate module within the<br />
spreadsheet-based cost tool. Different system configurations can be evaluated to<br />
provide the estimated costs <strong>for</strong> a given supply water quality, quantity supplied, and<br />
distance of the industry from the WWTP. The model provides the transmission<br />
system costs <strong>for</strong> a specified flow and distance from the WWTP to the point of<br />
delivery.<br />
The cost model is predicated on treatment being provided on the WWTP site and<br />
water delivered with the prescribed water quality at a delivery pressure of 40 psi. The<br />
water quality delivered will depend on the treatment processes used. The base system<br />
will deliver quality with the characteristics listed previously in Table 6. The model<br />
does not include costs <strong>for</strong> treatment facilities at the industry site or booster pumps to<br />
meet industry specific requirements. An industry with more stringent water quality<br />
or pressure requirements would likely have existing facilities on their site to treat the<br />
reclaimed water supply.<br />
The cost model was used to develop cost curves <strong>for</strong> a range of industrial water<br />
demands and transmission distances. Capital costs are annualized based on a 20-year<br />
debt service and presented as a cost of service, in $/1000 gallons, in conjunction with<br />
all major O&M costs. The cost of service provides a unit of measure that can be<br />
compared to existing water supply costs.<br />
An example of the cost model summary spreadsheet, shown in Table 13, provides the<br />
assumptions used <strong>for</strong> the base system and presents estimated costs <strong>for</strong> a reclaimed<br />
supply of 1.0 mgd (annual average) delivered 1.0 mile. As with other transmission<br />
cost in<strong>for</strong>mation, this assumes a peaking factor of 3, or maximum flow of 3 mgd. The<br />
average annual flow/demand and length of transmission piping are the main input<br />
parameters.<br />
Other spreadsheets in the cost tool determine the capital costs <strong>for</strong> treatment, storage,<br />
pump station, and piping and annual pumping power costs based on the flow and<br />
pipe length input. Assumptions <strong>for</strong> unit costs of O&M items not presented in Table 12<br />
are shown in Table 13. These include equipment maintenance, laboratory sampling<br />
and analysis, and general administrative costs.<br />
30 Craddock Consulting Engineers<br />
In Association with CDM & James Crook<br />
TM3-Component&Costs_0707
Table 13<br />
WATER REUSE SYSTEM COST OF SERVICE ASSUMPTIONS AND SUMMARY RESULTS<br />
Blue = Values to input<br />
Capital Cost and Debt Financing Assumptions<br />
Summary of Capital Cost Estimates<br />
Total Capital Cost $1,412,830 Description Total Cost<br />
Amount of Grant Funding $0 Treatment Facilities $180,000<br />
<strong>Municipal</strong> % of Up-Front Capital 100% Storage Facilities $0<br />
Other % of Up-Front Capital 0% Pump Station $485,630<br />
Debt Term (Years) 20 Piping $747,200<br />
Annual Interest Rate 5.00% TOTAL CAPITAL $1,412,830<br />
Issuance Costs, % of Capital 1%<br />
Annual Avg Flow/Demand (MGD) 1.0<br />
Operation and Maintenance Cost Items<br />
Lab, Chemicals & Power Maintenance<br />
Length of Distribution System (mi) 1.0 Lab Costs, $ $20,000 Pump System Labor, hrs/wk 4<br />
Sodium Hypochlorite, $/gal of 12.5% $0.70 Pump System Equip, % capital 1%<br />
Chlorine Dose, mg/L (year-round, see Note A) 7 Treatment Facilities, % capital 5%<br />
Electrical Power, $/kwhr $0.045 Distribution System, $/mile $5,500<br />
FTE Annual Salary with Benefits, $<br />
Finance, Operations, Cust Service $80,000<br />
Legal $150,000<br />
Engineering $100,000<br />
Estimated Total Type of Cost: Estimated Cost<br />
Cost Components Basis/Methodology Cost in Year 1 Fixed or per<br />
(2007) Variable? 1,000 Gallons<br />
CAPITAL Debt Service (Capital Cost) Based on debt service payment $109,050 Fixed $0.30<br />
Pumping System<br />
Maintenance Labor hours/week at operator rate input-see Note B $8,800 Combination $0.02<br />
Equipment Maintenance Based on % of capital cost input $4,856 Combination $0.01<br />
OPERATION Electrical Power Based on per Kwh rate input; see Note C $14,736 Variable $0.04<br />
AND Reuse Treatment at WWTP<br />
MAINTENANCE Chlorine Disinfection $/gallon at %Conc input; see Note A $14,342 Variable $0.04<br />
Other Chemicals/Misc From Treatment Module $0 Variable $0.00<br />
Laboratory Lab cost input $20,000 Fixed $0.05<br />
Electrical Power From Treatment Module $0 Variable $0.00<br />
Equipment Maintenance Based on % of capital cost input $9,000 Combination $0.02<br />
Distribution System Maintenance Equals water system cost/mile-see Note B $5,500 Combination $0.02<br />
General System Management<br />
GENERAL Engineering 0.15 FTE base; .05% increase per mgd >1 $15,000 Combination $0.04<br />
AND Finance and Accounting 0.15 FTE $12,000 Combination $0.03<br />
ADMINISTRATIVE Legal 0.05 FTE $7,500 Combination $0.02<br />
Customer Service 0.05 FTE $4,000 Combination $0.01<br />
TOTAL OF ALL COST COMPONENTS FOR SYSTEM: $0.62<br />
NOTES:<br />
A - based on a dose of 6.0 mg/l <strong>for</strong> additional disinfection and residual disinfection during Apr-Oct when MN WWTPs disinfect and 9 mg/l <strong>for</strong> Nov-Apr to provide main disinfection and residual <strong>for</strong> transmission.<br />
B - escalates 10% <strong>for</strong> flows from 1-10 mgd and 30% <strong>for</strong> flows greater than 10 mgd.<br />
C - costs based on cost curves developed and included in separate worksheet<br />
In addition to the reclaimed water costs, customers will incur internal costs <strong>for</strong> installation, operation, and maintenance of point-of-use treatment systems needed to use the<br />
reclaimed water <strong>for</strong> the facilities specific needs.
5.4 Base <strong>Water</strong> Reuse System Costs<br />
5.4.1 Treatment<br />
TM3: Recycled <strong>Wastewater</strong> System Components and Costs<br />
<strong>Recycling</strong> <strong>Treated</strong> <strong>Municipal</strong> <strong>Wastewater</strong> <strong>for</strong> <strong>Industrial</strong> <strong>Water</strong> <strong>Use</strong><br />
Section 3.3.3 defined the base water reuse system to be an advanced secondary<br />
WWTP with disinfection facilities. It was assumed the facility had all the required<br />
facilities to meet the base level water quality established except <strong>for</strong> additional<br />
disinfection system equipment to disinfect year-round and provide a residual<br />
disinfectant <strong>for</strong> transmission. The base system disinfects to a total coli<strong>for</strong>m limit of<br />
23/100 ml and provides a 2.5 mg/L chlorine dose <strong>for</strong> residual. Newdisinfection<br />
equipment and the associated O&M costs are the only additional treatment system<br />
requirements identified <strong>for</strong> the base water reuse treatment system.<br />
The chlorine doses and disinfection assumptions identified in Section 3.3.3 are applied<br />
to all WWTPs regardless of the disinfection process. The cost model reflects having<br />
the facilities sized to meet the highest dose requirement (with a peaking factor<br />
considered <strong>for</strong> feed rate ranges). As shown in Table 14, the capital cost <strong>for</strong> disinfection<br />
is estimated as a base system cost plus a cost per gallon/day (gpd) to account <strong>for</strong> the<br />
incremental costs of metering pumps, tank storage, and building footprint.<br />
Table 14. Base System: Sodium Hypochlorite Capital Costs<br />
Capacity, mgd Construction Cost<br />
Base, $ ($/gpd)<br />
≤ 0.5 $100,000 $0.10<br />
0.5 - 5 $150,000 $0.03<br />
>5 $250,000 $0.02<br />
The O&M costs <strong>for</strong> the sodium hypochlorite system in the cost model include the<br />
chemical cost at $0.70/gallon of 12.5% sodium hypochlorite and equipment<br />
maintenance. The electrical costs are considered negligible.<br />
5.4.2 Storage<br />
Storage is not considered in the base water reuse system.<br />
5.4.3 Pump Station<br />
The cost model uses a flow-based cost equation, as shown in Table 15, to determine<br />
the pump station costs. The pump station cost equations reflect some economy of<br />
scale and are based on Camp Dresser & McKee (CDM) estimates prepared <strong>for</strong> other<br />
projects (CDM, 2006 & 2003). These cost equations were checked with data compiled<br />
by MCES in review of lift station costs (MCES, 2006a & 2006b) and were found to be<br />
representative and on the conservative side. The capacity shown is <strong>for</strong> the annual<br />
average flow and assumes a peaking factor of 3 <strong>for</strong> the maximum flow pumped.<br />
Craddock Consulting Engineers 31<br />
In Association with CDM & James Crook<br />
TM3-Component&Costs_0707
TM3: Recycled <strong>Wastewater</strong> System Components and Costs<br />
<strong>Recycling</strong> <strong>Treated</strong> <strong>Municipal</strong> <strong>Wastewater</strong> <strong>for</strong> <strong>Industrial</strong> <strong>Water</strong> <strong>Use</strong><br />
Table 15. Pump Station Unit Costs<br />
Capacity, mgd Capital Cost, $/gpd<br />
≤ 0.5 0.61<br />
0.5 to 7.5 0.49<br />
≥ 7.5 0.40<br />
Source: CDM, 2006 & 2003<br />
5.4.4 Transmission Piping<br />
Transmission piping is a significant cost of the base system. For this study, the cost<br />
model was developed to account <strong>for</strong> a range of transmission main sizes and lengths,<br />
providing a family of cost curves. These cost curves, based on flow and pipe length,<br />
allow one to estimate the cost of transmission piping from a WWTP to an industry.<br />
Capital Costs<br />
The transmission system is a <strong>for</strong>ce main from the WWTP to an industry or a group of<br />
industries. Pipe materials <strong>for</strong> reclaimed water mains are typically polyvinyl chloride<br />
pipe (PVC) , DR 18, Class 150, AWWA Specifications C-900 and C-905 with push-on<br />
joints, or ductile iron pipe (DIP), Class 51, with push-on joints and cement lining on<br />
the inside and a bituminous coating (16 mils DFT) on the outside. For this cost model,<br />
it is assumed that all mains will be PVC, DR 18, Class 150 <strong>for</strong> pipe 24 inch or less in<br />
diameter and DIP Class 51 <strong>for</strong> pipe larger then 24-inch.<br />
The unit cost <strong>for</strong> materials and labor to install reclaimed water piping are summarized<br />
in Table 16. Construction and project costs are provided. The unit costs were<br />
developed from a transmission cost tool documented in Appendix B. These compare<br />
to <strong>for</strong>ce main interceptor costs (MCES, 2006a & 2006b) and water distribution system<br />
costs (Gumerman et al, 1992).<br />
The reclaimed water transmission piping is sized to convey the peak hour demand<br />
and to maintain a target velocity at the peak hour demand of 5 to 7 feet per second<br />
(fps). A peaking factor of 3.0 (peak hour/annual average) is assumed <strong>for</strong> this study. It<br />
is recognized that peak hour requirements can be much higher <strong>for</strong> some industries,<br />
particularly with batch or shift related process activity. A peaking factor of 3.0<br />
assumes that there is a main pipeline with laterals to multiple facilities and peak flows<br />
of the various industries do not all coincide.<br />
An overall minimum target pressure of 40 pound per square inch (psi) was assumed<br />
at the delivery point. This is a pressure that is suitable <strong>for</strong> most cooling water systems<br />
(one of the largest potential uses of reclaimed water <strong>for</strong> Minnesota’s industries).<br />
The annual average day reclaimed water demand evaluated with this cost model<br />
ranges from 0.1 to 30 mgd. Regression analysis was per<strong>for</strong>med to find the best fit line<br />
to estimate pipeline capital costs <strong>for</strong> a given flow at given pipe lengths. Appendix B<br />
provides the details of these analyses.<br />
32 Craddock Consulting Engineers<br />
In Association with CDM & James Crook<br />
TM3-Component&Costs_0707
TM3: Recycled <strong>Wastewater</strong> System Components and Costs<br />
<strong>Recycling</strong> <strong>Treated</strong> <strong>Municipal</strong> <strong>Wastewater</strong> <strong>for</strong> <strong>Industrial</strong> <strong>Water</strong> <strong>Use</strong><br />
Table 16. Unit Construction and Project Costs <strong>for</strong> Force Mains 1<br />
Unit Construction Cost , $/lf Unit Project Cost 2, $/lf<br />
Diameter Urban Rural Urban Rural<br />
(inches) Area Area Area Area<br />
4 54 44 97 79<br />
6 59 48 106 86<br />
8 64 53 115 95<br />
10 71 60 128 108<br />
12 78 66 140 119<br />
14 87 76 157 137<br />
16 105 93 189 167<br />
18 117 105 211 189<br />
20 131 119 236 214<br />
24 158 146 284 263<br />
30 196 180 353 324<br />
36 241 224 434 403<br />
42 295 277 531 499<br />
48 373 353 671 635<br />
54 434 413 781 743<br />
60 495 470 891 846<br />
1 Based on the following:<br />
-Sept. 2006 dollars, ENR CCI = 7763<br />
-Mean Indices, 2006 and Cost Tool with detailed unit costs (App. B, Exhibit 1)<br />
-Average depth of installation <strong>for</strong> <strong>for</strong>ce mains assumed to be 8 ft.<br />
-4 to 24” pipe is PVC; >24” is DIP<br />
2 Project unit costs based on master planning level assumptions: 50% <strong>for</strong> undeveloped<br />
design detail (includes allowance <strong>for</strong> related appurtenances).<br />
Operation and Maintenance Costs<br />
Transmission system operations costs characterized <strong>for</strong> this cost model include<br />
electrical power costs and a unit cost per mile <strong>for</strong> equipment and labor to maintain the<br />
distribution system. The total dynamic head was calculated <strong>for</strong> a range of flows and<br />
pipe lengths to estimate the pumping costs. Regression analysis was used to provide<br />
the relationship of power costs to flow at various pipe lengths. Appendix B<br />
documents this analysis.<br />
The cost to maintain the transmission pipe system is based on the length of the pipe.<br />
The unit cost selected, $5,500 per mile per year, is based on WWTP records <strong>for</strong><br />
maintenance of reclaimed water transmission system <strong>for</strong> Cary, North Carolina,<br />
escalated <strong>for</strong> larger flows (CDM, 2004). It also compares reasonably to literature<br />
references (Gumerman et al, 1992)<br />
Craddock Consulting Engineers 33<br />
In Association with CDM & James Crook<br />
TM3-Component&Costs_0707
TM3: Recycled <strong>Wastewater</strong> System Components and Costs<br />
<strong>Recycling</strong> <strong>Treated</strong> <strong>Municipal</strong> <strong>Wastewater</strong> <strong>for</strong> <strong>Industrial</strong> <strong>Water</strong> <strong>Use</strong><br />
5.4.5 Base <strong>Water</strong> Reuse System Cost Analysis Results<br />
The cost curves developed <strong>for</strong> the base system indicate that a reclaimed water supply<br />
system can be cost competitive with potable water supplies in Minnesota. This<br />
assumes that an advanced secondary wastewater treatment plant effluent water<br />
quality is available from existing facilities and is suitable <strong>for</strong> that industry, or that<br />
industry already has a treatment system in place <strong>for</strong> its existing supply that can be<br />
used (or upgraded at a nominal cost <strong>for</strong> a reclaimed supply).<br />
As shown in Figure 5 and tabulated in Appendix C, a reclaimed water system<br />
designed <strong>for</strong> an annual average flow of less than 0.5 mgd is not expected to be<br />
competitive with most potable water supplies, except where the industry is in close<br />
proximity to the WWTP. At 1 mgd, the cost of service is comparable or less than a<br />
typical potable water supply system cost of $2/1000 gallons <strong>for</strong> systems under 10<br />
miles. As the system capacity increases to 5 mgd, a 10-mile system costs about<br />
$1/1000 gallons. For flows greater than 5 mgd, as shown in Figure 6, costs drop below<br />
$0.60/1000 gallons, even at a distance of 10 miles <strong>for</strong> 30 mgd.<br />
Potable water supplies in the Minneapolis/St. Paul area range from $1-$3/1000<br />
gallons and fluctuate around that cost in other areas of Minnesota. Some rural water<br />
systems have costs over $5.00/1000 gallon. <strong>Water</strong> reuse system costs are compared to<br />
potable water supply costs to provide a perspective on the water supply market <strong>for</strong><br />
Minnesota. Those industries with their own water supply will typically have much<br />
lower costs than <strong>for</strong> a potable supply. A comparison to a potable supply is reasonable<br />
<strong>for</strong> smaller water using industries (less than 0.5 mgd water demand), which often use<br />
potable supplies, particularly in urban areas. If higher quality water is required, then<br />
potable supplies are also used and at higher volumes.<br />
Technical Memorandum 1: Implementation Issues and Customer Inventory produced<br />
<strong>for</strong> this project evaluated industries within a 5-mile range of metro area WWTPs and<br />
larger ranges in the rest of Minnesota. The base system cost of service curves indicate<br />
that service to those industries within 5 miles of a WWTP with a combined reclaimed<br />
water demand of 1 mgd or more could be provided at about $1.00/1000 gallons or<br />
less, making it competitive with potable supplies.<br />
The base system provides a water quality that could possibly be suitable <strong>for</strong> a oncethrough<br />
cooling process or sand and gravel washing. It would also be sufficient <strong>for</strong><br />
irrigation of restricted areas on industrial site grounds. To meet the anticipated water<br />
requirements <strong>for</strong> much of Minnesota’s industrial water demand, additional treatment<br />
at the WWTP or the industry site will be required. Given the high hardness in<br />
Minnesota’s source waters and high salt concentrations in wastewater (elevated<br />
chloride concentrations have been attributed to home softening system brine<br />
discharges), additional treatment may be necessary <strong>for</strong> the intended industrial water<br />
use. The treatment costs <strong>for</strong> a range of industrial uses are the subject of Section 5.6.<br />
34 Craddock Consulting Engineers<br />
In Association with CDM & James Crook<br />
TM3-Component&Costs_0707
Cost of Service, $/1000 gallon<br />
5.00<br />
4.50<br />
4.00<br />
3.50<br />
3.00<br />
2.50<br />
2.00<br />
1.50<br />
1.00<br />
0.50<br />
0.00<br />
Transmission Distance, miles<br />
1<br />
2<br />
3<br />
4<br />
5<br />
10<br />
$2/1000 gallons - Typical Potable <strong>Water</strong> Supply Cost<br />
0 0.5 1 1.5 2 2.5 3 3.5 4 4.5 5<br />
Reclaimed <strong>Water</strong> Flow/Demand, mgd<br />
Figure 5. <strong>Water</strong> Reuse System Cost of Service <strong>for</strong> 0-5 mgd Capacity<br />
Urban Area - Base System
Cost of Service, $/1000 gallon<br />
1.00<br />
0.90<br />
0.80<br />
0.70<br />
0.60<br />
0.50<br />
0.40<br />
0.30<br />
0.20<br />
0.10<br />
0.00<br />
$2/1000 gallons - Typical Potable <strong>Water</strong> Supply Cost<br />
Transmission Distance, miles<br />
1<br />
2<br />
3<br />
4<br />
5<br />
10<br />
5 10 15 20 25 30<br />
Reclaimed <strong>Water</strong> Flow/Demand, mgd<br />
Figure 6. <strong>Water</strong> Reuse System Cost of Service <strong>for</strong> 5-30 mgd Capacity<br />
Urban Area - Base System
5.5 Storage System Costs<br />
TM3: Recycled <strong>Wastewater</strong> System Components and Costs<br />
<strong>Recycling</strong> <strong>Treated</strong> <strong>Municipal</strong> <strong>Wastewater</strong> <strong>for</strong> <strong>Industrial</strong> <strong>Water</strong> <strong>Use</strong><br />
Reclaimed water storage is defined as the difference in the diurnal demand and<br />
wastewater flow. While most WWTPs have a consistent diurnal pattern that varies<br />
during the weekdays and weekend, reclaimed water demand will vary with the<br />
customer or set of customers. For this study, it is assumed that 50% of the water<br />
volume produced per day will be stored. Additional storage that may be required by<br />
individual customers and located at the customer’s sites was not considered in this<br />
analysis.<br />
Storage is assumed to be provided in an underground concrete tank, <strong>for</strong> which the<br />
unit cost of construction is estimated to be $1.70/gallon of the storage. As indicated in<br />
Figure 7, the capital cost of storage is $850,000 per mgd of the annual average<br />
reclaimed water demand. When included into the cost of service, storage adds about<br />
20 cents to the total system cost to produce 1000 gallons. Storage costs equate to about<br />
20% of the cost of service <strong>for</strong> a 2 mgd supply pumped 5 miles.<br />
Capital Cost, $Million<br />
30<br />
25<br />
20<br />
15<br />
10<br />
5<br />
0<br />
0 5 10 15 20 25 30<br />
Reclaimed <strong>Water</strong> Flow/Demand, mgd<br />
Figure 7. Storage Capital Costs<br />
5.6 Alternative <strong>Water</strong> Reuse System Costs<br />
5.6.1 Overview<br />
Six levels of reclaimed water quality were evaluated to estimate the costs to treat and<br />
distribute reclaimed water to a range of industries. The costs were developed with the<br />
same cost model used to establish the base system costs. The treatment process train<br />
was the only system component modified from the base system to estimate the<br />
alternative water quality supply costs.<br />
<strong>Water</strong> quality classifications are defined by the additional treatment provided over<br />
the base system and are referred to as Tertiary 1, 2, 3, or 4. There are three Tertiary 4<br />
classifications, each dependent on which process follows reverse osmosis: granular<br />
activated carbon (GAC), ion exchange (IE), or ultraviolet radiation (UV) with or<br />
without hydrogen peroxide (H2O2).<br />
Craddock Consulting Engineers 35<br />
In Association with CDM & James Crook<br />
TM3-Component&Costs_0707
TM3: Recycled <strong>Wastewater</strong> System Components and Costs<br />
<strong>Recycling</strong> <strong>Treated</strong> <strong>Municipal</strong> <strong>Wastewater</strong> <strong>for</strong> <strong>Industrial</strong> <strong>Water</strong> <strong>Use</strong><br />
The majority of costs presented in this study were derived from the cost curves<br />
developed in evaluation of various treatment technologies <strong>for</strong> potable water supplies<br />
under the Technologies and Costs Document <strong>for</strong> the Final Long Term 2 Enhanced<br />
Surface <strong>Water</strong> Treatment Rule and Final Stage 2 Disinfectants and Disinfection<br />
Byproducts Rule (EPA, 2005). The capital cost curves were checked against the cost of<br />
constructed projects if in<strong>for</strong>mation was available and against manufacturer’s planning<br />
level in<strong>for</strong>mation. Theses costs include the O&M costs associated with treating the<br />
water and handling the associated waste streams and final products. All cost curve<br />
and vendor supplied in<strong>for</strong>mation was adjusted using the Engineering News Record<br />
(ENR) Construction Cost Index to September 2006 dollars.<br />
Cost curves were developed <strong>for</strong> each of the six types of reclaimed water quality <strong>for</strong> a<br />
range of water demands and transmission distances, as provided <strong>for</strong> the base system<br />
cost curves shown in Figures 5 and 6. The cost curves and supporting in<strong>for</strong>mation <strong>for</strong><br />
each water type are compiled in Appendix D.<br />
5.6.2 Tertiary 1-Conventional<br />
The Cali<strong>for</strong>nia <strong>Water</strong> <strong>Recycling</strong> Criteria requires filtration, and possibly a coagulation<br />
process prior to filtration, <strong>for</strong> industrial uses of reclaimed water that contact humans.<br />
Many industrial water uses require the removal of dissolved solids from WWTP<br />
effluent. It is assumed <strong>for</strong> this study that coagulation and clarification are required,<br />
recognizing that filtration of advanced secondary effluent without these processes<br />
may suffice <strong>for</strong> many reuse applications. Tertiary 1 reclaimed water involves the use<br />
of chemicals such as ferric chloride to increase suspended solids and pathogen<br />
removal, and also <strong>for</strong> phosphorus removal, or the addition of lime if hardness needs<br />
to be reduced. A filtration process following sedimentation removes additional<br />
particulates and pathogens. The Tertiary 1 process train consists of chemical addition<br />
facilities, a flocculation basin, sedimentation, and filtration, as depicted in Figure 8.<br />
Advanced<br />
Secondary<br />
Effluent<br />
Chemical Addition<br />
Flocculation<br />
Clarification<br />
Filtration<br />
Disinfection<br />
Figure 8. Tertiary 1 - Conventional Treatment<br />
The costs presented in this study assume the use of traditional concrete basins <strong>for</strong><br />
coagulation, flocculation, and sedimentation. A gravity filtration process with sand<br />
and anthracite is assumed. There are a variety of process enhancements and<br />
fabricated systems available that can be used <strong>for</strong> removal of particulate and dissolved<br />
solids, as indicated in Section 3.2.2. The costs <strong>for</strong> these systems will vary with the<br />
36 Craddock Consulting Engineers<br />
In Association with CDM & James Crook<br />
TM3-Component&Costs_0707
TM3: Recycled <strong>Wastewater</strong> System Components and Costs<br />
<strong>Recycling</strong> <strong>Treated</strong> <strong>Municipal</strong> <strong>Wastewater</strong> <strong>for</strong> <strong>Industrial</strong> <strong>Water</strong> <strong>Use</strong><br />
Craddock Consulting Engineers 37<br />
In Association with CDM & James Crook<br />
TM3-Component&Costs_0707<br />
specific site conditions but generally will be of the same magnitude as concrete basins<br />
and gravity filters.<br />
The treatment costs, estimated in terms of the cost of service (annualized capital cost<br />
plus O&M cost) in $/1000 gallons, to provide water with lower solids concentrations,<br />
reduced risk of pathogens, and if lime is used, reduced hardness and salts, is<br />
approximately $1.75/1000 gallons <strong>for</strong> a 1 mgd supply. The cost per 1000 gallons drops<br />
to less than $0.50/1000 gallons <strong>for</strong> a 30 mgd supply.<br />
5.6.3 Tertiary 2-Membrane Filtration<br />
Industries with water uses that have less stringent dissolved constituent limits can use<br />
membrane filtration to meet the regulatory requirements <strong>for</strong> reclaimed uses with<br />
potential <strong>for</strong> human contact. Tertiary 2 water could meet the quality requirements <strong>for</strong><br />
some cooling water applications. However, as water is recycled internally several<br />
times in the process, concentrations will increase and WWTP effluent may not<br />
provide a suitable supply because of high chlorides or hardness. Another example<br />
industry would be cement production, which requires lower iron and manganese, but<br />
can use water with TDS as high as 600 mg/L. The process train <strong>for</strong> membrane<br />
filtration, shown in Figure 9, consists of membrane modules and the related piping <strong>for</strong><br />
waste streams and appurtenances <strong>for</strong> chemical treatment<br />
The treatment costs, expressed as cost of service, <strong>for</strong> membrane filtration are<br />
estimated to be $1.10/1000 gallons <strong>for</strong> a 1 mgd supply. The cost per 1000 gallons<br />
levels out after 15 mgd at around $0.75/10000 gallons.<br />
Advanced<br />
Secondary<br />
Effluent<br />
Microfiltration Disinfection<br />
Figure 9. Tertiary 2 – Membrane Filtration<br />
5.6.4 Tertiary 3-Membrane Softening<br />
As discussed under Tertiary 1 water, many industrial uses require water that is at<br />
least partially softened. Section 3.2.4 identified the different membrane softening<br />
technologies available. For this study, reverse osmosis was used to estimate the costs<br />
of membrane softening. Reverse osmosis requires a pre-filtered water supply. The<br />
cost model assumes use of microfiltration and cartridge filtration, as shown in Figure<br />
10.
TM3: Recycled <strong>Wastewater</strong> System Components and Costs<br />
<strong>Recycling</strong> <strong>Treated</strong> <strong>Municipal</strong> <strong>Wastewater</strong> <strong>for</strong> <strong>Industrial</strong> <strong>Water</strong> <strong>Use</strong><br />
Advanced<br />
Secondary<br />
Effluent<br />
Cartridge<br />
Filtration<br />
Microfiltration Reverse Osmosis Disinfection<br />
Figure 10. Tertiary 3 – Membrane Softening<br />
Reverse osmosis produces a water quality that would be adequate <strong>for</strong> most industrial<br />
process uses, except those with very specific requirements, such as electronic and<br />
computer manufacturing facilities. It also produces a higher quality of water <strong>for</strong><br />
cooling applications, which will allow <strong>for</strong> more reciruculation and water<br />
conservation.<br />
Treatments costs, expressed as cost of service, about $2.50/1000 gallons <strong>for</strong> a 1 mgd<br />
supply, dropping below $2/1000 gallons <strong>for</strong> 15 mgd capacity systems.<br />
5.6.5 Tertiary 4-Advanced<br />
Tertiary – 4 With GAC<br />
The Tertiary 4 classes of reclaimed water provide additional treatment to remove<br />
specific target constituents. Granular activated carbon (GAC) reactors are typically<br />
used to remove a variety of organic compounds and heavy metals. For this study’s<br />
cost model, the reactor is assumed to follow the reverse osmosis process as shown in<br />
Figure 11. This process train would be <strong>for</strong> a very specific situation. A more likely<br />
scenario <strong>for</strong> application would be the use of GAC following microfiltration without an<br />
RO process. This process train would be used to target specific constituents (metals,<br />
organics) <strong>for</strong> a water reuse application that was not concerned with hardness or high<br />
salt concentrations.<br />
Advanced<br />
Secondary<br />
Effluent<br />
Microfiltration<br />
Cartridge<br />
Filtration GAC<br />
Reverse Osmosis<br />
Disinfection<br />
Figure 11. Tertiary 4 – Membrane Softening with GAC<br />
38 Craddock Consulting Engineers<br />
In Association with CDM & James Crook<br />
TM3-Component&Costs_0707
TM3: Recycled <strong>Wastewater</strong> System Components and Costs<br />
<strong>Recycling</strong> <strong>Treated</strong> <strong>Municipal</strong> <strong>Wastewater</strong> <strong>for</strong> <strong>Industrial</strong> <strong>Water</strong> <strong>Use</strong><br />
This study assumed the need <strong>for</strong> carbon regeneration every 90 days, which is a<br />
conservative rate.<br />
The use of GAC following RO increases the treatment cost, expressed as cost of<br />
service, above the base system cost to $3.70/1000 gallons <strong>for</strong> a 1 mgd supply. At 30<br />
mgd, the cost is approximately $2.30/1000 gallons. This process train provides the<br />
highest costs of the six treatment trains evaluated. Without RO, the treatment costs<br />
would drop by approximately $1.30/1000 gallons <strong>for</strong> a 1 mgd system, assuming that<br />
microfiltration is still required.<br />
Tertiary – 4 With Ion Exchange<br />
Ion exchange units are commonly used at many industries that require very low<br />
levels of dissolved minerals. Similar to GAC, the ion exchange reactors would follow<br />
reverse osmosis (Figure 12).<br />
Advanced<br />
Secondary<br />
Effluent<br />
Microfiltration<br />
Cartridge<br />
Filtration Ion Exchange<br />
Reverse Osmosis<br />
Disinfection<br />
Figure 12. Tertiary 4 – Membrane Softening with Ion Exchange<br />
Ion exchange annual costs are highly variable depending on the resin type and target<br />
constituent. The estimated cost, expressed as cost of service, <strong>for</strong> ion exchange<br />
following reverse osmosis is $3.30/1000 gallons <strong>for</strong> a 1 mgd supply and $3/1000<br />
gallons <strong>for</strong> a 5 mgd supply. It is unlikely that larger volumes of this quality of water<br />
will be required; plus the annual costs would drive process requirements to use other<br />
technologies.<br />
Tertiary – 4 With Ultraviolet Radiation<br />
Additional treatment with ultraviolet radiation was included because some laboratory<br />
grade water quality is used by industry and UV provides additional pathogen<br />
protection. It can also be combined with hydrogen peroxide and other oxidants to<br />
remove persistent chemicals. In some cases, the UV and hydrogen peroxide can be<br />
used instead of reverse osmosis to target certain constituents rather than remove all<br />
constituents. UV can be pre or post-reverse osmosis, as shown in Figure 13.<br />
Disinfection prior to the membrane RO is used to minimize biofouling of the<br />
membrane. However, there could be constituents in the water that affect the<br />
transmittance and result in less economical per<strong>for</strong>mance of pathogen kill. Pilot<br />
testing is often per<strong>for</strong>med to optimize the process train and use each unit process to<br />
Craddock Consulting Engineers 39<br />
In Association with CDM & James Crook<br />
TM3-Component&Costs_0707
TM3: Recycled <strong>Wastewater</strong> System Components and Costs<br />
<strong>Recycling</strong> <strong>Treated</strong> <strong>Municipal</strong> <strong>Wastewater</strong> <strong>for</strong> <strong>Industrial</strong> <strong>Water</strong> <strong>Use</strong><br />
its full potential <strong>for</strong> overall quality and costs. UV treatment in this part of the process<br />
train adds only slightly to the cost. UV costs an additional $0.15/1000 gallons to the<br />
membrane softening treatment costs.<br />
Advanced<br />
Secondary<br />
Effluent<br />
Microfiltration<br />
Cartridge<br />
Filtration<br />
Ultraviolet Radiation*<br />
*UV can also follow RO<br />
Reverse Osmosis<br />
Disinfection<br />
<strong>for</strong> residual<br />
Figure 13. Tertiary 4 – Membrane Softening with UV<br />
5.6.6 Treatment Cost Summary<br />
The cost to treat WWTP effluent water beyond the advanced secondary treatment<br />
processes is expected to be $1.25 - $5/1000 gallons <strong>for</strong> a 0.5 mgd supply, $1.00 -<br />
$3.50/1000 gallons <strong>for</strong> a 1 mgd supply, and in the range of $0.50 - $2.50/1000 gallons<br />
<strong>for</strong> a 30 mgd supply. Figure 14 and Table 17 summarize the costs <strong>for</strong> flows from 0.1 to<br />
30 mgd <strong>for</strong> each of the tertiary reclaimed water classifications. These costs are <strong>for</strong><br />
treatment in addition to the base system treatment, transmission, and other system<br />
costs.<br />
An accurate comparison of costs <strong>for</strong> the higher quality water must include the<br />
industry’s onsite treatment cost and cannot be compared soley to the incoming water<br />
supply cost. Most industries requiring Tertiary 4 reclaimed water have their own<br />
onsite treatment systems to provide this water quality. In many cases, the industry<br />
provides this additional treatment to potable supplies. Some industries also have<br />
treatment processes to provide water of similar quality to Tertiary 1-3 reclaimed<br />
water. <strong>Water</strong> conservation practices have promoted cooling systems with higher<br />
levels of recirculation. However, this requires a higher quality of incoming water so<br />
that the concentrations of the recycle do not cause corrosion or scaling problems.<br />
In comparing conventional treatment to membrane systems to soften the water and<br />
remove dissolved solids, the membrane process is more expensive except when<br />
treating smaller supplies. However, additional credit in microbial removal with<br />
membranes could offset disinfection costs. Blended supplies and treatment streams<br />
could also be considered to optimize treatment costs and meet multiple water supply<br />
needs. The costs of conventional treatment <strong>for</strong> larger supplies may be low since it is<br />
assumed that there is adequate capacity to handle the solids and <strong>for</strong> reasonably<br />
inexpensive disposal practices, such as land application of lime sludge. This may not<br />
be an option <strong>for</strong> some municipalities or industries.<br />
40 Craddock Consulting Engineers<br />
In Association with CDM & James Crook<br />
TM3-Component&Costs_0707
Cost of Service, $/1000 gallons<br />
8.00<br />
7.00<br />
6.00<br />
5.00<br />
4.00<br />
3.00<br />
2.00<br />
1.00<br />
0.00<br />
Effluent Classification<br />
T=Tertiary; Levels 1-4<br />
T1-Conventional<br />
T2-Membrane Filtration<br />
T3-Membrane Softening<br />
T4-Ion Exchange<br />
T4-GAC<br />
T4-UV<br />
0.1 0.5 1 1.5 2 3 4 5 10 15 30<br />
Reclaimed <strong>Water</strong> Flow/Demand, mgd<br />
Figure 14. Comparison of Treatment Costs in Addition to Base System Costs
TM3: Recycled <strong>Wastewater</strong> System Components and Costs<br />
<strong>Recycling</strong> <strong>Treated</strong> <strong>Municipal</strong> <strong>Wastewater</strong> <strong>for</strong> <strong>Industrial</strong> <strong>Water</strong> <strong>Use</strong><br />
Table 17. Comparison of Treatment Costs <strong>for</strong> Different Reclaimed <strong>Water</strong> Quality Supplies*<br />
Cost of Service <strong>for</strong> Treatment, $/1000 gallons<br />
Tertiary 1 Tertiary 2 Tertiary 3 Tertiary 4<br />
Flow/<br />
Conven- Membrane Membrane Ion<br />
Demand, mgd tional Filtration Softening Exchange GAC UV<br />
0.1 6.94 2.89 4.86 6.16 7.76 5.25<br />
0.5 2.19 1.32 2.71 3.64 4.79 3.00<br />
1 1.71 1.09 2.41 3.29 3.71 2.56<br />
1.5 1.38 1.01 2.30 3.17 3.35 2.42<br />
2 1.21 0.97 2.25 3.11 3.17 2.35<br />
3 1.05 0.94 2.20 3.05 2.98 2.27<br />
4 0.91 0.95 2.20 3.04 2.92 2.27<br />
5 0.80 0.90 2.14 2.98 2.81 2.20<br />
10 0.58 0.80 2.01 2.85 2.59 2.08<br />
15 0.51 0.76 1.95 2.79 2.49 2.01<br />
30 0.44 0.73 1.85 2.68 2.31 1.89<br />
*In addition to water reuse base system costs<br />
5.7 Cost Summary<br />
The cost analysis indicates that there are economically viable applications to provide<br />
treated wastewater effluent as a water supply to industries. The technology is<br />
available and as competition increases in the membrane market, more economical<br />
solutions can be anticipated to meet the specific water quality needs <strong>for</strong> a spectrum of<br />
industries in Minnesota. Treatment costs were estimated to range from $0.50/1000<br />
gallons <strong>for</strong> larger supplies (30 mgd) with water quality suitable <strong>for</strong> cooling water to<br />
over $7.00/1000 gallons <strong>for</strong> smaller supplies (0.1 mgd) treated to meet stringent<br />
industrial water requirements.<br />
To provide a comparison of total system costs, a 5-mile transmission system was<br />
evaluated as shown in Figure 15. The cost to deliver reclaimed water, inclusive of<br />
transmission costs, and administrative/laboratory costs ranges from about $0.80 -<br />
$16.50/1000 gallons.<br />
The potential costs <strong>for</strong> a reclaimed water supply are shown in Table 18 <strong>for</strong> the general<br />
industry categories. Costs are listed <strong>for</strong> the treatment and total system costs of a 5mile<br />
transmission system. Appendices C (base system) and D (alternative water<br />
supplies) provide the detailed cost curves to identify specific costs <strong>for</strong> different flows<br />
and transmission distances. As expected, the range of costs is broad given the<br />
diversity of industries in these general industry categories and the variable water<br />
quality of WWTP effluent.<br />
The higher costs reflect treatment to achieve water quality concentrations lower than<br />
in the incoming water supply of most industries. Most industries treat their own<br />
permitted supply or potable supply to achieve the higher quality of Tertiary-4 class<br />
Craddock Consulting Engineers 41<br />
In Association with CDM & James Crook<br />
TM3-Component&Costs_0707
TM3: Recycled <strong>Wastewater</strong> System Components and Costs<br />
<strong>Recycling</strong> <strong>Treated</strong> <strong>Municipal</strong> <strong>Wastewater</strong> <strong>for</strong> <strong>Industrial</strong> <strong>Water</strong> <strong>Use</strong><br />
reclaimed water and some also treat an incoming water supply to meet Tertiary 1-3<br />
water quality levels. A comparison of reclaimed water system costs to an industry’s<br />
existing water supply cost must include any onsite treatment costs currently incurred<br />
by the industry.<br />
The cost analysis indicates that <strong>for</strong> a 1 mgd supply transmitted 5 miles, the costs <strong>for</strong><br />
lower levels of treatment can compete with potable water supplies. Most industries<br />
with a water demand of 1 mgd or less are more likely to use a potable source,<br />
depending on their water quality requirements. For these industries, reclaimed water<br />
could provide an alternative to a potable source.<br />
As the demand increases to 2 mgd, the total system cost <strong>for</strong> a base water quality is<br />
under $1.00/1000 gallon – similar to potable supplies provided by utilities using<br />
ground water supplies with minimal treatment. While industries with their own<br />
water supply system typically have water supply costs less than a $1.00/1000 gallons,<br />
these costs reflect areas with high quality, abundant sources close to the industry. For<br />
areas with water supply limitations, where ground water sources are a considerable<br />
distance or only a surface water source is available (which could also be a significant<br />
distance from the industry and require more treatment costs) reclaimed water could<br />
be a more economical water supply.<br />
Another consideration in comparing reclaimed supplies to potable water supply<br />
systems is the infrastructure capacity of the potable water system and the impact on<br />
capital expenditures. Increased domestic demand can be met without expansions if a<br />
portion of the industrial sector uses reclaimed water and the total demand <strong>for</strong> the<br />
potable water system is kept constant.<br />
The economic viability of water reuse in Minnesota will depend on the specific match<br />
of WWTP effluent quality to a customer’s water quality requirements and the<br />
availability of traditional water supplies in the area. The most significant reclaimed<br />
water quality issue <strong>for</strong> Minnesota appears to be hardness and high salts. While data<br />
across the state is lacking, given the general water supply characteristics, it is expected<br />
that many WWTPs will have effluent water quality that is not suitable <strong>for</strong> a significant<br />
portion of industrial water uses without treatment <strong>for</strong> dissolved solids. The<br />
evaluation of site-specific applications with more refined cost estimating will narrow<br />
the range of costs <strong>for</strong> supplying reclaimed water to select industries in Minnesota.<br />
6.0 References<br />
CDM, 2006. Metro <strong>Wastewater</strong> Reclamation District, City of Aurora, Sand Creek Basin<br />
<strong>Wastewater</strong> Master Plan – PAR 1005. Technical Memorandum No. 8.<br />
CDM, 2004. Durham County Reuse <strong>Wastewater</strong> Facilities Project Preliminary<br />
Engineering Report.<br />
CDM, 2003. <strong>Wastewater</strong> Reclamation District, City of Aurora <strong>Wastewater</strong> Utility Plan.<br />
42 Craddock Consulting Engineers<br />
In Association with CDM & James Crook<br />
TM3-Component&Costs_0707
Cost of Service, $/1000 gallons<br />
8.00<br />
7.00<br />
6.00<br />
5.00<br />
4.00<br />
3.00<br />
2.00<br />
1.00<br />
0.00<br />
$8.88 - Base<br />
$15.81 - Tertiary 1<br />
$11.77 - Tertiary 2<br />
$13.73 - Tertiary 3<br />
$16.64 - Tertiary 4<br />
Base<br />
Tertiary 1 - Conventional<br />
Tertiary 2 - Membrane Filtration<br />
Tertiary 3 - Membrane Softening<br />
Tertiary 4 - With GAC<br />
$2/1000 gallons<br />
Typical Potable <strong>Water</strong> Supply Cost<br />
0.1 0.5 1 1.5 2 3 4 5 10 15 30<br />
Reclaimed Flow/Demand, mgd<br />
Figure 15. Cost of a 5-Mile Transmission <strong>Water</strong> Reuse System to Meet<br />
Different <strong>Water</strong> Quality Requirements
Table 18. Range of Costs to Supply Reclaimed <strong>Water</strong> to Minnesota Industries<br />
Industry Category Type of <strong>Water</strong> <strong>Use</strong><br />
Base Tertiary-1 Tertiary-2 Tertiary-3 Tertiary-4<br />
Advanced<br />
Secondary<br />
Cost of Service, $/1000 gallons 1<br />
by Reclaimed <strong>Water</strong> Quality Classification 2<br />
Conventional<br />
Membrane<br />
Filtration<br />
Membrane<br />
Softening<br />
Advanced<br />
Processes<br />
Total<br />
System<br />
Agricultural Cooling, Boiler Feed $1.70/$3.05 $2.40/$3.75 $3.70/$5.00 $1.70-$3.70 $2.40-$5.00<br />
Pulp & Paper Process, Boiler Feed $1.70/$3.05 $1.10/$2.45 $2.40/$3.75 $3.70/$5.00 $1.70-$3.70 $2.40-$5.00<br />
Mining<br />
Sand & Gravel<br />
Process, Boiler Feed $0/$1.35 $1.70/$3.05 $2.40/$3.75 $3.70/$5.00 $0-$3.70 $1.35-$5.00<br />
Washing<br />
<strong>Industrial</strong> Cooling-<br />
Process $0/$1.35 $0 $1.35<br />
Once-Through Cooling <strong>Water</strong> $0/$1.35 $1.70/$3.05 $2.40/$3.75 $0-$2.40 $1.35-$3.75<br />
Petroleum, Chemical Cooling, Process,<br />
& Ethanol<br />
Boiler Feed<br />
Process, Cooling,<br />
$1.70/$3.05 $2.40/$3.75 $3.70/$5.00 $1.70-$3.70 $2.40-$5.00<br />
Metals<br />
Boiler Feed<br />
Process, Cooling,<br />
$1.70/$3.05 $2.40/$3.75 $3.70/$5.00 $1.70-$3.70 $2.40-$5.00<br />
Non-Metals Boiler Feed $0/$1.35 $1.70/$3.05 $1.10/$2.45 $2.40/$3.75 $3.70/$5.00 $0-$3.70 $1.35-$5.00<br />
Other<br />
Power Cooling-Once<br />
Process $0/$1.35 $1.70/$3.05 $1.10/$2.45 $2.40/$3.75 $3.70/$5.00 $0-$3.70 $1.35-$5.00<br />
Through/Other<br />
Power Cooling-<br />
Cooling $0/$1.35 $1.70/$3.05 $1.10/$2.45 $2.40/$3.75 $0-$2.40 $1.35-$3.75<br />
Recirculating Cooling, Boiler Feed $1.70/$3.05 $1.10/$2.45 $2.40/$3.75 $3.70/$5.00 $1.70-$3.70 $2.40-$5.00<br />
1<br />
Represent the costs to provide 1 mgd of reclaimed water a distance of 5 miles. First value is the treatment cost and the seccond value is the<br />
total system cost in $/1000 gallons. (e.g. For Metals industries: the treatment costs are estimated to range from $1.70-$3.70/1000 gallons and<br />
the total system costs are estimated to range from $3.05-$5.00/1000 gallons.<br />
2 Refer to Table 10, Section 3.4.3 <strong>for</strong> relationship of reclaimed water classification to industry categories.<br />
3 This range reflects the cost to provide water to meet the water quality requirements <strong>for</strong> all uses of water by this industry sector. An accurate<br />
comparison to an industry's existing water supply costs must account <strong>for</strong> all onsite industry treatment system annualized capital and O&M<br />
costs.<br />
Range of Costs 3 ,<br />
$/1000 gallons<br />
Treatment<br />
Above Base<br />
System
TM3: Recycled <strong>Wastewater</strong> System Components and Costs<br />
<strong>Recycling</strong> <strong>Treated</strong> <strong>Municipal</strong> <strong>Wastewater</strong> <strong>for</strong> <strong>Industrial</strong> <strong>Water</strong> <strong>Use</strong><br />
Reahl, Eugene, 2006. Half a Century of Desalination with Electrodialysis. GE <strong>Water</strong> and<br />
Process Technologies.<br />
Environmental Protection Agency (EPA), 2005. Technologies and Costs Document <strong>for</strong> the<br />
Final Long Term 2 Enhanced Surface <strong>Water</strong> Treatment Rule and Final Stage 2 Disinfectants<br />
and Disinfection Byproducts Rule. December. EPA 815-R-05-013.<br />
Goldstein, D.J., I. Wei, and R.E. Hicks. 1979. “Reuse of <strong>Municipal</strong> <strong>Wastewater</strong> as<br />
Make-Up to Circulating Cooling Systems”. In: Proceedings of the <strong>Water</strong> Reuse<br />
Symposium, Vol. 1. pp. 371-397, March 25-30, 1979, Washington, D.C. Published by<br />
the AWWA Research Foundation, Denver, Colorado.<br />
Gumerman, R.C., B. E. Burris, and D.E Burris, 1992. Standardized Costs <strong>for</strong> <strong>Water</strong> Supply<br />
Distribution Systems. EPA/600/R-92/009.<br />
MCES, 2006a. Memorandum from G. Sprouse, August 18, 2006. “Summary of Historic<br />
MCES Pipeline Construction Costs and Comparison to Blue Lake-Metro Service Area<br />
Plan Cost Estimating Tool – Draft 1.”<br />
MCES, 2006b. Memorandum from G. Sprouse, September 28, 2006. “Summary of<br />
Historic MCES Costs, Update to Graphs.”<br />
Metcalf & Eddy, Inc., 2007. <strong>Water</strong> Reuse: Issues, Technologies, and Applications. McGraw<br />
Hill. New York.<br />
State of Cali<strong>for</strong>nia. 2000. <strong>Water</strong> <strong>Recycling</strong> Criteria. Title 22, Division 4, Chapter 3,<br />
Cali<strong>for</strong>nia Code of Regulations. Cali<strong>for</strong>nia Department of Health Services, Drinking<br />
<strong>Water</strong> Program, Sacramento, Cali<strong>for</strong>nia.<br />
Stephenson, T. S., J. B. Jefferson, and K. Brindle. 2000. Membrane Bioreactors <strong>for</strong><br />
<strong>Wastewater</strong> Treatment. IWA Publishing, London.<br />
Tchobanoglous, G., F.L Burton, and H.D. Stensel. 2003. <strong>Wastewater</strong> Engineering:<br />
Treatment and Reuse, 4 th ed. McGraw-Hill, New York.<br />
<strong>Water</strong> Pollution Control Federation. 1989. <strong>Water</strong> Reuse (Second Edition). Manual of<br />
Practice SM-3. <strong>Water</strong> Pollution Control Federation, Alexandria, Virginia.<br />
White, G. C., 1999. Handbook of Chlorination and Alternative Disinfectants, 4 th ed., John<br />
Wiley & Sons, New York.<br />
Wong, J. 2003. “A Survey of Advanced Membrane Technologies and Their<br />
Applications in <strong>Water</strong> Reuse Projects.” In: Proceedings of the 76 th Annual Technical<br />
Exhibition & Conference, <strong>Water</strong> Environment Federation, Alexandria, Virginia.<br />
Craddock Consulting Engineers 43<br />
In Association with CDM & James Crook<br />
TM3-Component&Costs_0707
TM3: Recycled <strong>Wastewater</strong> System Components and Costs<br />
<strong>Recycling</strong> <strong>Treated</strong> <strong>Municipal</strong> <strong>Wastewater</strong> <strong>for</strong> <strong>Industrial</strong> <strong>Water</strong> <strong>Use</strong><br />
Page left intentionally blank<br />
44 Craddock Consulting Engineers<br />
In Association with CDM & James Crook<br />
TM3-Component&Costs_0707
Appendix A<br />
<strong>Water</strong> Reuse Regulatory Exhibits
Exhibit 1<br />
Cali<strong>for</strong>nia <strong>Water</strong> <strong>Recycling</strong> Criteria
Table A-1. 2000 Cali<strong>for</strong>nia <strong>Water</strong> <strong>Recycling</strong> Criteria<br />
Type of <strong>Use</strong><br />
Total Coli<strong>for</strong>m<br />
Limits a<br />
Irrigation of fodder, fiber, and seed crops, orchards<br />
Treatment<br />
Required<br />
b and<br />
vineyards b , processed food crops c , nonfood-bearing<br />
trees, ornamental nursery stock d , and sod farms d ;<br />
flushing sanitary sewers<br />
None required Oxidation<br />
Irrigation of pasture <strong>for</strong> milking animals, landscape<br />
areas e , ornamental nursery stock and sod farms where<br />
public access is not restricted; landscape impoundments;<br />
industrial or commercial cooling water where no mist is<br />
created; nonstructural fire fighting; industrial boiler<br />
feed; soil compaction; dust control; cleaning roads,<br />
sidewalks, and outdoor areas<br />
Irrigation of food crops b ; restricted recreational<br />
impoundments; fish hatcheries<br />
Irrigation of food crops f and open access landscape<br />
areas g ; toilet and urinal flushing; industrial process<br />
water; decorative fountains; commercial laundries and<br />
car washes; snow-making; structural fire fighting;<br />
industrial or commercial cooling where mist is created<br />
Nonrestricted recreational impoundments<br />
≤23/100 ml a<br />
≤240/100 ml in more than<br />
one sample in any 30-day<br />
≤2.2/100 ml a<br />
≤23/100 ml in more than one<br />
sample in any 30-day period<br />
≤2.2/100 ml a<br />
≤23/100 ml in more than one<br />
sample in any 30-day period<br />
240/100 ml (maximum)<br />
≤2.2/100 ml a<br />
≤23/100 ml in more than one<br />
sample in any 30-day period<br />
240/100 ml (maximum)<br />
Groundwater recharge by spreading Case-by-case evaluation<br />
Oxidation<br />
Disinfection<br />
Oxidation<br />
Disinfection<br />
Oxidation<br />
Coagulation h<br />
Filtration i<br />
Disinfection<br />
Oxidation<br />
Coagulation<br />
Clarification j<br />
Filtration i<br />
Disinfection<br />
Case-by-case<br />
evaluation<br />
a<br />
Based on running 7-day median; daily sampling is required.<br />
b<br />
No contact between reclaimed water and edible portion of crop.<br />
c<br />
Food crops that undergo commercial pathogen-destroying prior to human consumption.<br />
d<br />
No irrigation <strong>for</strong> at least 14 days prior to harvesting, sale, or allowing public access.<br />
e<br />
Cemeteries, freeway landscaping, restricted access golf courses, and other controlled access areas.<br />
f<br />
Contact between reclaimed water and edible portion of crop; includes edible root crops.<br />
g<br />
Parks, playgrounds, schoolyards, residential landscaping, unrestricted access golf courses, and other<br />
uncontrolled access irrigation areas.<br />
h<br />
Not required if the turbidity of influent to the filters is continuously measured, does not exceed 5 NTU<br />
<strong>for</strong> more than 15 minutes and never exceeds 10 NTU, and there is capability to automatically activate<br />
chemical addition or divert wastewater if the filter influent turbidity exceeds 5 NTU <strong>for</strong> more than 15<br />
minutes.<br />
i<br />
The turbidity after filtration through filter media cannot exceed an average of 2 nephelometric turbidity<br />
units (NTU) within any 24-hour period, 5 NTU more than 5 percent of the time within a 24-hour period,<br />
and 10 NTU at any time. The turbidity after filtration through a membrane process cannot exceed 0.2<br />
NTU more than 5 percent of the time within any 24-hour period and 0.5 NTU at any time.<br />
j<br />
Not required if reclaimed water is monitored <strong>for</strong> enteric viruses, Giardia, and Cryptosporidium.<br />
Source: Adapted from State of Cali<strong>for</strong>nia [2000a].
Exhibit 2<br />
Cali<strong>for</strong>nia Treatment Technology Report <strong>for</strong><br />
Recycled <strong>Water</strong>, January 2007<br />
Table of Contents – Provides list of<br />
Approved Technologies<br />
(refer to full reference <strong>for</strong> additional detail, with website reference:<br />
http://www.dhs.ca.gov/ps/ddwem/waterrecycling/PDFs/treatmenttechnology.pdf)
Cali<strong>for</strong>nia<br />
Department of<br />
Health Services<br />
SANDRA SHEWRY<br />
Director<br />
State of Cali<strong>for</strong>nia—Health and Human Services Agency<br />
Department of Health Services<br />
STATE OF CALIFORNIA<br />
DIVISION OF DRINKING WATER<br />
AND<br />
ENVIRONMENTAL MANAGEMENT<br />
TREATMENT TECHNOLOGY REPORT<br />
FOR<br />
RECYCLED WATER<br />
January 2007<br />
Recycled <strong>Water</strong> Unit/Technical Operations Section/Technical Programs Branch<br />
11800 Eugenia Place, Suite 200, Carpinteria, Cali<strong>for</strong>nia 93013<br />
Phone: (805) 566-1326; Fax (805) 745-8196<br />
Internet address: http://www.dhs.ca.gov/ps/ddwem/<br />
ARNOLD SCHWARZENEGGER<br />
Governor<br />
This document has been developed to serve as a reference source <strong>for</strong> those seeking in<strong>for</strong>mation<br />
concerning technologies that have been recognized by the Cali<strong>for</strong>nia State Department of Health<br />
Services (CDHS) as being acceptable <strong>for</strong> compliance with treatment requirements of the<br />
Cali<strong>for</strong>nia Recycled <strong>Water</strong> Criteria. This is a “living” document that will be updated<br />
periodically as needed. Readers who find errors or omissions should contact Jeff Stone of the<br />
CDHS Recycled <strong>Water</strong> Unit at jstone1@dhs.ca.gov.
STATE OF CALIFORNIA<br />
DEPARTMENT OF HEALTH SERVICES<br />
DIVISION OF DRINKING WATER<br />
AND<br />
ENVIRONMENTAL MANAGEMENT<br />
TREATMENT TECHNOLOGY REPORT FOR RECYCLED WATER<br />
1. INTRODUCTION<br />
2. GENERAL GUIDANCE<br />
3. FILTRATION TECHNOLOGIES:<br />
January 2007<br />
TABLE OF CONTENTS<br />
Granular Media Type Filters<br />
DynaSand (Parkson Corp.)<br />
SuperSand (<strong>Water</strong>link Separations, Inc.)<br />
Technasand (Westech Engineering)<br />
Astrasand (US Filter Davco Products)<br />
Centra-flo(Upflow)(Applied Process Technology, Inc.)<br />
Hydro-Clear (U.S. Filter-Zimpro)<br />
ABW, Infilco-Degremont<br />
AquaABF (Aqua Aerobics Systems, Inc.<br />
Gravisand (US Filter Davco Products)<br />
Tetra-Denit. (Tetra Technologies, Inc.)<br />
Centra-Flo (Gravity)(Applied Process Technology, Inc.)<br />
Fluidsand (Fluidyne, Corp.)<br />
Hydrasand (Andritz Ruthner, Inc.)<br />
Strata-Sand (Ashbrook Corp.)<br />
Micromedia Filtration, Inc.<br />
Volcano<br />
2
Other Media Type Filters<br />
Fuzzy Filter (Schreiber LLC)<br />
Membrane Technologies<br />
ZENON<br />
-Cycle-let (Zenon Environmental, Inc.)<br />
-ZeeWeed/Zenogem<br />
-ZeeWeed 1000 UF<br />
U.S. Filter/Memcor<br />
-CMF (0.2 micron-PP and 0.1 micron-PVDF)<br />
-CMF-Submerged (0.2 micron-PP and 0.1 micron-PVDF)<br />
U.S. Filter/Jet Tech<br />
-Jet Tech Products-Memjet tm<br />
PALL Corporation<br />
Mitsubishi<br />
Kubota<br />
Ionics<br />
-Norit X-Flow<br />
Koch/Puron<br />
Huber Technologies<br />
Parkson/Dynalift<br />
Cloth Filters<br />
Aqua-Aerobics – rotating disk<br />
-102 needle felt fabric<br />
-PA-13 nylon pile fabric<br />
-MMK2-13 acrylic pile fabric<br />
Aqua-Aerobics - AquaDiamond tm<br />
U.S. Filter-Kruger Products<br />
- Hydrotech Polyester media filter<br />
4. DISINFECTION TECHNOLOGIES<br />
Trojan Technologies<br />
PCI–Wedeco<br />
Wedeco-Ideal Horizons<br />
Aquionics<br />
Ultraguard (Service Systems)<br />
Aquaray (Infilco-Degremont)<br />
UltraTech<br />
3
APPENDIX<br />
‘A’ – Cali<strong>for</strong>nia Department of Health Services<br />
Requirements <strong>for</strong> Demonstration of Reduction of Virus<br />
and Bacteria by Filtration and Disinfection<br />
‘B’ – Memorandum concerning cleaning of UV quartz sleeves<br />
4
Appendix B<br />
TECHNICAL MEMORANDUM<br />
Reclaimed <strong>Water</strong> Transmission Main<br />
Capital Cost and Pumping Cost Analysis
Introduction<br />
Appendix B<br />
Reclaimed <strong>Water</strong> Transmission Main Capital Cost and Pumping Cost Analysis<br />
This technical memorandum presents the assumptions, methods, and results of a<br />
transmission main capital cost and power cost analysis of a general water reuse system.<br />
Piping Capital Cost<br />
It is assumed that all reclaimed water transmission pipes will be <strong>for</strong>ce mains <strong>for</strong> this master<br />
planning level of analysis. Typically, pipe materials <strong>for</strong> reclaimed water mains are polyvinyl<br />
chloride pipe (PVC) , specified as DR 18, Class 150, meeting AWWA Specifications C-900<br />
and C-905 with push-on joints, or ductile iron pipe (DIP), Class 51, with push-on joints and<br />
cement lining on the inside and a bituminous coating (16 mils DFT) on the outside. For the<br />
purposes of this analysis, it is assumed that all mains 24 inch or less in diameter will be PVC,<br />
DR 18, Class 150; and <strong>for</strong> pipe larger than 24 inch, DIP class 51.<br />
A pressure of 40 pound per square inch (psi) at the end of the transmission main was<br />
assumed <strong>for</strong> developing this conceptual design. No storage facilities will be required within<br />
the reclaimed water distribution network.<br />
Pipe Sizing<br />
The reclaimed water transmission piping is sized to convey the peak hour demand, which is<br />
assumed to be 3.0 times the annual average day reclaimed water demand, and to maintain a<br />
target velocity at the peak hour demand of 5.0 to 7.0 feet per second (ft/sec). The annual<br />
average day reclaimed water demands evaluated ranges from 0.1 to 30 mgd. The resulting<br />
peak hourly demands are in the range of 0.3 to 90 mgd.<br />
Method<br />
The unit costs <strong>for</strong> pipeline construction were estimated using a transmission main cost tool.<br />
The transmission main cost tool is a set of spreadsheets developed to estimate pipe<br />
construction costs. The tool includes: 1) spreadsheets <strong>for</strong> input parameters including pipe<br />
material cost and installation rate, construction unit costs <strong>for</strong> items such as pavement<br />
removal and replacement, sod, seed, and equipment costs <strong>for</strong> items such as an excavator,<br />
vibratory hand compactor, and trench box; 2) a spreadsheet <strong>for</strong> developing the unit<br />
construction cost of pipeline ($/ft), which incorporates all the costs in (1) and additional<br />
input parameters such as depth of cover <strong>for</strong> pipes, trench width, restoration width by type<br />
of restoration, and traffic control requirements. One cost tool was developed <strong>for</strong> PVC pipe<br />
and a second was developed <strong>for</strong> DIP, both presented in Exhibit 1.<br />
The unit costs <strong>for</strong> construction of various sizes of a transmission main were developed<br />
separately <strong>for</strong> urban versus rural areas. Key assumptions used in the transmission main cost<br />
tool <strong>for</strong> this unit cost analysis are:<br />
• Average depth of cover <strong>for</strong> transmission mains is 8 ft.<br />
B-2
Appendix B<br />
Reclaimed <strong>Water</strong> Transmission Main Capital Cost and Pumping Cost Analysis<br />
• In urban areas: 50 ft per 600 ft of pipe installation are assumed to require<br />
pavement removal and replacement to account <strong>for</strong> crossing streets. The entire<br />
length includes traffic control and one curb is replaced.<br />
• Surface restoration is sod in urban areas and seeding in rural areas.<br />
Unit costs at a project level were developed by applying several multipliers to the unit<br />
construction costs estimated <strong>for</strong> the transmission mains. To calculate a project cost,<br />
undeveloped design details were estimated as 50% of the construction cost, administration<br />
and legal expenses were calculated as 20% of the construction cost plus the undeveloped<br />
design details. The undeveloped design detail includes an allowance <strong>for</strong> related<br />
appurtenances including manholes, isolation valves, and combination air release/vacuum<br />
valves. The contractor’s overhead and profit was included in the construction cost.<br />
Table 1. Unit Construction and Project Costs <strong>for</strong> Force Mains 1<br />
Unit Construction Cost<br />
Unit Project Cost<br />
($/LF)<br />
2<br />
($/LF)<br />
Sept. 2006 dollars Sept. 2006 dollars<br />
Diameter Urban Rural Urban Rural<br />
(inches) Area Area Area Area<br />
4 54 44 97 79<br />
6 59 48 106 86<br />
8 64 53 115 95<br />
10 71 60 128 108<br />
12 78 66 140 119<br />
14 87 76 157 137<br />
16 105 93 189 167<br />
18 117 105 211 189<br />
20 131 119 236 214<br />
24 158 146 284 263<br />
30 196 180 353 324<br />
36 241 224 434 403<br />
42 295 277 531 499<br />
48 373 353 671 635<br />
54 434 413 781 743<br />
60 495 470 891 846<br />
1 Based on the following:<br />
-Sept. 2006 dollars, ENR CCI = 7763<br />
-Mean Indices, 2006 and Cost Tool with detailed unit costs (Exhibit 1)<br />
-Average depth of installation <strong>for</strong> <strong>for</strong>ce mains assumed to be 8 ft.<br />
-4 to 24” pipe is PVC; >24” is DIP<br />
2<br />
Project unit costs based on master planning level assumptions: 50% <strong>for</strong> undeveloped design detail<br />
(includes allowance <strong>for</strong> related appurtenances), Contractor OH&P (included in Construction Cost), and<br />
20% <strong>for</strong> Engineering, Admin, and Legal.<br />
B-3
Pipeline Capital Cost<br />
Appendix B<br />
Reclaimed <strong>Water</strong> Transmission Main Capital Cost and Pumping Cost Analysis<br />
Capital costs by distance are developed based on the unit project cost <strong>for</strong> pipeline and<br />
distance of the industry from the wastewater treatment facilities (1-10 miles). Annualized<br />
capital costs are also developed based on a 20-yr debt service and presented as a cost of<br />
service, in $/1000 gallons. Regression analysis was per<strong>for</strong>med to find the best fit line to<br />
estimate pipeline capital costs <strong>for</strong> a given pipe length. Exhibit 2 provides the details of these<br />
analyses <strong>for</strong> urban areas and rural areas.<br />
Power Cost <strong>for</strong> Pumping<br />
Annual power costs were developed <strong>for</strong> average flows of 1 to 30 mgd over transmission<br />
lengths of 1 to 10 miles, based on the total friction head and a residual pressure of 40 psi. A<br />
regression analysis was used to provide the relationship of power costs to flow <strong>for</strong> various<br />
pipe lengths. Exhibit 3 documents the details of these analyses.<br />
B-4
Exhibit 1<br />
Transmission Main Cost Tool
<strong>Water</strong> Reuse Pipe Line Unit Construction Cost<br />
Pipe Material: DR 18 PVC<br />
Start Sta. End Sta. length diameter (in)<br />
start depth (ft)<br />
end depth (ft)<br />
X Hor.: 1 Vert.<br />
depth of vertical cut at<br />
bottom<br />
average depth (ft)<br />
design parameter key<br />
upstream MH diameter<br />
Urban Applications<br />
0 550 550 4 8 8 1 10 8.108 1 3 4 4.0 0 0 0 10 0 1 0 0 $50.52<br />
550 600 50 4 8 8 1 10 8.108 1 3 4 4.0 6 1 0 0 0 1 0 0 $87.83<br />
Weighted Average $53.63<br />
600 1150 550 6 8 8 1 10 8.250 2 3 4 4.0 0 0 0 10 0 1 0 0 $55.20<br />
1150 1200 50 6 8 8 1 10 8.250 2 3 4 4.0 6 1 0 0 0 1 0 0 $92.52<br />
Weighted Average $58.31<br />
1200 1750 550 8 8 8 1 10 8.302 3 3 4 4.0 0 0 0 10 0 1 0 0 $60.17<br />
1750 1800 50 8 8 8 1 10 8.302 3 3 4 4.0 6 1 0 0 0 1 0 0 $97.48<br />
Weighted Average $63.28<br />
1800 2350 550 10 8 8 1 10 8.354 4 3 4 4.0 0 0 0 10 0 1 0 0 $67.16<br />
2350 2400 50 10 8 8 1 10 8.354 4 3 4 4.0 8 1 0 0 0 1 0 0 $113.08<br />
Weighted Average $70.99<br />
2400 2950 550 12 8 8 1 10 8.406 5 4 4 4.0 0 0 0 10 0 1 0 0 $73.40<br />
2950 3000 50 12 8 8 1 10 8.406 5 4 4 4.0 8 1 0 0 0 1 0 0 $119.32<br />
Weighted Average $77.22<br />
3000 3550 550 14 8 8 1 10 8.458 6 4 4 4.0 0 0 0 10 0 1 0 0 $82.84<br />
3550 3600 50 14 8 8 1 10 8.458 6 4 4 4.0 8 1 0 0 0 1 0 0 $128.76<br />
Weighted Average $86.67<br />
3600 4150 550 16 8 8 1 10 8.510 7 4 6 6.0 0 0 0 10 0 1 0 0 $100.41<br />
4150 4200 50 16 8 8 1 10 8.510 7 4 6 6.0 10 1 0 0 0 1 0 0 $154.93<br />
Weighted Average $104.95<br />
4200 4750 550 18 8 8 1 10 8.563 8 4 6 6.0 0 0 0 10 0 1 0 0 $112.44<br />
4750 4800 50 18 8 8 1 10 8.563 8 4 6 6.0 10 1 0 0 0 1 0 0 $166.96<br />
Weighted Average $116.98<br />
4800 5350 550 20 8 8 1 10 8.615 9 4 6 6.0 0 0 0 10 0 1 0 0 $126.49<br />
5350 5400 50 20 8 8 1 10 8.615 9 4 6 6.0 10 1 0 0 0 1 0 0 $181.01<br />
Weighted Average $131.03<br />
5400 5950 550 24 8 8 1 10 8.723 10 5 6 6.0 0 0 0 10 0 1 0 0 $153.60<br />
5950 6000 50 24 8 8 1 10 8.723 10 5 6 6.0 10 1 0 0 0 1 0 0 $208.13<br />
Weighted Average $158.15<br />
Rural Applications:<br />
0 600 600 4 8 8 1 10 8.108 1 3 4 4.0 0 0 0 0 10 0 0 0 $43.52<br />
0 600 600 6 8 8 1 10 8.250 2 3 4 4.0 0 0 0 0 10 0 0 0 $48.02<br />
0 600 600 8 8 8 1 10 8.302 3 3 4 4.0 0 0 0 0 10 0 0 0 $52.93<br />
0 600 600 10 8 8 1 10 8.354 4 3 4 4.0 0 0 0 0 10 0 0 0 $59.87<br />
0 600 600 12 8 8 1 10 8.406 5 4 4 4.0 0 0 0 0 10 0 0 0 $66.07<br />
0 600 600 14 8 8 1 10 8.458 6 4 4 4.0 0 0 0 0 10 0 0 0 $75.49<br />
0 600 600 16 8 8 1 10 8.510 7 4 6 6.0 0 0 0 0 10 0 0 0 $92.63<br />
0 600 600 18 8 8 1 10 8.563 8 4 6 6.0 0 0 0 0 10 0 0 0 $104.55<br />
0 600 600 20 8 8 1 10 8.615 9 4 6 6.0 0 0 0 0 10 0 0 0 $118.50<br />
0 600 600 24 8 8 1 10 8.723 10 5 6 6.0 0 0 0 0 10 0 0 0 $145.43<br />
costs do not include: support and/or relocation of utilities geotechnical investigation<br />
permanent easement rock excavation<br />
temporary easement contractors mobilization, bonds, overhead and profit<br />
engr and admin costs tree removal and replacement<br />
surveying<br />
Transmission Main cost estimator_PVC_2007_FINAL.xls,<br />
project_costs Page 1 of 1 3/30/2007 3:19 PM<br />
trench bottom width (ft)<br />
trench top width (ft)<br />
pavement width cut (ft)<br />
Curb replacement (ea)<br />
Walk replacement (ftwidth)<br />
sod replacement width<br />
(ft)<br />
seeding width (ft)<br />
traffic control<br />
personnel<br />
trench support (1=yes)<br />
dewatering wells<br />
(1=yes)<br />
unit cost of pipeline,<br />
$/ft
Pipe Installation Data (DR 18 PVC Pipe)<br />
Pipe ID<br />
(in)<br />
1 2 3 4 5 6 7 8 9 10 11 12 13 14<br />
Key Wall (in) -<br />
1<br />
Pipe OD<br />
(ft)<br />
Pipe Area<br />
(sf)<br />
Bed under<br />
pipe (ft)<br />
Bottom<br />
Trench<br />
Width (ft)<br />
Bedding<br />
Depth (ft)<br />
Bedding<br />
Area (sf)<br />
Excavation<br />
Rate (cy/hr)<br />
- 2<br />
B&C of<br />
select<br />
(cy/hr) - 3<br />
B&C of<br />
native<br />
(cy/hr) - 4<br />
Pipe<br />
Install<br />
Rate (ft/hr)<br />
- 5<br />
Pipe<br />
Costs ($) -<br />
6<br />
4 1 0.6 0.43 0.15 0.11 4 1.5 6.0 75 11 25 43.7 3.77<br />
6 2 3 1.00 0.79 0.25 4 2.3 8.2 75 11 25 43.3 6.63<br />
8 3 3.25 1.21 1.15 0.30 4 2.5 8.9 75 11 25 42.9 11.04<br />
10 4 3.5 1.42 1.58 0.35 4 2.8 9.5 75 11 25 42.4 17.55<br />
12 5 3.75 1.63 2.07 0.41 4 3.0 10.1 75 11 25 42.0 23.41<br />
14 6 4 1.83 2.64 0.46 4 3.3 10.5 75 11 25 41.6 32.57<br />
16 7 4.25 2.04 3.27 0.51 6 3.6 18.0 100 11 75 41.1 42.58<br />
18 8 4.5 2.25 3.98 0.56 6 3.8 18.9 100 11 75 40.7 53.49<br />
20 9 4.75 2.46 4.75 0.61 6 4.1 19.7 100 11 75 40.3 66.52<br />
24 10 5.35 2.89 6.57 0.72 6 4.6 21.1 100 11 75 39.4 91.80<br />
Notes:<br />
1 - PVC Pipe, DR 18<br />
2 - Means 02315.424.0200<br />
3 - Means 02315.110.1100 - Crew A1<br />
4 - Approximated - Crew B10G<br />
5 - In<strong>for</strong>mation from Contractor<br />
6 - Quotation from Vendor - HD <strong>Water</strong>works (Unit cost in this column includes mechanical joints and pipe cost; Pipe manufacturer: Diamond Plastics Corp.)<br />
Transmission Main cost estimator_PVC_2007_FINAL.xls, pipe_param Page 1 of 1 3/30/2007 2:51 PM
Construction Unit Costs<br />
Item (2006 Means) Description Qty Power Production Costs St. Paul Present Cost Total Cost Source Notes<br />
Select backfill (cy)<br />
(Hp) (unit/hr) ($/unit) Index * Index ($/unit)<br />
02315.110.0300 select backfill, no comp 1 18.21 98.5% 100.0% 17.94 Means 2006 includes O&P (material costs + 10%)<br />
Total 17.94<br />
Pavement Removal and Replacement (sy)<br />
02220.250.5050 4 - 6" bit pavement removal (sy) 1 420 6.75 98.5% 100.0% 6.65 Means 2006 includes O&P<br />
02315.490.0550 Disposal - 10 mi rt haul - (cy) 0.167 15.00 98.5% 100.0% 2.47 Means 2003 includes O&P<br />
02220.330.0100 Disposal - tipping fee (ton) 0.217 70.00 98.5% 100.0% 14.94 Means 2006 includes O&P<br />
02315.110.0300 6" select backfill, no comp (cy) 0.167 18.21 98.5% 100.0% 2.99 Means 2006 includes O&P (material costs + 10%)<br />
02300.432.2220 Dozer - 150 haul (cy) 0.167 4.82 98.5% 100.0% 0.80 Means 2006 includes O&P<br />
02315.310.5000 Compaction - vibrating roller 2 pass (cy) 0.167 0.35 98.5% 100.0% 0.06 Means 2006 includes O&P<br />
02740.310.0120 Binder course - 2" thick 1 6345 5.25 98.5% 100.0% 5.18 Means 2006 includes O&P<br />
02740.310.0380 Wearing course - 2" thick 1 6325 5.70 98.5% 100.0% 5.62 Means 2006 includes O&P<br />
Sod (sy)<br />
Total 38.71 City Minneapolis allowance is 50$/sy<br />
02910.710.2620 Rough grade prep (msf) 0.009 11.7 98.5% 100.0% 0.11 Means 2006 includes O&P<br />
02910.710.3920 Spread topsoil, 4" (msf) 0.009 470 98.5% 100.0% 4.17 Means 2006 includes O&P, includes material<br />
02920.400.0200 Sod, bluegrass, per MSF 0.009 22 390 98.5% 100.0% 3.46 Means 2006 includes O&P<br />
Seed (sy)<br />
Total 7.74<br />
02910.710.2620 Rough grade prep (msf) 0.009 11.7 98.5% 100.0% 0.11 Means 2006 includes O&P<br />
02910.710.3920 Spread topsoil, 4" (msf) 0.009 470 98.5% 100.0% 4.17 Means 2006 includes O&P, includes material<br />
02920.320.320 Hydroseed w/ mulch&fert. - (msf) 0.009 80 46.5 98.5% 100.0% 0.42 Means 2006 includes O&P<br />
Trench Support (sf)<br />
Total 4.70<br />
02250.400.1800 25' deep exc, drive, extract, salvage 1 553 20 103.4% 100.0% 20.68 Means 2006 includes O&P<br />
Dewatering (lf)<br />
Total 20.68<br />
Months 1<br />
Depth (ft) 25<br />
Spacing (ft) 200<br />
02240.700.0050 Wells 10-20' deep, ave 0.125 19.4 103.4% 100.0% 2.51 Means 2006 indludes O&P; lineal measure is well spacing/depth<br />
01.54.33.40.4700 Subm pump, 2", 120 gpm -rent 0.005 192 101.8% 100.0% 0.98 Means 2006 includes O&P; qty is months rental<br />
01.54.33.40.2700 Gen, elect, 100 kw -rent 0.005 7.2 98.5% 100.0% 0.04 Means 2006 includes O&P; qty is months-kw; cost is monthy rental per kw<br />
01.54.33.40.2700 Gen, elect, 100 kw -operate 27.23 0.18 98.5% 100.0% 4.83 Means 2006 includes O&P; 10hp = 7.46 kw/hr, 5446 kw/mo; cost is per kw<br />
Total 8.36<br />
Maintenance Structure (each)<br />
Base unit (10-ft) 1 0.00 Estimate <strong>for</strong> planning = $2000, See detailed estimate <strong>for</strong> structures<br />
Extension (ft)<br />
Concrete Curb Removal and Replacement (lf)<br />
1 0.00 Estimate from special pipe costs is $150/ft, See detailed estimate <strong>for</strong> structures<br />
02220.250.6100 Removal, Curbs, rein<strong>for</strong>ced (lf) 1 420 4.94 98.5% 100.0% 4.87 Means 2006 includes O&P<br />
02315.490.0550 10 mi rt haul (16.5 cy) - per yard 0.058 15.00 103.4% 100.0% 0.91 Means 2003 includes O&P<br />
02220.330.0100 Disposal - tipping fee (ton) 0.084 70.00 98.5% 100.0% 5.82 Means 2006 includes O&P<br />
02315.110.0300 6" select backfill, no comp (cy) 0.019 18.21 98.5% 100.0% 0.34 Means 2006 includes O&P (material costs + 10%)<br />
02315.310.7000 Compaction, 18" vibrate plate (cy) 0.019 1.86 98.5% 100.0% 0.04 Means 2006 includes O&P<br />
02770.300.0300 Curb, machine <strong>for</strong>m straight (lf) 1 6345 8.25 98.5% 100.0% 8.13 Means 2006 includes O&P<br />
Total 20.11<br />
Concrete Walk Removal and Replacement (ft-width)<br />
02220.240.4100 Sidewalk removal, concrete, 4" reinf. (sy) 0.111 8.45 98.5% 100.0% 0.93 Means 2006<br />
02315.490.0550 10 mi rt haul (16.5 cy) - per yard 0.016 15.00 103.4% 100.0% 0.25 Means 2003 includes O&P<br />
02220.330.0100 Disposal - tipping fee (ton) 0.023 70.00 98.5% 100.0% 1.56 Means 2006 includes O&P<br />
02315.110.0300 3" select backfill, no comp (cy) 0.009 18.21 98.5% 100.0% 0.17 Means 2006 includes O&P (material costs + 10%)<br />
02315.310.7000 Compaction, 18" vibrate plate (cy) 0.019 1.86 98.5% 100.0% 0.04 Means 2006 includes O&P<br />
02775.275.0310 Sidewalk, conc. 4" (sf) 1 3.58 98.5% 100.0% 3.53 Means 2006 includes O&P<br />
Total 6.48<br />
* Total index except some items use intallation index.<br />
* Reference: RSMeans Heavy Construction Cost Data, 20th Annual Edition, 2006.<br />
Transmission Main cost estimator_PVC_2007_FINAL.xls, unit_costs Page 1 of 1 3/30/2007 2:52 PM
Equipment Costs (with O&P)<br />
Item Description Qty Power<br />
(Hp)<br />
Productio<br />
n (cy/hr)<br />
Costs<br />
($/day)<br />
St. Paul<br />
Index *<br />
Present<br />
Cost<br />
Index<br />
Total Cost<br />
($/day)<br />
Source Notes<br />
Pipe Trench - Excavate, lay, backfill, compact (75 CY/HR Production)<br />
01.54.33.20.0150 1 CY Excavator 1 80 75 $ 570.00 101.8% 100.0% $ 581 Means 2006 rentals are based on weekly rate<br />
01.54.33.20.1250 Vibratory Hand Compactor 2 10 $ 38.50 101.8% 100.0% $ 79 Means 2006 rentals are based on weekly rate<br />
01.54.33.40.7050 Trench Box (8x16) 1 $ 156.00 101.8% 100.0% $ 159 Means 2006 rentals are based on weekly rate<br />
Total $ 819<br />
Pipe Trench - Excavate, lay, backfill, compact (100 CY/HR Production)<br />
01.54.33.20.0200 1.5 CY Excavator 1 120 100 $ 755.00 101.8% 100.0% $ 769 Means 2006 rentals are based on weekly rate<br />
01.54.33.20.1250 Vibratory Hand Compactor 2 10 $ 38.50 101.8% 100.0% $ 79 Means 2006 rentals are based on weekly rate<br />
01.54.33.40.7050 Trench Box (8x16) 1 $ 156.00 101.8% 100.0% $ 159 Means 2006 rentals are based on weekly rate<br />
Total $ 1,007<br />
Pipe Trench - Excavate, lay, backfill, compact (130 CY/HR Production)<br />
01.54.33.20.0300 2 CY Excavator 1 160 130 $ 950.00 101.8% 100.0% $ 968 Means 2006 rentals are based on weekly rate<br />
01.54.33.20.1250 Vibratory Hand Compactor 2 10 $ 38.50 101.8% 100.0% $ 79 Means 2006 rentals are based on weekly rate<br />
01.54.33.40.7050 Trench Box (8x16) 1 $ 156.00 101.8% 100.0% $ 159 Means 2006 rentals are based on weekly rate<br />
Total<br />
* Total Index<br />
$ 1,206<br />
Transmission Main cost estimator_PVC_2007_FINAL.xls, equip_costs Page 1 of 1 3/30/2007 2:52 PM
Crew Costs (with O&P)<br />
St. Paul<br />
Present<br />
Cost Total Cost<br />
Description Qty Cost/hr Index * Index ($/hr) Source Notes<br />
Pipe Trench - Excavate, lay, backfill, compact<br />
crane operator 1 $ 51.00 103.4% 100% $ 52.74 Means 2006<br />
equipment oiler 1 $ 49.35 103.4% 100% $ 51.03 Means 2006<br />
common building laborer 2 $ 42.65 103.4% 100% $ 88.21 Means 2006<br />
<strong>for</strong>eman 1 $ 54.30 103.4% 100% $ 56.15 Means 2006<br />
Total<br />
Traffic Control<br />
$ 248.13<br />
common building laborer 1 $ 42.65 103.4% 100% $ 44.11 Means 2006<br />
Total<br />
* Installation Index<br />
$ 44.11<br />
Transmission Main cost estimator_PVC_2007_FINAL.xls, crew_costs Page 1 of 1 3/30/2007 2:52 PM
<strong>Water</strong> Reuse Pipe Line Construction Cost<br />
Pipe Material: Ductile Iron<br />
Start Sta. End Sta. length diameter (in)<br />
start depth (ft)<br />
end depth (ft)<br />
X Hor.: 1 Vert.<br />
depth of vertical cut at<br />
bottom<br />
average depth (ft)<br />
design parameter key<br />
upstream MH diameter<br />
trench bottom width<br />
(ft)<br />
trench top width (ft)<br />
pavement width cut (ft)<br />
Curb replacement (ea)<br />
Walk replacement (ftwidth)<br />
sod replacement width<br />
(ft)<br />
seeding width (ft)<br />
traffic control<br />
personnel<br />
Urban Applications<br />
0 550 550 30 8 8 1 10 8.865 11 5 8 8.0 0 0 0 10 0 1 0 0 $192.48<br />
550 600 50 30 8 8 1 10 8.865 11 5 8 8.0 6 1 0 0 0 1 0 0 $229.79<br />
Weighted Average $195.59<br />
600 1150 550 36 8 8 1 10 9.010 12 6 8 8.0 0 0 0 10 0 1 0 0 $237.65<br />
1150 1200 50 36 8 8 1 10 9.010 12 6 8 8.0 6 1 0 0 0 1 0 0 $274.96<br />
Weighted Average $240.76<br />
1200 1750 550 42 8 8 1 10 9.156 13 6 8 8.0 0 0 0 10 0 1 0 0 $291.58<br />
1750 1800 50 42 8 8 1 10 9.156 13 6 8 8.0 6 1 0 0 0 1 0 0 $328.89<br />
Weighted Average $294.69<br />
1800 2350 550 48 8 8 1 10 9.302 14 7 10 10.0 0 0 0 10 0 1 0 0 $369.80<br />
2350 2400 50 48 8 8 1 10 9.302 14 7 10 10.0 6 1 0 0 0 1 0 0 $407.12<br />
Weighted Average $372.91<br />
2400 2950 550 54 8 8 1 10 9.448 15 7 10 10.0 0 0 0 10 0 1 0 0 $430.46<br />
2950 3000 50 54 8 8 1 10 9.448 15 7 10 10.0 6 1 0 0 0 1 0 0 $467.77<br />
Weighted Average $433.57<br />
3000 3550 550 60 8 8 1 10 9.594 16 8 12 12.0 0 0 0 10 0 1 0 0 $491.26<br />
3550 3600 50 60 8 8 1 10 9.594 16 8 12 12.0 6 1 0 0 0 1 0 0 $528.57<br />
Weighted Average $494.37<br />
Rural Applications:<br />
0 600 600 30 8 8 1 10 8.865 11 5 8 8.0 0 0 0 0 10 0 0 0 $179.54<br />
0 600 600 36 8 8 1 10 9.010 12 6 8 8.0 0 0 0 0 10 0 0 0 $223.57<br />
0 600 600 42 8 8 1 10 9.156 13 6 8 8.0 0 0 0 0 10 0 0 0 $277.03<br />
0 600 600 48 8 8 1 10 9.302 14 7 10 10.0 0 0 0 0 10 0 0 0 $352.53<br />
0 600 600 54 8 8 1 10 9.448 15 7 10 10.0 0 0 0 0 10 0 0 0 $412.45<br />
0 600 600 60 8 8 1 10 9.594 16 8 12 12.0 0 0 0 0 10 0 0 0 $469.69<br />
costs do not include: support and/or relocation of utilities<br />
permanent easement<br />
temporary easement<br />
engr and admin costs<br />
surveying<br />
geotechnical investigation<br />
rock excavation<br />
contractors mobilization, bonds, overhead and profit<br />
tree removal and replacement<br />
Transmission Main cost estimator_DIP 2007_FINAL.xls, project_costs Page 1 of 1 3/30/2007 2:53 PM<br />
trench support (1=yes)<br />
dewatering wells<br />
(1=yes)<br />
unit cost of pipeline<br />
$/ft
Pipe Installation Data (DIP Pipe)<br />
Pipe ID<br />
(in)<br />
1 2 3 4 5 6 7 8 9 10 11 12 13 14<br />
Key Wall (in) -<br />
1<br />
Pipe OD<br />
(ft)<br />
Pipe Area<br />
(sf)<br />
Bed under<br />
pipe (ft)<br />
Bottom<br />
Trench<br />
Width (ft)<br />
Bedding<br />
Depth (ft)<br />
Bedding<br />
Area (sf)<br />
Excavation<br />
Rate (cy/hr)<br />
- 2<br />
B&C of<br />
select<br />
(cy/hr) - 3<br />
B&C of<br />
native<br />
(cy/hr) - 4<br />
Pipe<br />
Install<br />
Rate<br />
(ft/hr) - 5<br />
Pipe Costs<br />
($) - ref 10<br />
30 11 5.75 3.46 9.39 0.86 8 5.3 33.2 100 11 75 11.0 82.65<br />
36 12 6.25 4.04 12.83 1.01 8 6.1 35.6 130 11 75 9.0 112.50<br />
42 13 6.75 4.63 16.80 1.16 8 6.8 37.4 130 11 75 8.5 161.60<br />
48 14 7.25 5.21 21.31 1.30 10 7.5 53.8 130 11 75 8.0 209.77<br />
54 15 7.75 5.79 26.34 1.45 10 8.2 56.1 130 11 75 7.3 262.81<br />
60 16 8.25 6.38 31.92 1.59 12 9.0 75.7 130 11 75 6.5 285.00<br />
Notes:<br />
1 - DIP Pipe<br />
2 - Means 02315.424.0200<br />
3 - Means 02315.110.1100 - Crew A1<br />
4 - Approximated - Crew B10G<br />
5 - Means 02500.730.2200 - Crew B21, B13, B13B<br />
6 - Quotation from Manufacturer (Unit cost in this column includes mechanical joints and pipe cost; Pipe manufacturer: American Ductile Iron Pipe)<br />
Transmission Main cost estimator_DIP 2007_FINAL.xls, pipe_param Page 1 of 1 3/30/2007 2:53 PM
Construction Unit Costs<br />
Item (2006 Means) Description Qty Power Production Costs St. Paul Present Cost Total Cost Source<br />
(Hp) (unit/hr) ($/unit) Index * Index ($/unit)<br />
Notes<br />
Select backfill (cy)<br />
02315.110.0300 select backfill, no comp 1 18.21 98.5% 100.0% 17.94 Means 2006 includes O&P (material costs + 10%)<br />
Total 17.94<br />
Pavement Removal and Replacement (sy)<br />
02220.250.5050 4 - 6" bit pavement removal (sy) 1 420 6.75 98.5% 100.0% 6.65 Means 2006 includes O&P<br />
02315.490.0550 Disposal - 10 mi rt haul - (cy) 0.167 15.00 98.5% 100.0% 2.47 Means 2003 includes O&P<br />
02220.330.0100 Disposal - tipping fee (ton) 0.217 70.00 98.5% 100.0% 14.94 Means 2006 includes O&P<br />
02315.110.0300 6" select backfill, no comp (cy) 0.167 18.21 98.5% 100.0% 2.99 Means 2006 includes O&P (material costs + 10%)<br />
02300.432.2220 Dozer - 150 haul (cy) 0.167 4.82 98.5% 100.0% 0.80 Means 2006 includes O&P<br />
02315.310.5000 Compaction - vibrating roller 2 pass (cy) 0.167 0.35 98.5% 100.0% 0.06 Means 2006 includes O&P<br />
02740.310.0120 Binder course - 2" thick 1 6345 5.25 98.5% 100.0% 5.18 Means 2006 includes O&P<br />
02740.310.0380 Wearing course - 2" thick 1 6325 5.70 98.5% 100.0% 5.62 Means 2006 includes O&P<br />
Sod (sy)<br />
Total 38.71 City Minneapolis allowance is 50$/sy<br />
02910.710.2620 Rough grade prep (msf) 0.009 11.7 98.5% 100.0% 0.11 Means 2006 includes O&P<br />
02910.710.3920 Spread topsoil, 4" (msf) 0.009 470 98.5% 100.0% 4.17 Means 2006 includes O&P, includes material<br />
02920.400.0200 Sod, bluegrass, per MSF 0.009 22 390 98.5% 100.0% 3.46 Means 2006 includes O&P<br />
Seed (sy)<br />
Total 7.74<br />
02910.710.2620 Rough grade prep (msf) 0.009 11.7 98.5% 100.0% 0.11 Means 2006 includes O&P<br />
02910.710.3920 Spread topsoil, 4" (msf) 0.009 470 98.5% 100.0% 4.17 Means 2006 includes O&P, includes material<br />
02920.320.320 Hydroseed w/ mulch&fert. - (msf) 0.009 80 46.5 98.5% 100.0% 0.42 Means 2006 includes O&P<br />
Trench Support (sf)<br />
Total 4.70<br />
02250.400.1800 25' deep exc, drive, extract, salvage 1 553 20 103.4% 100.0% 20.68 Means 2006 includes O&P<br />
Dewatering (lf)<br />
Total 20.68<br />
Months 1<br />
Depth (ft) 25<br />
Spacing (ft) 200<br />
02240.700.0050 Wells 10-20' deep, ave 0.125 19.4 103.4% 100.0% 2.51 Means 2006 indludes O&P; lineal measure is well spacing/depth<br />
01.54.33.40.4700 Subm pump, 2", 120 gpm -rent 0.005 192 101.8% 100.0% 0.98 Means 2006 includes O&P; qty is months rental<br />
01.54.33.40.2700 Gen, elect, 100 kw -rent 0.005 7.2 98.5% 100.0% 0.04 Means 2006 includes O&P; qty is months-kw; cost is monthy rental per kw<br />
01.54.33.40.2700 Gen, elect, 100 kw -operate 27.23 0.18 98.5% 100.0% 4.83 Means 2006 includes O&P; 10hp = 7.46 kw/hr, 5446 kw/mo; cost is per kw<br />
Total 8.36<br />
Maintenance Structure (each)<br />
Base unit (10-ft) 1 0.00 Estimate <strong>for</strong> planning = $2000, See detailed estimate <strong>for</strong> structures<br />
Extension (ft)<br />
Concrete Curb Removal and Replacement (lf)<br />
1 0.00 Estimate from special pipe costs is $150/ft, See detailed estimate <strong>for</strong> structures<br />
02220.250.6100 Removal, Curbs, rein<strong>for</strong>ced (lf) 1 420 4.94 98.5% 100.0% 4.87 Means 2006 includes O&P<br />
02315.490.0550 10 mi rt haul (16.5 cy) - per yard 0.058 15.00 103.4% 100.0% 0.91 Means 2003 includes O&P<br />
02220.330.0100 Disposal - tipping fee (ton) 0.084 70.00 98.5% 100.0% 5.82 Means 2006 includes O&P<br />
02315.110.0300 6" select backfill, no comp (cy) 0.019 18.21 98.5% 100.0% 0.34 Means 2006 includes O&P (material costs + 10%)<br />
02315.310.7000 Compaction, 18" vibrate plate (cy) 0.019 1.86 98.5% 100.0% 0.04 Means 2006 includes O&P<br />
02770.300.0300 Curb, machine <strong>for</strong>m straight (lf) 1 6345 8.25 98.5% 100.0% 8.13 Means 2006 includes O&P<br />
Total 20.11<br />
Concrete Walk Removal and Replacement (ft-width)<br />
02220.240.4100 Sidewalk removal, concrete, 4" reinf. (sy) 0.111 8.45 98.5% 100.0% 0.93 Means 2006<br />
02315.490.0550 10 mi rt haul (16.5 cy) - per yard 0.016 15.00 103.4% 100.0% 0.25 Means 2003 includes O&P<br />
02220.330.0100 Disposal - tipping fee (ton) 0.023 70.00 98.5% 100.0% 1.56 Means 2006 includes O&P<br />
02315.110.0300 3" select backfill, no comp (cy) 0.009 18.21 98.5% 100.0% 0.17 Means 2006 includes O&P (material costs + 10%)<br />
02315.310.7000 Compaction, 18" vibrate plate (cy) 0.019 1.86 98.5% 100.0% 0.04 Means 2006 includes O&P<br />
02775.275.0310 Sidewalk, conc. 4" (sf) 1 3.58 98.5% 100.0% 3.53 Means 2006 includes O&P<br />
Total 6.48<br />
* Total index except some items use intallation index.<br />
* Reference: RSMeans Heavy Construction Cost Data, 20th Annual Edition, 2006.<br />
Transmission Main cost estimator_DIP 2007_FINAL.xls, unit_costs Page 1 of 1 3/30/2007 2:53 PM
Equipment Costs (with O&P)<br />
Item Description Qty Power<br />
(Hp)<br />
Productio<br />
n (cy/hr)<br />
Costs<br />
($/day)<br />
St. Paul<br />
Index *<br />
Present<br />
Cost<br />
Index<br />
Total Cost<br />
($/day)<br />
Source Notes<br />
Pipe Trench - Excavate, lay, backfill, compact (75 CY/HR Production)<br />
01.54.33.20.0150 1 CY Excavator 1 80 75 $ 570.00 101.8% 100.0% $ 581 Means 2006 rentals are based on weekly rate<br />
01.54.33.20.1250 Vibratory Hand Compactor 2 10 $ 38.50 101.8% 100.0% $ 79 Means 2006 rentals are based on weekly rate<br />
01.54.33.40.7050 Trench Box (8x16) 1 $ 156.00 101.8% 100.0% $ 159 Means 2006 rentals are based on weekly rate<br />
Total $ 819<br />
Pipe Trench - Excavate, lay, backfill, compact (100 CY/HR Production)<br />
01.54.33.20.0200 1.5 CY Excavator 1 120 100 $ 755.00 101.8% 100.0% $ 769 Means 2006 rentals are based on weekly rate<br />
01.54.33.20.1250 Vibratory Hand Compactor 2 10 $ 38.50 101.8% 100.0% $ 79 Means 2006 rentals are based on weekly rate<br />
01.54.33.40.7050 Trench Box (8x16) 1 $ 156.00 101.8% 100.0% $ 159 Means 2006 rentals are based on weekly rate<br />
Total $ 1,007<br />
Pipe Trench - Excavate, lay, backfill, compact (130 CY/HR Production)<br />
01.54.33.20.0300 2 CY Excavator 1 160 130 $ 950.00 101.8% 100.0% $ 968 Means 2006 rentals are based on weekly rate<br />
01.54.33.20.1250 Vibratory Hand Compactor 2 10 $ 38.50 101.8% 100.0% $ 79 Means 2006 rentals are based on weekly rate<br />
01.54.33.40.7050 Trench Box (8x16) 1 $ 156.00 101.8% 100.0% $ 159 Means 2006 rentals are based on weekly rate<br />
Total<br />
* Total Index<br />
$ 1,206<br />
Transmission Main cost estimator_DIP 2007_FINAL.xls, equip_costs Page 1 of 1 3/30/2007 2:54 PM
Crew Costs (with O&P)<br />
St. Paul<br />
Present<br />
Cost Total Cost<br />
Description Qty Cost/hr Index * Index ($/hr) Source Notes<br />
Pipe Trench - Excavate, lay, backfill, compact<br />
crane operator 1 $ 51.00 103.4% 100% $ 52.74 Means 2006<br />
equipment oiler 1 $ 49.35 103.4% 100% $ 51.03 Means 2006<br />
common building laborer 2 $ 42.65 103.4% 100% $ 88.21 Means 2006<br />
<strong>for</strong>eman 1 $ 54.30 103.4% 100% $ 56.15 Means 2006<br />
Total<br />
Traffic Control<br />
$ 248.13<br />
common building laborer 1 $ 42.65 103.4% 100% $ 44.11 Means 2006<br />
Total<br />
* Installation Index<br />
$ 44.11<br />
Transmission Main cost estimator_DIP 2007_FINAL.xls, crew_costs Page 1 of 1 3/30/2007 2:54 PM
Exhibit 2<br />
<strong>Water</strong> Reuse System Capital Cost
Capital PROJECT Cost Curves <strong>for</strong> Reclaimed Transmission Piping<br />
Urban Capital Cost by Distance - $ <strong>for</strong> 1-10 miles<br />
Annual<br />
Pipe Velocity<br />
Average Annual<br />
at Peak Pipe Unit<br />
Day Flow Average Day Peak Hourly Hourly Flow Project<br />
Diam (in) (mgd) Flow (gpm) Flow (mgd) (fps) Cost ($/ft) 1 1.5 2 2.5 3 3.5 4 4.5 5 10<br />
4 0.10 69.40 0.30 5.32 97 512,160 768,240 1,024,320 1,280,400 1,536,480 1,792,560 2,048,640 2,304,720 2,560,800 5,121,600<br />
6 0.20 138.80 0.60 4.73 106 559,680 839,520 1,119,360 1,399,200 1,679,040 1,958,880 2,238,720 2,518,560 2,798,400 5,596,800<br />
6 0.27 187.38 0.81 6.38 106 559,680 839,520 1,119,360 1,399,200 1,679,040 1,958,880 2,238,720 2,518,560 2,798,400 5,596,800<br />
8 0.40 277.60 1.20 5.32 115 607,200 910,800 1,214,400 1,518,000 1,821,600 2,125,200 2,428,800 2,732,400 3,036,000 6,072,000<br />
8 0.47 326.18 1.41 6.25 115 607,200 910,800 1,214,400 1,518,000 1,821,600 2,125,200 2,428,800 2,732,400 3,036,000 6,072,000<br />
8 0.53 367.82 1.59 7.05 115 607,200 910,800 1,214,400 1,518,000 1,821,600 2,125,200 2,428,800 2,732,400 3,036,000 6,072,000<br />
10 0.60 416.40 1.80 5.11 128 675,840 1,013,760 1,351,680 1,689,600 2,027,520 2,365,440 2,703,360 3,041,280 3,379,200 6,758,400<br />
10 0.67 464.98 2.01 5.70 128 675,840 1,013,760 1,351,680 1,689,600 2,027,520 2,365,440 2,703,360 3,041,280 3,379,200 6,758,400<br />
10 0.83 576.02 2.49 7.06 128 675,840 1,013,760 1,351,680 1,689,600 2,027,520 2,365,440 2,703,360 3,041,280 3,379,200 6,758,400<br />
12 0.93 645.42 2.79 5.50 140 739,200 1,108,800 1,478,400 1,848,000 2,217,600 2,587,200 2,956,800 3,326,400 3,696,000 7,392,000<br />
12 1.00 694.00 3.00 5.91 140 739,200 1,108,800 1,478,400 1,848,000 2,217,600 2,587,200 2,956,800 3,326,400 3,696,000 7,392,000<br />
12 1.17 811.98 3.51 6.91 140 739,200 1,108,800 1,478,400 1,848,000 2,217,600 2,587,200 2,956,800 3,326,400 3,696,000 7,392,000<br />
14 1.33 923.02 3.99 5.77 157 828,960 1,243,440 1,657,920 2,072,400 2,486,880 2,901,360 3,315,840 3,730,320 4,144,800 8,289,600<br />
14 1.50 1041.00 4.50 6.51 157 828,960 1,243,440 1,657,920 2,072,400 2,486,880 2,901,360 3,315,840 3,730,320 4,144,800 8,289,600<br />
14 1.67 1158.98 5.01 7.25 157 828,960 1,243,440 1,657,920 2,072,400 2,486,880 2,901,360 3,315,840 3,730,320 4,144,800 8,289,600<br />
16 1.83 1270.02 5.49 6.08 189 997,920 1,496,880 1,995,840 2,494,800 2,993,760 3,492,720 3,991,680 4,490,640 4,989,600 9,979,200<br />
16 2.00 1388.00 6.00 6.65 189 997,920 1,496,880 1,995,840 2,494,800 2,993,760 3,492,720 3,991,680 4,490,640 4,989,600 9,979,200<br />
16 2.07 1436.58 6.21 6.88 189 997,920 1,496,880 1,995,840 2,494,800 2,993,760 3,492,720 3,991,680 4,490,640 4,989,600 9,979,200<br />
18 2.17 1505.98 6.51 5.70 211 1,114,080 1,671,120 2,228,160 2,785,200 3,342,240 3,899,280 4,456,320 5,013,360 5,570,400 11,140,800<br />
18 2.33 1617.02 6.99 6.12 211 1,114,080 1,671,120 2,228,160 2,785,200 3,342,240 3,899,280 4,456,320 5,013,360 5,570,400 11,140,800<br />
18 2.50 1735.00 7.50 6.57 211 1,114,080 1,671,120 2,228,160 2,785,200 3,342,240 3,899,280 4,456,320 5,013,360 5,570,400 11,140,800<br />
18 2.67 1852.98 8.01 7.01 211 1,114,080 1,671,120 2,228,160 2,785,200 3,342,240 3,899,280 4,456,320 5,013,360 5,570,400 11,140,800<br />
20 2.83 1964.02 8.49 6.02 236 1,246,080 1,869,120 2,492,160 3,115,200 3,738,240 4,361,280 4,984,320 5,607,360 6,230,400 12,460,800<br />
20 3.00 2082.00 9.00 6.38 236 1,246,080 1,869,120 2,492,160 3,115,200 3,738,240 4,361,280 4,984,320 5,607,360 6,230,400 12,460,800<br />
20 3.17 2199.98 9.51 6.74 236 1,246,080 1,869,120 2,492,160 3,115,200 3,738,240 4,361,280 4,984,320 5,607,360 6,230,400 12,460,800<br />
20 3.33 2311.02 9.99 7.08 236 1,246,080 1,869,120 2,492,160 3,115,200 3,738,240 4,361,280 4,984,320 5,607,360 6,230,400 12,460,800<br />
24 3.50 2429.00 10.50 5.17 284 1,499,520 2,249,280 2,999,040 3,748,800 4,498,560 5,248,320 5,998,080 6,747,840 7,497,600 14,995,200<br />
24 3.67 2546.98 11.01 5.42 284 1,499,520 2,249,280 2,999,040 3,748,800 4,498,560 5,248,320 5,998,080 6,747,840 7,497,600 14,995,200<br />
24 3.83 2658.02 11.49 5.66 284 1,499,520 2,249,280 2,999,040 3,748,800 4,498,560 5,248,320 5,998,080 6,747,840 7,497,600 14,995,200<br />
24 4.00 2776.00 12.00 5.91 284 1,499,520 2,249,280 2,999,040 3,748,800 4,498,560 5,248,320 5,998,080 6,747,840 7,497,600 14,995,200<br />
24 4.17 2893.98 12.51 6.16 284 1,499,520 2,249,280 2,999,040 3,748,800 4,498,560 5,248,320 5,998,080 6,747,840 7,497,600 14,995,200<br />
24 4.33 3005.02 12.99 6.40 284 1,499,520 2,249,280 2,999,040 3,748,800 4,498,560 5,248,320 5,998,080 6,747,840 7,497,600 14,995,200<br />
24 4.50 3123.00 13.50 6.65 284 1,499,520 2,249,280 2,999,040 3,748,800 4,498,560 5,248,320 5,998,080 6,747,840 7,497,600 14,995,200<br />
24 4.67 3240.98 14.01 6.90 284 1,499,520 2,249,280 2,999,040 3,748,800 4,498,560 5,248,320 5,998,080 6,747,840 7,497,600 14,995,200<br />
30 5.33 3699.02 15.99 5.04 353 1,863,840 2,795,760 3,727,680 4,659,600 5,591,520 6,523,440 7,455,360 8,387,280 9,319,200 18,638,400<br />
30 5.67 3934.98 17.01 5.36 353 1,863,840 2,795,760 3,727,680 4,659,600 5,591,520 6,523,440 7,455,360 8,387,280 9,319,200 18,638,400<br />
30 6.00 4164.00 18.00 5.67 353 1,863,840 2,795,760 3,727,680 4,659,600 5,591,520 6,523,440 7,455,360 8,387,280 9,319,200 18,638,400<br />
30 6.33 4393.02 18.99 5.99 353 1,863,840 2,795,760 3,727,680 4,659,600 5,591,520 6,523,440 7,455,360 8,387,280 9,319,200 18,638,400<br />
30 6.67 4628.98 20.01 6.31 353 1,863,840 2,795,760 3,727,680 4,659,600 5,591,520 6,523,440 7,455,360 8,387,280 9,319,200 18,638,400<br />
30 7.00 4858.00 21.00 6.62 353 1,863,840 2,795,760 3,727,680 4,659,600 5,591,520 6,523,440 7,455,360 8,387,280 9,319,200 18,638,400<br />
30 7.33 5087.02 21.99 6.93 353 1,863,840 2,795,760 3,727,680 4,659,600 5,591,520 6,523,440 7,455,360 8,387,280 9,319,200 18,638,400<br />
36 8.00 5552.00 24.00 5.25 434 2,291,520 3,437,280 4,583,040 5,728,800 6,874,560 8,020,320 9,166,080 10,311,840 11,457,600 22,915,200<br />
36 8.33 5781.02 24.99 5.47 434 2,291,520 3,437,280 4,583,040 5,728,800 6,874,560 8,020,320 9,166,080 10,311,840 11,457,600 22,915,200<br />
36 8.67 6016.98 26.01 5.69 434 2,291,520 3,437,280 4,583,040 5,728,800 6,874,560 8,020,320 9,166,080 10,311,840 11,457,600 22,915,200<br />
36 9.00 6246.00 27.00 5.91 434 2,291,520 3,437,280 4,583,040 5,728,800 6,874,560 8,020,320 9,166,080 10,311,840 11,457,600 22,915,200<br />
36 9.33 6475.02 27.99 6.13 434 2,291,520 3,437,280 4,583,040 5,728,800 6,874,560 8,020,320 9,166,080 10,311,840 11,457,600 22,915,200<br />
36 9.67 6710.98 29.01 6.35 434 2,291,520 3,437,280 4,583,040 5,728,800 6,874,560 8,020,320 9,166,080 10,311,840 11,457,600 22,915,200<br />
36 10.00 6940.00 30.00 6.57 434 2,291,520 3,437,280 4,583,040 5,728,800 6,874,560 8,020,320 9,166,080 10,311,840 11,457,600 22,915,200<br />
36 10.33 7169.02 30.99 6.78 434 2,291,520 3,437,280 4,583,040 5,728,800 6,874,560 8,020,320 9,166,080 10,311,840 11,457,600 22,915,200<br />
36 10.50 7287.00 31.50 6.89 434 2,291,520 3,437,280 4,583,040 5,728,800 6,874,560 8,020,320 9,166,080 10,311,840 11,457,600 22,915,200<br />
36 10.67 7404.98 32.01 7.01 434 2,291,520 3,437,280 4,583,040 5,728,800 6,874,560 8,020,320 9,166,080 10,311,840 11,457,600 22,915,200<br />
42 11.33 7863.02 33.99 5.47 531 2,803,680 4,205,520 5,607,360 7,009,200 8,411,040 9,812,880 11,214,720 12,616,560 14,018,400 28,036,800<br />
Pipe Capital Costs_Single_PF of 3_FINAL.xls, Capital Costs Page 1 of 6 3/30/2007 2:55 PM
Capital PROJECT Cost Curves <strong>for</strong> Reclaimed Transmission Piping<br />
Urban Capital Cost by Distance - $ <strong>for</strong> 1-10 miles<br />
Annual<br />
Pipe Velocity<br />
Average Annual<br />
at Peak Pipe Unit<br />
Day Flow Average Day Peak Hourly Hourly Flow Project<br />
Diam (in) (mgd) Flow (gpm) Flow (mgd) (fps) Cost ($/ft) 1 1.5 2 2.5 3 3.5 4 4.5 5 10<br />
42 11.67 8098.98 35.01 5.63 531 2,803,680 4,205,520 5,607,360 7,009,200 8,411,040 9,812,880 11,214,720 12,616,560 14,018,400 28,036,800<br />
42 12.00 8328.00 36.00 5.79 531 2,803,680 4,205,520 5,607,360 7,009,200 8,411,040 9,812,880 11,214,720 12,616,560 14,018,400 28,036,800<br />
42 12.33 8557.02 36.99 5.95 531 2,803,680 4,205,520 5,607,360 7,009,200 8,411,040 9,812,880 11,214,720 12,616,560 14,018,400 28,036,800<br />
42 12.67 8792.98 38.01 6.11 531 2,803,680 4,205,520 5,607,360 7,009,200 8,411,040 9,812,880 11,214,720 12,616,560 14,018,400 28,036,800<br />
42 13.00 9022.00 39.00 6.27 531 2,803,680 4,205,520 5,607,360 7,009,200 8,411,040 9,812,880 11,214,720 12,616,560 14,018,400 28,036,800<br />
42 13.33 9251.02 39.99 6.43 531 2,803,680 4,205,520 5,607,360 7,009,200 8,411,040 9,812,880 11,214,720 12,616,560 14,018,400 28,036,800<br />
42 13.67 9486.98 41.01 6.59 531 2,803,680 4,205,520 5,607,360 7,009,200 8,411,040 9,812,880 11,214,720 12,616,560 14,018,400 28,036,800<br />
42 14.00 9716.00 42.00 6.75 531 2,803,680 4,205,520 5,607,360 7,009,200 8,411,040 9,812,880 11,214,720 12,616,560 14,018,400 28,036,800<br />
42 14.67 10180.98 44.01 7.08 531 2,803,680 4,205,520 5,607,360 7,009,200 8,411,040 9,812,880 11,214,720 12,616,560 14,018,400 28,036,800<br />
48 13.67 9486.98 41.01 5.05 671 3,542,880 5,314,320 7,085,760 8,857,200 10,628,640 12,400,080 14,171,520 15,942,960 17,714,400 35,428,800<br />
48 14.00 9716.00 42.00 5.17 671 3,542,880 5,314,320 7,085,760 8,857,200 10,628,640 12,400,080 14,171,520 15,942,960 17,714,400 35,428,800<br />
48 14.33 9945.02 42.99 5.29 671 3,542,880 5,314,320 7,085,760 8,857,200 10,628,640 12,400,080 14,171,520 15,942,960 17,714,400 35,428,800<br />
48 14.67 10180.98 44.01 5.42 671 3,542,880 5,314,320 7,085,760 8,857,200 10,628,640 12,400,080 14,171,520 15,942,960 17,714,400 35,428,800<br />
48 15.00 10410.00 45.00 5.54 671 3,542,880 5,314,320 7,085,760 8,857,200 10,628,640 12,400,080 14,171,520 15,942,960 17,714,400 35,428,800<br />
48 15.33 10639.02 45.99 5.66 671 3,542,880 5,314,320 7,085,760 8,857,200 10,628,640 12,400,080 14,171,520 15,942,960 17,714,400 35,428,800<br />
48 15.67 10874.98 47.01 5.79 671 3,542,880 5,314,320 7,085,760 8,857,200 10,628,640 12,400,080 14,171,520 15,942,960 17,714,400 35,428,800<br />
48 16.00 11104.00 48.00 5.91 671 3,542,880 5,314,320 7,085,760 8,857,200 10,628,640 12,400,080 14,171,520 15,942,960 17,714,400 35,428,800<br />
48 16.33 11333.02 48.99 6.03 671 3,542,880 5,314,320 7,085,760 8,857,200 10,628,640 12,400,080 14,171,520 15,942,960 17,714,400 35,428,800<br />
48 16.67 11568.98 50.01 6.16 671 3,542,880 5,314,320 7,085,760 8,857,200 10,628,640 12,400,080 14,171,520 15,942,960 17,714,400 35,428,800<br />
48 17.33 12027.02 51.99 6.40 671 3,542,880 5,314,320 7,085,760 8,857,200 10,628,640 12,400,080 14,171,520 15,942,960 17,714,400 35,428,800<br />
48 18.00 12492.00 54.00 6.65 671 3,542,880 5,314,320 7,085,760 8,857,200 10,628,640 12,400,080 14,171,520 15,942,960 17,714,400 35,428,800<br />
48 18.33 12721.02 54.99 6.77 671 3,542,880 5,314,320 7,085,760 8,857,200 10,628,640 12,400,080 14,171,520 15,942,960 17,714,400 35,428,800<br />
48 19.00 13186.00 57.00 7.02 671 3,542,880 5,314,320 7,085,760 8,857,200 10,628,640 12,400,080 14,171,520 15,942,960 17,714,400 35,428,800<br />
54 17.33 12027.02 51.99 5.06 781 4,123,680 6,185,520 8,247,360 10,309,200 12,371,040 14,432,880 16,494,720 18,556,560 20,618,400 41,236,800<br />
54 18.00 12492.00 54.00 5.25 781 4,123,680 6,185,520 8,247,360 10,309,200 12,371,040 14,432,880 16,494,720 18,556,560 20,618,400 41,236,800<br />
54 18.67 12956.98 56.01 5.45 781 4,123,680 6,185,520 8,247,360 10,309,200 12,371,040 14,432,880 16,494,720 18,556,560 20,618,400 41,236,800<br />
54 19.33 13415.02 57.99 5.64 781 4,123,680 6,185,520 8,247,360 10,309,200 12,371,040 14,432,880 16,494,720 18,556,560 20,618,400 41,236,800<br />
54 20.00 13880.00 60.00 5.84 781 4,123,680 6,185,520 8,247,360 10,309,200 12,371,040 14,432,880 16,494,720 18,556,560 20,618,400 41,236,800<br />
54 20.67 14344.98 62.01 6.03 781 4,123,680 6,185,520 8,247,360 10,309,200 12,371,040 14,432,880 16,494,720 18,556,560 20,618,400 41,236,800<br />
54 21.33 14803.02 63.99 6.22 781 4,123,680 6,185,520 8,247,360 10,309,200 12,371,040 14,432,880 16,494,720 18,556,560 20,618,400 41,236,800<br />
54 22.00 15268.00 66.00 6.42 781 4,123,680 6,185,520 8,247,360 10,309,200 12,371,040 14,432,880 16,494,720 18,556,560 20,618,400 41,236,800<br />
54 22.67 15732.98 68.01 6.62 781 4,123,680 6,185,520 8,247,360 10,309,200 12,371,040 14,432,880 16,494,720 18,556,560 20,618,400 41,236,800<br />
54 23.33 16191.02 69.99 6.81 781 4,123,680 6,185,520 8,247,360 10,309,200 12,371,040 14,432,880 16,494,720 18,556,560 20,618,400 41,236,800<br />
54 24.00 16656.00 72.00 7.00 781 4,123,680 6,185,520 8,247,360 10,309,200 12,371,040 14,432,880 16,494,720 18,556,560 20,618,400 41,236,800<br />
60 21.17 14691.98 63.51 5.00 891 4,704,480 7,056,720 9,408,960 11,761,200 14,113,440 16,465,680 18,817,920 21,170,160 23,522,400 47,044,800<br />
60 21.67 15038.98 65.01 5.12 891 4,704,480 7,056,720 9,408,960 11,761,200 14,113,440 16,465,680 18,817,920 21,170,160 23,522,400 47,044,800<br />
60 22.33 15497.02 66.99 5.28 891 4,704,480 7,056,720 9,408,960 11,761,200 14,113,440 16,465,680 18,817,920 21,170,160 23,522,400 47,044,800<br />
60 23.00 15962.00 69.00 5.44 891 4,704,480 7,056,720 9,408,960 11,761,200 14,113,440 16,465,680 18,817,920 21,170,160 23,522,400 47,044,800<br />
60 23.67 16426.98 71.01 5.60 891 4,704,480 7,056,720 9,408,960 11,761,200 14,113,440 16,465,680 18,817,920 21,170,160 23,522,400 47,044,800<br />
60 24.33 16885.02 72.99 5.75 891 4,704,480 7,056,720 9,408,960 11,761,200 14,113,440 16,465,680 18,817,920 21,170,160 23,522,400 47,044,800<br />
60 25.00 17350.00 75.00 5.91 891 4,704,480 7,056,720 9,408,960 11,761,200 14,113,440 16,465,680 18,817,920 21,170,160 23,522,400 47,044,800<br />
60 25.67 17814.98 77.01 6.07 891 4,704,480 7,056,720 9,408,960 11,761,200 14,113,440 16,465,680 18,817,920 21,170,160 23,522,400 47,044,800<br />
60 26.33 18273.02 78.99 6.22 891 4,704,480 7,056,720 9,408,960 11,761,200 14,113,440 16,465,680 18,817,920 21,170,160 23,522,400 47,044,800<br />
60 27.00 18738.00 81.00 6.38 891 4,704,480 7,056,720 9,408,960 11,761,200 14,113,440 16,465,680 18,817,920 21,170,160 23,522,400 47,044,800<br />
60 27.67 19202.98 83.01 6.54 891 4,704,480 7,056,720 9,408,960 11,761,200 14,113,440 16,465,680 18,817,920 21,170,160 23,522,400 47,044,800<br />
60 28.33 19661.02 84.99 6.70 891 4,704,480 7,056,720 9,408,960 11,761,200 14,113,440 16,465,680 18,817,920 21,170,160 23,522,400 47,044,800<br />
60 29.00 20126.00 87.00 6.86 891 4,704,480 7,056,720 9,408,960 11,761,200 14,113,440 16,465,680 18,817,920 21,170,160 23,522,400 47,044,800<br />
60 30.00 20820.00 90.00 7.09 891 4,704,480 7,056,720 9,408,960 11,761,200 14,113,440 16,465,680 18,817,920 21,170,160 23,522,400 47,044,800<br />
Pipe Capital Costs_Single_PF of 3_FINAL.xls, Capital Costs Page 2 of 6 3/30/2007 2:55 PM
Diam (in)<br />
Annual<br />
Average<br />
Day Flow<br />
Annual<br />
Average Day<br />
Pipe Velocity<br />
at Peak<br />
Hourly Flow<br />
Pipe Unit<br />
Project<br />
Cost ($/ft)<br />
(mgd) Flow (gpm)<br />
Peak Hourly<br />
Flow (mgd) (fps)<br />
4 0.10 69.40 0.30 5.32 97<br />
6 0.20 138.80 0.60 4.73 106<br />
6 0.27 187.38 0.81 6.38 106<br />
8 0.40 277.60 1.20 5.32 115<br />
8 0.47 326.18 1.41 6.25 115<br />
8 0.53 367.82 1.59 7.05 115<br />
10 0.60 416.40 1.80 5.11 128<br />
10 0.67 464.98 2.01 5.70 128<br />
10 0.83 576.02 2.49 7.06 128<br />
12 0.93 645.42 2.79 5.50 140<br />
12 1.00 694.00 3.00 5.91 140<br />
12 1.17 811.98 3.51 6.91 140<br />
14 1.33 923.02 3.99 5.77 157<br />
14 1.50 1041.00 4.50 6.51 157<br />
14 1.67 1158.98 5.01 7.25 157<br />
16 1.83 1270.02 5.49 6.08 189<br />
16 2.00 1388.00 6.00 6.65 189<br />
16 2.07 1436.58 6.21 6.88 189<br />
18 2.17 1505.98 6.51 5.70 211<br />
18 2.33 1617.02 6.99 6.12 211<br />
18 2.50 1735.00 7.50 6.57 211<br />
18 2.67 1852.98 8.01 7.01 211<br />
20 2.83 1964.02 8.49 6.02 236<br />
20 3.00 2082.00 9.00 6.38 236<br />
20 3.17 2199.98 9.51 6.74 236<br />
20 3.33 2311.02 9.99 7.08 236<br />
24 3.50 2429.00 10.50 5.17 284<br />
24 3.67 2546.98 11.01 5.42 284<br />
24 3.83 2658.02 11.49 5.66 284<br />
24 4.00 2776.00 12.00 5.91 284<br />
24 4.17 2893.98 12.51 6.16 284<br />
24 4.33 3005.02 12.99 6.40 284<br />
24 4.50 3123.00 13.50 6.65 284<br />
24 4.67 3240.98 14.01 6.90 284<br />
30 5.33 3699.02 15.99 5.04 353<br />
30 5.67 3934.98 17.01 5.36 353<br />
30 6.00 4164.00 18.00 5.67 353<br />
30 6.33 4393.02 18.99 5.99 353<br />
30 6.67 4628.98 20.01 6.31 353<br />
30 7.00 4858.00 21.00 6.62 353<br />
30 7.33 5087.02 21.99 6.93 353<br />
36 8.00 5552.00 24.00 5.25 434<br />
36 8.33 5781.02 24.99 5.47 434<br />
36 8.67 6016.98 26.01 5.69 434<br />
36 9.00 6246.00 27.00 5.91 434<br />
36 9.33 6475.02 27.99 6.13 434<br />
36 9.67 6710.98 29.01 6.35 434<br />
36 10.00 6940.00 30.00 6.57 434<br />
36 10.33 7169.02 30.99 6.78 434<br />
36 10.50 7287.00 31.50 6.89 434<br />
36 10.67 7404.98 32.01 7.01 434<br />
42 11.33 7863.02 33.99 5.47 531<br />
Capital PROJECT Cost Curves <strong>for</strong> Reclaimed Transmission Piping<br />
Urban - Annualized Capital Cost - $/yr<br />
1 1.5 2 2.5 3 3.5 4 4.5 5 10<br />
$39,531 $59,297 $79,063 $98,829 $118,594 $138,360 $158,126 $177,891 $197,657 $395,314<br />
$43,199 $64,799 $86,399 $107,998 $129,598 $151,198 $172,797 $194,397 $215,997 $431,993<br />
$43,199 $64,799 $86,399 $107,998 $129,598 $151,198 $172,797 $194,397 $215,997 $431,993<br />
$46,867 $70,301 $93,734 $117,168 $140,602 $164,035 $187,469 $210,902 $234,336 $468,672<br />
$46,867 $70,301 $93,734 $117,168 $140,602 $164,035 $187,469 $210,902 $234,336 $468,672<br />
$46,867 $70,301 $93,734 $117,168 $140,602 $164,035 $187,469 $210,902 $234,336 $468,672<br />
$52,165 $78,248 $104,330 $130,413 $156,496 $182,578 $208,661 $234,743 $260,826 $521,652<br />
$52,165 $78,248 $104,330 $130,413 $156,496 $182,578 $208,661 $234,743 $260,826 $521,652<br />
$52,165 $78,248 $104,330 $130,413 $156,496 $182,578 $208,661 $234,743 $260,826 $521,652<br />
$57,056 $85,584 $114,111 $142,639 $171,167 $199,695 $228,223 $256,751 $285,278 $570,557<br />
$57,056 $85,584 $114,111 $142,639 $171,167 $199,695 $228,223 $256,751 $285,278 $570,557<br />
$57,056 $85,584 $114,111 $142,639 $171,167 $199,695 $228,223 $256,751 $285,278 $570,557<br />
$63,984 $95,976 $127,968 $159,960 $191,952 $223,944 $255,936 $287,927 $319,919 $639,839<br />
$63,984 $95,976 $127,968 $159,960 $191,952 $223,944 $255,936 $287,927 $319,919 $639,839<br />
$63,984 $95,976 $127,968 $159,960 $191,952 $223,944 $255,936 $287,927 $319,919 $639,839<br />
$77,025 $115,538 $154,050 $192,563 $231,076 $269,588 $308,101 $346,613 $385,126 $770,252<br />
$77,025 $115,538 $154,050 $192,563 $231,076 $269,588 $308,101 $346,613 $385,126 $770,252<br />
$77,025 $115,538 $154,050 $192,563 $231,076 $269,588 $308,101 $346,613 $385,126 $770,252<br />
$85,991 $128,987 $171,982 $214,978 $257,973 $300,969 $343,964 $386,960 $429,955 $859,911<br />
$85,991 $128,987 $171,982 $214,978 $257,973 $300,969 $343,964 $386,960 $429,955 $859,911<br />
$85,991 $128,987 $171,982 $214,978 $257,973 $300,969 $343,964 $386,960 $429,955 $859,911<br />
$85,991 $128,987 $171,982 $214,978 $257,973 $300,969 $343,964 $386,960 $429,955 $859,911<br />
$96,180 $144,269 $192,359 $240,449 $288,539 $336,629 $384,718 $432,808 $480,898 $961,796<br />
$96,180 $144,269 $192,359 $240,449 $288,539 $336,629 $384,718 $432,808 $480,898 $961,796<br />
$96,180 $144,269 $192,359 $240,449 $288,539 $336,629 $384,718 $432,808 $480,898 $961,796<br />
$96,180 $144,269 $192,359 $240,449 $288,539 $336,629 $384,718 $432,808 $480,898 $961,796<br />
$115,742 $173,612 $231,483 $289,354 $347,225 $405,095 $462,966 $520,837 $578,708 $1,157,415<br />
$115,742 $173,612 $231,483 $289,354 $347,225 $405,095 $462,966 $520,837 $578,708 $1,157,415<br />
$115,742 $173,612 $231,483 $289,354 $347,225 $405,095 $462,966 $520,837 $578,708 $1,157,415<br />
$115,742 $173,612 $231,483 $289,354 $347,225 $405,095 $462,966 $520,837 $578,708 $1,157,415<br />
$115,742 $173,612 $231,483 $289,354 $347,225 $405,095 $462,966 $520,837 $578,708 $1,157,415<br />
$115,742 $173,612 $231,483 $289,354 $347,225 $405,095 $462,966 $520,837 $578,708 $1,157,415<br />
$115,742 $173,612 $231,483 $289,354 $347,225 $405,095 $462,966 $520,837 $578,708 $1,157,415<br />
$115,742 $173,612 $231,483 $289,354 $347,225 $405,095 $462,966 $520,837 $578,708 $1,157,415<br />
$143,862 $215,793 $287,724 $359,655 $431,586 $503,516 $575,447 $647,378 $719,309 $1,438,618<br />
$143,862 $215,793 $287,724 $359,655 $431,586 $503,516 $575,447 $647,378 $719,309 $1,438,618<br />
$143,862 $215,793 $287,724 $359,655 $431,586 $503,516 $575,447 $647,378 $719,309 $1,438,618<br />
$143,862 $215,793 $287,724 $359,655 $431,586 $503,516 $575,447 $647,378 $719,309 $1,438,618<br />
$143,862 $215,793 $287,724 $359,655 $431,586 $503,516 $575,447 $647,378 $719,309 $1,438,618<br />
$143,862 $215,793 $287,724 $359,655 $431,586 $503,516 $575,447 $647,378 $719,309 $1,438,618<br />
$143,862 $215,793 $287,724 $359,655 $431,586 $503,516 $575,447 $647,378 $719,309 $1,438,618<br />
$176,873 $265,309 $353,745 $442,182 $530,618 $619,054 $707,491 $795,927 $884,363 $1,768,726<br />
$176,873 $265,309 $353,745 $442,182 $530,618 $619,054 $707,491 $795,927 $884,363 $1,768,726<br />
$176,873 $265,309 $353,745 $442,182 $530,618 $619,054 $707,491 $795,927 $884,363 $1,768,726<br />
$176,873 $265,309 $353,745 $442,182 $530,618 $619,054 $707,491 $795,927 $884,363 $1,768,726<br />
$176,873 $265,309 $353,745 $442,182 $530,618 $619,054 $707,491 $795,927 $884,363 $1,768,726<br />
$176,873 $265,309 $353,745 $442,182 $530,618 $619,054 $707,491 $795,927 $884,363 $1,768,726<br />
$176,873 $265,309 $353,745 $442,182 $530,618 $619,054 $707,491 $795,927 $884,363 $1,768,726<br />
$176,873 $265,309 $353,745 $442,182 $530,618 $619,054 $707,491 $795,927 $884,363 $1,768,726<br />
$176,873 $265,309 $353,745 $442,182 $530,618 $619,054 $707,491 $795,927 $884,363 $1,768,726<br />
$176,873 $265,309 $353,745 $442,182 $530,618 $619,054 $707,491 $795,927 $884,363 $1,768,726<br />
$216,404 $324,606 $432,808 $541,010 $649,212 $757,414 $865,616 $973,818 $1,082,020 $2,164,041<br />
Pipe Capital Costs_Single_PF of 3_FINAL.xls, Capital Costs Page 3 of 6 3/30/2007 2:55 PM
Diam (in)<br />
Annual<br />
Average<br />
Day Flow<br />
(mgd)<br />
Annual<br />
Average Day Peak Hourly<br />
Flow (gpm) Flow (mgd)<br />
Pipe Velocity<br />
at Peak<br />
Hourly Flow<br />
(fps)<br />
Pipe Unit<br />
Project<br />
Cost ($/ft)<br />
42 11.67 8098.98 35.01 5.63 531<br />
42 12.00 8328.00 36.00 5.79 531<br />
42 12.33 8557.02 36.99 5.95 531<br />
42 12.67 8792.98 38.01 6.11 531<br />
42 13.00 9022.00 39.00 6.27 531<br />
42 13.33 9251.02 39.99 6.43 531<br />
42 13.67 9486.98 41.01 6.59 531<br />
42 14.00 9716.00 42.00 6.75 531<br />
42 14.67 10180.98 44.01 7.08 531<br />
48 13.67 9486.98 41.01 5.05 671<br />
48 14.00 9716.00 42.00 5.17 671<br />
48 14.33 9945.02 42.99 5.29 671<br />
48 14.67 10180.98 44.01 5.42 671<br />
48 15.00 10410.00 45.00 5.54 671<br />
48 15.33 10639.02 45.99 5.66 671<br />
48 15.67 10874.98 47.01 5.79 671<br />
48 16.00 11104.00 48.00 5.91 671<br />
48 16.33 11333.02 48.99 6.03 671<br />
48 16.67 11568.98 50.01 6.16 671<br />
48 17.33 12027.02 51.99 6.40 671<br />
48 18.00 12492.00 54.00 6.65 671<br />
48 18.33 12721.02 54.99 6.77 671<br />
48 19.00 13186.00 57.00 7.02 671<br />
54 17.33 12027.02 51.99 5.06 781<br />
54 18.00 12492.00 54.00 5.25 781<br />
54 18.67 12956.98 56.01 5.45 781<br />
54 19.33 13415.02 57.99 5.64 781<br />
54 20.00 13880.00 60.00 5.84 781<br />
54 20.67 14344.98 62.01 6.03 781<br />
54 21.33 14803.02 63.99 6.22 781<br />
54 22.00 15268.00 66.00 6.42 781<br />
54 22.67 15732.98 68.01 6.62 781<br />
54 23.33 16191.02 69.99 6.81 781<br />
54 24.00 16656.00 72.00 7.00 781<br />
60 21.17 14691.98 63.51 5.00 891<br />
60 21.67 15038.98 65.01 5.12 891<br />
60 22.33 15497.02 66.99 5.28 891<br />
60 23.00 15962.00 69.00 5.44 891<br />
60 23.67 16426.98 71.01 5.60 891<br />
60 24.33 16885.02 72.99 5.75 891<br />
60 25.00 17350.00 75.00 5.91 891<br />
60 25.67 17814.98 77.01 6.07 891<br />
60 26.33 18273.02 78.99 6.22 891<br />
60 27.00 18738.00 81.00 6.38 891<br />
60 27.67 19202.98 83.01 6.54 891<br />
60 28.33 19661.02 84.99 6.70 891<br />
60 29.00 20126.00 87.00 6.86 891<br />
60 30.00 20820.00 90.00 7.09 891<br />
Capital PROJECT Cost Curves <strong>for</strong> Reclaimed Transmission Piping<br />
Urban - Annualized Capital Cost - $/yr<br />
1 1.5 2 2.5 3 3.5 4 4.5 5 10<br />
$216,404 $324,606 $432,808 $541,010 $649,212 $757,414 $865,616 $973,818 $1,082,020 $2,164,041<br />
$216,404 $324,606 $432,808 $541,010 $649,212 $757,414 $865,616 $973,818 $1,082,020 $2,164,041<br />
$216,404 $324,606 $432,808 $541,010 $649,212 $757,414 $865,616 $973,818 $1,082,020 $2,164,041<br />
$216,404 $324,606 $432,808 $541,010 $649,212 $757,414 $865,616 $973,818 $1,082,020 $2,164,041<br />
$216,404 $324,606 $432,808 $541,010 $649,212 $757,414 $865,616 $973,818 $1,082,020 $2,164,041<br />
$216,404 $324,606 $432,808 $541,010 $649,212 $757,414 $865,616 $973,818 $1,082,020 $2,164,041<br />
$216,404 $324,606 $432,808 $541,010 $649,212 $757,414 $865,616 $973,818 $1,082,020 $2,164,041<br />
$216,404 $324,606 $432,808 $541,010 $649,212 $757,414 $865,616 $973,818 $1,082,020 $2,164,041<br />
$216,404 $324,606 $432,808 $541,010 $649,212 $757,414 $865,616 $973,818 $1,082,020 $2,164,041<br />
$273,460 $410,190 $546,920 $683,649 $820,379 $957,109 $1,093,839 $1,230,569 $1,367,299 $2,734,598<br />
$273,460 $410,190 $546,920 $683,649 $820,379 $957,109 $1,093,839 $1,230,569 $1,367,299 $2,734,598<br />
$273,460 $410,190 $546,920 $683,649 $820,379 $957,109 $1,093,839 $1,230,569 $1,367,299 $2,734,598<br />
$273,460 $410,190 $546,920 $683,649 $820,379 $957,109 $1,093,839 $1,230,569 $1,367,299 $2,734,598<br />
$273,460 $410,190 $546,920 $683,649 $820,379 $957,109 $1,093,839 $1,230,569 $1,367,299 $2,734,598<br />
$273,460 $410,190 $546,920 $683,649 $820,379 $957,109 $1,093,839 $1,230,569 $1,367,299 $2,734,598<br />
$273,460 $410,190 $546,920 $683,649 $820,379 $957,109 $1,093,839 $1,230,569 $1,367,299 $2,734,598<br />
$273,460 $410,190 $546,920 $683,649 $820,379 $957,109 $1,093,839 $1,230,569 $1,367,299 $2,734,598<br />
$273,460 $410,190 $546,920 $683,649 $820,379 $957,109 $1,093,839 $1,230,569 $1,367,299 $2,734,598<br />
$273,460 $410,190 $546,920 $683,649 $820,379 $957,109 $1,093,839 $1,230,569 $1,367,299 $2,734,598<br />
$273,460 $410,190 $546,920 $683,649 $820,379 $957,109 $1,093,839 $1,230,569 $1,367,299 $2,734,598<br />
$273,460 $410,190 $546,920 $683,649 $820,379 $957,109 $1,093,839 $1,230,569 $1,367,299 $2,734,598<br />
$273,460 $410,190 $546,920 $683,649 $820,379 $957,109 $1,093,839 $1,230,569 $1,367,299 $2,734,598<br />
$273,460 $410,190 $546,920 $683,649 $820,379 $957,109 $1,093,839 $1,230,569 $1,367,299 $2,734,598<br />
$318,289 $477,434 $636,578 $795,723 $954,868 $1,114,012 $1,273,157 $1,432,302 $1,591,446 $3,182,892<br />
$318,289 $477,434 $636,578 $795,723 $954,868 $1,114,012 $1,273,157 $1,432,302 $1,591,446 $3,182,892<br />
$318,289 $477,434 $636,578 $795,723 $954,868 $1,114,012 $1,273,157 $1,432,302 $1,591,446 $3,182,892<br />
$318,289 $477,434 $636,578 $795,723 $954,868 $1,114,012 $1,273,157 $1,432,302 $1,591,446 $3,182,892<br />
$318,289 $477,434 $636,578 $795,723 $954,868 $1,114,012 $1,273,157 $1,432,302 $1,591,446 $3,182,892<br />
$318,289 $477,434 $636,578 $795,723 $954,868 $1,114,012 $1,273,157 $1,432,302 $1,591,446 $3,182,892<br />
$318,289 $477,434 $636,578 $795,723 $954,868 $1,114,012 $1,273,157 $1,432,302 $1,591,446 $3,182,892<br />
$318,289 $477,434 $636,578 $795,723 $954,868 $1,114,012 $1,273,157 $1,432,302 $1,591,446 $3,182,892<br />
$318,289 $477,434 $636,578 $795,723 $954,868 $1,114,012 $1,273,157 $1,432,302 $1,591,446 $3,182,892<br />
$318,289 $477,434 $636,578 $795,723 $954,868 $1,114,012 $1,273,157 $1,432,302 $1,591,446 $3,182,892<br />
$318,289 $477,434 $636,578 $795,723 $954,868 $1,114,012 $1,273,157 $1,432,302 $1,591,446 $3,182,892<br />
$363,119 $544,678 $726,237 $907,797 $1,089,356 $1,270,915 $1,452,475 $1,634,034 $1,815,594 $3,631,187<br />
$363,119 $544,678 $726,237 $907,797 $1,089,356 $1,270,915 $1,452,475 $1,634,034 $1,815,594 $3,631,187<br />
$363,119 $544,678 $726,237 $907,797 $1,089,356 $1,270,915 $1,452,475 $1,634,034 $1,815,594 $3,631,187<br />
$363,119 $544,678 $726,237 $907,797 $1,089,356 $1,270,915 $1,452,475 $1,634,034 $1,815,594 $3,631,187<br />
$363,119 $544,678 $726,237 $907,797 $1,089,356 $1,270,915 $1,452,475 $1,634,034 $1,815,594 $3,631,187<br />
$363,119 $544,678 $726,237 $907,797 $1,089,356 $1,270,915 $1,452,475 $1,634,034 $1,815,594 $3,631,187<br />
$363,119 $544,678 $726,237 $907,797 $1,089,356 $1,270,915 $1,452,475 $1,634,034 $1,815,594 $3,631,187<br />
$363,119 $544,678 $726,237 $907,797 $1,089,356 $1,270,915 $1,452,475 $1,634,034 $1,815,594 $3,631,187<br />
$363,119 $544,678 $726,237 $907,797 $1,089,356 $1,270,915 $1,452,475 $1,634,034 $1,815,594 $3,631,187<br />
$363,119 $544,678 $726,237 $907,797 $1,089,356 $1,270,915 $1,452,475 $1,634,034 $1,815,594 $3,631,187<br />
$363,119 $544,678 $726,237 $907,797 $1,089,356 $1,270,915 $1,452,475 $1,634,034 $1,815,594 $3,631,187<br />
$363,119 $544,678 $726,237 $907,797 $1,089,356 $1,270,915 $1,452,475 $1,634,034 $1,815,594 $3,631,187<br />
$363,119 $544,678 $726,237 $907,797 $1,089,356 $1,270,915 $1,452,475 $1,634,034 $1,815,594 $3,631,187<br />
$363,119 $544,678 $726,237 $907,797 $1,089,356 $1,270,915 $1,452,475 $1,634,034 $1,815,594 $3,631,187<br />
Pipe Capital Costs_Single_PF of 3_FINAL.xls, Capital Costs Page 4 of 6 3/30/2007 2:55 PM
Diam (in)<br />
Annual<br />
Average<br />
Day Flow<br />
Annual<br />
Average Day<br />
Pipe Velocity<br />
at Peak Pipe Unit<br />
Hourly Flow Project<br />
(fps) Cost ($/ft)<br />
(mgd) Flow (gpm)<br />
Peak Hourly<br />
Flow (mgd)<br />
4 0.10 69.40 0.30 5.32 97<br />
6 0.20 138.80 0.60 4.73 106<br />
6 0.27 187.38 0.81 6.38 106<br />
8 0.40 277.60 1.20 5.32 115<br />
8 0.47 326.18 1.41 6.25 115<br />
8 0.53 367.82 1.59 7.05 115<br />
10 0.60 416.40 1.80 5.11 128<br />
10 0.67 464.98 2.01 5.70 128<br />
10 0.83 576.02 2.49 7.06 128<br />
12 0.93 645.42 2.79 5.50 140<br />
12 1.00 694.00 3.00 5.91 140<br />
12 1.17 811.98 3.51 6.91 140<br />
14 1.33 923.02 3.99 5.77 157<br />
14 1.50 1041.00 4.50 6.51 157<br />
14 1.67 1158.98 5.01 7.25 157<br />
16 1.83 1270.02 5.49 6.08 189<br />
16 2.00 1388.00 6.00 6.65 189<br />
16 2.07 1436.58 6.21 6.88 189<br />
18 2.17 1505.98 6.51 5.70 211<br />
18 2.33 1617.02 6.99 6.12 211<br />
18 2.50 1735.00 7.50 6.57 211<br />
18 2.67 1852.98 8.01 7.01 211<br />
20 2.83 1964.02 8.49 6.02 236<br />
20 3.00 2082.00 9.00 6.38 236<br />
20 3.17 2199.98 9.51 6.74 236<br />
20 3.33 2311.02 9.99 7.08 236<br />
24 3.50 2429.00 10.50 5.17 284<br />
24 3.67 2546.98 11.01 5.42 284<br />
24 3.83 2658.02 11.49 5.66 284<br />
24 4.00 2776.00 12.00 5.91 284<br />
24 4.17 2893.98 12.51 6.16 284<br />
24 4.33 3005.02 12.99 6.40 284<br />
24 4.50 3123.00 13.50 6.65 284<br />
24 4.67 3240.98 14.01 6.90 284<br />
30 5.33 3699.02 15.99 5.04 353<br />
30 5.67 3934.98 17.01 5.36 353<br />
30 6.00 4164.00 18.00 5.67 353<br />
30 6.33 4393.02 18.99 5.99 353<br />
30 6.67 4628.98 20.01 6.31 353<br />
30 7.00 4858.00 21.00 6.62 353<br />
30 7.33 5087.02 21.99 6.93 353<br />
36 8.00 5552.00 24.00 5.25 434<br />
36 8.33 5781.02 24.99 5.47 434<br />
36 8.67 6016.98 26.01 5.69 434<br />
36 9.00 6246.00 27.00 5.91 434<br />
36 9.33 6475.02 27.99 6.13 434<br />
36 9.67 6710.98 29.01 6.35 434<br />
36 10.00 6940.00 30.00 6.57 434<br />
36 10.33 7169.02 30.99 6.78 434<br />
36 10.50 7287.00 31.50 6.89 434<br />
36 10.67 7404.98 32.01 7.01 434<br />
42 11.33 7863.02 33.99 5.47 531<br />
Capital PROJECT Cost Curves <strong>for</strong> Reclaimed Transmission Piping<br />
Urban Capital Cost - Cost per 1000 gallons<br />
1 1.5 2 2.5 3 3.5 4 5 10<br />
$1.08 $1.62 $2.17 $2.71 $3.25 $3.79 $4.33 $4.87 $5.42 $10.83<br />
$0.59 $0.89 $1.18 $1.48 $1.78 $2.07 $2.37 $2.66 $2.96 $5.92<br />
$0.44 $0.66 $0.88 $1.10 $1.32 $1.53 $1.75 $1.97 $2.19 $4.38<br />
$0.32 $0.48 $0.64 $0.80 $0.96 $1.12 $1.28 $1.44 $1.61 $3.21<br />
$0.27 $0.41 $0.55 $0.68 $0.82 $0.96 $1.09 $1.23 $1.37 $2.73<br />
$0.24 $0.36 $0.48 $0.61 $0.73 $0.85 $0.97 $1.09 $1.21 $2.42<br />
$0.24 $0.36 $0.48 $0.60 $0.71 $0.83 $0.95 $1.07 $1.19 $2.38<br />
$0.21 $0.32 $0.43 $0.53 $0.64 $0.75 $0.85 $0.96 $1.07 $2.13<br />
$0.17 $0.26 $0.34 $0.43 $0.52 $0.60 $0.69 $0.77 $0.86 $1.72<br />
$0.17 $0.25 $0.34 $0.42 $0.50 $0.59 $0.67 $0.76 $0.84 $1.68<br />
$0.16 $0.23 $0.31 $0.39 $0.47 $0.55 $0.63 $0.70 $0.78 $1.56<br />
$0.13 $0.20 $0.27 $0.33 $0.40 $0.47 $0.53 $0.60 $0.67 $1.34<br />
$0.13 $0.20 $0.26 $0.33 $0.40 $0.46 $0.53 $0.59 $0.66 $1.32<br />
$0.12 $0.18 $0.23 $0.29 $0.35 $0.41 $0.47 $0.53 $0.58 $1.17<br />
$0.10 $0.16 $0.21 $0.26 $0.31 $0.37 $0.42 $0.47 $0.52 $1.05<br />
$0.12 $0.17 $0.23 $0.29 $0.35 $0.40 $0.46 $0.52 $0.58 $1.15<br />
$0.11 $0.16 $0.21 $0.26 $0.32 $0.37 $0.42 $0.47 $0.53 $1.06<br />
$0.10 $0.15 $0.20 $0.25 $0.31 $0.36 $0.41 $0.46 $0.51 $1.02<br />
$0.11 $0.16 $0.22 $0.27 $0.33 $0.38 $0.43 $0.49 $0.54 $1.09<br />
$0.10 $0.15 $0.20 $0.25 $0.30 $0.35 $0.40 $0.46 $0.51 $1.01<br />
$0.09 $0.14 $0.19 $0.24 $0.28 $0.33 $0.38 $0.42 $0.47 $0.94<br />
$0.09 $0.13 $0.18 $0.22 $0.26 $0.31 $0.35 $0.40 $0.44 $0.88<br />
$0.09 $0.14 $0.19 $0.23 $0.28 $0.33 $0.37 $0.42 $0.47 $0.93<br />
$0.09 $0.13 $0.18 $0.22 $0.26 $0.31 $0.35 $0.40 $0.44 $0.88<br />
$0.08 $0.12 $0.17 $0.21 $0.25 $0.29 $0.33 $0.37 $0.42 $0.83<br />
$0.08 $0.12 $0.16 $0.20 $0.24 $0.28 $0.32 $0.36 $0.40 $0.79<br />
$0.09 $0.14 $0.18 $0.23 $0.27 $0.32 $0.36 $0.41 $0.45 $0.91<br />
$0.09 $0.13 $0.17 $0.22 $0.26 $0.30 $0.35 $0.39 $0.43 $0.86<br />
$0.08 $0.12 $0.17 $0.21 $0.25 $0.29 $0.33 $0.37 $0.41 $0.83<br />
$0.08 $0.12 $0.16 $0.20 $0.24 $0.28 $0.32 $0.36 $0.40 $0.79<br />
$0.08 $0.11 $0.15 $0.19 $0.23 $0.27 $0.30 $0.34 $0.38 $0.76<br />
$0.07 $0.11 $0.15 $0.18 $0.22 $0.26 $0.29 $0.33 $0.37 $0.73<br />
$0.07 $0.11 $0.14 $0.18 $0.21 $0.25 $0.28 $0.32 $0.35 $0.70<br />
$0.07 $0.10 $0.14 $0.17 $0.20 $0.24 $0.27 $0.31 $0.34 $0.68<br />
$0.07 $0.11 $0.15 $0.18 $0.22 $0.26 $0.30 $0.33 $0.37 $0.74<br />
$0.07 $0.10 $0.14 $0.17 $0.21 $0.24 $0.28 $0.31 $0.35 $0.70<br />
$0.07 $0.10 $0.13 $0.16 $0.20 $0.23 $0.26 $0.30 $0.33 $0.66<br />
$0.06 $0.09 $0.12 $0.16 $0.19 $0.22 $0.25 $0.28 $0.31 $0.62<br />
$0.06 $0.09 $0.12 $0.15 $0.18 $0.21 $0.24 $0.27 $0.30 $0.59<br />
$0.06 $0.08 $0.11 $0.14 $0.17 $0.20 $0.23 $0.25 $0.28 $0.56<br />
$0.05 $0.08 $0.11 $0.13 $0.16 $0.19 $0.22 $0.24 $0.27 $0.54<br />
$0.06 $0.09 $0.12 $0.15 $0.18 $0.21 $0.24 $0.27 $0.30 $0.61<br />
$0.06 $0.09 $0.12 $0.15 $0.17 $0.20 $0.23 $0.26 $0.29 $0.58<br />
$0.06 $0.08 $0.11 $0.14 $0.17 $0.20 $0.22 $0.25 $0.28 $0.56<br />
$0.05 $0.08 $0.11 $0.13 $0.16 $0.19 $0.22 $0.24 $0.27 $0.54<br />
$0.05 $0.08 $0.10 $0.13 $0.16 $0.18 $0.21 $0.23 $0.26 $0.52<br />
$0.05 $0.08 $0.10 $0.13 $0.15 $0.18 $0.20 $0.23 $0.25 $0.50<br />
$0.05 $0.07 $0.10 $0.12 $0.15 $0.17 $0.19 $0.22 $0.24 $0.48<br />
$0.05 $0.07 $0.09 $0.12 $0.14 $0.16 $0.19 $0.21 $0.23 $0.47<br />
$0.05 $0.07 $0.09 $0.12 $0.14 $0.16 $0.18 $0.21 $0.23 $0.46<br />
$0.05 $0.07 $0.09 $0.11 $0.14 $0.16 $0.18 $0.20 $0.23 $0.45<br />
$0.05 $0.08 $0.10 $0.13 $0.16 $0.18 $0.21 $0.24 $0.26 $0.52<br />
Pipe Capital Costs_Single_PF of 3_FINAL.xls, Capital Costs Page 5 of 6 3/30/2007 2:55 PM
Diam (in)<br />
Annual<br />
Average<br />
Day Flow<br />
(mgd)<br />
Annual<br />
Average Day Peak Hourly<br />
Flow (gpm) Flow (mgd)<br />
Pipe Velocity<br />
at Peak<br />
Hourly Flow<br />
(fps)<br />
Pipe Unit<br />
Project<br />
Cost ($/ft)<br />
42 11.67 8098.98 35.01 5.63 531<br />
42 12.00 8328.00 36.00 5.79 531<br />
42 12.33 8557.02 36.99 5.95 531<br />
42 12.67 8792.98 38.01 6.11 531<br />
42 13.00 9022.00 39.00 6.27 531<br />
42 13.33 9251.02 39.99 6.43 531<br />
42 13.67 9486.98 41.01 6.59 531<br />
42 14.00 9716.00 42.00 6.75 531<br />
42 14.67 10180.98 44.01 7.08 531<br />
48 13.67 9486.98 41.01 5.05 671<br />
48 14.00 9716.00 42.00 5.17 671<br />
48 14.33 9945.02 42.99 5.29 671<br />
48 14.67 10180.98 44.01 5.42 671<br />
48 15.00 10410.00 45.00 5.54 671<br />
48 15.33 10639.02 45.99 5.66 671<br />
48 15.67 10874.98 47.01 5.79 671<br />
48 16.00 11104.00 48.00 5.91 671<br />
48 16.33 11333.02 48.99 6.03 671<br />
48 16.67 11568.98 50.01 6.16 671<br />
48 17.33 12027.02 51.99 6.40 671<br />
48 18.00 12492.00 54.00 6.65 671<br />
48 18.33 12721.02 54.99 6.77 671<br />
48 19.00 13186.00 57.00 7.02 671<br />
54 17.33 12027.02 51.99 5.06 781<br />
54 18.00 12492.00 54.00 5.25 781<br />
54 18.67 12956.98 56.01 5.45 781<br />
54 19.33 13415.02 57.99 5.64 781<br />
54 20.00 13880.00 60.00 5.84 781<br />
54 20.67 14344.98 62.01 6.03 781<br />
54 21.33 14803.02 63.99 6.22 781<br />
54 22.00 15268.00 66.00 6.42 781<br />
54 22.67 15732.98 68.01 6.62 781<br />
54 23.33 16191.02 69.99 6.81 781<br />
54 24.00 16656.00 72.00 7.00 781<br />
60 21.17 14691.98 63.51 5.00 891<br />
60 21.67 15038.98 65.01 5.12 891<br />
60 22.33 15497.02 66.99 5.28 891<br />
60 23.00 15962.00 69.00 5.44 891<br />
60 23.67 16426.98 71.01 5.60 891<br />
60 24.33 16885.02 72.99 5.75 891<br />
60 25.00 17350.00 75.00 5.91 891<br />
60 25.67 17814.98 77.01 6.07 891<br />
60 26.33 18273.02 78.99 6.22 891<br />
60 27.00 18738.00 81.00 6.38 891<br />
60 27.67 19202.98 83.01 6.54 891<br />
60 28.33 19661.02 84.99 6.70 891<br />
60 29.00 20126.00 87.00 6.86 891<br />
60 30.00 20820.00 90.00 7.09 891<br />
Capital PROJECT Cost Curves <strong>for</strong> Reclaimed Transmission Piping<br />
Urban Capital Cost - Cost per 1000 gallons<br />
1 1.5 2 2.5 3 3.5 4 5 10<br />
$0.05 $0.08 $0.10 $0.13 $0.15 $0.18 $0.20 $0.23 $0.25 $0.51<br />
$0.05 $0.07 $0.10 $0.12 $0.15 $0.17 $0.20 $0.22 $0.25 $0.49<br />
$0.05 $0.07 $0.10 $0.12 $0.14 $0.17 $0.19 $0.22 $0.24 $0.48<br />
$0.05 $0.07 $0.09 $0.12 $0.14 $0.16 $0.19 $0.21 $0.23 $0.47<br />
$0.05 $0.07 $0.09 $0.11 $0.14 $0.16 $0.18 $0.21 $0.23 $0.46<br />
$0.04 $0.07 $0.09 $0.11 $0.13 $0.16 $0.18 $0.20 $0.22 $0.44<br />
$0.04 $0.07 $0.09 $0.11 $0.13 $0.15 $0.17 $0.20 $0.22 $0.43<br />
$0.04 $0.06 $0.08 $0.11 $0.13 $0.15 $0.17 $0.19 $0.21 $0.42<br />
$0.04 $0.06 $0.08 $0.10 $0.12 $0.14 $0.16 $0.18 $0.20 $0.40<br />
$0.05 $0.08 $0.11 $0.14 $0.16 $0.19 $0.22 $0.25 $0.27 $0.55<br />
$0.05 $0.08 $0.11 $0.13 $0.16 $0.19 $0.21 $0.24 $0.27 $0.54<br />
$0.05 $0.08 $0.10 $0.13 $0.16 $0.18 $0.21 $0.24 $0.26 $0.52<br />
$0.05 $0.08 $0.10 $0.13 $0.15 $0.18 $0.20 $0.23 $0.26 $0.51<br />
$0.05 $0.07 $0.10 $0.12 $0.15 $0.17 $0.20 $0.22 $0.25 $0.50<br />
$0.05 $0.07 $0.10 $0.12 $0.15 $0.17 $0.20 $0.22 $0.24 $0.49<br />
$0.05 $0.07 $0.10 $0.12 $0.14 $0.17 $0.19 $0.22 $0.24 $0.48<br />
$0.05 $0.07 $0.09 $0.12 $0.14 $0.16 $0.19 $0.21 $0.23 $0.47<br />
$0.05 $0.07 $0.09 $0.11 $0.14 $0.16 $0.18 $0.21 $0.23 $0.46<br />
$0.04 $0.07 $0.09 $0.11 $0.13 $0.16 $0.18 $0.20 $0.22 $0.45<br />
$0.04 $0.06 $0.09 $0.11 $0.13 $0.15 $0.17 $0.19 $0.22 $0.43<br />
$0.04 $0.06 $0.08 $0.10 $0.12 $0.15 $0.17 $0.19 $0.21 $0.42<br />
$0.04 $0.06 $0.08 $0.10 $0.12 $0.14 $0.16 $0.18 $0.20 $0.41<br />
$0.04 $0.06 $0.08 $0.10 $0.12 $0.14 $0.16 $0.18 $0.20 $0.39<br />
$0.05 $0.08 $0.10 $0.13 $0.15 $0.18 $0.20 $0.23 $0.25 $0.50<br />
$0.05 $0.07 $0.10 $0.12 $0.15 $0.17 $0.19 $0.22 $0.24 $0.48<br />
$0.05 $0.07 $0.09 $0.12 $0.14 $0.16 $0.19 $0.21 $0.23 $0.47<br />
$0.05 $0.07 $0.09 $0.11 $0.14 $0.16 $0.18 $0.20 $0.23 $0.45<br />
$0.04 $0.07 $0.09 $0.11 $0.13 $0.15 $0.17 $0.20 $0.22 $0.44<br />
$0.04 $0.06 $0.08 $0.11 $0.13 $0.15 $0.17 $0.19 $0.21 $0.42<br />
$0.04 $0.06 $0.08 $0.10 $0.12 $0.14 $0.16 $0.18 $0.20 $0.41<br />
$0.04 $0.06 $0.08 $0.10 $0.12 $0.14 $0.16 $0.18 $0.20 $0.40<br />
$0.04 $0.06 $0.08 $0.10 $0.12 $0.13 $0.15 $0.17 $0.19 $0.38<br />
$0.04 $0.06 $0.07 $0.09 $0.11 $0.13 $0.15 $0.17 $0.19 $0.37<br />
$0.04 $0.05 $0.07 $0.09 $0.11 $0.13 $0.15 $0.16 $0.18 $0.36<br />
$0.05 $0.07 $0.09 $0.12 $0.14 $0.16 $0.19 $0.21 $0.23 $0.47<br />
$0.05 $0.07 $0.09 $0.11 $0.14 $0.16 $0.18 $0.21 $0.23 $0.46<br />
$0.04 $0.07 $0.09 $0.11 $0.13 $0.16 $0.18 $0.20 $0.22 $0.45<br />
$0.04 $0.06 $0.09 $0.11 $0.13 $0.15 $0.17 $0.19 $0.22 $0.43<br />
$0.04 $0.06 $0.08 $0.11 $0.13 $0.15 $0.17 $0.19 $0.21 $0.42<br />
$0.04 $0.06 $0.08 $0.10 $0.12 $0.14 $0.16 $0.18 $0.20 $0.41<br />
$0.04 $0.06 $0.08 $0.10 $0.12 $0.14 $0.16 $0.18 $0.20 $0.40<br />
$0.04 $0.06 $0.08 $0.10 $0.12 $0.14 $0.16 $0.17 $0.19 $0.39<br />
$0.04 $0.06 $0.08 $0.09 $0.11 $0.13 $0.15 $0.17 $0.19 $0.38<br />
$0.04 $0.06 $0.07 $0.09 $0.11 $0.13 $0.15 $0.17 $0.18 $0.37<br />
$0.04 $0.05 $0.07 $0.09 $0.11 $0.13 $0.14 $0.16 $0.18 $0.36<br />
$0.04 $0.05 $0.07 $0.09 $0.11 $0.12 $0.14 $0.16 $0.18 $0.35<br />
$0.03 $0.05 $0.07 $0.09 $0.10 $0.12 $0.14 $0.15 $0.17 $0.34<br />
$0.03 $0.05 $0.07 $0.08 $0.10 $0.12 $0.13 $0.15 $0.17 $0.33<br />
Pipe Capital Costs_Single_PF of 3_FINAL.xls, Capital Costs Page 6 of 6 3/30/2007 2:55 PM
Pipe Capital Project Cost, $ Million<br />
20<br />
18<br />
16<br />
14<br />
12<br />
10<br />
8<br />
6<br />
4<br />
2<br />
Transmission, 4.5 mile:<br />
Urban Area Reclaimed Transmission Pipe Capital Project Costs, 0-5 mgd<br />
y = 1.084x + 2.2783<br />
R 2 = 0.974<br />
y = 1.2045x + 2.5314<br />
R 2 = 0.974<br />
y = 2.4089x + 5.0628<br />
R 2 Transmission, 5 mile:<br />
Transmission, 10 mile:<br />
= 0.974<br />
0<br />
0.00 0.50 1.00 1.50 2.00 2.50 3.00 3.50 4.00 4.50 5.00<br />
Flow, mgd<br />
Transmission, 1 mile:<br />
y = 0.2409x + 0.5063<br />
R 2 = 0.974<br />
y = 0.3613x + 0.7594<br />
R 2 = 0.974<br />
y = 0.4818x + 1.0126<br />
R 2 Transmission, 1.5 mile:<br />
Transmission, 2 mile:<br />
= 0.974<br />
Transmission, 2.5 mile:<br />
y = 0.6022x + 1.2657<br />
R 2 = 0.974<br />
Transmission, 3 mile:<br />
y = 0.7227x + 1.5188<br />
R 2 = 0.974<br />
Transmission, 3.5 mile:<br />
y = 0.8431x + 1.772<br />
R 2 = 0.974<br />
Transmission, 4 mile:<br />
y = 0.9636x + 2.0251<br />
R 2 = 0.974<br />
Transmission, 1 mile Transmission, 1.5 mile Transmission, 2 mile Transmission, 2.5 mile<br />
Transmission, 3 mile Transmission, 3.5 mile Transmission, 4 mile Transmission, 4.5 mile<br />
Transmission, 5 mile Transmission, 10 mile Linear (Transmission, 1 mile) Linear (Transmission, 1.5 mile)<br />
Linear (Transmission, 2 mile) Linear (Transmission, 2.5 mile) Linear (Transmission, 3 mile) Linear (Transmission, 3.5 mile)<br />
Linear (Transmission, 4 mile) Linear (Transmission, 4.5 mile) Linear (Transmission, 5 mile) Linear (Transmission, 10 mile)
Pipe Capital Project Cost, $ Million<br />
60<br />
55<br />
50<br />
45<br />
40<br />
35<br />
30<br />
25<br />
20<br />
15<br />
10<br />
5<br />
Urban Area Reclaimed Transmission Pipe Capital Project Costs, 5-30 mgd<br />
y = 0.7068x + 5.5269<br />
R 2 = 0.9164<br />
y = 1.4136x + 11.054<br />
R 2 Transmission, 5 mile:<br />
Transmission, 10 mile:<br />
= 0.9164<br />
0<br />
0.00 5.00 10.00 15.00 20.00 25.00 30.00 35.00<br />
Flow, mgd<br />
y = 0.1414x + 1.1054<br />
R 2 Transmission, 1 mile:<br />
= 0.9164<br />
Transmission, 1.5 mile:<br />
y = 0.212x + 1.6581<br />
R 2 = 0.9164<br />
Transmission, 2 mile:<br />
y = 0.2827x + 2.2108<br />
R 2 = 0.9164<br />
Transmission, 2.5 mile:<br />
y = 0.3534x + 2.7634<br />
R 2 = 0.9164<br />
Transmission, 3 mile:<br />
y = 0.4241x + 3.3161<br />
R 2 = 0.9164<br />
Transmission, 3.5 mile:<br />
y = 0.4948x + 3.8688<br />
R 2 = 0.9164<br />
Transmission, 4 mile:<br />
y = 0.5654x + 4.4215<br />
R 2 = 0.9164<br />
Transmission, 4.5 mile:<br />
y = 0.6361x + 4.9742<br />
R 2 = 0.9164<br />
Transmission, 1 mile Transmission, 1.5 mile Transmission, 2 mile Transmission, 2.5 mile<br />
Transmission, 3 mile Transmission, 3.5 mile Transmission, 4 mile Transmission, 4.5 mile<br />
Transmission, 5 mile Transmission, 10 mile Linear (Transmission, 1 mile) Linear (Transmission, 1.5 mile)<br />
Linear (Transmission, 2 mile) Linear (Transmission, 2.5 mile) Linear (Transmission, 3 mile) Linear (Transmission, 3.5 mile)<br />
Linear (Transmission, 4 mile) Linear (Transmission, 4.5 mile) Linear (Transmission, 5 mile) Linear (Transmission, 10 mile)
Pipe Capital Project Cost, $/1000 gallons<br />
$4.00<br />
$3.50<br />
$3.00<br />
$2.50<br />
$2.00<br />
$1.50<br />
$1.00<br />
$0.50<br />
Urban Area Reclaimed Transmission Pipe Capitcal Project Costs, $/1000 gallons<br />
Transmission, 1 mile:<br />
Transmission, 2 mile:<br />
Transmission, 3 mile:<br />
Transmission, 4 mile:<br />
Transmission, 5 mile:<br />
y = 0.1715x -0.4923<br />
R 2 = 0.9512<br />
y = 0.343x -0.4923<br />
R 2 = 0.9512<br />
y = 0.5145x -0.4923<br />
R 2 = 0.9512<br />
y = 0.686x -0.4923<br />
R 2 = 0.9512<br />
y = 0.8575x -0.4923<br />
R 2 = 0.9512<br />
Transmission, 1.5 mile:<br />
Transmission, 2.5 mile:<br />
Transmission, 3.5 mile:<br />
y = 0.2572x -0.4923<br />
R 2 = 0.9512<br />
y = 0.4287x -0.4923<br />
R 2 = 0.9512<br />
y = 0.6002x -0.4923<br />
R 2 = 0.9512<br />
y = 0.7717x -0.4923<br />
Transmission, 4.5 mile:<br />
Transmission, 10 mile:<br />
R 2 = 0.9512<br />
y = 1.7149x -0.4923<br />
R 2 = 0.9512<br />
$0.00<br />
0.00 5.00 10.00 15.00 20.00 25.00 30.00 35.00<br />
Flow, mgd<br />
Transmission, 1 mile Transmission, 1.5 mile Transmission, 2 mile Transmission, 2.5 mile<br />
Transmission, 3 mile Transmission, 3.5 mile Transmission, 4 mile Transmission, 4.5 mile<br />
Transmission, 5 mile Transmission, 10 mile Power (Transmission, 10 mile) Power (Transmission, 5 mile)<br />
Power (Transmission, 4.5 mile) Power (Transmission, 4 mile) Power (Transmission, 3.5 mile) Power (Transmission, 2.5 mile)<br />
Power (Transmission, 3 mile) Power (Transmission, 2 mile) Power (Transmission, 1.5 mile) Power (Transmission, 1 mile)
Capital PROJECT Cost Curves <strong>for</strong> Reclaimed <strong>Water</strong> Transmission Piping<br />
Rural Capital Cost by Distance - $ <strong>for</strong> 1-10 miles<br />
Annual<br />
Pipe<br />
Average Annual<br />
Velocity at Pipe Unit<br />
Day Flow Average Day Peak Hourly Peak Hourly Project<br />
Diam (in) (mgd) Flow (gpm) Flow (mgd) Flow (fps) Cost ($/ft) 1 1.5 2 2.5 3 3.5 4 4.5 5 10<br />
4 0.10 69.40 0.30 5.32 79 417,120 625,680 834,240 1,042,800 1,251,360 1,459,920 1,668,480 1,877,040 2,085,600 4,171,200<br />
6 0.20 138.80 0.60 4.73 86 454,080 681,120 908,160 1,135,200 1,362,240 1,589,280 1,816,320 2,043,360 2,270,400 4,540,800<br />
6 0.27 187.38 0.81 6.38 86 454,080 681,120 908,160 1,135,200 1,362,240 1,589,280 1,816,320 2,043,360 2,270,400 4,540,800<br />
8 0.40 277.60 1.20 5.32 95 501,600 752,400 1,003,200 1,254,000 1,504,800 1,755,600 2,006,400 2,257,200 2,508,000 5,016,000<br />
8 0.47 326.18 1.41 6.25 95 501,600 752,400 1,003,200 1,254,000 1,504,800 1,755,600 2,006,400 2,257,200 2,508,000 5,016,000<br />
8 0.53 367.82 1.59 7.05 95 501,600 752,400 1,003,200 1,254,000 1,504,800 1,755,600 2,006,400 2,257,200 2,508,000 5,016,000<br />
10 0.60 416.40 1.80 5.11 108 570,240 855,360 1,140,480 1,425,600 1,710,720 1,995,840 2,280,960 2,566,080 2,851,200 5,702,400<br />
10 0.67 464.98 2.01 5.70 108 570,240 855,360 1,140,480 1,425,600 1,710,720 1,995,840 2,280,960 2,566,080 2,851,200 5,702,400<br />
10 0.83 576.02 2.49 7.06 108 570,240 855,360 1,140,480 1,425,600 1,710,720 1,995,840 2,280,960 2,566,080 2,851,200 5,702,400<br />
12 0.93 645.42 2.79 5.50 119 628,320 942,480 1,256,640 1,570,800 1,884,960 2,199,120 2,513,280 2,827,440 3,141,600 6,283,200<br />
12 1.00 694.00 3.00 5.91 119 628,320 942,480 1,256,640 1,570,800 1,884,960 2,199,120 2,513,280 2,827,440 3,141,600 6,283,200<br />
12 1.17 811.98 3.51 6.91 119 628,320 942,480 1,256,640 1,570,800 1,884,960 2,199,120 2,513,280 2,827,440 3,141,600 6,283,200<br />
14 1.33 923.02 3.99 5.77 137 723,360 1,085,040 1,446,720 1,808,400 2,170,080 2,531,760 2,893,440 3,255,120 3,616,800 7,233,600<br />
14 1.50 1041.00 4.50 6.51 137 723,360 1,085,040 1,446,720 1,808,400 2,170,080 2,531,760 2,893,440 3,255,120 3,616,800 7,233,600<br />
14 1.67 1158.98 5.01 7.25 137 723,360 1,085,040 1,446,720 1,808,400 2,170,080 2,531,760 2,893,440 3,255,120 3,616,800 7,233,600<br />
16 1.83 1270.02 5.49 6.08 167 881,760 1,322,640 1,763,520 2,204,400 2,645,280 3,086,160 3,527,040 3,967,920 4,408,800 8,817,600<br />
16 2.00 1388.00 6.00 6.65 167 881,760 1,322,640 1,763,520 2,204,400 2,645,280 3,086,160 3,527,040 3,967,920 4,408,800 8,817,600<br />
16 2.07 1436.58 6.21 6.88 167 881,760 1,322,640 1,763,520 2,204,400 2,645,280 3,086,160 3,527,040 3,967,920 4,408,800 8,817,600<br />
18 2.17 1505.98 6.51 5.70 189 997,920 1,496,880 1,995,840 2,494,800 2,993,760 3,492,720 3,991,680 4,490,640 4,989,600 9,979,200<br />
18 2.33 1617.02 6.99 6.12 189 997,920 1,496,880 1,995,840 2,494,800 2,993,760 3,492,720 3,991,680 4,490,640 4,989,600 9,979,200<br />
18 2.50 1735.00 7.50 6.57 189 997,920 1,496,880 1,995,840 2,494,800 2,993,760 3,492,720 3,991,680 4,490,640 4,989,600 9,979,200<br />
18 2.67 1852.98 8.01 7.01 189 997,920 1,496,880 1,995,840 2,494,800 2,993,760 3,492,720 3,991,680 4,490,640 4,989,600 9,979,200<br />
20 2.83 1964.02 8.49 6.02 214 1,129,920 1,694,880 2,259,840 2,824,800 3,389,760 3,954,720 4,519,680 5,084,640 5,649,600 11,299,200<br />
20 3.00 2082.00 9.00 6.38 214 1,129,920 1,694,880 2,259,840 2,824,800 3,389,760 3,954,720 4,519,680 5,084,640 5,649,600 11,299,200<br />
20 3.17 2199.98 9.51 6.74 214 1,129,920 1,694,880 2,259,840 2,824,800 3,389,760 3,954,720 4,519,680 5,084,640 5,649,600 11,299,200<br />
20 3.33 2311.02 9.99 7.08 214 1,129,920 1,694,880 2,259,840 2,824,800 3,389,760 3,954,720 4,519,680 5,084,640 5,649,600 11,299,200<br />
24 3.50 2429.00 10.50 5.17 263 1,388,640 2,082,960 2,777,280 3,471,600 4,165,920 4,860,240 5,554,560 6,248,880 6,943,200 13,886,400<br />
24 3.67 2546.98 11.01 5.42 263 1,388,640 2,082,960 2,777,280 3,471,600 4,165,920 4,860,240 5,554,560 6,248,880 6,943,200 13,886,400<br />
24 3.83 2658.02 11.49 5.66 263 1,388,640 2,082,960 2,777,280 3,471,600 4,165,920 4,860,240 5,554,560 6,248,880 6,943,200 13,886,400<br />
24 4.00 2776.00 12.00 5.91 263 1,388,640 2,082,960 2,777,280 3,471,600 4,165,920 4,860,240 5,554,560 6,248,880 6,943,200 13,886,400<br />
24 4.17 2893.98 12.51 6.16 263 1,388,640 2,082,960 2,777,280 3,471,600 4,165,920 4,860,240 5,554,560 6,248,880 6,943,200 13,886,400<br />
24 4.33 3005.02 12.99 6.40 263 1,388,640 2,082,960 2,777,280 3,471,600 4,165,920 4,860,240 5,554,560 6,248,880 6,943,200 13,886,400<br />
24 4.50 3123.00 13.50 6.65 263 1,388,640 2,082,960 2,777,280 3,471,600 4,165,920 4,860,240 5,554,560 6,248,880 6,943,200 13,886,400<br />
24 4.67 3240.98 14.01 6.90 263 1,388,640 2,082,960 2,777,280 3,471,600 4,165,920 4,860,240 5,554,560 6,248,880 6,943,200 13,886,400<br />
30 5.33 3699.02 15.99 5.04 324 1,710,720 2,566,080 3,421,440 4,276,800 5,132,160 5,987,520 6,842,880 7,698,240 8,553,600 17,107,200<br />
30 5.67 3934.98 17.01 5.36 324 1,710,720 2,566,080 3,421,440 4,276,800 5,132,160 5,987,520 6,842,880 7,698,240 8,553,600 17,107,200<br />
30 6.00 4164.00 18.00 5.67 324 1,710,720 2,566,080 3,421,440 4,276,800 5,132,160 5,987,520 6,842,880 7,698,240 8,553,600 17,107,200<br />
30 6.33 4393.02 18.99 5.99 324 1,710,720 2,566,080 3,421,440 4,276,800 5,132,160 5,987,520 6,842,880 7,698,240 8,553,600 17,107,200<br />
30 6.67 4628.98 20.01 6.31 324 1,710,720 2,566,080 3,421,440 4,276,800 5,132,160 5,987,520 6,842,880 7,698,240 8,553,600 17,107,200<br />
30 7.00 4858.00 21.00 6.62 324 1,710,720 2,566,080 3,421,440 4,276,800 5,132,160 5,987,520 6,842,880 7,698,240 8,553,600 17,107,200<br />
30 7.33 5087.02 21.99 6.93 324 1,710,720 2,566,080 3,421,440 4,276,800 5,132,160 5,987,520 6,842,880 7,698,240 8,553,600 17,107,200<br />
36 8.00 5552.00 24.00 5.25 403 2,127,840 3,191,760 4,255,680 5,319,600 6,383,520 7,447,440 8,511,360 9,575,280 10,639,200 21,278,400<br />
36 8.33 5781.02 24.99 5.47 403 2,127,840 3,191,760 4,255,680 5,319,600 6,383,520 7,447,440 8,511,360 9,575,280 10,639,200 21,278,400<br />
36 8.67 6016.98 26.01 5.69 403 2,127,840 3,191,760 4,255,680 5,319,600 6,383,520 7,447,440 8,511,360 9,575,280 10,639,200 21,278,400<br />
36 9.00 6246.00 27.00 5.91 403 2,127,840 3,191,760 4,255,680 5,319,600 6,383,520 7,447,440 8,511,360 9,575,280 10,639,200 21,278,400<br />
36 9.33 6475.02 27.99 6.13 403 2,127,840 3,191,760 4,255,680 5,319,600 6,383,520 7,447,440 8,511,360 9,575,280 10,639,200 21,278,400<br />
36 9.67 6710.98 29.01 6.35 403 2,127,840 3,191,760 4,255,680 5,319,600 6,383,520 7,447,440 8,511,360 9,575,280 10,639,200 21,278,400<br />
36 10.00 6940.00 30.00 6.57 403 2,127,840 3,191,760 4,255,680 5,319,600 6,383,520 7,447,440 8,511,360 9,575,280 10,639,200 21,278,400<br />
36 10.33 7169.02 30.99 6.78 403 2,127,840 3,191,760 4,255,680 5,319,600 6,383,520 7,447,440 8,511,360 9,575,280 10,639,200 21,278,400<br />
36 10.50 7287.00 31.50 6.89 403 2,127,840 3,191,760 4,255,680 5,319,600 6,383,520 7,447,440 8,511,360 9,575,280 10,639,200 21,278,400<br />
36 10.67 7404.98 32.01 7.01 403 2,127,840 3,191,760 4,255,680 5,319,600 6,383,520 7,447,440 8,511,360 9,575,280 10,639,200 21,278,400<br />
Pipe Capital Costs_Single_Rural_PF of 3_FINAL.xls, Capital Costs Page 1 of 6 3/30/2007 3:04 PM
Capital PROJECT Cost Curves <strong>for</strong> Reclaimed <strong>Water</strong> Transmission Piping<br />
Rural Capital Cost by Distance - $ <strong>for</strong> 1-10 miles<br />
Annual<br />
Pipe<br />
Average Annual<br />
Velocity at Pipe Unit<br />
Day Flow Average Day Peak Hourly Peak Hourly Project<br />
Diam (in) (mgd) Flow (gpm) Flow (mgd) Flow (fps) Cost ($/ft) 1 1.5 2 2.5 3 3.5 4 4.5 5 10<br />
42 11.33 7863.02 33.99 5.47 499 2,634,720 3,952,080 5,269,440 6,586,800 7,904,160 9,221,520 10,538,880 11,856,240 13,173,600 26,347,200<br />
42 11.67 8098.98 35.01 5.63 499 2,634,720 3,952,080 5,269,440 6,586,800 7,904,160 9,221,520 10,538,880 11,856,240 13,173,600 26,347,200<br />
42 12.00 8328.00 36.00 5.79 499 2,634,720 3,952,080 5,269,440 6,586,800 7,904,160 9,221,520 10,538,880 11,856,240 13,173,600 26,347,200<br />
42 12.33 8557.02 36.99 5.95 499 2,634,720 3,952,080 5,269,440 6,586,800 7,904,160 9,221,520 10,538,880 11,856,240 13,173,600 26,347,200<br />
42 12.67 8792.98 38.01 6.11 499 2,634,720 3,952,080 5,269,440 6,586,800 7,904,160 9,221,520 10,538,880 11,856,240 13,173,600 26,347,200<br />
42 13.00 9022.00 39.00 6.27 499 2,634,720 3,952,080 5,269,440 6,586,800 7,904,160 9,221,520 10,538,880 11,856,240 13,173,600 26,347,200<br />
42 13.33 9251.02 39.99 6.43 499 2,634,720 3,952,080 5,269,440 6,586,800 7,904,160 9,221,520 10,538,880 11,856,240 13,173,600 26,347,200<br />
42 13.67 9486.98 41.01 6.59 499 2,634,720 3,952,080 5,269,440 6,586,800 7,904,160 9,221,520 10,538,880 11,856,240 13,173,600 26,347,200<br />
42 14.00 9716.00 42.00 6.75 499 2,634,720 3,952,080 5,269,440 6,586,800 7,904,160 9,221,520 10,538,880 11,856,240 13,173,600 26,347,200<br />
42 14.67 10180.98 44.01 7.08 499 2,634,720 3,952,080 5,269,440 6,586,800 7,904,160 9,221,520 10,538,880 11,856,240 13,173,600 26,347,200<br />
48 13.67 9486.98 41.01 5.05 635 3,352,800 5,029,200 6,705,600 8,382,000 10,058,400 11,734,800 13,411,200 15,087,600 16,764,000 33,528,000<br />
48 14.00 9716.00 42.00 5.17 635 3,352,800 5,029,200 6,705,600 8,382,000 10,058,400 11,734,800 13,411,200 15,087,600 16,764,000 33,528,000<br />
48 14.33 9945.02 42.99 5.29 635 3,352,800 5,029,200 6,705,600 8,382,000 10,058,400 11,734,800 13,411,200 15,087,600 16,764,000 33,528,000<br />
48 14.67 10180.98 44.01 5.42 635 3,352,800 5,029,200 6,705,600 8,382,000 10,058,400 11,734,800 13,411,200 15,087,600 16,764,000 33,528,000<br />
48 15.00 10410.00 45.00 5.54 635 3,352,800 5,029,200 6,705,600 8,382,000 10,058,400 11,734,800 13,411,200 15,087,600 16,764,000 33,528,000<br />
48 15.33 10639.02 45.99 5.66 635 3,352,800 5,029,200 6,705,600 8,382,000 10,058,400 11,734,800 13,411,200 15,087,600 16,764,000 33,528,000<br />
48 15.67 10874.98 47.01 5.79 635 3,352,800 5,029,200 6,705,600 8,382,000 10,058,400 11,734,800 13,411,200 15,087,600 16,764,000 33,528,000<br />
48 16.00 11104.00 48.00 5.91 635 3,352,800 5,029,200 6,705,600 8,382,000 10,058,400 11,734,800 13,411,200 15,087,600 16,764,000 33,528,000<br />
48 16.33 11333.02 48.99 6.03 635 3,352,800 5,029,200 6,705,600 8,382,000 10,058,400 11,734,800 13,411,200 15,087,600 16,764,000 33,528,000<br />
48 16.67 11568.98 50.01 6.16 635 3,352,800 5,029,200 6,705,600 8,382,000 10,058,400 11,734,800 13,411,200 15,087,600 16,764,000 33,528,000<br />
48 17.33 12027.02 51.99 6.40 635 3,352,800 5,029,200 6,705,600 8,382,000 10,058,400 11,734,800 13,411,200 15,087,600 16,764,000 33,528,000<br />
48 18.00 12492.00 54.00 6.65 635 3,352,800 5,029,200 6,705,600 8,382,000 10,058,400 11,734,800 13,411,200 15,087,600 16,764,000 33,528,000<br />
48 18.33 12721.02 54.99 6.77 635 3,352,800 5,029,200 6,705,600 8,382,000 10,058,400 11,734,800 13,411,200 15,087,600 16,764,000 33,528,000<br />
48 19.00 13186.00 57.00 7.02 635 3,352,800 5,029,200 6,705,600 8,382,000 10,058,400 11,734,800 13,411,200 15,087,600 16,764,000 33,528,000<br />
54 17.33 12027.02 51.99 5.06 743 3,923,040 5,884,560 7,846,080 9,807,600 11,769,120 13,730,640 15,692,160 17,653,680 19,615,200 39,230,400<br />
54 18.00 12492.00 54.00 5.25 743 3,923,040 5,884,560 7,846,080 9,807,600 11,769,120 13,730,640 15,692,160 17,653,680 19,615,200 39,230,400<br />
54 18.67 12956.98 56.01 5.45 743 3,923,040 5,884,560 7,846,080 9,807,600 11,769,120 13,730,640 15,692,160 17,653,680 19,615,200 39,230,400<br />
54 19.33 13415.02 57.99 5.64 743 3,923,040 5,884,560 7,846,080 9,807,600 11,769,120 13,730,640 15,692,160 17,653,680 19,615,200 39,230,400<br />
54 20.00 13880.00 60.00 5.84 743 3,923,040 5,884,560 7,846,080 9,807,600 11,769,120 13,730,640 15,692,160 17,653,680 19,615,200 39,230,400<br />
54 20.67 14344.98 62.01 6.03 743 3,923,040 5,884,560 7,846,080 9,807,600 11,769,120 13,730,640 15,692,160 17,653,680 19,615,200 39,230,400<br />
54 21.33 14803.02 63.99 6.22 743 3,923,040 5,884,560 7,846,080 9,807,600 11,769,120 13,730,640 15,692,160 17,653,680 19,615,200 39,230,400<br />
54 22.00 15268.00 66.00 6.42 743 3,923,040 5,884,560 7,846,080 9,807,600 11,769,120 13,730,640 15,692,160 17,653,680 19,615,200 39,230,400<br />
54 22.67 15732.98 68.01 6.62 743 3,923,040 5,884,560 7,846,080 9,807,600 11,769,120 13,730,640 15,692,160 17,653,680 19,615,200 39,230,400<br />
54 23.33 16191.02 69.99 6.81 743 3,923,040 5,884,560 7,846,080 9,807,600 11,769,120 13,730,640 15,692,160 17,653,680 19,615,200 39,230,400<br />
54 24.00 16656.00 72.00 7.00 743 3,923,040 5,884,560 7,846,080 9,807,600 11,769,120 13,730,640 15,692,160 17,653,680 19,615,200 39,230,400<br />
60 21.17 14691.98 63.51 5.00 846 4,466,880 6,700,320 8,933,760 11,167,200 13,400,640 15,634,080 17,867,520 20,100,960 22,334,400 44,668,800<br />
60 21.67 15038.98 65.01 5.12 846 4,466,880 6,700,320 8,933,760 11,167,200 13,400,640 15,634,080 17,867,520 20,100,960 22,334,400 44,668,800<br />
60 22.33 15497.02 66.99 5.28 846 4,466,880 6,700,320 8,933,760 11,167,200 13,400,640 15,634,080 17,867,520 20,100,960 22,334,400 44,668,800<br />
60 23.00 15962.00 69.00 5.44 846 4,466,880 6,700,320 8,933,760 11,167,200 13,400,640 15,634,080 17,867,520 20,100,960 22,334,400 44,668,800<br />
60 23.67 16426.98 71.01 5.60 846 4,466,880 6,700,320 8,933,760 11,167,200 13,400,640 15,634,080 17,867,520 20,100,960 22,334,400 44,668,800<br />
60 24.33 16885.02 72.99 5.75 846 4,466,880 6,700,320 8,933,760 11,167,200 13,400,640 15,634,080 17,867,520 20,100,960 22,334,400 44,668,800<br />
60 25.00 17350.00 75.00 5.91 846 4,466,880 6,700,320 8,933,760 11,167,200 13,400,640 15,634,080 17,867,520 20,100,960 22,334,400 44,668,800<br />
60 25.67 17814.98 77.01 6.07 846 4,466,880 6,700,320 8,933,760 11,167,200 13,400,640 15,634,080 17,867,520 20,100,960 22,334,400 44,668,800<br />
60 26.33 18273.02 78.99 6.22 846 4,466,880 6,700,320 8,933,760 11,167,200 13,400,640 15,634,080 17,867,520 20,100,960 22,334,400 44,668,800<br />
60 27.00 18738.00 81.00 6.38 846 4,466,880 6,700,320 8,933,760 11,167,200 13,400,640 15,634,080 17,867,520 20,100,960 22,334,400 44,668,800<br />
60 27.67 19202.98 83.01 6.54 846 4,466,880 6,700,320 8,933,760 11,167,200 13,400,640 15,634,080 17,867,520 20,100,960 22,334,400 44,668,800<br />
60 28.33 19661.02 84.99 6.70 846 4,466,880 6,700,320 8,933,760 11,167,200 13,400,640 15,634,080 17,867,520 20,100,960 22,334,400 44,668,800<br />
60 29.00 20126.00 87.00 6.86 846 4,466,880 6,700,320 8,933,760 11,167,200 13,400,640 15,634,080 17,867,520 20,100,960 22,334,400 44,668,800<br />
60 30.00 20820.00 90.00 7.09 846 4,466,880 6,700,320 8,933,760 11,167,200 13,400,640 15,634,080 17,867,520 20,100,960 22,334,400 44,668,800<br />
Pipe Capital Costs_Single_Rural_PF of 3_FINAL.xls, Capital Costs Page 2 of 6 3/30/2007 3:04 PM
Capital PROJECT Cost Curves <strong>for</strong> Reclaimed <strong>Water</strong> Transmission Piping<br />
Rural - Annualized Capital Cost, Sep 2006<br />
Annual<br />
Pipe<br />
Average Annual<br />
Velocity at Pipe Unit<br />
Day Flow Average Day Peak Hourly Peak Hourly Project<br />
Diam (in) (mgd) Flow (gpm) Flow (mgd) Flow (fps) Cost ($/ft)<br />
1 1.5 2 2.5 3 3.5 4 4.5 5 10<br />
4 0.10 69.40 0.30 5.32 79 $32,196 $48,294 $64,391 $80,489 $96,587 $112,685 $128,783 $144,881 $160,979 $321,957<br />
6 0.20 138.80 0.60 4.73 86 $35,048 $52,573 $70,097 $87,621 $105,145 $122,670 $140,194 $157,718 $175,242 $350,485<br />
6 0.27 187.38 0.81 6.38 86 $35,048 $52,573 $70,097 $87,621 $105,145 $122,670 $140,194 $157,718 $175,242 $350,485<br />
8 0.40 277.60 1.20 5.32 95 $38,716 $58,075 $77,433 $96,791 $116,149 $135,507 $154,865 $174,224 $193,582 $387,164<br />
8 0.47 326.18 1.41 6.25 95 $38,716 $58,075 $77,433 $96,791 $116,149 $135,507 $154,865 $174,224 $193,582 $387,164<br />
8 0.53 367.82 1.59 7.05 95 $38,716 $58,075 $77,433 $96,791 $116,149 $135,507 $154,865 $174,224 $193,582 $387,164<br />
10 0.60 416.40 1.80 5.11 108 $44,014 $66,022 $88,029 $110,036 $132,043 $154,050 $176,058 $198,065 $220,072 $440,144<br />
10 0.67 464.98 2.01 5.70 108 $44,014 $66,022 $88,029 $110,036 $132,043 $154,050 $176,058 $198,065 $220,072 $440,144<br />
10 0.83 576.02 2.49 7.06 108 $44,014 $66,022 $88,029 $110,036 $132,043 $154,050 $176,058 $198,065 $220,072 $440,144<br />
12 0.93 645.42 2.79 5.50 119 $48,497 $72,746 $96,995 $121,243 $145,492 $169,741 $193,989 $218,238 $242,487 $484,973<br />
12 1.00 694.00 3.00 5.91 119 $48,497 $72,746 $96,995 $121,243 $145,492 $169,741 $193,989 $218,238 $242,487 $484,973<br />
12 1.17 811.98 3.51 6.91 119 $48,497 $72,746 $96,995 $121,243 $145,492 $169,741 $193,989 $218,238 $242,487 $484,973<br />
14 1.33 923.02 3.99 5.77 137 $55,833 $83,750 $111,666 $139,583 $167,499 $195,416 $223,332 $251,249 $279,165 $558,331<br />
14 1.50 1041.00 4.50 6.51 137 $55,833 $83,750 $111,666 $139,583 $167,499 $195,416 $223,332 $251,249 $279,165 $558,331<br />
14 1.67 1158.98 5.01 7.25 137 $55,833 $83,750 $111,666 $139,583 $167,499 $195,416 $223,332 $251,249 $279,165 $558,331<br />
16 1.83 1270.02 5.49 6.08 167 $68,059 $102,089 $136,119 $170,148 $204,178 $238,208 $272,237 $306,267 $340,296 $680,593<br />
16 2.00 1388.00 6.00 6.65 167 $68,059 $102,089 $136,119 $170,148 $204,178 $238,208 $272,237 $306,267 $340,296 $680,593<br />
16 2.07 1436.58 6.21 6.88 167 $68,059 $102,089 $136,119 $170,148 $204,178 $238,208 $272,237 $306,267 $340,296 $680,593<br />
18 2.17 1505.98 6.51 5.70 189 $77,025 $115,538 $154,050 $192,563 $231,076 $269,588 $308,101 $346,613 $385,126 $770,252<br />
18 2.33 1617.02 6.99 6.12 189 $77,025 $115,538 $154,050 $192,563 $231,076 $269,588 $308,101 $346,613 $385,126 $770,252<br />
18 2.50 1735.00 7.50 6.57 189 $77,025 $115,538 $154,050 $192,563 $231,076 $269,588 $308,101 $346,613 $385,126 $770,252<br />
18 2.67 1852.98 8.01 7.01 189 $77,025 $115,538 $154,050 $192,563 $231,076 $269,588 $308,101 $346,613 $385,126 $770,252<br />
20 2.83 1964.02 8.49 6.02 214 $87,214 $130,821 $174,427 $218,034 $261,641 $305,248 $348,855 $392,462 $436,068 $872,137<br />
20 3.00 2082.00 9.00 6.38 214 $87,214 $130,821 $174,427 $218,034 $261,641 $305,248 $348,855 $392,462 $436,068 $872,137<br />
20 3.17 2199.98 9.51 6.74 214 $87,214 $130,821 $174,427 $218,034 $261,641 $305,248 $348,855 $392,462 $436,068 $872,137<br />
20 3.33 2311.02 9.99 7.08 214 $87,214 $130,821 $174,427 $218,034 $261,641 $305,248 $348,855 $392,462 $436,068 $872,137<br />
24 3.50 2429.00 10.50 5.17 263 $107,183 $160,775 $214,366 $267,958 $321,550 $375,141 $428,733 $482,324 $535,916 $1,071,832<br />
24 3.67 2546.98 11.01 5.42 263 $107,183 $160,775 $214,366 $267,958 $321,550 $375,141 $428,733 $482,324 $535,916 $1,071,832<br />
24 3.83 2658.02 11.49 5.66 263 $107,183 $160,775 $214,366 $267,958 $321,550 $375,141 $428,733 $482,324 $535,916 $1,071,832<br />
24 4.00 2776.00 12.00 5.91 263 $107,183 $160,775 $214,366 $267,958 $321,550 $375,141 $428,733 $482,324 $535,916 $1,071,832<br />
24 4.17 2893.98 12.51 6.16 263 $107,183 $160,775 $214,366 $267,958 $321,550 $375,141 $428,733 $482,324 $535,916 $1,071,832<br />
24 4.33 3005.02 12.99 6.40 263 $107,183 $160,775 $214,366 $267,958 $321,550 $375,141 $428,733 $482,324 $535,916 $1,071,832<br />
24 4.50 3123.00 13.50 6.65 263 $107,183 $160,775 $214,366 $267,958 $321,550 $375,141 $428,733 $482,324 $535,916 $1,071,832<br />
24 4.67 3240.98 14.01 6.90 263 $107,183 $160,775 $214,366 $267,958 $321,550 $375,141 $428,733 $482,324 $535,916 $1,071,832<br />
30 5.33 3699.02 15.99 5.04 324 $132,043 $198,065 $264,086 $330,108 $396,129 $462,151 $528,173 $594,194 $660,216 $1,320,432<br />
30 5.67 3934.98 17.01 5.36 324 $132,043 $198,065 $264,086 $330,108 $396,129 $462,151 $528,173 $594,194 $660,216 $1,320,432<br />
30 6.00 4164.00 18.00 5.67 324 $132,043 $198,065 $264,086 $330,108 $396,129 $462,151 $528,173 $594,194 $660,216 $1,320,432<br />
30 6.33 4393.02 18.99 5.99 324 $132,043 $198,065 $264,086 $330,108 $396,129 $462,151 $528,173 $594,194 $660,216 $1,320,432<br />
30 6.67 4628.98 20.01 6.31 324 $132,043 $198,065 $264,086 $330,108 $396,129 $462,151 $528,173 $594,194 $660,216 $1,320,432<br />
30 7.00 4858.00 21.00 6.62 324 $132,043 $198,065 $264,086 $330,108 $396,129 $462,151 $528,173 $594,194 $660,216 $1,320,432<br />
30 7.33 5087.02 21.99 6.93 324 $132,043 $198,065 $264,086 $330,108 $396,129 $462,151 $528,173 $594,194 $660,216 $1,320,432<br />
36 8.00 5552.00 24.00 5.25 403 $164,239 $246,358 $328,478 $410,597 $492,717 $574,836 $656,956 $739,075 $821,194 $1,642,389<br />
36 8.33 5781.02 24.99 5.47 403 $164,239 $246,358 $328,478 $410,597 $492,717 $574,836 $656,956 $739,075 $821,194 $1,642,389<br />
36 8.67 6016.98 26.01 5.69 403 $164,239 $246,358 $328,478 $410,597 $492,717 $574,836 $656,956 $739,075 $821,194 $1,642,389<br />
36 9.00 6246.00 27.00 5.91 403 $164,239 $246,358 $328,478 $410,597 $492,717 $574,836 $656,956 $739,075 $821,194 $1,642,389<br />
36 9.33 6475.02 27.99 6.13 403 $164,239 $246,358 $328,478 $410,597 $492,717 $574,836 $656,956 $739,075 $821,194 $1,642,389<br />
36 9.67 6710.98 29.01 6.35 403 $164,239 $246,358 $328,478 $410,597 $492,717 $574,836 $656,956 $739,075 $821,194 $1,642,389<br />
36 10.00 6940.00 30.00 6.57 403 $164,239 $246,358 $328,478 $410,597 $492,717 $574,836 $656,956 $739,075 $821,194 $1,642,389<br />
36 10.33 7169.02 30.99 6.78 403 $164,239 $246,358 $328,478 $410,597 $492,717 $574,836 $656,956 $739,075 $821,194 $1,642,389<br />
36 10.50 7287.00 31.50 6.89 403 $164,239 $246,358 $328,478 $410,597 $492,717 $574,836 $656,956 $739,075 $821,194 $1,642,389<br />
36 10.67 7404.98 32.01 7.01 403 $164,239 $246,358 $328,478 $410,597 $492,717 $574,836 $656,956 $739,075 $821,194 $1,642,389<br />
Pipe Capital Costs_Single_Rural_PF of 3_FINAL.xls, Capital Costs Page 3 of 6 3/30/2007 3:04 PM
Capital PROJECT Cost Curves <strong>for</strong> Reclaimed <strong>Water</strong> Transmission Piping<br />
Rural - Annualized Capital Cost, Sep 2006<br />
Annual<br />
Pipe<br />
Average Annual<br />
Velocity at Pipe Unit<br />
Day Flow Average Day Peak Hourly Peak Hourly Project<br />
Diam (in) (mgd) Flow (gpm) Flow (mgd) Flow (fps) Cost ($/ft)<br />
1 1.5 2 2.5 3 3.5 4 4.5 5 10<br />
42 11.33 7863.02 33.99 5.47 499 $203,363 $305,044 $406,726 $508,407 $610,088 $711,770 $813,451 $915,133 $1,016,814 $2,033,628<br />
42 11.67 8098.98 35.01 5.63 499 $203,363 $305,044 $406,726 $508,407 $610,088 $711,770 $813,451 $915,133 $1,016,814 $2,033,628<br />
42 12.00 8328.00 36.00 5.79 499 $203,363 $305,044 $406,726 $508,407 $610,088 $711,770 $813,451 $915,133 $1,016,814 $2,033,628<br />
42 12.33 8557.02 36.99 5.95 499 $203,363 $305,044 $406,726 $508,407 $610,088 $711,770 $813,451 $915,133 $1,016,814 $2,033,628<br />
42 12.67 8792.98 38.01 6.11 499 $203,363 $305,044 $406,726 $508,407 $610,088 $711,770 $813,451 $915,133 $1,016,814 $2,033,628<br />
42 13.00 9022.00 39.00 6.27 499 $203,363 $305,044 $406,726 $508,407 $610,088 $711,770 $813,451 $915,133 $1,016,814 $2,033,628<br />
42 13.33 9251.02 39.99 6.43 499 $203,363 $305,044 $406,726 $508,407 $610,088 $711,770 $813,451 $915,133 $1,016,814 $2,033,628<br />
42 13.67 9486.98 41.01 6.59 499 $203,363 $305,044 $406,726 $508,407 $610,088 $711,770 $813,451 $915,133 $1,016,814 $2,033,628<br />
42 14.00 9716.00 42.00 6.75 499 $203,363 $305,044 $406,726 $508,407 $610,088 $711,770 $813,451 $915,133 $1,016,814 $2,033,628<br />
42 14.67 10180.98 44.01 7.08 499 $203,363 $305,044 $406,726 $508,407 $610,088 $711,770 $813,451 $915,133 $1,016,814 $2,033,628<br />
48 13.67 9486.98 41.01 5.05 635 $258,788 $388,182 $517,577 $646,971 $776,365 $905,759 $1,035,153 $1,164,547 $1,293,942 $2,587,883<br />
48 14.00 9716.00 42.00 5.17 635 $258,788 $388,182 $517,577 $646,971 $776,365 $905,759 $1,035,153 $1,164,547 $1,293,942 $2,587,883<br />
48 14.33 9945.02 42.99 5.29 635 $258,788 $388,182 $517,577 $646,971 $776,365 $905,759 $1,035,153 $1,164,547 $1,293,942 $2,587,883<br />
48 14.67 10180.98 44.01 5.42 635 $258,788 $388,182 $517,577 $646,971 $776,365 $905,759 $1,035,153 $1,164,547 $1,293,942 $2,587,883<br />
48 15.00 10410.00 45.00 5.54 635 $258,788 $388,182 $517,577 $646,971 $776,365 $905,759 $1,035,153 $1,164,547 $1,293,942 $2,587,883<br />
48 15.33 10639.02 45.99 5.66 635 $258,788 $388,182 $517,577 $646,971 $776,365 $905,759 $1,035,153 $1,164,547 $1,293,942 $2,587,883<br />
48 15.67 10874.98 47.01 5.79 635 $258,788 $388,182 $517,577 $646,971 $776,365 $905,759 $1,035,153 $1,164,547 $1,293,942 $2,587,883<br />
48 16.00 11104.00 48.00 5.91 635 $258,788 $388,182 $517,577 $646,971 $776,365 $905,759 $1,035,153 $1,164,547 $1,293,942 $2,587,883<br />
48 16.33 11333.02 48.99 6.03 635 $258,788 $388,182 $517,577 $646,971 $776,365 $905,759 $1,035,153 $1,164,547 $1,293,942 $2,587,883<br />
48 16.67 11568.98 50.01 6.16 635 $258,788 $388,182 $517,577 $646,971 $776,365 $905,759 $1,035,153 $1,164,547 $1,293,942 $2,587,883<br />
48 17.33 12027.02 51.99 6.40 635 $258,788 $388,182 $517,577 $646,971 $776,365 $905,759 $1,035,153 $1,164,547 $1,293,942 $2,587,883<br />
48 18.00 12492.00 54.00 6.65 635 $258,788 $388,182 $517,577 $646,971 $776,365 $905,759 $1,035,153 $1,164,547 $1,293,942 $2,587,883<br />
48 18.33 12721.02 54.99 6.77 635 $258,788 $388,182 $517,577 $646,971 $776,365 $905,759 $1,035,153 $1,164,547 $1,293,942 $2,587,883<br />
48 19.00 13186.00 57.00 7.02 635 $258,788 $388,182 $517,577 $646,971 $776,365 $905,759 $1,035,153 $1,164,547 $1,293,942 $2,587,883<br />
54 17.33 12027.02 51.99 5.06 743 $302,803 $454,204 $605,605 $757,007 $908,408 $1,059,809 $1,211,211 $1,362,612 $1,514,013 $3,028,027<br />
54 18.00 12492.00 54.00 5.25 743 $302,803 $454,204 $605,605 $757,007 $908,408 $1,059,809 $1,211,211 $1,362,612 $1,514,013 $3,028,027<br />
54 18.67 12956.98 56.01 5.45 743 $302,803 $454,204 $605,605 $757,007 $908,408 $1,059,809 $1,211,211 $1,362,612 $1,514,013 $3,028,027<br />
54 19.33 13415.02 57.99 5.64 743 $302,803 $454,204 $605,605 $757,007 $908,408 $1,059,809 $1,211,211 $1,362,612 $1,514,013 $3,028,027<br />
54 20.00 13880.00 60.00 5.84 743 $302,803 $454,204 $605,605 $757,007 $908,408 $1,059,809 $1,211,211 $1,362,612 $1,514,013 $3,028,027<br />
54 20.67 14344.98 62.01 6.03 743 $302,803 $454,204 $605,605 $757,007 $908,408 $1,059,809 $1,211,211 $1,362,612 $1,514,013 $3,028,027<br />
54 21.33 14803.02 63.99 6.22 743 $302,803 $454,204 $605,605 $757,007 $908,408 $1,059,809 $1,211,211 $1,362,612 $1,514,013 $3,028,027<br />
54 22.00 15268.00 66.00 6.42 743 $302,803 $454,204 $605,605 $757,007 $908,408 $1,059,809 $1,211,211 $1,362,612 $1,514,013 $3,028,027<br />
54 22.67 15732.98 68.01 6.62 743 $302,803 $454,204 $605,605 $757,007 $908,408 $1,059,809 $1,211,211 $1,362,612 $1,514,013 $3,028,027<br />
54 23.33 16191.02 69.99 6.81 743 $302,803 $454,204 $605,605 $757,007 $908,408 $1,059,809 $1,211,211 $1,362,612 $1,514,013 $3,028,027<br />
54 24.00 16656.00 72.00 7.00 743 $302,803 $454,204 $605,605 $757,007 $908,408 $1,059,809 $1,211,211 $1,362,612 $1,514,013 $3,028,027<br />
60 21.17 14691.98 63.51 5.00 846 $344,779 $517,169 $689,559 $861,948 $1,034,338 $1,206,728 $1,379,118 $1,551,507 $1,723,897 $3,447,794<br />
60 21.67 15038.98 65.01 5.12 846 $344,779 $517,169 $689,559 $861,948 $1,034,338 $1,206,728 $1,379,118 $1,551,507 $1,723,897 $3,447,794<br />
60 22.33 15497.02 66.99 5.28 846 $344,779 $517,169 $689,559 $861,948 $1,034,338 $1,206,728 $1,379,118 $1,551,507 $1,723,897 $3,447,794<br />
60 23.00 15962.00 69.00 5.44 846 $344,779 $517,169 $689,559 $861,948 $1,034,338 $1,206,728 $1,379,118 $1,551,507 $1,723,897 $3,447,794<br />
60 23.67 16426.98 71.01 5.60 846 $344,779 $517,169 $689,559 $861,948 $1,034,338 $1,206,728 $1,379,118 $1,551,507 $1,723,897 $3,447,794<br />
60 24.33 16885.02 72.99 5.75 846 $344,779 $517,169 $689,559 $861,948 $1,034,338 $1,206,728 $1,379,118 $1,551,507 $1,723,897 $3,447,794<br />
60 25.00 17350.00 75.00 5.91 846 $344,779 $517,169 $689,559 $861,948 $1,034,338 $1,206,728 $1,379,118 $1,551,507 $1,723,897 $3,447,794<br />
60 25.67 17814.98 77.01 6.07 846 $344,779 $517,169 $689,559 $861,948 $1,034,338 $1,206,728 $1,379,118 $1,551,507 $1,723,897 $3,447,794<br />
60 26.33 18273.02 78.99 6.22 846 $344,779 $517,169 $689,559 $861,948 $1,034,338 $1,206,728 $1,379,118 $1,551,507 $1,723,897 $3,447,794<br />
60 27.00 18738.00 81.00 6.38 846 $344,779 $517,169 $689,559 $861,948 $1,034,338 $1,206,728 $1,379,118 $1,551,507 $1,723,897 $3,447,794<br />
60 27.67 19202.98 83.01 6.54 846 $344,779 $517,169 $689,559 $861,948 $1,034,338 $1,206,728 $1,379,118 $1,551,507 $1,723,897 $3,447,794<br />
60 28.33 19661.02 84.99 6.70 846 $344,779 $517,169 $689,559 $861,948 $1,034,338 $1,206,728 $1,379,118 $1,551,507 $1,723,897 $3,447,794<br />
60 29.00 20126.00 87.00 6.86 846 $344,779 $517,169 $689,559 $861,948 $1,034,338 $1,206,728 $1,379,118 $1,551,507 $1,723,897 $3,447,794<br />
60 30.00 20820.00 90.00 7.09 846 $344,779 $517,169 $689,559 $861,948 $1,034,338 $1,206,728 $1,379,118 $1,551,507 $1,723,897 $3,447,794<br />
Pipe Capital Costs_Single_Rural_PF of 3_FINAL.xls, Capital Costs Page 4 of 6 3/30/2007 3:04 PM
Annual<br />
Pipe<br />
Average Annual<br />
Velocity at Pipe Unit<br />
Day Flow Average Day Peak Hourly Peak Hourly Project<br />
Diam (in) (mgd) Flow (gpm) Flow (mgd) Flow (fps) Cost ($/ft)<br />
4 0.10 69.40 0.30 5.32 79<br />
6 0.20 138.80 0.60 4.73 86<br />
6 0.27 187.38 0.81 6.38 86<br />
8 0.40 277.60 1.20 5.32 95<br />
8 0.47 326.18 1.41 6.25 95<br />
8 0.53 367.82 1.59 7.05 95<br />
10 0.60 416.40 1.80 5.11 108<br />
10 0.67 464.98 2.01 5.70 108<br />
10 0.83 576.02 2.49 7.06 108<br />
12 0.93 645.42 2.79 5.50 119<br />
12 1.00 694.00 3.00 5.91 119<br />
12 1.17 811.98 3.51 6.91 119<br />
14 1.33 923.02 3.99 5.77 137<br />
14 1.50 1041.00 4.50 6.51 137<br />
14 1.67 1158.98 5.01 7.25 137<br />
16 1.83 1270.02 5.49 6.08 167<br />
16 2.00 1388.00 6.00 6.65 167<br />
16 2.07 1436.58 6.21 6.88 167<br />
18 2.17 1505.98 6.51 5.70 189<br />
18 2.33 1617.02 6.99 6.12 189<br />
18 2.50 1735.00 7.50 6.57 189<br />
18 2.67 1852.98 8.01 7.01 189<br />
20 2.83 1964.02 8.49 6.02 214<br />
20 3.00 2082.00 9.00 6.38 214<br />
20 3.17 2199.98 9.51 6.74 214<br />
20 3.33 2311.02 9.99 7.08 214<br />
24 3.50 2429.00 10.50 5.17 263<br />
24 3.67 2546.98 11.01 5.42 263<br />
24 3.83 2658.02 11.49 5.66 263<br />
24 4.00 2776.00 12.00 5.91 263<br />
24 4.17 2893.98 12.51 6.16 263<br />
24 4.33 3005.02 12.99 6.40 263<br />
24 4.50 3123.00 13.50 6.65 263<br />
24 4.67 3240.98 14.01 6.90 263<br />
30 5.33 3699.02 15.99 5.04 324<br />
30 5.67 3934.98 17.01 5.36 324<br />
30 6.00 4164.00 18.00 5.67 324<br />
30 6.33 4393.02 18.99 5.99 324<br />
30 6.67 4628.98 20.01 6.31 324<br />
30 7.00 4858.00 21.00 6.62 324<br />
30 7.33 5087.02 21.99 6.93 324<br />
36 8.00 5552.00 24.00 5.25 403<br />
36 8.33 5781.02 24.99 5.47 403<br />
36 8.67 6016.98 26.01 5.69 403<br />
36 9.00 6246.00 27.00 5.91 403<br />
36 9.33 6475.02 27.99 6.13 403<br />
36 9.67 6710.98 29.01 6.35 403<br />
36 10.00 6940.00 30.00 6.57 403<br />
36 10.33 7169.02 30.99 6.78 403<br />
36 10.50 7287.00 31.50 6.89 403<br />
36 10.67 7404.98 32.01 7.01 403<br />
Capital PROJECT Cost Curves <strong>for</strong> Reclaimed <strong>Water</strong> Transmission Piping<br />
Rural Capital Cost - Cost per 1000 gallons<br />
1 1.5 2 2.5 3 3.5 4 4.5 5 10<br />
$0.88 $1.32 $1.76 $2.21 $2.65 $3.09 $3.53 $3.97 $4.41 $8.82<br />
$0.48 $0.72 $0.96 $1.20 $1.44 $1.68 $1.92 $2.16 $2.40 $4.80<br />
$0.36 $0.53 $0.71 $0.89 $1.07 $1.24 $1.42 $1.60 $1.78 $3.56<br />
$0.27 $0.40 $0.53 $0.66 $0.80 $0.93 $1.06 $1.19 $1.33 $2.65<br />
$0.23 $0.34 $0.45 $0.56 $0.68 $0.79 $0.90 $1.02 $1.13 $2.26<br />
$0.20 $0.30 $0.40 $0.50 $0.60 $0.70 $0.80 $0.90 $1.00 $2.00<br />
$0.20 $0.30 $0.40 $0.50 $0.60 $0.70 $0.80 $0.90 $1.00 $2.01<br />
$0.18 $0.27 $0.36 $0.45 $0.54 $0.63 $0.72 $0.81 $0.90 $1.80<br />
$0.15 $0.22 $0.29 $0.36 $0.44 $0.51 $0.58 $0.65 $0.73 $1.45<br />
$0.14 $0.21 $0.29 $0.36 $0.43 $0.50 $0.57 $0.64 $0.71 $1.43<br />
$0.13 $0.20 $0.27 $0.33 $0.40 $0.47 $0.53 $0.60 $0.66 $1.33<br />
$0.11 $0.17 $0.23 $0.28 $0.34 $0.40 $0.45 $0.51 $0.57 $1.14<br />
$0.12 $0.17 $0.23 $0.29 $0.35 $0.40 $0.46 $0.52 $0.58 $1.15<br />
$0.10 $0.15 $0.20 $0.25 $0.31 $0.36 $0.41 $0.46 $0.51 $1.02<br />
$0.09 $0.14 $0.18 $0.23 $0.27 $0.32 $0.37 $0.41 $0.46 $0.92<br />
$0.10 $0.15 $0.20 $0.25 $0.31 $0.36 $0.41 $0.46 $0.51 $1.02<br />
$0.09 $0.14 $0.19 $0.23 $0.28 $0.33 $0.37 $0.42 $0.47 $0.93<br />
$0.09 $0.14 $0.18 $0.23 $0.27 $0.32 $0.36 $0.41 $0.45 $0.90<br />
$0.10 $0.15 $0.19 $0.24 $0.29 $0.34 $0.39 $0.44 $0.49 $0.97<br />
$0.09 $0.14 $0.18 $0.23 $0.27 $0.32 $0.36 $0.41 $0.45 $0.91<br />
$0.08 $0.13 $0.17 $0.21 $0.25 $0.30 $0.34 $0.38 $0.42 $0.84<br />
$0.08 $0.12 $0.16 $0.20 $0.24 $0.28 $0.32 $0.36 $0.40 $0.79<br />
$0.08 $0.13 $0.17 $0.21 $0.25 $0.30 $0.34 $0.38 $0.42 $0.84<br />
$0.08 $0.12 $0.16 $0.20 $0.24 $0.28 $0.32 $0.36 $0.40 $0.80<br />
$0.08 $0.11 $0.15 $0.19 $0.23 $0.26 $0.30 $0.34 $0.38 $0.75<br />
$0.07 $0.11 $0.14 $0.18 $0.22 $0.25 $0.29 $0.32 $0.36 $0.72<br />
$0.08 $0.13 $0.17 $0.21 $0.25 $0.29 $0.34 $0.38 $0.42 $0.84<br />
$0.08 $0.12 $0.16 $0.20 $0.24 $0.28 $0.32 $0.36 $0.40 $0.80<br />
$0.08 $0.12 $0.15 $0.19 $0.23 $0.27 $0.31 $0.35 $0.38 $0.77<br />
$0.07 $0.11 $0.15 $0.18 $0.22 $0.26 $0.29 $0.33 $0.37 $0.73<br />
$0.07 $0.11 $0.14 $0.18 $0.21 $0.25 $0.28 $0.32 $0.35 $0.70<br />
$0.07 $0.10 $0.14 $0.17 $0.20 $0.24 $0.27 $0.31 $0.34 $0.68<br />
$0.07 $0.10 $0.13 $0.16 $0.20 $0.23 $0.26 $0.29 $0.33 $0.65<br />
$0.06 $0.09 $0.13 $0.16 $0.19 $0.22 $0.25 $0.28 $0.31 $0.63<br />
$0.07 $0.10 $0.14 $0.17 $0.20 $0.24 $0.27 $0.31 $0.34 $0.68<br />
$0.06 $0.10 $0.13 $0.16 $0.19 $0.22 $0.26 $0.29 $0.32 $0.64<br />
$0.06 $0.09 $0.12 $0.15 $0.18 $0.21 $0.24 $0.27 $0.30 $0.60<br />
$0.06 $0.09 $0.11 $0.14 $0.17 $0.20 $0.23 $0.26 $0.29 $0.57<br />
$0.05 $0.08 $0.11 $0.14 $0.16 $0.19 $0.22 $0.24 $0.27 $0.54<br />
$0.05 $0.08 $0.10 $0.13 $0.16 $0.18 $0.21 $0.23 $0.26 $0.52<br />
$0.05 $0.07 $0.10 $0.12 $0.15 $0.17 $0.20 $0.22 $0.25 $0.49<br />
$0.06 $0.08 $0.11 $0.14 $0.17 $0.20 $0.22 $0.25 $0.28 $0.56<br />
$0.05 $0.08 $0.11 $0.14 $0.16 $0.19 $0.22 $0.24 $0.27 $0.54<br />
$0.05 $0.08 $0.10 $0.13 $0.16 $0.18 $0.21 $0.23 $0.26 $0.52<br />
$0.05 $0.07 $0.10 $0.12 $0.15 $0.17 $0.20 $0.22 $0.25 $0.50<br />
$0.05 $0.07 $0.10 $0.12 $0.14 $0.17 $0.19 $0.22 $0.24 $0.48<br />
$0.05 $0.07 $0.09 $0.12 $0.14 $0.16 $0.19 $0.21 $0.23 $0.47<br />
$0.04 $0.07 $0.09 $0.11 $0.13 $0.16 $0.18 $0.20 $0.22 $0.45<br />
$0.04 $0.07 $0.09 $0.11 $0.13 $0.15 $0.17 $0.20 $0.22 $0.44<br />
$0.04 $0.06 $0.09 $0.11 $0.13 $0.15 $0.17 $0.19 $0.21 $0.43<br />
$0.04 $0.06 $0.08 $0.11 $0.13 $0.15 $0.17 $0.19 $0.21 $0.42<br />
Pipe Capital Costs_Single_Rural_PF of 3_FINAL.xls, Capital Costs Page 5 of 6 3/30/2007 3:04 PM
Annual<br />
Pipe<br />
Average Annual<br />
Velocity at Pipe Unit<br />
Day Flow Average Day Peak Hourly Peak Hourly Project<br />
Diam (in) (mgd) Flow (gpm) Flow (mgd) Flow (fps) Cost ($/ft)<br />
42 11.33 7863.02 33.99 5.47 499<br />
42 11.67 8098.98 35.01 5.63 499<br />
42 12.00 8328.00 36.00 5.79 499<br />
42 12.33 8557.02 36.99 5.95 499<br />
42 12.67 8792.98 38.01 6.11 499<br />
42 13.00 9022.00 39.00 6.27 499<br />
42 13.33 9251.02 39.99 6.43 499<br />
42 13.67 9486.98 41.01 6.59 499<br />
42 14.00 9716.00 42.00 6.75 499<br />
42 14.67 10180.98 44.01 7.08 499<br />
48 13.67 9486.98 41.01 5.05 635<br />
48 14.00 9716.00 42.00 5.17 635<br />
48 14.33 9945.02 42.99 5.29 635<br />
48 14.67 10180.98 44.01 5.42 635<br />
48 15.00 10410.00 45.00 5.54 635<br />
48 15.33 10639.02 45.99 5.66 635<br />
48 15.67 10874.98 47.01 5.79 635<br />
48 16.00 11104.00 48.00 5.91 635<br />
48 16.33 11333.02 48.99 6.03 635<br />
48 16.67 11568.98 50.01 6.16 635<br />
48 17.33 12027.02 51.99 6.40 635<br />
48 18.00 12492.00 54.00 6.65 635<br />
48 18.33 12721.02 54.99 6.77 635<br />
48 19.00 13186.00 57.00 7.02 635<br />
54 17.33 12027.02 51.99 5.06 743<br />
54 18.00 12492.00 54.00 5.25 743<br />
54 18.67 12956.98 56.01 5.45 743<br />
54 19.33 13415.02 57.99 5.64 743<br />
54 20.00 13880.00 60.00 5.84 743<br />
54 20.67 14344.98 62.01 6.03 743<br />
54 21.33 14803.02 63.99 6.22 743<br />
54 22.00 15268.00 66.00 6.42 743<br />
54 22.67 15732.98 68.01 6.62 743<br />
54 23.33 16191.02 69.99 6.81 743<br />
54 24.00 16656.00 72.00 7.00 743<br />
60 21.17 14691.98 63.51 5.00 846<br />
60 21.67 15038.98 65.01 5.12 846<br />
60 22.33 15497.02 66.99 5.28 846<br />
60 23.00 15962.00 69.00 5.44 846<br />
60 23.67 16426.98 71.01 5.60 846<br />
60 24.33 16885.02 72.99 5.75 846<br />
60 25.00 17350.00 75.00 5.91 846<br />
60 25.67 17814.98 77.01 6.07 846<br />
60 26.33 18273.02 78.99 6.22 846<br />
60 27.00 18738.00 81.00 6.38 846<br />
60 27.67 19202.98 83.01 6.54 846<br />
60 28.33 19661.02 84.99 6.70 846<br />
60 29.00 20126.00 87.00 6.86 846<br />
60 30.00 20820.00 90.00 7.09 846<br />
Capital PROJECT Cost Curves <strong>for</strong> Reclaimed <strong>Water</strong> Transmission Piping<br />
Rural Capital Cost - Cost per 1000 gallons<br />
1 1.5 2 2.5 3 3.5 4 4.5 5 10<br />
$0.05 $0.07 $0.10 $0.12 $0.15 $0.17 $0.20 $0.22 $0.25 $0.49<br />
$0.05 $0.07 $0.10 $0.12 $0.14 $0.17 $0.19 $0.21 $0.24 $0.48<br />
$0.05 $0.07 $0.09 $0.12 $0.14 $0.16 $0.19 $0.21 $0.23 $0.46<br />
$0.05 $0.07 $0.09 $0.11 $0.14 $0.16 $0.18 $0.20 $0.23 $0.45<br />
$0.04 $0.07 $0.09 $0.11 $0.13 $0.15 $0.18 $0.20 $0.22 $0.44<br />
$0.04 $0.06 $0.09 $0.11 $0.13 $0.15 $0.17 $0.19 $0.21 $0.43<br />
$0.04 $0.06 $0.08 $0.10 $0.13 $0.15 $0.17 $0.19 $0.21 $0.42<br />
$0.04 $0.06 $0.08 $0.10 $0.12 $0.14 $0.16 $0.18 $0.20 $0.41<br />
$0.04 $0.06 $0.08 $0.10 $0.12 $0.14 $0.16 $0.18 $0.20 $0.40<br />
$0.04 $0.06 $0.08 $0.09 $0.11 $0.13 $0.15 $0.17 $0.19 $0.38<br />
$0.05 $0.08 $0.10 $0.13 $0.16 $0.18 $0.21 $0.23 $0.26 $0.52<br />
$0.05 $0.08 $0.10 $0.13 $0.15 $0.18 $0.20 $0.23 $0.25 $0.51<br />
$0.05 $0.07 $0.10 $0.12 $0.15 $0.17 $0.20 $0.22 $0.25 $0.49<br />
$0.05 $0.07 $0.10 $0.12 $0.14 $0.17 $0.19 $0.22 $0.24 $0.48<br />
$0.05 $0.07 $0.09 $0.12 $0.14 $0.17 $0.19 $0.21 $0.24 $0.47<br />
$0.05 $0.07 $0.09 $0.12 $0.14 $0.16 $0.18 $0.21 $0.23 $0.46<br />
$0.05 $0.07 $0.09 $0.11 $0.14 $0.16 $0.18 $0.20 $0.23 $0.45<br />
$0.04 $0.07 $0.09 $0.11 $0.13 $0.16 $0.18 $0.20 $0.22 $0.44<br />
$0.04 $0.07 $0.09 $0.11 $0.13 $0.15 $0.17 $0.20 $0.22 $0.43<br />
$0.04 $0.06 $0.09 $0.11 $0.13 $0.15 $0.17 $0.19 $0.21 $0.43<br />
$0.04 $0.06 $0.08 $0.10 $0.12 $0.14 $0.16 $0.18 $0.20 $0.41<br />
$0.04 $0.06 $0.08 $0.10 $0.12 $0.14 $0.16 $0.18 $0.20 $0.39<br />
$0.04 $0.06 $0.08 $0.10 $0.12 $0.14 $0.15 $0.17 $0.19 $0.39<br />
$0.04 $0.06 $0.07 $0.09 $0.11 $0.13 $0.15 $0.17 $0.19 $0.37<br />
$0.05 $0.07 $0.10 $0.12 $0.14 $0.17 $0.19 $0.22 $0.24 $0.48<br />
$0.05 $0.07 $0.09 $0.12 $0.14 $0.16 $0.18 $0.21 $0.23 $0.46<br />
$0.04 $0.07 $0.09 $0.11 $0.13 $0.16 $0.18 $0.20 $0.22 $0.44<br />
$0.04 $0.06 $0.09 $0.11 $0.13 $0.15 $0.17 $0.19 $0.21 $0.43<br />
$0.04 $0.06 $0.08 $0.10 $0.12 $0.15 $0.17 $0.19 $0.21 $0.41<br />
$0.04 $0.06 $0.08 $0.10 $0.12 $0.14 $0.16 $0.18 $0.20 $0.40<br />
$0.04 $0.06 $0.08 $0.10 $0.12 $0.14 $0.16 $0.18 $0.19 $0.39<br />
$0.04 $0.06 $0.08 $0.09 $0.11 $0.13 $0.15 $0.17 $0.19 $0.38<br />
$0.04 $0.05 $0.07 $0.09 $0.11 $0.13 $0.15 $0.16 $0.18 $0.37<br />
$0.04 $0.05 $0.07 $0.09 $0.11 $0.12 $0.14 $0.16 $0.18 $0.36<br />
$0.03 $0.05 $0.07 $0.09 $0.10 $0.12 $0.14 $0.16 $0.17 $0.35<br />
$0.04 $0.07 $0.09 $0.11 $0.13 $0.16 $0.18 $0.20 $0.22 $0.45<br />
$0.04 $0.07 $0.09 $0.11 $0.13 $0.15 $0.17 $0.20 $0.22 $0.44<br />
$0.04 $0.06 $0.08 $0.11 $0.13 $0.15 $0.17 $0.19 $0.21 $0.42<br />
$0.04 $0.06 $0.08 $0.10 $0.12 $0.14 $0.16 $0.18 $0.21 $0.41<br />
$0.04 $0.06 $0.08 $0.10 $0.12 $0.14 $0.16 $0.18 $0.20 $0.40<br />
$0.04 $0.06 $0.08 $0.10 $0.12 $0.14 $0.16 $0.17 $0.19 $0.39<br />
$0.04 $0.06 $0.08 $0.09 $0.11 $0.13 $0.15 $0.17 $0.19 $0.38<br />
$0.04 $0.06 $0.07 $0.09 $0.11 $0.13 $0.15 $0.17 $0.18 $0.37<br />
$0.04 $0.05 $0.07 $0.09 $0.11 $0.13 $0.14 $0.16 $0.18 $0.36<br />
$0.03 $0.05 $0.07 $0.09 $0.10 $0.12 $0.14 $0.16 $0.17 $0.35<br />
$0.03 $0.05 $0.07 $0.09 $0.10 $0.12 $0.14 $0.15 $0.17 $0.34<br />
$0.03 $0.05 $0.07 $0.08 $0.10 $0.12 $0.13 $0.15 $0.17 $0.33<br />
$0.03 $0.05 $0.07 $0.08 $0.10 $0.11 $0.13 $0.15 $0.16 $0.33<br />
$0.03 $0.05 $0.06 $0.08 $0.09 $0.11 $0.13 $0.14 $0.16 $0.31<br />
Pipe Capital Costs_Single_Rural_PF of 3_FINAL.xls, Capital Costs Page 6 of 6 3/30/2007 3:04 PM
Pipe Capital Project Cost, $ Million<br />
20<br />
18<br />
16<br />
14<br />
12<br />
10<br />
8<br />
6<br />
4<br />
2<br />
Transmission, 4.5 mile:<br />
Transmission, 5 mile:<br />
Transmission, 10 mile:<br />
Rural Area Reclaimed Transmission Pipe Capital Project Costs, 0-5 mgd<br />
y = 1.0749x + 1.8007<br />
R 2 = 0.9743<br />
y = 1.1944x + 2.0008<br />
R 2 = 0.9743<br />
y = 2.3887x + 4.0016<br />
R 2 = 0.9743<br />
0<br />
0.00 0.50 1.00 1.50 2.00 2.50 3.00 3.50 4.00 4.50 5.00<br />
Flow, mgd<br />
y = 0.2389x + 0.4002<br />
R 2 = 0.9743<br />
y = 0.3583x + 0.6002<br />
R 2 = 0.9743<br />
y = 0.4777x + 0.8003<br />
R 2 Transmission, 1 mile:<br />
Transmission, 1.5 mile:<br />
Transmission, 2 mile:<br />
= 0.9743<br />
Transmission, 2.5 mile:<br />
y = 0.5972x + 1.0004<br />
R 2 = 0.9743<br />
Transmission, 3 mile:<br />
y = 0.7166x + 1.2005<br />
R 2 = 0.9743<br />
Transmission, 3.5 mile:<br />
y = 0.8361x + 1.4005<br />
R 2 = 0.9743<br />
y = 0.9555x + 1.6006<br />
R 2 Transmission, 4 mile:<br />
= 0.9743<br />
Transmission, 1 mile Transmission, 1.5 mile Transmission, 2 mile Transmission, 2.5 mile<br />
Transmission, 3 mile Transmission, 3.5 mile Transmission, 4 mile Transmission, 4.5 mile<br />
Transmission, 5 mile Transmission, 10 mile Linear (Transmission, 1 mile) Linear (Transmission, 1.5 mile)<br />
Linear (Transmission, 2 mile) Linear (Transmission, 2.5 mile) Linear (Transmission, 3 mile) Linear (Transmission, 3.5 mile)<br />
Linear (Transmission, 4 mile) Linear (Transmission, 4.5 mile) Linear (Transmission, 5 mile) Linear (Transmission, 10 mile)
Pipe Capital Project Cost, $ Million<br />
55<br />
50<br />
45<br />
40<br />
35<br />
30<br />
25<br />
20<br />
15<br />
10<br />
5<br />
Transmission, 5 mile:<br />
Transmission, 10 mile:<br />
Rural Area Reclaimed Transmission Pipe Capital Project Costs, 5-30 mgd<br />
y = 0.6864x + 4.9052<br />
R 2 = 0.9155<br />
y = 1.3728x + 9.8105<br />
R 2 = 0.9155<br />
0<br />
0.00 5.00 10.00 15.00 20.00 25.00 30.00 35.00<br />
Flow, mgd<br />
y = 0.1373x + 0.981<br />
R 2 Transmission, 1 mile:<br />
= 0.9155<br />
Transmission, 1.5 mile:<br />
y = 0.2059x + 1.4716<br />
R 2 = 0.9155<br />
y = 0.2746x + 1.9621<br />
R 2 Transmission, 2 mile:<br />
= 0.9155<br />
y = 0.3432x + 2.4526<br />
R 2 Transmission, 2.5 mile:<br />
= 0.9155<br />
Transmission, 3 mile:<br />
y = 0.4118x + 2.9431<br />
R 2 = 0.9155<br />
Transmission, 3.5 mile:<br />
y = 0.4805x + 3.4337<br />
R 2 = 0.9155<br />
y = 0.5491x + 3.9242<br />
R 2 Transmission, 4 mile:<br />
= 0.9155<br />
y = 0.6177x + 4.4147<br />
R 2 Transmission, 4.5 mile:<br />
= 0.9155<br />
Transmission, 1 mile Transmission, 1.5 mile Transmission, 2 mile Transmission, 2.5 mile<br />
Transmission, 3 mile Transmission, 3.5 mile Tranmission, 4 mile Transmission, 4.5 mile<br />
Transmission, 5 mile Transmission, 10 mile Linear (Transmission, 1 mile) Linear (Transmission, 1.5 mile)<br />
Linear (Transmission, 2 mile) Linear (Transmission, 2.5 mile) Linear (Transmission, 3 mile) Linear (Transmission, 3.5 mile)<br />
Linear (Tranmission, 4 mile) Linear (Transmission, 4.5 mile) Linear (Transmission, 5 mile) Linear (Transmission, 10 mile)
Pipe Capital Project Cost, $/1000 gallons<br />
$4.00<br />
$3.50<br />
$3.00<br />
$2.50<br />
$2.00<br />
$1.50<br />
$1.00<br />
$0.50<br />
Rural Area Reclaimed Transmission Pipe Capital Project Costs, $/1000 gallons<br />
Transmission, 1 mile:<br />
Transmission, 2 mile:<br />
Transmission, 3 mile:<br />
Transmission, 4 mile:<br />
Transmission, 5 mile:<br />
y = 0.1481x -0.4598<br />
R 2 = 0.9458<br />
y = 0.2962x -0.4598<br />
R 2 = 0.9458<br />
y = 0.4443x -0.4598<br />
R 2 = 0.9458<br />
y = 0.5925x -0.4598<br />
R 2 = 0.9458<br />
y = 0.7406x -0.4598<br />
R 2 = 0.9458<br />
Transmission, 1.5 mile:<br />
Transmission, 2.5 mile:<br />
Transmission, 3.5 mile:<br />
y = 0.2222x -0.4598<br />
R 2 = 0.9458<br />
y = 0.3703x -0.4598<br />
R 2 = 0.9458<br />
y = 0.5184x -0.4598<br />
R 2 = 0.9458<br />
y = 0.6665x -0.4598<br />
Transmission, 4.5 mile:<br />
Transmission, 10 mile:<br />
R 2 = 0.9458<br />
y = 1.4811x -0.4598<br />
R 2 = 0.9458<br />
$0.00<br />
0.00 5.00 10.00 15.00 20.00 25.00 30.00 35.00<br />
Flow, mgd<br />
Transmission, 1 mile Transmission, 1.5 mile Transmission, 2 mile Transmission, 2.5 mile<br />
Transmission, 3 mile Transmission, 3.5 mile Transmission, 4 mile Transmission, 4.5 mile<br />
Transmission, 5 mile Transmission, 10 mile Power (Transmission, 10 mile) Power (Transmission, 5 mile)<br />
Power (Transmission, 4.5 mile) Power (Transmission, 4 mile) Power (Transmission, 3.5 mile) Power (Transmission, 2.5 mile)<br />
Power (Transmission, 3 mile) Power (Transmission, 2 mile) Power (Transmission, 1.5 mile) Power (Transmission, 1 mile)
Exhibit 3<br />
<strong>Water</strong> Reuse System O&M Cost
Pumping Power Cost Curves <strong>for</strong> Reclaimed <strong>Water</strong> Conveyance<br />
Total Dynamic Head (ft) <strong>for</strong> Pipe Length Listed (miles)<br />
Annual<br />
Peak<br />
Peak Friction<br />
Pressure<br />
Average<br />
Hourly Pipe Velocity at<br />
Hourly Loss Minor at<br />
Diam Day Flow Annual Average Flow Peak Hourly Flow Distance Demand (ft/1000f Loss Delivery<br />
(in) (mgd) Day Flow (gpm) (mgd) (ft/s)<br />
(ft) (gpm) t) (ft/1000 ft) (psi) 1 1.5 2 2.5 3 3.5 4 4.5 5 10<br />
4 0.10 69.40 0.30 5.32 1000 208.2 29.4 0.077 40.0 247.8<br />
6 0.20 138.80 0.60 4.73 1000 416.4 14.7 0.061 40.0 170.4 209.3 248.5<br />
6 0.27 185.07 0.80 6.30 1000 555.2 25.1 0.108 40.0 225.3 291.5<br />
8 0.40 277.60 1.20 5.32 1000 832.8 13.1 0.077 40.0 161.9 196.5 231.4 266.2<br />
8 0.47 323.87 1.40 6.21 1001 971.6 17.4 0.105 40.0 185.0 231.0 277.5<br />
8 0.53 370.13 1.60 7.09 1000 1110.4 22.3 0.137 40.0 210.8 269.6 329.2<br />
10 0.60 416.40 1.80 5.11 1000 1249.2 9.4 0.071 40.0 142.2 166.9 192.0 216.9 241.7<br />
10 0.67 462.67 2.00 5.67 1000 1388.0 11.4 0.087 40.0 152.9 182.9 213.4 243.7<br />
10 0.83 578.33 2.50 7.09 1000 1735.0 17.2 0.137 40.0 183.8 229.2 275.3 321.0<br />
12 0.93 647.73 2.80 5.52 1001 1943.2 8.7 0.083 40.0 139.0 162.0 185.5 208.8 232.1<br />
12 1.00 694.00 3.00 5.91 1000 2082.0 9.9 0.095 40.0 145.3 171.4 198.1 224.5 251.0<br />
12 1.17 809.67 3.50 6.89 1000 2429.0 13.2 0.129 40.0 162.7 197.5 233.0 268.2<br />
14 1.33 925.33 4.00 5.79 1001 2776.0 8.0 0.091 40.0 135.0 156.1 177.7 199.0 220.3<br />
14 1.50 1041.00 4.50 6.51 1000 3123.0 9.9 0.115 40.0 145.4 171.6 198.3 224.8 251.3<br />
14 1.67 1156.67 5.00 7.24 1000 3470.0 12.1 0.142 40.0 156.8 188.6 221.2 253.4<br />
16 1.83 1272.33 5.50 6.09 1001 3817.0 7.5 0.101 40.0 132.6 152.4 172.8 192.9 213.0<br />
16 2.00 1388.00 6.00 6.65 1000 4164.0 8.8 0.120 40.0 139.6 162.9 186.8 210.4 234.0<br />
16 2.07 1434.27 6.20 6.87 1000 4302.8 9.4 0.128 40.0 142.5 167.3 192.7 217.8 242.8<br />
18 2.17 1503.67 6.50 5.69 1000 4511.0 5.8 0.088 40.0 123.3 138.5 154.2 169.7 185.1 200.6 216.0 231.5<br />
18 2.33 1619.33 7.00 6.13 1000 4858.0 6.6 0.102 40.0 127.8 145.3 163.3 181.0 198.7 216.5 234.2 251.9<br />
18 2.50 1735.00 7.50 6.57 1000 5205.0 7.5 0.117 40.0 132.7 152.5 173.0 193.1 213.2 233.4 253.5<br />
18 2.67 1850.67 8.00 7.00 1000 5552.0 8.5 0.133 40.0 137.8 160.1 183.2 205.9 228.6 251.3 274.0<br />
20 2.83 1966.33 8.50 6.03 1000 5899.0 5.7 0.099 40.0 122.9 137.8 153.3 168.6 183.8 199.0 214.3 229.5<br />
20 3.00 2082.00 9.00 6.38 1000 6246.0 6.3 0.111 40.0 126.3 142.9 160.1 177.1 194.0 210.9 227.9 244.8<br />
20 3.17 2197.67 9.50 6.74 1000 6593.0 7.0 0.123 40.0 129.8 148.2 167.3 186.0 204.7 223.4 242.1<br />
20 3.33 2313.33 10.00 7.09 1000 6940.0 7.7 0.137 40.0 133.6 153.8 174.7 195.3 215.9 236.5 257.1<br />
24 3.50 2429.00 10.50 5.17 1000 7287.0 3.5 0.073 40.0 111.0 120.1 129.6 138.9 148.2 157.6 166.9 176.2 185.5<br />
24 3.67 2544.67 11.00 5.42 1000 7634.0 3.8 0.080 40.0 112.7 122.6 133.0 143.1 153.3 163.4 173.6 183.7 193.9<br />
24 3.83 2660.33 11.50 5.66 1000 7981.0 4.1 0.087 40.0 114.4 125.2 136.5 147.5 158.5 169.5 180.5 191.6 202.6<br />
24 4.00 2776.00 12.00 5.91 1000 8328.0 4.4 0.095 40.0 116.2 127.9 140.1 152.0 163.9 175.8 187.8 199.7 211.6<br />
24 4.17 2891.67 12.50 6.16 1000 8675.0 4.8 0.103 40.0 118.1 130.7 143.8 156.7 169.5 182.4 195.3 208.1 221.0<br />
24 4.33 3007.33 13.00 6.40 1000 9022.0 5.1 0.111 40.0 120.1 133.6 147.7 161.5 175.4 189.2 203.0 216.8 230.7<br />
24 4.50 3123.00 13.50 6.65 1000 9369.0 5.5 0.120 40.0 122.1 136.6 151.7 166.5 181.4 196.2 211.0 225.9 240.7<br />
24 4.67 3238.67 14.00 6.89 1000 9716.0 5.9 0.129 40.0 124.1 139.6 155.9 171.7 187.6 203.4 219.3 235.2 251.0<br />
30 5.33 3701.33 16.00 5.04 1000 11104.0 2.5 0.069 40.0 106.2 112.9 120.0 126.9 133.8 140.6 147.5 154.4 161.3<br />
30 6.00 4164.00 18.00 5.67 1000 12492.0 3.2 0.087 40.0 109.5 117.9 126.7 135.3 143.8 152.4 161.0 169.6 178.1<br />
30 6.67 4626.67 20.00 6.30 1000 13880.0 3.8 0.108 40.0 113.2 123.4 134.1 144.5 154.9 165.4 175.8 186.2 196.6<br />
30 7.33 5089.33 22.00 6.93 1000 15268.0 4.6 0.131 40.0 117.3 129.4 142.2 154.6 167.0 179.5 191.9 204.4 216.8<br />
36 8.00 5552.00 24.00 5.25 1000 16656.0 2.2 0.075 40.0 104.5 110.3 116.6 122.6 128.7 134.7 140.8 146.8 152.9 213.4<br />
36 8.67 6014.67 26.00 5.69 1000 18044.0 2.6 0.088 40.0 106.4 113.2 120.5 127.5 134.5 141.5 148.5 155.6 162.6 232.7<br />
36 9.33 6477.33 28.00 6.13 1000 19432.0 2.9 0.102 40.0 108.5 116.3 124.6 132.7 140.7 148.8 156.8 164.9 172.9 253.4<br />
36 10.00 6940.00 30.00 6.57 1000 20820.0 3.3 0.117 40.0 110.7 119.5 129.0 138.2 147.3 156.5 165.6 174.8 183.9 275.4<br />
36 10.67 7402.67 32.00 7.00 1000 22208.0 3.8 0.133 40.0 113.0 123.0 133.7 144.0 154.3 164.6 174.9 185.2 195.5 298.7<br />
42 11.33 7865.33 34.00 5.47 1000 23596.0 2.0 0.081 40.0 103.4 108.6 114.3 119.8 125.3 130.8 136.2 141.7 147.2 202.0<br />
42 12.00 8328.00 36.00 5.79 1000 24984.0 2.2 0.091 40.0 104.6 110.4 116.8 122.9 129.0 135.0 141.1 147.2 153.3 214.2<br />
42 12.67 8790.67 38.00 6.11 1000 26372.0 2.4 0.101 40.0 105.9 112.3 119.3 126.1 132.8 139.5 146.3 153.0 159.7 227.1<br />
42 13.33 9253.33 40.00 6.43 1000 27760.0 2.7 0.112 40.0 107.2 114.3 122.0 129.4 136.8 144.3 151.7 159.1 166.5 240.6<br />
42 14.00 9716.00 42.00 6.75 1000 29148.0 2.9 0.124 40.0 108.6 116.4 124.8 132.9 141.1 149.2 157.3 165.4 173.5 254.6<br />
42 14.67 10178.67 44.00 7.08 1000 30536.0 3.2 0.136 40.0 110.1 118.6 127.8 136.6 145.4 154.3 163.1 172.0 180.8 269.2<br />
48 13.67 9484.67 41.00 5.05 1000 28454.0 1.5 0.069 40.0 100.5 104.4 108.7 112.7 116.8 120.9 125.0 129.0 133.1 173.8<br />
48 14.00 9716.00 42.00 5.17 1000 29148.0 1.5 0.073 40.0 100.9 105.0 109.4 113.7 117.9 122.2 126.4 130.7 135.0 177.5<br />
48 14.33 9947.33 43.00 5.29 1000 29842.0 1.6 0.076 40.0 101.3 105.5 110.2 114.6 119.1 123.5 128.0 132.4 136.9 181.3<br />
48 14.67 10178.67 44.00 5.42 1000 30536.0 1.7 0.080 40.0 101.7 106.1 111.0 115.6 120.2 124.9 129.5 134.2 138.8 185.2<br />
48 15.00 10410.00 45.00 5.54 1000 31230.0 1.7 0.083 40.0 102.1 106.7 111.7 116.6 121.4 126.3 131.1 135.9 140.8 189.1<br />
48 15.33 10641.33 46.00 5.66 1000 31924.0 1.8 0.087 40.0 102.5 107.3 112.6 117.6 122.6 127.7 132.7 137.8 142.8 193.2<br />
48 15.67 10872.67 47.00 5.79 1000 32618.0 1.9 0.091 40.0 102.9 107.9 113.4 118.6 123.9 129.1 134.4 139.6 144.8 197.3<br />
48 16.00 11104.00 48.00 5.91 1000 33312.0 2.0 0.095 40.0 103.3 108.5 114.2 119.7 125.1 130.6 136.0 141.5 146.9 201.5<br />
48 16.33 11335.33 49.00 6.03 1000 34006.0 2.0 0.099 40.0 103.7 109.1 115.1 120.7 126.4 132.1 137.7 143.4 149.1 205.7<br />
48 16.67 11566.67 50.00 6.16 1000 34700.0 2.1 0.103 40.0 104.2 109.8 115.9 121.8 127.7 133.6 139.5 145.3 151.2 210.1<br />
48 17.33 12029.33 52.00 6.40 1000 36088.0 2.3 0.111 40.0 105.1 111.1 117.7 124.0 130.4 136.7 143.0 149.3 155.7 218.9<br />
48 18.00 12492.00 54.00 6.65 1000 37476.0 2.5 0.120 40.0 106.0 112.4 119.5 126.3 133.1 139.9 146.7 153.5 160.3 228.1<br />
48 18.33 12723.33 55.00 6.77 1000 38170.0 2.5 0.125 40.0 106.4 113.1 120.5 127.5 134.5 141.6 148.6 155.6 162.6 232.8<br />
Pipe O&M Costs_Single_FINAL.xls, Pumping Cost Page 1 of 8 3/30/2007 3:01 PM
Diam<br />
(in)<br />
Annual<br />
Average<br />
Day Flow<br />
(mgd)<br />
Annual Average<br />
Day Flow (gpm)<br />
Peak<br />
Hourly<br />
Flow<br />
(mgd)<br />
Pipe Velocity at<br />
Peak Hourly Flow Distance<br />
(ft/s)<br />
(ft)<br />
Peak<br />
Hourly<br />
Demand<br />
(gpm)<br />
Friction<br />
Loss<br />
(ft/1000f<br />
t)<br />
Pumping Power Cost Curves <strong>for</strong> Reclaimed <strong>Water</strong> Conveyance<br />
Minor<br />
Loss<br />
(ft/1000 ft)<br />
Total Dynamic Head (ft) <strong>for</strong> Pipe Length Listed (miles)<br />
Pressure<br />
at<br />
Delivery<br />
(psi) 1 1.5 2 2.5 3 3.5 4 4.5 5 10<br />
48 19.00 13186.00 57.00 7.02 1000 39558.0 2.7 0.134 40.0 107.4 114.6 122.4 129.9 137.4 144.9 152.4 159.9 167.4 242.5<br />
54 17.33 12029.33 52.00 5.06 1000 36088.0 1.3 0.070 40.0 99.6 103.0 106.7 110.3 113.9 117.5 121.1 124.7 128.3 164.1<br />
54 18.00 12492.00 54.00 5.25 1000 37476.0 1.4 0.075 40.0 100.1 103.7 107.8 111.6 115.5 119.3 123.2 127.0 130.9 169.3<br />
54 18.67 12954.67 56.00 5.45 1000 38864.0 1.5 0.081 40.0 100.6 104.5 108.9 113.0 117.1 121.2 125.3 129.4 133.5 174.7<br />
54 19.33 13417.33 58.00 5.64 1000 40252.0 1.6 0.087 40.0 101.2 105.3 110.0 114.4 118.7 123.1 127.5 131.9 136.3 180.2<br />
54 20.00 13880.00 60.00 5.84 1000 41640.0 1.7 0.093 40.0 101.8 106.2 111.1 115.8 120.5 125.1 129.8 134.5 139.2 185.9<br />
54 20.67 14342.67 62.00 6.03 1000 43028.0 1.8 0.099 40.0 102.3 107.1 112.3 117.3 122.2 127.2 132.2 137.1 142.1 191.8<br />
54 21.33 14805.33 64.00 6.23 1000 44416.0 1.9 0.105 40.0 102.9 107.9 113.5 118.8 124.0 129.3 134.6 139.9 145.1 197.9<br />
54 22.00 15268.00 66.00 6.42 1000 45804.0 2.0 0.112 40.0 103.6 108.9 114.7 120.3 125.9 131.5 137.1 142.6 148.2 204.1<br />
54 22.67 15730.67 68.00 6.61 1000 47192.0 2.1 0.119 40.0 104.2 109.8 116.0 121.9 127.8 133.7 139.6 145.5 151.4 210.4<br />
54 23.33 16193.33 70.00 6.81 1000 48580.0 2.2 0.126 40.0 104.9 110.8 117.3 123.5 129.8 136.0 142.2 148.4 154.7 217.0<br />
54 24.00 16656.00 72.00 7.00 1000 49968.0 2.4 0.133 40.0 105.5 111.7 118.6 125.2 131.8 138.3 144.9 151.5 158.0 223.6<br />
60 21.17 14689.67 63.50 5.00 1000 44069.0 1.1 0.068 40.0 98.7 101.6 104.9 108.0 111.2 114.3 117.4 120.6 123.7 155.0<br />
60 21.67 15036.67 65.00 5.12 1000 45110.0 1.2 0.071 40.0 98.9 102.0 105.5 108.7 112.0 115.3 118.5 121.8 125.1 157.7<br />
60 22.33 15499.33 67.00 5.28 1000 46498.0 1.2 0.076 40.0 99.3 102.6 106.2 109.7 113.1 116.6 120.0 123.5 127.0 161.5<br />
60 23.00 15962.00 69.00 5.44 1000 47886.0 1.3 0.080 40.0 99.7 103.1 107.0 110.7 114.3 118.0 121.6 125.3 128.9 165.4<br />
60 23.67 16424.67 71.00 5.59 1000 49274.0 1.4 0.085 40.0 100.1 103.7 107.8 111.6 115.5 119.3 123.2 127.0 130.9 169.4<br />
60 24.33 16887.33 73.00 5.75 1000 50662.0 1.4 0.090 40.0 100.5 104.3 108.6 112.7 116.7 120.8 124.8 128.9 132.9 173.5<br />
60 25.00 17350.00 75.00 5.91 1000 52050.0 1.5 0.095 40.0 100.9 104.9 109.4 113.7 118.0 122.2 126.5 130.8 135.0 177.6<br />
60 25.67 17812.67 77.00 6.07 1000 53438.0 1.6 0.100 40.0 101.4 105.6 110.3 114.8 119.3 123.7 128.2 132.7 137.2 181.9<br />
60 26.33 18275.33 79.00 6.22 1000 54826.0 1.7 0.105 40.0 101.8 106.2 111.2 115.9 120.6 125.3 130.0 134.6 139.3 186.3<br />
60 27.00 18738.00 81.00 6.38 1000 56214.0 1.8 0.111 40.0 102.2 106.9 112.1 117.0 121.9 126.8 131.7 136.7 141.6 190.7<br />
60 27.67 19200.67 83.00 6.54 1000 57602.0 1.8 0.116 40.0 102.7 107.5 113.0 118.1 123.3 128.4 133.6 138.7 143.9 195.3<br />
60 28.33 19663.33 85.00 6.70 1000 58990.0 1.9 0.122 40.0 103.2 108.2 113.9 119.3 124.7 130.0 135.4 140.8 146.2 200.0<br />
60 29.00 20126.00 87.00 6.86 1000 60378.0 2.0 0.128 40.0 103.6 108.9 114.9 120.5 126.1 131.7 137.3 142.9 148.6 204.7<br />
60 30.00 20820.00 90.00 7.09 1000 62460.0 2.1 0.137 40.0 104.4 110.0 116.3 122.3 128.3 134.3 140.3 146.2 152.2 212.0<br />
Pipe O&M Costs_Single_FINAL.xls, Pumping Cost Page 2 of 8 3/30/2007 3:01 PM
Annual<br />
Average<br />
Day Flow<br />
(mgd)<br />
Peak<br />
Hourly<br />
Flow<br />
Pipe Velocity at<br />
Peak Hourly Flow<br />
(ft/s)<br />
Diam<br />
Annual Average<br />
(in)<br />
Day Flow (gpm) (mgd)<br />
4 0.10 69.40 0.30 5.32<br />
6 0.20 138.80 0.60 4.73<br />
6 0.27 185.07 0.80 6.30<br />
8 0.40 277.60 1.20 5.32<br />
8 0.47 323.87 1.40 6.21<br />
8 0.53 370.13 1.60 7.09<br />
10 0.60 416.40 1.80 5.11<br />
10 0.67 462.67 2.00 5.67<br />
10 0.83 578.33 2.50 7.09<br />
12 0.93 647.73 2.80 5.52<br />
12 1.00 694.00 3.00 5.91<br />
12 1.17 809.67 3.50 6.89<br />
14 1.33 925.33 4.00 5.79<br />
14 1.50 1041.00 4.50 6.51<br />
14 1.67 1156.67 5.00 7.24<br />
16 1.83 1272.33 5.50 6.09<br />
16 2.00 1388.00 6.00 6.65<br />
16 2.07 1434.27 6.20 6.87<br />
18 2.17 1503.67 6.50 5.69<br />
18 2.33 1619.33 7.00 6.13<br />
18 2.50 1735.00 7.50 6.57<br />
18 2.67 1850.67 8.00 7.00<br />
20 2.83 1966.33 8.50 6.03<br />
20 3.00 2082.00 9.00 6.38<br />
20 3.17 2197.67 9.50 6.74<br />
20 3.33 2313.33 10.00 7.09<br />
24 3.50 2429.00 10.50 5.17<br />
24 3.67 2544.67 11.00 5.42<br />
24 3.83 2660.33 11.50 5.66<br />
24 4.00 2776.00 12.00 5.91<br />
24 4.17 2891.67 12.50 6.16<br />
24 4.33 3007.33 13.00 6.40<br />
24 4.50 3123.00 13.50 6.65<br />
24 4.67 3238.67 14.00 6.89<br />
30 5.33 3701.33 16.00 5.04<br />
30 6.00 4164.00 18.00 5.67<br />
30 6.67 4626.67 20.00 6.30<br />
30 7.33 5089.33 22.00 6.93<br />
36 8.00 5552.00 24.00 5.25<br />
36 8.67 6014.67 26.00 5.69<br />
36 9.33 6477.33 28.00 6.13<br />
36 10.00 6940.00 30.00 6.57<br />
36 10.67 7402.67 32.00 7.00<br />
42 11.33 7865.33 34.00 5.47<br />
42 12.00 8328.00 36.00 5.79<br />
42 12.67 8790.67 38.00 6.11<br />
42 13.33 9253.33 40.00 6.43<br />
42 14.00 9716.00 42.00 6.75<br />
42 14.67 10178.67 44.00 7.08<br />
48 13.67 9484.67 41.00 5.05<br />
48 14.00 9716.00 42.00 5.17<br />
48 14.33 9947.33 43.00 5.29<br />
48 14.67 10178.67 44.00 5.42<br />
48 15.00 10410.00 45.00 5.54<br />
48 15.33 10641.33 46.00 5.66<br />
48 15.67 10872.67 47.00 5.79<br />
48 16.00 11104.00 48.00 5.91<br />
48 16.33 11335.33 49.00 6.03<br />
48 16.67 11566.67 50.00 6.16<br />
48 17.33 12029.33 52.00 6.40<br />
48 18.00 12492.00 54.00 6.65<br />
48 18.33 12723.33 55.00 6.77<br />
Pumping Power Cost Curves <strong>for</strong> Reclaimed <strong>Water</strong> Conveyance<br />
Power Requirement (kw) <strong>for</strong> Pipe Length Listed (miles)<br />
1 1.5 2 2.5 3 3.5 4 4.5 5 10<br />
6.10<br />
8.38 10.30 12.22<br />
14.78 19.12 0.00<br />
15.93 19.33 22.77 26.19<br />
21.23 26.51 31.86<br />
27.65 35.37 43.19<br />
20.98 24.63 28.33 32.00 35.68<br />
25.07 30.00 34.99 39.96<br />
37.68 46.98 56.43 65.80<br />
31.90 37.20 42.59 47.94 53.28<br />
35.73 42.17 48.73 55.23 61.73<br />
46.69 56.68 66.87 76.96<br />
44.28 51.20 58.27 65.26 72.25<br />
53.63 63.29 73.18 82.95 92.72<br />
64.27 77.31 90.67 103.86<br />
59.80 68.74 77.93 87.00 96.06<br />
68.67 80.12 91.89 103.49 115.10<br />
72.46 85.03 97.95 110.70 123.44<br />
65.71 73.82 82.18 90.42 98.65 106.88 115.12 123.35<br />
73.38 83.39 93.72 103.89 114.07 124.24 134.41 144.59<br />
81.59 93.78 106.36 118.74 131.13 143.51 155.90<br />
90.38 105.04 120.16 135.05 149.94 164.83 179.71<br />
85.63 96.06 106.86 117.47 128.09 138.71 149.32 159.94<br />
93.17 105.45 118.17 130.66 143.16 155.65 168.15 180.65<br />
101.13 115.46 130.29 144.87 159.45 174.03 188.61<br />
109.51 126.09 143.27 160.14 177.02 193.90 210.78<br />
95.57 103.42 111.60 119.61 127.62 135.64 143.65 151.66 159.68<br />
101.63 110.60 119.94 129.09 138.24 147.39 156.54 165.69 174.84<br />
107.90 118.07 128.67 139.06 149.45 159.84 170.22 180.61 191.00<br />
114.37 125.85 137.83 149.55 161.28 173.01 184.74 196.47 208.20<br />
121.05 133.95 147.41 160.59 173.76 186.94 200.12 213.30 226.47<br />
127.96 142.39 157.44 172.18 186.91 201.65 216.39 231.13 245.87<br />
135.10 151.16 167.93 184.34 200.76 217.17 233.58 250.00 266.41<br />
142.48 160.29 178.89 197.10 215.31 233.52 251.73 269.94 288.14<br />
139.30 148.10 157.38 166.42 175.46 184.50 193.55 202.59 211.63<br />
161.67 173.99 186.98 199.64 212.29 224.94 237.60 250.25 262.91<br />
185.70 202.33 219.89 236.98 254.08 271.17 288.26 305.36 322.45<br />
211.54 233.36 256.42 278.85 301.29 323.73 346.16 368.60 391.04<br />
205.63 217.14 229.43 241.33 253.24 265.14 277.04 288.94 300.85 419.87<br />
226.89 241.35 256.81 271.76 286.72 301.68 316.64 331.60 346.56 496.14<br />
249.09 266.95 286.06 304.54 323.02 341.51 359.99 378.47 396.95 581.79<br />
272.29 294.04 317.30 339.81 362.32 384.83 407.33 429.84 452.35 677.42<br />
296.55 322.69 350.67 377.73 404.79 431.85 458.92 485.98 513.04 783.65<br />
288.12 302.80 318.67 333.94 349.21 364.49 379.76 395.03 410.31 563.03<br />
308.69 325.96 344.65 362.63 380.62 398.60 416.58 434.56 452.54 632.35<br />
329.85 350.00 371.81 392.80 413.78 434.76 455.75 476.73 497.71 707.55<br />
351.62 374.94 400.21 424.50 448.80 473.09 497.38 521.68 545.97 788.91<br />
374.04 400.84 429.89 457.82 485.74 513.67 541.59 569.52 597.45 876.71<br />
397.13 427.72 460.91 492.81 524.70 556.60 588.49 620.39 652.28 971.22<br />
337.97 351.04 365.33 379.01 392.69 406.37 420.05 433.73 447.41 584.22<br />
347.50 361.49 376.81 391.46 406.12 420.77 435.43 450.08 464.74 611.29<br />
357.11 372.07 388.46 404.13 419.81 435.48 451.15 466.83 482.50 639.25<br />
366.81 382.79 400.29 417.03 433.77 450.50 467.24 483.98 500.72 668.10<br />
376.61 393.64 412.30 430.15 448.00 465.85 483.70 501.55 519.39 697.87<br />
386.50 404.63 424.51 443.51 462.52 481.52 500.53 519.53 538.54 728.58<br />
396.48 415.77 436.90 457.11 477.32 497.53 517.74 537.94 558.15 760.24<br />
406.56 427.04 449.49 470.95 492.41 513.87 535.33 556.80 578.26 792.88<br />
416.74 438.46 462.27 485.04 507.80 530.56 553.33 576.09 598.86 826.50<br />
427.02 450.03 475.26 499.37 523.49 547.61 571.72 595.84 619.96 861.12<br />
447.90 473.62 501.85 528.82 555.80 582.78 609.75 636.73 663.70 933.46<br />
469.19 497.83 529.28 559.33 589.38 619.43 649.47 679.52 709.57 1010.04<br />
480.00 510.18 543.33 574.99 606.66 638.32 669.99 701.65 733.32 1049.96<br />
Pipe O&M Costs_Single_FINAL.xls, Pumping Cost Page 3 of 8 3/30/2007 3:01 PM
Diam<br />
(in)<br />
Annual<br />
Average<br />
Day Flow<br />
(mgd)<br />
Annual Average<br />
Day Flow (gpm)<br />
Peak<br />
Hourly<br />
Flow<br />
(mgd)<br />
Pipe Velocity at<br />
Peak Hourly Flow<br />
(ft/s)<br />
48 19.00 13186.00 57.00 7.02<br />
54 17.33 12029.33 52.00 5.06<br />
54 18.00 12492.00 54.00 5.25<br />
54 18.67 12954.67 56.00 5.45<br />
54 19.33 13417.33 58.00 5.64<br />
54 20.00 13880.00 60.00 5.84<br />
54 20.67 14342.67 62.00 6.03<br />
54 21.33 14805.33 64.00 6.23<br />
54 22.00 15268.00 66.00 6.42<br />
54 22.67 15730.67 68.00 6.61<br />
54 23.33 16193.33 70.00 6.81<br />
54 24.00 16656.00 72.00 7.00<br />
60 21.17 14689.67 63.50 5.00<br />
60 21.67 15036.67 65.00 5.12<br />
60 22.33 15499.33 67.00 5.28<br />
60 23.00 15962.00 69.00 5.44<br />
60 23.67 16424.67 71.00 5.59<br />
60 24.33 16887.33 73.00 5.75<br />
60 25.00 17350.00 75.00 5.91<br />
60 25.67 17812.67 77.00 6.07<br />
60 26.33 18275.33 79.00 6.22<br />
60 27.00 18738.00 81.00 6.38<br />
60 27.67 19200.67 83.00 6.54<br />
60 28.33 19663.33 85.00 6.70<br />
60 29.00 20126.00 87.00 6.86<br />
60 30.00 20820.00 90.00 7.09<br />
Pumping Power Cost Curves <strong>for</strong> Reclaimed <strong>Water</strong> Conveyance<br />
Power Requirement (kw) <strong>for</strong> Pipe Length Listed (miles)<br />
1 1.5 2 2.5 3 3.5 4 4.5 5 10<br />
501.96 535.37 572.09 607.15 642.22 677.29 712.35 747.42 782.49 1133.15<br />
424.51 439.01 455.08 470.37 485.65 500.94 516.22 531.51 546.79 699.64<br />
443.15 459.29 477.20 494.22 511.25 528.27 545.30 562.32 579.35 749.60<br />
462.03 479.94 499.81 518.70 537.59 556.48 575.37 594.26 613.15 802.05<br />
481.16 500.96 522.93 543.81 564.69 585.58 606.46 627.34 648.22 857.05<br />
500.56 522.37 546.58 569.58 592.59 615.60 638.61 661.61 684.62 914.69<br />
520.24 544.18 570.77 596.04 621.30 646.57 671.84 697.11 722.37 975.05<br />
540.19 566.40 595.52 623.19 650.86 678.52 706.19 733.86 761.52 1038.19<br />
560.43 589.04 620.85 651.06 681.27 711.48 741.69 771.90 802.11 1104.21<br />
580.96 612.11 646.76 679.66 712.56 745.46 778.36 811.27 844.17 1173.18<br />
601.79 635.63 673.28 709.02 744.77 780.51 816.25 851.99 887.74 1245.17<br />
622.94 659.60 700.42 739.16 777.90 816.64 855.38 894.12 932.86 1320.25<br />
513.63 528.98 546.20 562.49 578.77 595.06 611.34 627.63 643.91 806.75<br />
527.25 543.65 562.06 579.47 596.88 614.29 631.70 649.10 666.51 840.60<br />
545.55 563.43 583.52 602.50 621.48 640.47 659.45 678.43 697.42 887.26<br />
564.03 583.48 605.33 625.98 646.63 667.28 687.93 708.57 729.22 935.71<br />
582.70 603.80 627.51 649.92 672.32 694.73 717.14 739.54 761.95 986.02<br />
601.55 624.39 650.07 674.33 698.59 722.85 747.10 771.36 795.62 1038.21<br />
620.60 645.27 673.02 699.22 725.43 751.64 777.85 804.05 830.26 1092.33<br />
639.85 666.44 696.36 724.61 752.87 781.13 809.38 837.64 865.89 1148.44<br />
659.30 687.90 720.11 750.51 780.92 811.32 841.73 872.13 902.53 1206.58<br />
678.96 709.67 744.27 776.93 809.58 842.24 874.90 907.56 940.21 1266.78<br />
698.83 731.75 768.86 803.87 838.89 873.90 908.92 943.93 978.95 1329.11<br />
718.91 754.15 793.87 831.36 868.84 906.32 943.80 981.29 1018.77 1393.59<br />
739.22 776.87 819.33 859.39 899.45 939.51 979.57 1019.63 1059.69 1460.28<br />
770.10 811.57 858.37 902.51 946.64 990.78 1034.92 1079.05 1123.19 1564.55<br />
Pipe O&M Costs_Single_FINAL.xls, Pumping Cost Page 4 of 8 3/30/2007 3:01 PM
Annual<br />
Average<br />
Day Flow<br />
(mgd)<br />
Peak<br />
Hourly<br />
Flow<br />
Pipe Velocity at<br />
Peak Hourly Flow<br />
(ft/s)<br />
Diam<br />
Annual Average<br />
(in)<br />
Day Flow (gpm) (mgd)<br />
4 0.10 69.40 0.30 5.32<br />
6 0.20 138.80 0.60 4.73<br />
6 0.27 185.07 0.80 6.30<br />
8 0.40 277.60 1.20 5.32<br />
8 0.47 323.87 1.40 6.21<br />
8 0.53 370.13 1.60 7.09<br />
10 0.60 416.40 1.80 5.11<br />
10 0.67 462.67 2.00 5.67<br />
10 0.83 578.33 2.50 7.09<br />
12 0.93 647.73 2.80 5.52<br />
12 1.00 694.00 3.00 5.91<br />
12 1.17 809.67 3.50 6.89<br />
14 1.33 925.33 4.00 5.79<br />
14 1.50 1041.00 4.50 6.51<br />
14 1.67 1156.67 5.00 7.24<br />
16 1.83 1272.33 5.50 6.09<br />
16 2.00 1388.00 6.00 6.65<br />
16 2.07 1434.27 6.20 6.87<br />
18 2.17 1503.67 6.50 5.69<br />
18 2.33 1619.33 7.00 6.13<br />
18 2.50 1735.00 7.50 6.57<br />
18 2.67 1850.67 8.00 7.00<br />
20 2.83 1966.33 8.50 6.03<br />
20 3.00 2082.00 9.00 6.38<br />
20 3.17 2197.67 9.50 6.74<br />
20 3.33 2313.33 10.00 7.09<br />
24 3.50 2429.00 10.50 5.17<br />
24 3.67 2544.67 11.00 5.42<br />
24 3.83 2660.33 11.50 5.66<br />
24 4.00 2776.00 12.00 5.91<br />
24 4.17 2891.67 12.50 6.16<br />
24 4.33 3007.33 13.00 6.40<br />
24 4.50 3123.00 13.50 6.65<br />
24 4.67 3238.67 14.00 6.89<br />
30 5.33 3701.33 16.00 5.04<br />
30 6.00 4164.00 18.00 5.67<br />
30 6.67 4626.67 20.00 6.30<br />
30 7.33 5089.33 22.00 6.93<br />
36 8.00 5552.00 24.00 5.25<br />
36 8.67 6014.67 26.00 5.69<br />
36 9.33 6477.33 28.00 6.13<br />
36 10.00 6940.00 30.00 6.57<br />
36 10.67 7402.67 32.00 7.00<br />
42 11.33 7865.33 34.00 5.47<br />
42 12.00 8328.00 36.00 5.79<br />
42 12.67 8790.67 38.00 6.11<br />
42 13.33 9253.33 40.00 6.43<br />
42 14.00 9716.00 42.00 6.75<br />
42 14.67 10178.67 44.00 7.08<br />
48 13.67 9484.67 41.00 5.05<br />
48 14.00 9716.00 42.00 5.17<br />
48 14.33 9947.33 43.00 5.29<br />
48 14.67 10178.67 44.00 5.42<br />
48 15.00 10410.00 45.00 5.54<br />
48 15.33 10641.33 46.00 5.66<br />
48 15.67 10872.67 47.00 5.79<br />
48 16.00 11104.00 48.00 5.91<br />
48 16.33 11335.33 49.00 6.03<br />
48 16.67 11566.67 50.00 6.16<br />
48 17.33 12029.33 52.00 6.40<br />
48 18.00 12492.00 54.00 6.65<br />
48 18.33 12723.33 55.00 6.77<br />
Pumping Power Cost Curves <strong>for</strong> Reclaimed <strong>Water</strong> Conveyance<br />
Power Cost ($/year) <strong>for</strong> Pipe Length Listed (miles)<br />
1 1.5 2 2.5 3 3.5 4 4.5 5 10<br />
2,403.00<br />
3,305.23 4,058.82 4,818.63<br />
5,825.54 7,536.39<br />
6,279.88 7,620.12 8,976.10 10,324.20<br />
8,369.30 10,450.98 12,557.66<br />
10,900.90 13,943.59 17,023.58<br />
8,271.72 9,708.95 11,167.94 12,616.05 14,064.16<br />
9,883.82 11,824.41 13,794.86 15,750.38<br />
14,855.19 18,520.65 22,244.41 25,939.01<br />
12,575.92 14,663.19 16,789.95 18,896.96 21,003.98<br />
14,084.30 16,622.58 19,209.43 21,772.00 24,334.56<br />
18,406.63 22,345.18 26,360.88 30,338.01<br />
17,457.12 20,181.82 22,968.68 25,724.45 28,480.23<br />
21,142.78 24,950.53 28,846.79 32,698.80 36,550.80<br />
25,336.08 30,477.43 35,740.20 40,942.26<br />
23,572.51 27,098.82 30,719.86 34,293.54 37,867.22<br />
27,069.80 31,584.04 36,221.25 40,796.98 45,372.71<br />
28,564.19 33,520.63 38,612.76 43,637.04 48,661.32<br />
25,903.62 29,100.85 32,395.69 35,641.72 38,887.76 42,133.79 45,379.83 48,625.86<br />
28,924.89 32,874.01 36,945.04 40,955.12 44,965.20 48,975.27 52,985.35 56,995.42<br />
32,162.36 36,969.59 41,926.78 46,808.99 51,691.20 56,573.41 61,455.62<br />
35,629.11 41,407.10 47,367.08 53,236.07 59,105.06 64,974.05 70,843.03<br />
33,753.98 37,867.19 42,123.63 46,308.45 50,493.28 54,678.10 58,862.93 63,047.75<br />
36,729.39 41,570.32 46,581.26 51,507.19 56,433.12 61,359.05 66,284.99 71,210.92<br />
39,865.50 45,512.92 51,360.28 57,107.67 62,855.06 68,602.45 74,349.84<br />
43,169.89 49,706.27 56,475.86 63,128.85 69,781.84 76,434.83 83,087.81<br />
37,674.60 40,768.24 43,992.08 47,150.82 50,309.57 53,468.31 56,627.05 59,785.79 62,944.54<br />
40,064.48 43,596.72 47,278.65 50,885.74 54,492.83 58,099.91 61,707.00 65,314.08 68,921.17<br />
42,533.18 46,542.49 50,722.85 54,817.68 58,912.52 63,007.36 67,102.19 71,197.03 75,291.86<br />
45,083.73 49,610.08 54,330.76 58,954.28 63,577.79 68,201.31 72,824.82 77,448.34 82,071.85<br />
47,719.17 52,803.98 58,108.45 63,303.09 68,497.73 73,692.37 78,887.00 84,081.64 89,276.28<br />
50,442.51 56,128.68 62,061.94 67,871.65 73,681.36 79,491.07 85,300.78 91,110.49 96,920.20<br />
53,256.74 59,588.62 66,197.20 72,667.43 79,137.66 85,607.89 92,078.12 98,548.35 105,018.58<br />
56,164.84 63,188.22 70,520.20 77,697.88 84,875.56 92,053.24 99,230.92 106,408.60 113,586.29<br />
54,910.60 58,380.42 62,038.93 65,603.10 69,167.26 72,731.43 76,295.60 79,859.76 83,423.93<br />
63,731.53 68,585.45 73,708.02 78,696.26 83,684.50 88,672.74 93,660.98 98,649.23 103,637.47<br />
73,204.19 79,758.11 86,680.55 93,418.73 100,156.91 106,895.09 113,633.27 120,371.45 127,109.63<br />
83,390.00 91,989.44 101,079.38 109,924.08 118,768.77 127,613.46 136,458.15 145,302.85 154,147.54<br />
81,057.48 85,595.97 90,441.56 95,133.60 99,825.64 104,517.68 109,209.72 113,901.76 118,593.80 165,514.19<br />
89,439.48 95,140.90 101,232.78 107,129.43 113,026.08 118,922.73 124,819.38 130,716.03 136,612.68 195,579.17<br />
98,191.07 105,233.29 112,763.18 120,049.23 127,335.29 134,621.34 141,907.39 149,193.45 156,479.50 229,340.04<br />
107,336.45 115,908.90 125,081.15 133,953.50 142,825.85 151,698.20 160,570.56 169,442.91 178,315.26 267,038.77<br />
116,899.57 127,203.11 138,234.60 148,902.12 159,569.64 170,237.15 180,904.67 191,572.19 202,239.70 308,914.88<br />
113,578.38 119,363.26 125,619.45 131,639.98 137,660.51 143,681.04 149,701.58 155,722.11 161,742.64 221,947.97<br />
121,686.25 128,494.60 135,862.41 142,950.49 150,038.57 157,126.64 164,214.72 171,302.80 178,390.88 249,271.66<br />
130,026.07 137,968.67 146,569.25 154,840.85 163,112.44 171,384.03 179,655.63 187,927.22 196,198.81 278,914.74<br />
138,608.82 147,801.67 157,761.97 167,338.55 176,915.12 186,491.70 196,068.28 205,644.85 215,221.43 310,987.19<br />
147,445.42 158,009.70 169,462.39 180,470.88 191,479.36 202,487.85 213,496.33 224,504.82 235,513.30<br />
156,546.71 168,608.72 181,692.19 194,264.93 206,837.67 219,410.41 231,983.15 244,555.89 257,128.63<br />
133,227.61 138,378.16 144,013.16 149,405.93 154,798.71 160,191.48 165,584.26 170,977.03 176,369.81 230,297.56<br />
136,982.63 142,499.35 148,536.82 154,313.92 160,091.01 165,868.11 171,645.20 177,422.29 183,199.39 240,970.33<br />
140,772.41 146,671.77 153,129.99 159,308.78 165,487.56 171,666.35 177,845.14 184,023.93 190,202.71 251,990.59<br />
144,597.65 150,896.48 157,794.07 164,392.28 170,990.49 177,588.70 184,186.91 190,785.12 197,383.33 263,365.43<br />
148,459.05 155,174.51 162,530.48 169,566.19 176,601.91 183,637.62 190,673.34 197,709.05 204,744.77 275,101.91<br />
152,357.32 159,506.88 167,340.62 174,832.28 182,323.93 189,815.58 197,307.23 204,798.89 212,290.54 287,207.07<br />
156,293.16 163,894.64 172,225.91 180,192.28 188,158.66 196,125.03 204,091.41 212,057.79 220,024.16 299,687.92<br />
160,267.26 168,338.82 177,187.73 185,647.96 194,108.19 202,568.43 211,028.66 219,488.89 227,949.13 312,551.46<br />
164,280.33 172,840.43 182,227.48 191,201.06 200,174.63 209,148.20 218,121.78 227,095.35 236,068.92 325,804.66<br />
168,333.07 177,400.50 187,346.56 196,853.30 206,360.05 215,866.79 225,373.54 234,880.28 244,387.03 339,454.48<br />
176,560.29 186,700.09 197,828.23 208,462.19 219,096.16 229,730.12 240,364.09 250,998.06 261,632.02 367,971.68<br />
184,954.46 196,245.71 208,643.78 220,488.43 232,333.09 244,177.75 256,022.41 267,867.06 279,711.72<br />
189,215.86 201,113.30 214,180.19 226,662.36 239,144.52 251,626.69 264,108.85 276,591.01 289,073.18<br />
Pipe O&M Costs_Single_FINAL.xls, Pumping Cost Page 5 of 8 3/30/2007 3:01 PM
Diam<br />
(in)<br />
Annual<br />
Average<br />
Day Flow<br />
(mgd)<br />
Annual Average<br />
Day Flow (gpm)<br />
Peak<br />
Hourly<br />
Flow<br />
(mgd)<br />
Pipe Velocity at<br />
Peak Hourly Flow<br />
(ft/s)<br />
48 19.00 13186.00 57.00 7.02<br />
54 17.33 12029.33 52.00 5.06<br />
54 18.00 12492.00 54.00 5.25<br />
54 18.67 12954.67 56.00 5.45<br />
54 19.33 13417.33 58.00 5.64<br />
54 20.00 13880.00 60.00 5.84<br />
54 20.67 14342.67 62.00 6.03<br />
54 21.33 14805.33 64.00 6.23<br />
54 22.00 15268.00 66.00 6.42<br />
54 22.67 15730.67 68.00 6.61<br />
54 23.33 16193.33 70.00 6.81<br />
54 24.00 16656.00 72.00 7.00<br />
60 21.17 14689.67 63.50 5.00<br />
60 21.67 15036.67 65.00 5.12<br />
60 22.33 15499.33 67.00 5.28<br />
60 23.00 15962.00 69.00 5.44<br />
60 23.67 16424.67 71.00 5.59<br />
60 24.33 16887.33 73.00 5.75<br />
60 25.00 17350.00 75.00 5.91<br />
60 25.67 17812.67 77.00 6.07<br />
60 26.33 18275.33 79.00 6.22<br />
60 27.00 18738.00 81.00 6.38<br />
60 27.67 19200.67 83.00 6.54<br />
60 28.33 19663.33 85.00 6.70<br />
60 29.00 20126.00 87.00 6.86<br />
60 30.00 20820.00 90.00 7.09<br />
Pumping Power Cost Curves <strong>for</strong> Reclaimed <strong>Water</strong> Conveyance<br />
Power Cost ($/year) <strong>for</strong> Pipe Length Listed (miles)<br />
1 1.5 2 2.5 3 3.5 4 4.5 5 10<br />
197,870.74 211,043.08 225,517.15 239,340.36 253,163.57 266,986.77 280,809.98 294,633.19 308,456.40<br />
167,342.81 173,059.53 179,393.26 185,418.48 191,443.70 197,468.93 203,494.15 209,519.38 215,544.60 275,796.84<br />
174,687.91 181,053.81 188,110.68 194,822.07 201,533.45 208,244.83 214,956.22 221,667.60 228,378.99 295,492.83<br />
182,130.79 189,191.90 197,023.64 204,470.07 211,916.50 219,362.93 226,809.36 234,255.79 241,702.21 316,166.50<br />
189,674.53 197,478.34 206,138.34 214,370.25 222,602.16 230,834.07 239,065.98 247,297.89 255,529.79 337,848.88<br />
197,322.23 205,917.67 215,460.96 224,530.32 233,599.69 242,669.06 251,738.42 260,807.79 269,877.15 360,570.81<br />
205,076.95 214,514.38 224,997.63 234,957.97 244,918.30 254,878.64 264,838.98 274,799.32 284,759.65 384,363.03<br />
212,941.76 223,272.95 234,754.47 245,660.82 256,567.17 267,473.52 278,379.87 289,286.23 300,192.58 409,256.10<br />
220,919.70 232,197.84 244,737.56 256,646.49 268,555.42 280,464.35 292,373.28 304,282.21 316,191.14 435,280.44<br />
229,013.80 241,293.50 254,952.98 267,922.56 280,892.15 293,861.74 306,831.32 319,800.91 332,770.50<br />
237,227.07 250,564.33 265,406.74 279,496.57 293,586.40 307,676.24 321,766.07 335,855.90 349,945.73<br />
245,562.53 260,014.76 276,104.86 291,376.03 306,647.20 321,918.36 337,189.53 352,460.70 367,731.87<br />
202,474.55 208,525.30 215,313.23 221,732.58 228,151.92 234,571.26 240,990.60 247,409.94 253,829.29 318,022.70<br />
207,840.25 214,307.31 221,565.05 228,427.45 235,289.84 242,152.24 249,014.64 255,877.04 262,739.44 331,363.42<br />
215,055.07 222,105.53 230,021.91 237,505.33 244,988.75 252,472.17 259,955.58 267,439.00 274,922.42 349,756.61<br />
222,340.77 230,007.75 238,620.53 246,760.40 254,900.28 263,040.16 271,180.04 279,319.91 287,459.79 368,858.56<br />
229,699.17 238,016.62 247,364.53 256,197.21 265,029.89 273,862.58 282,695.26 291,527.94 300,360.62 388,687.44<br />
237,132.06 246,134.79 256,257.53 265,820.27 275,383.01 284,945.75 294,508.48 304,071.22 313,633.96 409,261.33<br />
244,641.25 254,364.89 265,303.14 275,634.08 285,965.03 296,295.97 306,626.91 316,957.86 327,288.80 430,598.23<br />
252,228.55 262,709.55 274,504.94 285,643.14 296,781.34 307,919.53 319,057.73 330,195.93 341,334.13 452,716.10<br />
259,895.72 271,171.37 283,866.51 295,851.90 307,837.30 319,822.69 331,808.08 343,793.48 355,778.87 475,632.81<br />
267,644.56 279,752.95 293,391.41 306,264.83 319,138.25 332,011.67 344,885.10 357,758.52 370,631.94 499,366.16<br />
275,476.84 288,456.90 303,083.18 316,886.35 330,689.53 344,492.70 358,295.87 372,099.04 385,902.21<br />
283,394.33 297,285.80 312,945.38 327,720.90 342,496.43 357,271.95 372,047.48 386,823.00 401,598.52<br />
291,398.79 306,242.21 322,981.52 338,772.88 354,564.25 370,355.61 386,146.97 401,938.33 417,729.70<br />
303,572.40 319,921.55 338,369.56 355,768.14 373,166.72 390,565.30 407,963.88 425,362.46 442,761.04<br />
Pipe O&M Costs_Single_FINAL.xls, Pumping Cost Page 6 of 8 3/30/2007 3:01 PM
Annual<br />
Average<br />
Day Flow<br />
(mgd)<br />
Peak<br />
Hourly<br />
Flow<br />
Pipe Velocity at<br />
Peak Hourly Flow<br />
(ft/s)<br />
Diam<br />
Annual Average<br />
(in)<br />
Day Flow (gpm) (mgd)<br />
4 0.10 69.40 0.30 5.32<br />
6 0.20 138.80 0.60 4.73<br />
6 0.27 185.07 0.80 6.30<br />
8 0.40 277.60 1.20 5.32<br />
8 0.47 323.87 1.40 6.21<br />
8 0.53 370.13 1.60 7.09<br />
10 0.60 416.40 1.80 5.11<br />
10 0.67 462.67 2.00 5.67<br />
10 0.83 578.33 2.50 7.09<br />
12 0.93 647.73 2.80 5.52<br />
12 1.00 694.00 3.00 5.91<br />
12 1.17 809.67 3.50 6.89<br />
14 1.33 925.33 4.00 5.79<br />
14 1.50 1041.00 4.50 6.51<br />
14 1.67 1156.67 5.00 7.24<br />
16 1.83 1272.33 5.50 6.09<br />
16 2.00 1388.00 6.00 6.65<br />
16 2.07 1434.27 6.20 6.87<br />
18 2.17 1503.67 6.50 5.69<br />
18 2.33 1619.33 7.00 6.13<br />
18 2.50 1735.00 7.50 6.57<br />
18 2.67 1850.67 8.00 7.00<br />
20 2.83 1966.33 8.50 6.03<br />
20 3.00 2082.00 9.00 6.38<br />
20 3.17 2197.67 9.50 6.74<br />
20 3.33 2313.33 10.00 7.09<br />
24 3.50 2429.00 10.50 5.17<br />
24 3.67 2544.67 11.00 5.42<br />
24 3.83 2660.33 11.50 5.66<br />
24 4.00 2776.00 12.00 5.91<br />
24 4.17 2891.67 12.50 6.16<br />
24 4.33 3007.33 13.00 6.40<br />
24 4.50 3123.00 13.50 6.65<br />
24 4.67 3238.67 14.00 6.89<br />
30 5.33 3701.33 16.00 5.04<br />
30 6.00 4164.00 18.00 5.67<br />
30 6.67 4626.67 20.00 6.30<br />
30 7.33 5089.33 22.00 6.93<br />
36 8.00 5552.00 24.00 5.25<br />
36 8.67 6014.67 26.00 5.69<br />
36 9.33 6477.33 28.00 6.13<br />
36 10.00 6940.00 30.00 6.57<br />
36 10.67 7402.67 32.00 7.00<br />
42 11.33 7865.33 34.00 5.47<br />
42 12.00 8328.00 36.00 5.79<br />
42 12.67 8790.67 38.00 6.11<br />
42 13.33 9253.33 40.00 6.43<br />
42 14.00 9716.00 42.00 6.75<br />
42 14.67 10178.67 44.00 7.08<br />
48 13.67 9484.67 41.00 5.05<br />
48 14.00 9716.00 42.00 5.17<br />
48 14.33 9947.33 43.00 5.29<br />
48 14.67 10178.67 44.00 5.42<br />
48 15.00 10410.00 45.00 5.54<br />
48 15.33 10641.33 46.00 5.66<br />
48 15.67 10872.67 47.00 5.79<br />
48 16.00 11104.00 48.00 5.91<br />
48 16.33 11335.33 49.00 6.03<br />
48 16.67 11566.67 50.00 6.16<br />
48 17.33 12029.33 52.00 6.40<br />
48 18.00 12492.00 54.00 6.65<br />
48 18.33 12723.33 55.00 6.77<br />
Pumping Power Cost Curves <strong>for</strong> Reclaimed <strong>Water</strong> Conveyance<br />
Power Cost of Service ($/1000 gallons) <strong>for</strong> Pipe Length Listed (miles)<br />
1 1.5 2 2.5 3 3.5 4 4.5 5 10<br />
0.066<br />
0.045 0.056 0.066<br />
0.060 0.077<br />
0.043 0.052 0.061 0.071<br />
0.049 0.061 0.074<br />
0.056 0.072 0.087<br />
0.038 0.044 0.051 0.058 0.064<br />
0.041 0.049 0.057 0.065<br />
0.049 0.061 0.073 0.085<br />
0.037 0.043 0.049 0.055 0.062<br />
0.039 0.046 0.053 0.060 0.067<br />
0.043 0.052 0.062 0.071<br />
0.036 0.041 0.047 0.053 0.059<br />
0.039 0.046 0.053 0.060 0.067<br />
0.042 0.050 0.059 0.067<br />
0.035 0.040 0.046 0.051 0.057<br />
0.037 0.043 0.050 0.056 0.062<br />
0.038 0.044 0.051 0.058 0.065<br />
0.033 0.037 0.041 0.045 0.049 0.053 0.057 0.061<br />
0.034 0.039 0.043 0.048 0.053 0.058 0.062 0.067<br />
0.035 0.041 0.046 0.051 0.057 0.062 0.067<br />
0.037 0.043 0.049 0.055 0.061 0.067 0.073<br />
0.033 0.037 0.041 0.045 0.049 0.053 0.057 0.061<br />
0.034 0.038 0.043 0.047 0.052 0.056 0.061 0.065<br />
0.034 0.039 0.044 0.049 0.054 0.059 0.064<br />
0.035 0.041 0.046 0.052 0.057 0.063 0.068<br />
0.029 0.032 0.034 0.037 0.039 0.042 0.044 0.047 0.049<br />
0.030 0.033 0.035 0.038 0.041 0.043 0.046 0.049 0.051<br />
0.030 0.033 0.036 0.039 0.042 0.045 0.048 0.051 0.054<br />
0.031 0.034 0.037 0.040 0.044 0.047 0.050 0.053 0.056<br />
0.031 0.035 0.038 0.042 0.045 0.048 0.052 0.055 0.059<br />
0.032 0.035 0.039 0.043 0.047 0.050 0.054 0.058 0.061<br />
0.032 0.036 0.040 0.044 0.048 0.052 0.056 0.060 0.064<br />
0.033 0.037 0.041 0.046 0.050 0.054 0.058 0.062 0.067<br />
0.028 0.030 0.032 0.034 0.036 0.037 0.039 0.041 0.043<br />
0.029 0.031 0.034 0.036 0.038 0.040 0.043 0.045 0.047<br />
0.030 0.033 0.036 0.038 0.041 0.044 0.047 0.049 0.052<br />
0.031 0.034 0.038 0.041 0.044 0.048 0.051 0.054 0.058<br />
0.028 0.029 0.031 0.033 0.034 0.036 0.037 0.039 0.041 0.057<br />
0.028 0.030 0.032 0.034 0.036 0.038 0.039 0.041 0.043 0.062<br />
0.029 0.031 0.033 0.035 0.037 0.040 0.042 0.044 0.046 0.067<br />
0.029 0.032 0.034 0.037 0.039 0.042 0.044 0.046 0.049 0.073<br />
0.030 0.033 0.036 0.038 0.041 0.044 0.046 0.049 0.052 0.079<br />
0.027 0.029 0.030 0.032 0.033 0.035 0.036 0.038 0.039 0.054<br />
0.028 0.029 0.031 0.033 0.034 0.036 0.037 0.039 0.041 0.057<br />
0.028 0.030 0.032 0.033 0.035 0.037 0.039 0.041 0.042 0.060<br />
0.028 0.030 0.032 0.034 0.036 0.038 0.040 0.042 0.044 0.064<br />
0.029 0.031 0.033 0.035 0.037 0.040 0.042 0.044 0.046<br />
0.029 0.031 0.034 0.036 0.039 0.041 0.043 0.046 0.048<br />
0.027 0.028 0.029 0.030 0.031 0.032 0.033 0.034 0.035 0.046<br />
0.027 0.028 0.029 0.030 0.031 0.032 0.034 0.035 0.036 0.047<br />
0.027 0.028 0.029 0.030 0.032 0.033 0.034 0.035 0.036 0.048<br />
0.027 0.028 0.029 0.031 0.032 0.033 0.034 0.036 0.037 0.049<br />
0.027 0.028 0.030 0.031 0.032 0.034 0.035 0.036 0.037 0.050<br />
0.027 0.029 0.030 0.031 0.033 0.034 0.035 0.037 0.038 0.051<br />
0.027 0.029 0.030 0.032 0.033 0.034 0.036 0.037 0.038 0.052<br />
0.027 0.029 0.030 0.032 0.033 0.035 0.036 0.038 0.039 0.054<br />
0.028 0.029 0.031 0.032 0.034 0.035 0.037 0.038 0.040 0.055<br />
0.028 0.029 0.031 0.032 0.034 0.035 0.037 0.039 0.040 0.056<br />
0.028 0.030 0.031 0.033 0.035 0.036 0.038 0.040 0.041 0.058<br />
0.028 0.030 0.032 0.034 0.035 0.037 0.039 0.041 0.043<br />
0.028 0.030 0.032 0.034 0.036 0.038 0.039 0.041 0.043<br />
Pipe O&M Costs_Single_FINAL.xls, Pumping Cost Page 7 of 8 3/30/2007 3:01 PM
Diam<br />
(in)<br />
Annual<br />
Average<br />
Day Flow<br />
(mgd)<br />
Annual Average<br />
Day Flow (gpm)<br />
Peak<br />
Hourly<br />
Flow<br />
(mgd)<br />
Pipe Velocity at<br />
Peak Hourly Flow<br />
(ft/s)<br />
48 19.00 13186.00 57.00 7.02<br />
54 17.33 12029.33 52.00 5.06<br />
54 18.00 12492.00 54.00 5.25<br />
54 18.67 12954.67 56.00 5.45<br />
54 19.33 13417.33 58.00 5.64<br />
54 20.00 13880.00 60.00 5.84<br />
54 20.67 14342.67 62.00 6.03<br />
54 21.33 14805.33 64.00 6.23<br />
54 22.00 15268.00 66.00 6.42<br />
54 22.67 15730.67 68.00 6.61<br />
54 23.33 16193.33 70.00 6.81<br />
54 24.00 16656.00 72.00 7.00<br />
60 21.17 14689.67 63.50 5.00<br />
60 21.67 15036.67 65.00 5.12<br />
60 22.33 15499.33 67.00 5.28<br />
60 23.00 15962.00 69.00 5.44<br />
60 23.67 16424.67 71.00 5.59<br />
60 24.33 16887.33 73.00 5.75<br />
60 25.00 17350.00 75.00 5.91<br />
60 25.67 17812.67 77.00 6.07<br />
60 26.33 18275.33 79.00 6.22<br />
60 27.00 18738.00 81.00 6.38<br />
60 27.67 19200.67 83.00 6.54<br />
60 28.33 19663.33 85.00 6.70<br />
60 29.00 20126.00 87.00 6.86<br />
60 30.00 20820.00 90.00 7.09<br />
Pumping Power Cost Curves <strong>for</strong> Reclaimed <strong>Water</strong> Conveyance<br />
Power Cost of Service ($/1000 gallons) <strong>for</strong> Pipe Length Listed (miles)<br />
1 1.5 2 2.5 3 3.5 4 4.5 5 10<br />
0.029 0.030 0.033 0.035 0.037 0.038 0.040 0.042 0.044<br />
0.026 0.027 0.028 0.029 0.030 0.031 0.032 0.033 0.034 0.044<br />
0.027 0.028 0.029 0.030 0.031 0.032 0.033 0.034 0.035 0.045<br />
0.027 0.028 0.029 0.030 0.031 0.032 0.033 0.034 0.035 0.046<br />
0.027 0.028 0.029 0.030 0.032 0.033 0.034 0.035 0.036 0.048<br />
0.027 0.028 0.030 0.031 0.032 0.033 0.034 0.036 0.037 0.049<br />
0.027 0.028 0.030 0.031 0.032 0.034 0.035 0.036 0.038 0.051<br />
0.027 0.029 0.030 0.032 0.033 0.034 0.036 0.037 0.039 0.053<br />
0.028 0.029 0.030 0.032 0.033 0.035 0.036 0.038 0.039 0.054<br />
0.028 0.029 0.031 0.032 0.034 0.036 0.037 0.039 0.040<br />
0.028 0.029 0.031 0.033 0.034 0.036 0.038 0.039 0.041<br />
0.028 0.030 0.032 0.033 0.035 0.037 0.038 0.040 0.042<br />
0.026 0.027 0.028 0.029 0.030 0.030 0.031 0.032 0.033 0.041<br />
0.026 0.027 0.028 0.029 0.030 0.031 0.031 0.032 0.033 0.042<br />
0.026 0.027 0.028 0.029 0.030 0.031 0.032 0.033 0.034 0.043<br />
0.026 0.027 0.028 0.029 0.030 0.031 0.032 0.033 0.034 0.044<br />
0.027 0.028 0.029 0.030 0.031 0.032 0.033 0.034 0.035 0.045<br />
0.027 0.028 0.029 0.030 0.031 0.032 0.033 0.034 0.035 0.046<br />
0.027 0.028 0.029 0.030 0.031 0.032 0.034 0.035 0.036 0.047<br />
0.027 0.028 0.029 0.030 0.032 0.033 0.034 0.035 0.036 0.048<br />
0.027 0.028 0.030 0.031 0.032 0.033 0.035 0.036 0.037 0.049<br />
0.027 0.028 0.030 0.031 0.032 0.034 0.035 0.036 0.038 0.051<br />
0.027 0.029 0.030 0.031 0.033 0.034 0.035 0.037 0.038<br />
0.027 0.029 0.030 0.032 0.033 0.035 0.036 0.037 0.039<br />
0.028 0.029 0.031 0.032 0.033 0.035 0.036 0.038 0.039<br />
0.028 0.029 0.031 0.032 0.034 0.036 0.037 0.039 0.040<br />
Pipe O&M Costs_Single_FINAL.xls, Pumping Cost Page 8 of 8 3/30/2007 3:01 PM
Pumping Cost, $/yr<br />
600,000<br />
500,000<br />
400,000<br />
300,000<br />
200,000<br />
100,000<br />
Transmission, 10 mile:<br />
Transmission, 4<br />
miles:<br />
Transmission, 3<br />
miles:<br />
Transmission, 2.5<br />
miles:<br />
Pumping Cost <strong>for</strong> Reclaimed <strong>Water</strong> Transmission<br />
y = 45351x 0.6878<br />
R 2 = 0.8072<br />
y = 28371x 0.7295<br />
R 2 = 0.9633<br />
y = 23136x 0.7776<br />
R 2 = 0.9871<br />
y = 22336x 0.765<br />
R 2 = 0.9825<br />
Transmission, 5<br />
miles:<br />
y = 27388x 0.7756<br />
R 2 = 0.9553<br />
y = 24654x 0.7707<br />
R 2 Transmission, 3.5 miles:<br />
= 0.9759<br />
Transmission, 4.5 miles:<br />
Transmission, 2 miles:<br />
y = 26885x 0.7687<br />
R 2 = 0.97<br />
y = 19674x 0.7996<br />
R 2 = 0.9913<br />
y = 17283x 0.8247<br />
R 2 y = 14736x<br />
= 0.9937<br />
0.8629<br />
R 2 Transmission, 1.5 miles: Transmission, 1 mile:<br />
= 0.9964<br />
0<br />
0 1 2 3 4 5 6 7 8 9 10 11 12 13 14 15 16 17 18 19 20 21 22 23 24 25 26 27 28 29 30<br />
Transmission, 1 mile Transmission, 1.5 mile<br />
Flow, mgd<br />
Transmission, 2 mile Transmission, 2.5 mile<br />
Transmission, 3 mile Transmission, 3.5 mile Transmission, 4 mile Transmission, 4.5 mile<br />
Transmission, 5 mile Transmission, 10 mile Power (Transmission, 10 mile) Power (Transmission, 5 mile)<br />
Power (Transmission, 4.5 mile) Power (Transmission, 4 mile) Power (Transmission, 3.5 mile) Power (Transmission, 3 mile)<br />
Power (Transmission, 2.5 mile) Power (Transmission, 2 mile) Power (Transmission, 1.5 mile) Power (Transmission, 1 mile)
Pumping Cost, $/1000 gallons<br />
0.095<br />
0.085<br />
0.075<br />
0.065<br />
0.055<br />
0.045<br />
0.035<br />
0.025<br />
Pumping Cost <strong>for</strong> Reclaimed <strong>Water</strong> Transmission<br />
y = 0.0404x -0.1371<br />
R 2 y = 0.0473x<br />
= 0.8744<br />
-0.1741<br />
R 2 = 0.8742<br />
y = 0.0539x -0.2004<br />
R 2 = 0.8768<br />
y = 0.0597x -0.2186<br />
R 2 = 0.8736<br />
y = 0.0634x -0.2224<br />
R 2 y = 0.0675x<br />
= 0.8623<br />
-0.2293<br />
R 2 Transmission, 1 mile: Transmission, 1.5 miles: Transmission, 2 miles:<br />
Transmission, 2.5 miles:<br />
Transmission, 3 miles:<br />
Transmission, 3.5 miles:<br />
= 0.7816<br />
Transmission, 4 miles:<br />
y = 0.0741x -0.2473<br />
R 2 = 0.782<br />
Transmission, 4.5 miles:<br />
y = 0.0737x -0.2313<br />
R 2 = 0.7456<br />
y = 0.075x -0.2244<br />
R 2 Transmission, 5 miles:<br />
= 0.6412<br />
Transmission, 10 miles:<br />
y = 0.1243x -0.3122<br />
R 2 = 0.4631<br />
0 1 2 3 4 5 6 7 8 9 10 11 12 13 14 15 16 17 18 19 20 21 22 23 24 25 26 27 28 29 30<br />
Transmission, 1 mile Transmission, 1.5 mile<br />
Flow, mgd<br />
Transmission, 2 mile Transmission, 2.5 mile<br />
Transmission, 3 mile Transmission, 3.5 mile Transmission, 4 mile Transmission, 4.5 mile<br />
Transmission, 5 mile Transmission, 10 mile Power (Transmission, 1 mile) Power (Transmission, 1.5 mile)<br />
Power (Transmission, 2 mile) Power (Transmission, 2.5 mile) Power (Transmission, 4 mile) Power (Transmission, 3 mile)<br />
Power (Transmission, 3.5 mile) Power (Transmission, 4.5 mile) Power (Transmission, 5 mile) Power (Transmission, 10 mile)
Appendix C<br />
<strong>Water</strong> Reuse System Cost Model<br />
Base System Cost of Service<br />
Summary Tables
<strong>Water</strong> Reuse System Estimated Cost of Service, $/1000 gallons<br />
BASE SYSTEM<br />
Pipe Length, Miles<br />
Flow, mgd 1 1.5 2 2.5 3 3.5 4 4.5 5 10<br />
0.1 3.72 4.37 5.02 5.68 6.31 6.96 7.60 8.24 8.88 15.37<br />
0.25 1.68 1.96 2.24 2.52 2.79 3.07 3.35 3.62 3.89 6.67<br />
0.5 0.99 1.15 1.31 1.46 1.61 1.77 1.92 2.07 2.22 3.76<br />
0.75 0.73 0.85 0.96 1.08 1.19 1.30 1.42 1.52 1.63 2.75<br />
1 0.62 0.71 0.80 0.90 0.99 1.08 1.17 1.25 1.34 2.26<br />
1.25 0.54 0.62 0.70 0.79 0.86 0.94 1.02 1.10 1.17 1.96<br />
1.5 0.50 0.57 0.64 0.71 0.78 0.85 0.93 0.99 1.06 1.76<br />
1.75 0.46 0.53 0.59 0.66 0.72 0.79 0.86 0.91 0.97 1.61<br />
2 0.44 0.50 0.56 0.62 0.68 0.74 0.80 0.85 0.91 1.51<br />
2.5 0.40 0.45 0.51 0.56 0.61 0.67 0.73 0.77 0.82 1.35<br />
3 0.37 0.42 0.47 0.52 0.57 0.62 0.68 0.72 0.77 1.25<br />
3.5 0.36 0.40 0.45 0.50 0.54 0.59 0.64 0.68 0.72 1.18<br />
4 0.34 0.39 0.43 0.48 0.52 0.56 0.61 0.65 0.69 1.12<br />
4.5 0.33 0.38 0.42 0.46 0.50 0.54 0.59 0.63 0.67 1.08<br />
5 0.33 0.37 0.42 0.46 0.50 0.54 0.59 0.63 0.67 1.09<br />
10 0.26 0.29 0.32 0.35 0.38 0.41 0.44 0.46 0.49 0.78<br />
15 0.24 0.26 0.29 0.31 0.34 0.36 0.40 0.41 0.44 0.68<br />
30 0.22 0.24 0.26 0.28 0.30 0.32 0.35 0.36 0.38 0.58<br />
Total Reuse System Costs_BASE-043007.xls, Cost of Service Summary CURVES 5/2/2007
<strong>Water</strong> Reuse System Estimates of Probable Cost - Capital and Operation and Maintenance<br />
Base System<br />
Treatment Facilities<br />
Total System-1 mile Total System-5 mile<br />
Flow, mgd Capital, $ O&M, $ Capital, $ O&M, $ Capital, $ O&M, $<br />
0.1 110,000 27,000 701,100 81,600 2,822,700 106,200<br />
0.25 125,000 29,900 843,300 87,900 3,109,400 114,700<br />
0.5 150,000 34,700 1,080,300 97,900 3,587,300 127,800<br />
0.75 172,500 39,400 1,223,700 106,600 3,971,600 139,000<br />
1 180,000 43,400 1,412,900 115,800 4,401,700 150,400<br />
1.25 187,500 47,400 1,602,000 124,600 4,831,700 161,300<br />
1.5 195,000 51,300 1,791,200 133,300 5,261,700 171,900<br />
1.75 202,500 55,300 1,980,300 141,900 5,691,800 182,300<br />
2 210,000 59,200 2,169,400 150,500 6,121,800 192,600<br />
2.5 225,000 67,200 2,547,700 167,500 6,981,900 212,700<br />
3 240,000 75,100 2,926,000 184,300 7,841,900 232,500<br />
3.5 255,000 83,000 3,304,200 201,000 8,702,000 252,000<br />
4 270,000 90,900 3,682,500 217,700 9,562,100 271,200<br />
4.5 285,000 98,800 4,060,800 234,200 10,422,100 290,200<br />
5 300,000 106,800 4,540,400 250,600 11,789,100 309,000<br />
10 400,000 183,500 6,965,900 403,100 17,041,900 481,000<br />
15 475,000 258,900 9,771,200 555,900 22,674,300 649,100<br />
30 700,000 485,300 18,187,000 999,900 39,571,700 1,127,600<br />
Total Reuse System Costs_BASE-070707.xls, Cap_O&M Cost Summary 7/7/2007
WATER REUSE SYSTEM COST OF SERVICE TABLE BASE SYSTEM<br />
Blue = Values to input<br />
Capital Cost and Debt Financing Assumptions General Items Maintenance<br />
Total Capital Cost Variable Lab Costs, $ $20,000 Pump System Labor, hrs/wk 4<br />
Amount of Grant Funding $0 Sodium Hypochloride, $/gal of 12.5% 0.70 Pump System Equip, % capital 1%<br />
<strong>Municipal</strong> % of Up-Front Capital 100% Chlorine Dose, mg/L (year-round, see Note A) 7 Treatment Facilities, % capital 5%<br />
Other % of Up-Front Capital 0% Electrical Power, $/kwhr 0.045 Distribution System, $/mile 5500<br />
Debt Term (Years) 20<br />
Annual Interest Rate 5.00% FTE Annual Salary with Benefits, $<br />
Issuance Costs, % of Capital 1% Finance, Operations, Cust Service $80,000<br />
Legal $150,000<br />
Engineering $100,000<br />
Annual Avg Flow/Demand (MGD)<br />
0.1 0.25 0.5 0.75 1 1.25 1.5 1.75<br />
Length of Distribution System (mi) 1.0 Year 1 Cost, $ $/1000 gallons Year 1 Cost, $ $/1000 gallons Year 1 Cost, $ $/1000 gallons Year 1 Cost, $ $/1000 gallons Year 1 Cost, $ $/1000 gallons Year 1 Cost, $ $/1000 gallons Year 1 Cost, $ $/1000 gallons Year 1 Cost, $ $/1000 gallons<br />
Summary of Capital Cost Estimates<br />
Description Capital Cost Capital Cost Capital Cost Capital Cost Capital Cost Capital Cost Capital Cost Capital Cost<br />
Treatment Facilities $110,000 $125,000 $150,000 $172,500 $180,000 $187,500 $195,000 $202,500<br />
Storage Facilities $0 $0 $0 $0 $0 $0 $0 $0<br />
Pump Station $60,704 $151,759 $303,519 $364,223 $485,630 $607,038 $728,446 $849,853<br />
Piping $530,385 $566,521 $626,749 $686,976 $747,203 $807,430 $867,658 $927,885<br />
TOTAL CAPITAL $701,089 $843,281 $1,080,267 $1,223,699 $1,412,833 $1,601,968 $1,791,103 $1,980,238<br />
Cost Components Basis/Methodology<br />
CAPITAL Debt Service (Capital Cost)<br />
Pumping System<br />
Based on debt service payment $54,114 $1.48 $65,089 $0.71 $83,381 $0.46 $94,452 $0.35 $109,051 $0.30 $123,649 $0.27 $138,248 $0.25 $152,846 $0.24<br />
Maintenance Labor hours/week at operator rate input-see Note B $8,000 $0.22 $8,000 $0.09 $8,000 $0.04 $8,000 $0.03 $8,800 $0.02 $8,800 $0.02 $8,800 $0.02 $8,800 $0.01<br />
Equipment Maintenance Based on % of capital cost input $607 $0.02 $1,518 $0.02 $3,035 $0.02 $3,642 $0.01 $4,856 $0.01 $6,070 $0.01 $7,284 $0.01 $8,499 $0.01<br />
OPERATION Electrical Power Based on per Kwh rate input; see Note C $2,021 $0.06 $4,455 $0.05 $8,103 $0.04 $11,497 $0.04 $14,736 $0.04 $17,865 $0.04 $20,909 $0.04 $23,883 $0.04<br />
AND Reuse Treatment at WWTP<br />
MAINTENANCE Chlorine Disinfection $/gallon at %Conc input; see Note A $1,434 $0.04 $3,586 $0.04 $7,171 $0.04 $10,757 $0.04 $14,342 $0.04 $17,928 $0.04 $21,514 $0.04 $25,099 $0.04<br />
Other From Treatment Module $0 $0.00 $0 $0.00 $0 $0.00 $0 $0.00 $0 $0.00 $0 $0.00 $0 $0.00 $0 $0.00<br />
Laboratory Lab cost input $20,000 $0.55 $20,000 $0.22 $20,000 $0.11 $20,000 $0.07 $20,000 $0.05 $20,000 $0.04 $20,000 $0.04 $20,000 $0.03<br />
Electrical Power From Treatment Module $0 $0.00 $0 $0.00 $0 $0.00 $0 $0.00 $0 $0.00 $0 $0.00 $0 $0.00 $0 $0.00<br />
Equipment Maintenance&Labor Based on % of capital cost input $5,500 $0.15 $6,250 $0.07 $7,500 $0.04 $8,625 $0.03 $9,000 $0.02 $9,375 $0.02 $9,750 $0.02 $10,125 $0.02<br />
Distribution System Maintenance<br />
General System Management<br />
Equals water system cost/mile-see Note B $5,500 $0.15 $5,500 $0.06 $5,500 $0.03 $5,500 $0.02 $5,500 $0.02 $5,500 $0.01 $5,500 $0.01 $5,500 $0.01<br />
GENERAL Engineering 0.15 FTE base; .05% increase per mgd $15,000 $0.41 $15,000 $0.16 $15,000 $0.08 $15,000 $0.05 $15,000 $0.04 $15,188 $0.03 $15,375 $0.03 $15,563 $0.02<br />
AND Finance and Accounting 0.15 FTE $12,000 $0.33 $12,000 $0.13 $12,000 $0.07 $12,000 $0.04 $12,000 $0.03 $12,150 $0.03 $12,300 $0.02 $12,450 $0.02<br />
ADMINISTRATIVE Legal 0.05 FTE $7,500 $0.21 $7,500 $0.08 $7,500 $0.04 $7,500 $0.03 $7,500 $0.02 $7,594 $0.02 $7,688 $0.01 $7,781 $0.01<br />
Customer Service 0.05 FTE $4,000 $0.11 $4,000 $0.04 $4,000 $0.02 $4,000 $0.01 $4,000 $0.01 $4,050 $0.01 $4,100 $0.01 $4,150 $0.01<br />
TOTAL OF ALL COST COMPONENTS FOR RECLAIMED WATER: $3.72 $1.68 $0.99 $0.73 $0.62 $0.54 $0.50 $0.46<br />
Annual Avg Flow/Demand (MGD)<br />
0.1 0.25 0.5 0.75 1 1.25 1.5 1.75<br />
Length of Distribution System (mi) 1.5 Year 1 Cost, $ $/1000 gallons Year 1 Cost, $ $/1000 gallons Year 1 Cost, $ $/1000 gallons Year 1 Cost, $ $/1000 gallons Year 1 Cost, $ $/1000 gallons Year 1 Cost, $ $/1000 gallons Year 1 Cost, $ $/1000 gallons Year 1 Cost, $ $/1000 gallons<br />
Summary of Capital Cost Estimates<br />
Description Capital Cost Capital Cost Capital Cost Capital Cost Capital Cost Capital Cost Capital Cost Capital Cost<br />
Treatment Facilities $110,000 $125,000 $150,000 $172,500 $180,000 $187,500 $195,000 $202,500<br />
Storage Facilities $0 $0 $0 $0 $0 $0 $0 $0<br />
Pump Station $60,704 $151,759 $303,519 $364,223 $485,630 $607,038 $728,446 $849,853<br />
Piping $795,576 $849,781 $940,122 $1,030,463 $1,120,804 $1,211,145 $1,301,486 $1,391,827<br />
TOTAL CAPITAL $966,280 $1,126,540 $1,393,641 $1,567,186 $1,786,434 $2,005,683 $2,224,932 $2,444,180<br />
Cost Components Basis/Methodology<br />
CAPITAL Debt Service (Capital Cost) Based on debt service payment $74,583 $2.04 $86,953 $0.95 $107,569 $0.59 $120,964 $0.44 $137,887 $0.38 $154,810 $0.34 $171,733 $0.31 $188,656 $0.30<br />
Pumping System<br />
Maintenance Labor hours/week at operator rate input-see Note B $8,000 $0.22 $8,000 $0.09 $8,000 $0.04 $8,000 $0.03 $8,800 $0.02 $8,800 $0.02 $8,800 $0.02 $8,800 $0.01<br />
Equipment Maintenance Based on % of capital cost input $607 $0.02 $1,518 $0.02 $3,035 $0.02 $3,642 $0.01 $4,856 $0.01 $6,070 $0.01 $7,284 $0.01 $8,499 $0.01<br />
OPERATION Electrical Power Based on per Kwh rate input; see Note C $2,588 $0.07 $5,509 $0.06 $9,758 $0.05 $13,633 $0.05 $17,283 $0.05 $20,775 $0.05 $24,146 $0.04 $27,419 $0.04<br />
AND Reuse Treatment at WWTP<br />
MAINTENANCE Chlorine Disinfection $/gallon at %Conc input; see Note A $1,434 $0.04 $3,586 $0.04 $7,171 $0.04 $10,757 $0.04 $14,342 $0.04 $17,928 $0.04 $21,514 $0.04 $25,099 $0.04<br />
Other From Treatment Module $0 $0.00 $0 $0.00 $0 $0.00 $0 $0.00 $0 $0.00 $0 $0.00 $0 $0.00 $0 $0.00<br />
Laboratory Lab cost input $20,000 $0.55 $20,000 $0.22 $20,000 $0.11 $20,000 $0.07 $20,000 $0.05 $20,000 $0.04 $20,000 $0.04 $20,000 $0.03<br />
Electrical Power From Treatment Module $0 $0.00 $0 $0.00 $0 $0.00 $0 $0.00 $0 $0.00 $0 $0.00 $0 $0.00 $0 $0.00<br />
Equipment Maintenance&Labor Based on % of capital cost input $5,500 $0.15 $6,250 $0.07 $7,500 $0.04 $8,625 $0.03 $9,000 $0.02 $9,375 $0.02 $9,750 $0.02 $10,125 $0.02<br />
Distribution System Maintenance Equals water system cost/mile-see Note B $8,250 $0.23 $8,250 $0.09 $8,250 $0.05 $8,250 $0.03 $8,250 $0.02 $8,250 $0.02 $8,250 $0.02 $8,250 $0.01<br />
General System Management<br />
GENERAL Engineering 0.15 FTE base; .05% increase per mgd $15,000 $0.41 $15,000 $0.16 $15,000 $0.08 $15,000 $0.05 $15,000 $0.04 $15,188 $0.03 $15,375 $0.03 $15,563 $0.02<br />
AND Finance and Accounting 0.15 FTE $12,000 $0.33 $12,000 $0.13 $12,000 $0.07 $12,000 $0.04 $12,000 $0.03 $12,150 $0.03 $12,300 $0.02 $12,450 $0.02<br />
ADMINISTRATIVE Legal 0.05 FTE $7,500 $0.21 $7,500 $0.08 $7,500 $0.04 $7,500 $0.03 $7,500 $0.02 $7,594 $0.02 $7,688 $0.01 $7,781 $0.01<br />
Customer Service 0.05 FTE $4,000 $0.11 $4,000 $0.04 $4,000 $0.02 $4,000 $0.01 $4,000 $0.01 $4,050 $0.01 $4,100 $0.01 $4,150 $0.01<br />
TOTAL OF ALL COST COMPONENTS FOR RECLAIMED WATER: $4.37 $1.96 $1.15 $0.85 $0.71 $0.62 $0.57 $0.53<br />
Total Reuse System Costs_BASE-043007-FORPRINTING.xls, CURVE Model Page 1 of 10 5/2/2007
WATER REUSE SYSTEM COST OF SERVICE TABLE BASE SYSTEM<br />
Blue = Values to input<br />
Capital Cost and Debt Financing Assumptions General Items Maintenance<br />
Total Capital Cost Variable Lab Costs, $ $20,000 Pump System Labor, hrs/wk 4<br />
Amount of Grant Funding $0 Sodium Hypochloride, $/gal of 12.5% 0.70 Pump System Equip, % capital 1%<br />
<strong>Municipal</strong> % of Up-Front Capital 100% Chlorine Dose, mg/L (year-round, see Note A) 7 Treatment Facilities, % capital 5%<br />
Other % of Up-Front Capital 0% Electrical Power, $/kwhr 0.045 Distribution System, $/mile 5500<br />
Debt Term (Years) 20<br />
Annual Interest Rate 5.00% FTE Annual Salary with Benefits, $<br />
Issuance Costs, % of Capital 1% Finance, Operations, Cust Service $80,000<br />
Legal $150,000<br />
Engineering $100,000<br />
Annual Avg Flow/Demand (MGD)<br />
0.1 0.25 0.5 0.75 1 1.25 1.5 1.75<br />
Length of Distribution System (mi) 2.0 Year 1 Cost, $ $/1000 gallons Year 1 Cost, $ $/1000 gallons Year 1 Cost, $ $/1000 gallons Year 1 Cost, $ $/1000 gallons Year 1 Cost, $ $/1000 gallons Year 1 Cost, $ $/1000 gallons Year 1 Cost, $ $/1000 gallons Year 1 Cost, $ $/1000 gallons<br />
Summary of Capital Cost Estimates<br />
Description Capital Cost Capital Cost Capital Cost Capital Cost Capital Cost Capital Cost Capital Cost Capital Cost<br />
Treatment Facilities $110,000 $125,000 $150,000 $172,500 $180,000 $187,500 $195,000 $202,500<br />
Storage Facilities $0 $0 $0 $0 $0 $0 $0 $0<br />
Pump Station $60,704 $151,759 $303,519 $364,223 $485,630 $607,038 $728,446 $849,853<br />
Piping $1,060,780 $1,133,050 $1,253,500 $1,373,950 $1,494,400 $1,614,850 $1,735,300 $1,855,750<br />
TOTAL CAPITAL $1,231,484 $1,409,809 $1,707,019 $1,910,673 $2,160,030 $2,409,388 $2,658,746 $2,908,103<br />
Cost Components Basis/Methodology<br />
CAPITAL Debt Service (Capital Cost) Based on debt service payment $95,053 $2.60 $108,817 $1.19 $131,758 $0.72 $147,477 $0.54 $166,724 $0.46 $185,970 $0.41 $205,217 $0.37 $224,464 $0.35<br />
Pumping System<br />
Maintenance Labor hours/week at operator rate input-see Note B $8,000 $0.22 $8,000 $0.09 $8,000 $0.04 $8,000 $0.03 $8,800 $0.02 $8,800 $0.02 $8,800 $0.02 $8,800 $0.01<br />
Equipment Maintenance Based on % of capital cost input $607 $0.02 $1,518 $0.02 $3,035 $0.02 $3,642 $0.01 $4,856 $0.01 $6,070 $0.01 $7,284 $0.01 $8,499 $0.01<br />
OPERATION Electrical Power Based on per Kwh rate input; see Note C $3,121 $0.09 $6,494 $0.07 $11,303 $0.06 $15,631 $0.06 $19,674 $0.05 $23,517 $0.05 $27,208 $0.05 $30,777 $0.05<br />
AND Reuse Treatment at WWTP<br />
MAINTENANCE Chlorine Disinfection $/gallon at %Conc input; see Note A $1,434 $0.04 $3,586 $0.04 $7,171 $0.04 $10,757 $0.04 $14,342 $0.04 $17,928 $0.04 $21,514 $0.04 $25,099 $0.04<br />
Other From Treatment Module $0 $0.00 $0 $0.00 $0 $0.00 $0 $0.00 $0 $0.00 $0 $0.00 $0 $0.00 $0 $0.00<br />
Laboratory Lab cost input $20,000 $0.55 $20,000 $0.22 $20,000 $0.11 $20,000 $0.07 $20,000 $0.05 $20,000 $0.04 $20,000 $0.04 $20,000 $0.03<br />
Electrical Power From Treatment Module $0 $0.00 $0 $0.00 $0 $0.00 $0 $0.00 $0 $0.00 $0 $0.00 $0 $0.00 $0 $0.00<br />
Equipment Maintenance&Labor Based on % of capital cost input $5,500 $0.15 $6,250 $0.07 $7,500 $0.04 $8,625 $0.03 $9,000 $0.02 $9,375 $0.02 $9,750 $0.02 $10,125 $0.02<br />
Distribution System Maintenance Equals water system cost/mile-see Note B $11,000 $0.30 $11,000 $0.12 $11,000 $0.06 $11,000 $0.04 $11,000 $0.03 $11,000 $0.02 $11,000 $0.02 $11,000 $0.02<br />
General System Management<br />
GENERAL Engineering 0.15 FTE base; .05% increase per mgd $15,000 $0.41 $15,000 $0.16 $15,000 $0.08 $15,000 $0.05 $15,000 $0.04 $15,188 $0.03 $15,375 $0.03 $15,563 $0.02<br />
AND Finance and Accounting 0.15 FTE $12,000 $0.33 $12,000 $0.13 $12,000 $0.07 $12,000 $0.04 $12,000 $0.03 $12,150 $0.03 $12,300 $0.02 $12,450 $0.02<br />
ADMINISTRATIVE Legal 0.05 FTE $7,500 $0.21 $7,500 $0.08 $7,500 $0.04 $7,500 $0.03 $7,500 $0.02 $7,594 $0.02 $7,688 $0.01 $7,781 $0.01<br />
Customer Service 0.05 FTE $4,000 $0.11 $4,000 $0.04 $4,000 $0.02 $4,000 $0.01 $4,000 $0.01 $4,050 $0.01 $4,100 $0.01 $4,150 $0.01<br />
TOTAL OF ALL COST COMPONENTS FOR RECLAIMED WATER: $5.02 $2.24 $1.31 $0.96 $0.80 $0.70 $0.64 $0.59<br />
Annual Avg Flow/Demand (MGD)<br />
0.1 0.25 0.5 0.75 1 1.25 1.5 1.75<br />
Length of Distribution System (mi) 2.5 Year 1 Cost, $ $/1000 gallons Year 1 Cost, $ $/1000 gallons Year 1 Cost, $ $/1000 gallons Year 1 Cost, $ $/1000 gallons Year 1 Cost, $ $/1000 gallons Year 1 Cost, $ $/1000 gallons Year 1 Cost, $ $/1000 gallons Year 1 Cost, $ $/1000 gallons<br />
Summary of Capital Cost Estimates<br />
Description Capital Cost Capital Cost Capital Cost Capital Cost Capital Cost Capital Cost Capital Cost Capital Cost<br />
Treatment Facilities $110,000 $125,000 $150,000 $172,500 $180,000 $187,500 $195,000 $202,500<br />
Storage Facilities $0 $0 $0 $0 $0 $0 $0 $0<br />
Pump Station $60,704 $151,759 $303,519 $364,223 $485,630 $607,038 $728,446 $849,853<br />
Piping $1,325,930 $1,416,275 $1,566,850 $1,717,425 $1,868,000 $2,018,575 $2,169,150 $2,319,725<br />
TOTAL CAPITAL $1,496,634 $1,693,034 $2,020,369 $2,254,148 $2,533,630 $2,813,113 $3,092,596 $3,372,078<br />
Cost Components Basis/Methodology<br />
CAPITAL Debt Service (Capital Cost) Based on debt service payment $115,519 $3.16 $130,678 $1.43 $155,944 $0.85 $173,988 $0.64 $195,560 $0.54 $217,132 $0.48 $238,704 $0.44 $260,276 $0.41<br />
Pumping System<br />
Maintenance Labor hours/week at operator rate input-see Note B $8,000 $0.22 $8,000 $0.09 $8,000 $0.04 $8,000 $0.03 $8,800 $0.02 $8,800 $0.02 $8,800 $0.02 $8,800 $0.01<br />
Equipment Maintenance Based on % of capital cost input $607 $0.02 $1,518 $0.02 $3,035 $0.02 $3,642 $0.01 $4,856 $0.01 $6,070 $0.01 $7,284 $0.01 $8,499 $0.01<br />
OPERATION Electrical Power Based on per Kwh rate input; see Note C $3,837 $0.11 $7,734 $0.08 $13,144 $0.07 $17,924 $0.07 $22,336 $0.06 $26,494 $0.06 $30,459 $0.06 $34,271 $0.05<br />
AND Reuse Treatment at WWTP<br />
MAINTENANCE Chlorine Disinfection $/gallon at %Conc input; see Note A $1,434 $0.04 $3,586 $0.04 $7,171 $0.04 $10,757 $0.04 $14,342 $0.04 $17,928 $0.04 $21,514 $0.04 $25,099 $0.04<br />
Other From Treatment Module $0 $0.00 $0 $0.00 $0 $0.00 $0 $0.00 $0 $0.00 $0 $0.00 $0 $0.00 $0 $0.00<br />
Laboratory Lab cost input $20,000 $0.55 $20,000 $0.22 $20,000 $0.11 $20,000 $0.07 $20,000 $0.05 $20,000 $0.04 $20,000 $0.04 $20,000 $0.03<br />
Electrical Power From Treatment Module $0 $0.00 $0 $0.00 $0 $0.00 $0 $0.00 $0 $0.00 $0 $0.00 $0 $0.00 $0 $0.00<br />
Equipment Maintenance&Labor Based on % of capital cost input $5,500 $0.15 $6,250 $0.07 $7,500 $0.04 $8,625 $0.03 $9,000 $0.02 $9,375 $0.02 $9,750 $0.02 $10,125 $0.02<br />
Distribution System Maintenance Equals water system cost/mile-see Note B $13,750 $0.38 $13,750 $0.15 $13,750 $0.08 $13,750 $0.05 $13,750 $0.04 $13,750 $0.03 $13,750 $0.03 $13,750 $0.02<br />
General System Management<br />
GENERAL Engineering 0.15 FTE base; .05% increase per mgd $15,000 $0.41 $15,000 $0.16 $15,000 $0.08 $15,000 $0.05 $15,000 $0.04 $15,188 $0.03 $15,375 $0.03 $15,563 $0.02<br />
AND Finance and Accounting 0.15 FTE $12,000 $0.33 $12,000 $0.13 $12,000 $0.07 $12,000 $0.04 $12,000 $0.03 $12,150 $0.03 $12,300 $0.02 $12,450 $0.02<br />
ADMINISTRATIVE Legal 0.05 FTE $7,500 $0.21 $7,500 $0.08 $7,500 $0.04 $7,500 $0.03 $7,500 $0.02 $7,594 $0.02 $7,688 $0.01 $7,781 $0.01<br />
Customer Service 0.05 FTE $4,000 $0.11 $4,000 $0.04 $4,000 $0.02 $4,000 $0.01 $4,000 $0.01 $4,050 $0.01 $4,100 $0.01 $4,150 $0.01<br />
TOTAL OF ALL COST COMPONENTS FOR RECLAIMED WATER: $5.68 $2.52 $1.46 $1.08 $0.90 $0.79 $0.71 $0.66<br />
Total Reuse System Costs_BASE-043007-FORPRINTING.xls, CURVE Model Page 2 of 10 5/2/2007
WATER REUSE SYSTEM COST OF SERVICE TABLE BASE SYSTEM<br />
Blue = Values to input<br />
Capital Cost and Debt Financing Assumptions General Items Maintenance<br />
Total Capital Cost Variable Lab Costs, $ $20,000 Pump System Labor, hrs/wk 4<br />
Amount of Grant Funding $0 Sodium Hypochloride, $/gal of 12.5% 0.70 Pump System Equip, % capital 1%<br />
<strong>Municipal</strong> % of Up-Front Capital 100% Chlorine Dose, mg/L (year-round, see Note A) 7 Treatment Facilities, % capital 5%<br />
Other % of Up-Front Capital 0% Electrical Power, $/kwhr 0.045 Distribution System, $/mile 5500<br />
Debt Term (Years) 20<br />
Annual Interest Rate 5.00% FTE Annual Salary with Benefits, $<br />
Issuance Costs, % of Capital 1% Finance, Operations, Cust Service $80,000<br />
Legal $150,000<br />
Engineering $100,000<br />
Annual Avg Flow/Demand (MGD)<br />
0.1 0.25 0.5 0.75 1 1.25 1.5 1.75<br />
Length of Distribution System (mi) 3.0 Year 1 Cost, $ $/1000 gallons Year 1 Cost, $ $/1000 gallons Year 1 Cost, $ $/1000 gallons Year 1 Cost, $ $/1000 gallons Year 1 Cost, $ $/1000 gallons Year 1 Cost, $ $/1000 gallons Year 1 Cost, $ $/1000 gallons Year 1 Cost, $ $/1000 gallons<br />
Summary of Capital Cost Estimates<br />
Description Capital Cost Capital Cost Capital Cost Capital Cost Capital Cost Capital Cost Capital Cost Capital Cost<br />
Treatment Facilities $110,000 $125,000 $150,000 $172,500 $180,000 $187,500 $195,000 $202,500<br />
Storage Facilities $0 $0 $0 $0 $0 $0 $0 $0<br />
Pump Station $60,704 $151,759 $303,519 $364,223 $485,630 $607,038 $728,446 $849,853<br />
Piping $1,591,170 $1,699,575 $1,880,250 $2,060,925 $2,241,600 $2,422,275 $2,602,950 $2,783,625<br />
TOTAL CAPITAL $1,761,874 $1,976,334 $2,333,769 $2,597,648 $2,907,230 $3,216,813 $3,526,396 $3,835,978<br />
Cost Components Basis/Methodology<br />
CAPITAL Debt Service (Capital Cost) Based on debt service payment $135,992 $3.73 $152,545 $1.67 $180,134 $0.99 $200,501 $0.73 $224,397 $0.61 $248,292 $0.54 $272,187 $0.50 $296,083 $0.46<br />
Pumping System<br />
Maintenance Labor hours/week at operator rate input-see Note B $8,000 $0.22 $8,000 $0.09 $8,000 $0.04 $8,000 $0.03 $8,800 $0.02 $8,800 $0.02 $8,800 $0.02 $8,800 $0.01<br />
Equipment Maintenance Based on % of capital cost input $607 $0.02 $1,518 $0.02 $3,035 $0.02 $3,642 $0.01 $4,856 $0.01 $6,070 $0.01 $7,284 $0.01 $8,499 $0.01<br />
OPERATION Electrical Power Based on per Kwh rate input; see Note C $3,861 $0.11 $7,873 $0.09 $13,496 $0.07 $18,498 $0.07 $23,136 $0.06 $27,520 $0.06 $31,712 $0.06 $35,750 $0.06<br />
AND Reuse Treatment at WWTP<br />
MAINTENANCE Chlorine Disinfection $/gallon at %Conc input; see Note A $1,434 $0.04 $3,586 $0.04 $7,171 $0.04 $10,757 $0.04 $14,342 $0.04 $17,928 $0.04 $21,514 $0.04 $25,099 $0.04<br />
Other From Treatment Module $0 $0.00 $0 $0.00 $0 $0.00 $0 $0.00 $0 $0.00 $0 $0.00 $0 $0.00 $0 $0.00<br />
Laboratory Lab cost input $20,000 $0.55 $20,000 $0.22 $20,000 $0.11 $20,000 $0.07 $20,000 $0.05 $20,000 $0.04 $20,000 $0.04 $20,000 $0.03<br />
Electrical Power From Treatment Module $0 $0.00 $0 $0.00 $0 $0.00 $0 $0.00 $0 $0.00 $0 $0.00 $0 $0.00 $0 $0.00<br />
Equipment Maintenance&Labor Based on % of capital cost input $5,500 $0.15 $6,250 $0.07 $7,500 $0.04 $8,625 $0.03 $9,000 $0.02 $9,375 $0.02 $9,750 $0.02 $10,125 $0.02<br />
Distribution System Maintenance Equals water system cost/mile-see Note B $16,500 $0.45 $16,500 $0.18 $16,500 $0.09 $16,500 $0.06 $16,500 $0.05 $16,500 $0.04 $16,500 $0.03 $16,500 $0.03<br />
General System Management<br />
GENERAL Engineering 0.15 FTE base; .05% increase per mgd $15,000 $0.41 $15,000 $0.16 $15,000 $0.08 $15,000 $0.05 $15,000 $0.04 $15,188 $0.03 $15,375 $0.03 $15,563 $0.02<br />
AND Finance and Accounting 0.15 FTE $12,000 $0.33 $12,000 $0.13 $12,000 $0.07 $12,000 $0.04 $12,000 $0.03 $12,150 $0.03 $12,300 $0.02 $12,450 $0.02<br />
ADMINISTRATIVE Legal 0.05 FTE $7,500 $0.21 $7,500 $0.08 $7,500 $0.04 $7,500 $0.03 $7,500 $0.02 $7,594 $0.02 $7,688 $0.01 $7,781 $0.01<br />
Customer Service 0.05 FTE $4,000 $0.11 $4,000 $0.04 $4,000 $0.02 $4,000 $0.01 $4,000 $0.01 $4,050 $0.01 $4,100 $0.01 $4,150 $0.01<br />
TOTAL OF ALL COST COMPONENTS FOR RECLAIMED WATER: $6.31 $2.79 $1.61 $1.19 $0.99 $0.86 $0.78 $0.72<br />
Annual Avg Flow/Demand (MGD)<br />
0.1 0.25 0.5 0.75 1 1.25 1.5 1.75<br />
Length of Distribution System (mi) 3.5 Year 1 Cost, $ $/1000 gallons Year 1 Cost, $ $/1000 gallons Year 1 Cost, $ $/1000 gallons Year 1 Cost, $ $/1000 gallons Year 1 Cost, $ $/1000 gallons Year 1 Cost, $ $/1000 gallons Year 1 Cost, $ $/1000 gallons Year 1 Cost, $ $/1000 gallons<br />
Summary of Capital Cost Estimates<br />
Description Capital Cost Capital Cost Capital Cost Capital Cost Capital Cost Capital Cost Capital Cost Capital Cost<br />
Treatment Facilities $110,000 $125,000 $150,000 $172,500 $180,000 $187,500 $195,000 $202,500<br />
Storage Facilities $0 $0 $0 $0 $0 $0 $0 $0<br />
Pump Station $60,704 $151,759 $303,519 $364,223 $485,630 $607,038 $728,446 $849,853<br />
Piping $1,856,320 $1,982,800 $2,193,600 $2,404,400 $2,615,200 $2,826,000 $3,036,800 $3,247,600<br />
TOTAL CAPITAL $2,027,024 $2,259,559 $2,647,119 $2,941,123 $3,280,830 $3,620,538 $3,960,246 $4,299,953<br />
Cost Components Basis/Methodology<br />
CAPITAL Debt Service (Capital Cost) Based on debt service payment $156,457 $4.29 $174,406 $1.91 $204,320 $1.12 $227,013 $0.83 $253,233 $0.69 $279,454 $0.61 $305,674 $0.56 $331,895 $0.52<br />
Pumping System<br />
Maintenance Labor hours/week at operator rate input-see Note B $8,000 $0.22 $8,000 $0.09 $8,000 $0.04 $8,000 $0.03 $8,800 $0.02 $8,800 $0.02 $8,800 $0.02 $8,800 $0.01<br />
Equipment Maintenance Based on % of capital cost input $607 $0.02 $1,518 $0.02 $3,035 $0.02 $3,642 $0.01 $4,856 $0.01 $6,070 $0.01 $7,284 $0.01 $8,499 $0.01<br />
OPERATION Electrical Power Based on per Kwh rate input; see Note C $4,180 $0.11 $8,470 $0.09 $14,451 $0.08 $19,751 $0.07 $24,654 $0.07 $29,280 $0.06 $33,698 $0.06 $37,949 $0.06<br />
AND Reuse Treatment at WWTP<br />
MAINTENANCE Chlorine Disinfection $/gallon at %Conc input; see Note A $1,434 $0.04 $3,586 $0.04 $7,171 $0.04 $10,757 $0.04 $14,342 $0.04 $17,928 $0.04 $21,514 $0.04 $25,099 $0.04<br />
Other From Treatment Module $0 $0.00 $0 $0.00 $0 $0.00 $0 $0.00 $0 $0.00 $0 $0.00 $0 $0.00 $0 $0.00<br />
Laboratory Lab cost input $20,000 $0.55 $20,000 $0.22 $20,000 $0.11 $20,000 $0.07 $20,000 $0.05 $20,000 $0.04 $20,000 $0.04 $20,000 $0.03<br />
Electrical Power From Treatment Module $0 $0.00 $0 $0.00 $0 $0.00 $0 $0.00 $0 $0.00 $0 $0.00 $0 $0.00 $0 $0.00<br />
Equipment Maintenance&Labor Based on % of capital cost input $5,500 $0.15 $6,250 $0.07 $7,500 $0.04 $8,625 $0.03 $9,000 $0.02 $9,375 $0.02 $9,750 $0.02 $10,125 $0.02<br />
Distribution System Maintenance Equals water system cost/mile-see Note B $19,250 $0.53 $19,250 $0.21 $19,250 $0.11 $19,250 $0.07 $19,250 $0.05 $19,250 $0.04 $19,250 $0.04 $19,250 $0.03<br />
General System Management<br />
GENERAL Engineering 0.15 FTE base; .05% increase per mgd $15,000 $0.41 $15,000 $0.16 $15,000 $0.08 $15,000 $0.05 $15,000 $0.04 $15,188 $0.03 $15,375 $0.03 $15,563 $0.02<br />
AND Finance and Accounting 0.15 FTE $12,000 $0.33 $12,000 $0.13 $12,000 $0.07 $12,000 $0.04 $12,000 $0.03 $12,150 $0.03 $12,300 $0.02 $12,450 $0.02<br />
ADMINISTRATIVE Legal 0.05 FTE $7,500 $0.21 $7,500 $0.08 $7,500 $0.04 $7,500 $0.03 $7,500 $0.02 $7,594 $0.02 $7,688 $0.01 $7,781 $0.01<br />
Customer Service 0.05 FTE $4,000 $0.11 $4,000 $0.04 $4,000 $0.02 $4,000 $0.01 $4,000 $0.01 $4,050 $0.01 $4,100 $0.01 $4,150 $0.01<br />
TOTAL OF ALL COST COMPONENTS FOR RECLAIMED WATER: $6.96 $3.07 $1.77 $1.30 $1.08 $0.94 $0.85 $0.79<br />
Total Reuse System Costs_BASE-043007-FORPRINTING.xls, CURVE Model Page 3 of 10 5/2/2007
WATER REUSE SYSTEM COST OF SERVICE TABLE BASE SYSTEM<br />
Blue = Values to input<br />
Capital Cost and Debt Financing Assumptions General Items Maintenance<br />
Total Capital Cost Variable Lab Costs, $ $20,000 Pump System Labor, hrs/wk 4<br />
Amount of Grant Funding $0 Sodium Hypochloride, $/gal of 12.5% 0.70 Pump System Equip, % capital 1%<br />
<strong>Municipal</strong> % of Up-Front Capital 100% Chlorine Dose, mg/L (year-round, see Note A) 7 Treatment Facilities, % capital 5%<br />
Other % of Up-Front Capital 0% Electrical Power, $/kwhr 0.045 Distribution System, $/mile 5500<br />
Debt Term (Years) 20<br />
Annual Interest Rate 5.00% FTE Annual Salary with Benefits, $<br />
Issuance Costs, % of Capital 1% Finance, Operations, Cust Service $80,000<br />
Legal $150,000<br />
Engineering $100,000<br />
Annual Avg Flow/Demand (MGD)<br />
0.1 0.25 0.5 0.75 1 1.25 1.5 1.75<br />
Length of Distribution System (mi) 4.0 Year 1 Cost, $ $/1000 gallons Year 1 Cost, $ $/1000 gallons Year 1 Cost, $ $/1000 gallons Year 1 Cost, $ $/1000 gallons Year 1 Cost, $ $/1000 gallons Year 1 Cost, $ $/1000 gallons Year 1 Cost, $ $/1000 gallons Year 1 Cost, $ $/1000 gallons<br />
Summary of Capital Cost Estimates<br />
Description Capital Cost Capital Cost Capital Cost Capital Cost Capital Cost Capital Cost Capital Cost Capital Cost<br />
Treatment Facilities $110,000 $125,000 $150,000 $172,500 $180,000 $187,500 $195,000 $202,500<br />
Storage Facilities $0 $0 $0 $0 $0 $0 $0 $0<br />
Pump Station $60,704 $151,759 $303,519 $364,223 $485,630 $607,038 $728,446 $849,853<br />
Piping $2,121,560 $2,266,100 $2,507,000 $2,747,900 $2,988,800 $3,229,700 $3,470,600 $3,711,500<br />
TOTAL CAPITAL $2,292,264 $2,542,859 $2,960,519 $3,284,623 $3,654,430 $4,024,238 $4,394,046 $4,763,853<br />
Cost Components Basis/Methodology<br />
CAPITAL Debt Service (Capital Cost) Based on debt service payment $176,930 $4.85 $196,272 $2.15 $228,510 $1.25 $253,526 $0.93 $282,070 $0.77 $310,614 $0.68 $339,158 $0.62 $367,701 $0.58<br />
Pumping System<br />
Maintenance Labor hours/week at operator rate input-see Note B $8,000 $0.22 $8,000 $0.09 $8,000 $0.04 $8,000 $0.03 $8,800 $0.02 $8,800 $0.02 $8,800 $0.02 $8,800 $0.01<br />
Equipment Maintenance Based on % of capital cost input $607 $0.02 $1,518 $0.02 $3,035 $0.02 $3,642 $0.01 $4,856 $0.01 $6,070 $0.01 $7,284 $0.01 $8,499 $0.01<br />
OPERATION Electrical Power Based on per Kwh rate input; see Note C $4,575 $0.13 $9,457 $0.10 $16,380 $0.09 $22,587 $0.08 $28,371 $0.08 $33,859 $0.07 $39,123 $0.07 $44,206 $0.07<br />
AND Reuse Treatment at WWTP<br />
MAINTENANCE Chlorine Disinfection $/gallon at %Conc input; see Note A $1,434 $0.04 $3,586 $0.04 $7,171 $0.04 $10,757 $0.04 $14,342 $0.04 $17,928 $0.04 $21,514 $0.04 $25,099 $0.04<br />
Other From Treatment Module $0 $0.00 $0 $0.00 $0 $0.00 $0 $0.00 $0 $0.00 $0 $0.00 $0 $0.00 $0 $0.00<br />
Laboratory Lab cost input $20,000 $0.55 $20,000 $0.22 $20,000 $0.11 $20,000 $0.07 $20,000 $0.05 $20,000 $0.04 $20,000 $0.04 $20,000 $0.03<br />
Electrical Power From Treatment Module $0 $0.00 $0 $0.00 $0 $0.00 $0 $0.00 $0 $0.00 $0 $0.00 $0 $0.00 $0 $0.00<br />
Equipment Maintenance&Labor Based on % of capital cost input $5,500 $0.15 $6,250 $0.07 $7,500 $0.04 $8,625 $0.03 $9,000 $0.02 $9,375 $0.02 $9,750 $0.02 $10,125 $0.02<br />
Distribution System Maintenance Equals water system cost/mile-see Note B $22,000 $0.60 $22,000 $0.24 $22,000 $0.12 $22,000 $0.08 $22,000 $0.06 $22,000 $0.05 $22,000 $0.04 $22,000 $0.03<br />
General System Management<br />
GENERAL Engineering 0.15 FTE base; .05% increase per mgd $15,000 $0.41 $15,000 $0.16 $15,000 $0.08 $15,000 $0.05 $15,000 $0.04 $15,188 $0.03 $15,375 $0.03 $15,563 $0.02<br />
AND Finance and Accounting 0.15 FTE $12,000 $0.33 $12,000 $0.13 $12,000 $0.07 $12,000 $0.04 $12,000 $0.03 $12,150 $0.03 $12,300 $0.02 $12,450 $0.02<br />
ADMINISTRATIVE Legal 0.05 FTE $7,500 $0.21 $7,500 $0.08 $7,500 $0.04 $7,500 $0.03 $7,500 $0.02 $7,594 $0.02 $7,688 $0.01 $7,781 $0.01<br />
Customer Service 0.05 FTE $4,000 $0.11 $4,000 $0.04 $4,000 $0.02 $4,000 $0.01 $4,000 $0.01 $4,050 $0.01 $4,100 $0.01 $4,150 $0.01<br />
TOTAL OF ALL COST COMPONENTS FOR RECLAIMED WATER: $7.60 $3.35 $1.92 $1.42 $1.17 $1.02 $0.93 $0.86<br />
Annual Avg Flow/Demand (MGD)<br />
0.1 0.25 0.5 0.75 1 1.25 1.5 1.75<br />
Length of Distribution System (mi) 4.5 Year 1 Cost, $ $/1000 gallons Year 1 Cost, $ $/1000 gallons Year 1 Cost, $ $/1000 gallons Year 1 Cost, $ $/1000 gallons Year 1 Cost, $ $/1000 gallons Year 1 Cost, $ $/1000 gallons Year 1 Cost, $ $/1000 gallons Year 1 Cost, $ $/1000 gallons<br />
Summary of Capital Cost Estimates<br />
Description Capital Cost Capital Cost Capital Cost Capital Cost Capital Cost Capital Cost Capital Cost Capital Cost<br />
Treatment Facilities $110,000 $125,000 $150,000 $172,500 $180,000 $187,500 $195,000 $202,500<br />
Storage Facilities $0 $0 $0 $0 $0 $0 $0 $0<br />
Pump Station $60,704 $151,759 $303,519 $364,223 $485,630 $607,038 $728,446 $849,853<br />
Piping $2,386,710 $2,549,325 $2,820,350 $3,091,375 $3,362,400 $3,633,425 $3,904,450 $4,175,475<br />
TOTAL CAPITAL $2,557,414 $2,826,084 $3,273,869 $3,628,098 $4,028,030 $4,427,963 $4,827,896 $5,227,828<br />
Cost Components Basis/Methodology<br />
CAPITAL Debt Service (Capital Cost) Based on debt service payment $197,396 $5.41 $218,133 $2.39 $252,696 $1.38 $280,037 $1.02 $310,906 $0.85 $341,776 $0.75 $372,645 $0.68 $403,514 $0.63<br />
Pumping System<br />
Maintenance Labor hours/week at operator rate input-see Note B $8,000 $0.22 $8,000 $0.09 $8,000 $0.04 $8,000 $0.03 $8,800 $0.02 $8,800 $0.02 $8,800 $0.02 $8,800 $0.01<br />
Equipment Maintenance Based on % of capital cost input $607 $0.02 $1,518 $0.02 $3,035 $0.02 $3,642 $0.01 $4,856 $0.01 $6,070 $0.01 $7,284 $0.01 $8,499 $0.01<br />
OPERATION Electrical Power Based on per Kwh rate input; see Note C $4,579 $0.13 $9,262 $0.10 $15,780 $0.09 $21,551 $0.08 $26,885 $0.07 $31,916 $0.07 $36,717 $0.07 $41,336 $0.06<br />
AND Reuse Treatment at WWTP<br />
MAINTENANCE Chlorine Disinfection $/gallon at %Conc input; see Note A $1,434 $0.04 $3,586 $0.04 $7,171 $0.04 $10,757 $0.04 $14,342 $0.04 $17,928 $0.04 $21,514 $0.04 $25,099 $0.04<br />
Other From Treatment Module $0 $0.00 $0 $0.00 $0 $0.00 $0 $0.00 $0 $0.00 $0 $0.00 $0 $0.00 $0 $0.00<br />
Laboratory Lab cost input $20,000 $0.55 $20,000 $0.22 $20,000 $0.11 $20,000 $0.07 $20,000 $0.05 $20,000 $0.04 $20,000 $0.04 $20,000 $0.03<br />
Electrical Power From Treatment Module $0 $0.00 $0 $0.00 $0 $0.00 $0 $0.00 $0 $0.00 $0 $0.00 $0 $0.00 $0 $0.00<br />
Equipment Maintenance&Labor Based on % of capital cost input $5,500 $0.15 $6,250 $0.07 $7,500 $0.04 $8,625 $0.03 $9,000 $0.02 $9,375 $0.02 $9,750 $0.02 $10,125 $0.02<br />
Distribution System Maintenance Equals water system cost/mile-see Note B $24,750 $0.68 $24,750 $0.27 $24,750 $0.14 $24,750 $0.09 $24,750 $0.07 $24,750 $0.05 $24,750 $0.05 $24,750 $0.04<br />
General System Management<br />
GENERAL Engineering 0.15 FTE base; .05% increase per mgd $15,000 $0.41 $15,000 $0.16 $15,000 $0.08 $15,000 $0.05 $15,000 $0.04 $15,188 $0.03 $15,375 $0.03 $15,563 $0.02<br />
AND Finance and Accounting 0.15 FTE $12,000 $0.33 $12,000 $0.13 $12,000 $0.07 $12,000 $0.04 $12,000 $0.03 $12,150 $0.03 $12,300 $0.02 $12,450 $0.02<br />
ADMINISTRATIVE Legal 0.05 FTE $7,500 $0.21 $7,500 $0.08 $7,500 $0.04 $7,500 $0.03 $7,500 $0.02 $7,594 $0.02 $7,688 $0.01 $7,781 $0.01<br />
Customer Service 0.05 FTE $4,000 $0.11 $4,000 $0.04 $4,000 $0.02 $4,000 $0.01 $4,000 $0.01 $4,050 $0.01 $4,100 $0.01 $4,150 $0.01<br />
TOTAL OF ALL COST COMPONENTS FOR RECLAIMED WATER: $8.24 $3.62 $2.07 $1.52 $1.25 $1.10 $0.99 $0.91<br />
Total Reuse System Costs_BASE-043007-FORPRINTING.xls, CURVE Model Page 4 of 10 5/2/2007
WATER REUSE SYSTEM COST OF SERVICE TABLE BASE SYSTEM<br />
Blue = Values to input<br />
Capital Cost and Debt Financing Assumptions General Items Maintenance<br />
Total Capital Cost Variable Lab Costs, $ $20,000 Pump System Labor, hrs/wk 4<br />
Amount of Grant Funding $0 Sodium Hypochloride, $/gal of 12.5% 0.70 Pump System Equip, % capital 1%<br />
<strong>Municipal</strong> % of Up-Front Capital 100% Chlorine Dose, mg/L (year-round, see Note A) 7 Treatment Facilities, % capital 5%<br />
Other % of Up-Front Capital 0% Electrical Power, $/kwhr 0.045 Distribution System, $/mile 5500<br />
Debt Term (Years) 20<br />
Annual Interest Rate 5.00% FTE Annual Salary with Benefits, $<br />
Issuance Costs, % of Capital 1% Finance, Operations, Cust Service $80,000<br />
Legal $150,000<br />
Engineering $100,000<br />
Annual Avg Flow/Demand (MGD)<br />
0.1 0.25 0.5 0.75 1 1.25 1.5 1.75<br />
Length of Distribution System (mi) 5.0 Year 1 Cost, $ $/1000 gallons Year 1 Cost, $ $/1000 gallons Year 1 Cost, $ $/1000 gallons Year 1 Cost, $ $/1000 gallons Year 1 Cost, $ $/1000 gallons Year 1 Cost, $ $/1000 gallons Year 1 Cost, $ $/1000 gallons Year 1 Cost, $ $/1000 gallons<br />
Summary of Capital Cost Estimates<br />
Description Capital Cost Capital Cost Capital Cost Capital Cost Capital Cost Capital Cost Capital Cost Capital Cost<br />
Treatment Facilities $110,000 $125,000 $150,000 $172,500 $180,000 $187,500 $195,000 $202,500<br />
Storage Facilities $0 $0 $0 $0 $0 $0 $0 $0<br />
Pump Station $60,704 $151,759 $303,519 $364,223 $485,630 $607,038 $728,446 $849,853<br />
Piping $2,651,950 $2,832,625 $3,133,750 $3,434,875 $3,736,000 $4,037,125 $4,338,250 $4,639,375<br />
TOTAL CAPITAL $2,822,654 $3,109,384 $3,587,269 $3,971,598 $4,401,630 $4,831,663 $5,261,696 $5,691,728<br />
Cost Components Basis/Methodology<br />
CAPITAL Debt Service (Capital Cost) Based on debt service payment $217,869 $5.97 $240,000 $2.63 $276,886 $1.52 $306,551 $1.12 $339,743 $0.93 $372,935 $0.82 $406,128 $0.74 $439,320 $0.69<br />
Pumping System<br />
Maintenance Labor hours/week at operator rate input-see Note B $8,000 $0.22 $8,000 $0.09 $8,000 $0.04 $8,000 $0.03 $8,800 $0.02 $8,800 $0.02 $8,800 $0.02 $8,800 $0.01<br />
Equipment Maintenance Based on % of capital cost input $607 $0.02 $1,518 $0.02 $3,035 $0.02 $3,642 $0.01 $4,856 $0.01 $6,070 $0.01 $7,284 $0.01 $8,499 $0.01<br />
OPERATION Electrical Power Based on per Kwh rate input; see Note C $4,592 $0.13 $9,346 $0.10 $15,999 $0.09 $21,911 $0.08 $27,388 $0.08 $32,563 $0.07 $37,509 $0.07 $42,273 $0.07<br />
AND Reuse Treatment at WWTP<br />
MAINTENANCE Chlorine Disinfection $/gallon at %Conc input; see Note A $1,434 $0.04 $3,586 $0.04 $7,171 $0.04 $10,757 $0.04 $14,342 $0.04 $17,928 $0.04 $21,514 $0.04 $25,099 $0.04<br />
Other From Treatment Module $0 $0.00 $0 $0.00 $0 $0.00 $0 $0.00 $0 $0.00 $0 $0.00 $0 $0.00 $0 $0.00<br />
Laboratory Lab cost input $20,000 $0.55 $20,000 $0.22 $20,000 $0.11 $20,000 $0.07 $20,000 $0.05 $20,000 $0.04 $20,000 $0.04 $20,000 $0.03<br />
Electrical Power From Treatment Module $0 $0.00 $0 $0.00 $0 $0.00 $0 $0.00 $0 $0.00 $0 $0.00 $0 $0.00 $0 $0.00<br />
Equipment Maintenance&Labor Based on % of capital cost input $5,500 $0.15 $6,250 $0.07 $7,500 $0.04 $8,625 $0.03 $9,000 $0.02 $9,375 $0.02 $9,750 $0.02 $10,125 $0.02<br />
Distribution System Maintenance Equals water system cost/mile-see Note B $27,500 $0.75 $27,500 $0.30 $27,500 $0.15 $27,500 $0.10 $27,500 $0.08 $27,500 $0.06 $27,500 $0.05 $27,500 $0.04<br />
General System Management<br />
GENERAL Engineering 0.15 FTE base; .05% increase per mgd $15,000 $0.41 $15,000 $0.16 $15,000 $0.08 $15,000 $0.05 $15,000 $0.04 $15,188 $0.03 $15,375 $0.03 $15,563 $0.02<br />
AND Finance and Accounting 0.15 FTE $12,000 $0.33 $12,000 $0.13 $12,000 $0.07 $12,000 $0.04 $12,000 $0.03 $12,150 $0.03 $12,300 $0.02 $12,450 $0.02<br />
ADMINISTRATIVE Legal 0.05 FTE $7,500 $0.21 $7,500 $0.08 $7,500 $0.04 $7,500 $0.03 $7,500 $0.02 $7,594 $0.02 $7,688 $0.01 $7,781 $0.01<br />
Customer Service 0.05 FTE $4,000 $0.11 $4,000 $0.04 $4,000 $0.02 $4,000 $0.01 $4,000 $0.01 $4,050 $0.01 $4,100 $0.01 $4,150 $0.01<br />
TOTAL OF ALL COST COMPONENTS FOR RECLAIMED WATER: $8.88 $3.89 $2.22 $1.63 $1.34 $1.17 $1.06 $0.97<br />
Annual Avg Flow/Demand (MGD)<br />
0.1 0.25 0.5 0.75 1 1.25 1.5 1.75<br />
Length of Distribution System (mi) 10.0 Year 1 Cost, $ $/1000 gallons Year 1 Cost, $ $/1000 gallons Year 1 Cost, $ $/1000 gallons Year 1 Cost, $ $/1000 gallons Year 1 Cost, $ $/1000 gallons Year 1 Cost, $ $/1000 gallons Year 1 Cost, $ $/1000 gallons Year 1 Cost, $ $/1000 gallons<br />
Summary of Capital Cost Estimates<br />
Description Capital Cost Capital Cost Capital Cost Capital Cost Capital Cost Capital Cost Capital Cost Capital Cost<br />
Treatment Facilities $110,000 $125,000 $150,000 $172,500 $180,000 $187,500 $195,000 $202,500<br />
Storage Facilities $0 $0 $0 $0 $0 $0 $0 $0<br />
Pump Station $60,704 $151,759 $303,519 $364,223 $485,630 $607,038 $728,446 $849,853<br />
Piping $5,303,690 $5,665,025 $6,267,250 $6,869,475 $7,471,700 $8,073,925 $8,676,150 $9,278,375<br />
TOTAL CAPITAL $5,474,394 $5,941,784 $6,720,769 $7,406,198 $8,137,330 $8,868,463 $9,599,596 $10,330,728<br />
Cost Components Basis/Methodology<br />
CAPITAL Debt Service (Capital Cost) Based on debt service payment $422,545 $11.58 $458,621 $5.03 $518,747 $2.84 $571,653 $2.09 $628,086 $1.72 $684,519 $1.50 $740,952 $1.35 $797,385 $1.25<br />
Pumping System<br />
Maintenance Labor hours/week at operator rate input-see Note B $8,000 $0.22 $8,000 $0.09 $8,000 $0.04 $8,000 $0.03 $8,800 $0.02 $8,800 $0.02 $8,800 $0.02 $8,800 $0.01<br />
Equipment Maintenance Based on % of capital cost input $607 $0.02 $1,518 $0.02 $3,035 $0.02 $3,642 $0.01 $4,856 $0.01 $6,070 $0.01 $7,284 $0.01 $8,499 $0.01<br />
OPERATION Electrical Power Based on per Kwh rate input; see Note C $9,307 $0.25 $17,478 $0.19 $28,154 $0.15 $37,210 $0.14 $45,351 $0.12 $52,874 $0.12 $59,938 $0.11 $66,642 $0.10<br />
AND Reuse Treatment at WWTP<br />
MAINTENANCE Chlorine Disinfection $/gallon at %Conc input; see Note A $1,434 $0.04 $3,586 $0.04 $7,171 $0.04 $10,757 $0.04 $14,342 $0.04 $17,928 $0.04 $21,514 $0.04 $25,099 $0.04<br />
Other From Treatment Module $0 $0.00 $0 $0.00 $0 $0.00 $0 $0.00 $0 $0.00 $0 $0.00 $0 $0.00 $0 $0.00<br />
Laboratory Lab cost input $20,000 $0.55 $20,000 $0.22 $20,000 $0.11 $20,000 $0.07 $20,000 $0.05 $20,000 $0.04 $20,000 $0.04 $20,000 $0.03<br />
Electrical Power From Treatment Module $0 $0.00 $0 $0.00 $0 $0.00 $0 $0.00 $0 $0.00 $0 $0.00 $0 $0.00 $0 $0.00<br />
Equipment Maintenance&Labor Based on % of capital cost input $5,500 $0.15 $6,250 $0.07 $7,500 $0.04 $8,625 $0.03 $9,000 $0.02 $9,375 $0.02 $9,750 $0.02 $10,125 $0.02<br />
Distribution System Maintenance Equals water system cost/mile-see Note B $55,000 $1.51 $55,000 $0.60 $55,000 $0.30 $55,000 $0.20 $55,000 $0.15 $55,000 $0.12 $55,000 $0.10 $55,000 $0.09<br />
General System Management<br />
GENERAL Engineering 0.15 FTE base; .05% increase per mgd $15,000 $0.41 $15,000 $0.16 $15,000 $0.08 $15,000 $0.05 $15,000 $0.04 $15,188 $0.03 $15,375 $0.03 $15,563 $0.02<br />
AND Finance and Accounting 0.15 FTE $12,000 $0.33 $12,000 $0.13 $12,000 $0.07 $12,000 $0.04 $12,000 $0.03 $12,150 $0.03 $12,300 $0.02 $12,450 $0.02<br />
ADMINISTRATIVE Legal 0.05 FTE $7,500 $0.21 $7,500 $0.08 $7,500 $0.04 $7,500 $0.03 $7,500 $0.02 $7,594 $0.02 $7,688 $0.01 $7,781 $0.01<br />
Customer Service 0.05 FTE $4,000 $0.11 $4,000 $0.04 $4,000 $0.02 $4,000 $0.01 $4,000 $0.01 $4,050 $0.01 $4,100 $0.01 $4,150 $0.01<br />
TOTAL OF ALL COST COMPONENTS FOR RECLAIMED WATER: $15.37 $6.67 $3.76 $2.75 $2.26 $1.96 $1.76 $1.61<br />
NOTES:<br />
A - based on a dose of 6.0 mg/l <strong>for</strong> additional disinfection and residual disinfection during Apr-Oct when MN WWTPs disinfect and 9 mg/l <strong>for</strong> Nov-Apr to provide main disinfection and residual <strong>for</strong> transmission.<br />
B - escalates 10% <strong>for</strong> flows from 1-10 mgd and 30% <strong>for</strong> flows greater than 10 mgd.<br />
C - costs based on cost curves developed and included in separate worksheet<br />
Total Reuse System Costs_BASE-043007-FORPRINTING.xls, CURVE Model Page 5 of 10 5/2/2007
WATER REUSE SYSTEM COST OF SERVICE TABLE BASE SYSTEM<br />
tions General Items<br />
Variable Lab Costs, $<br />
$0 Sodium Hypochloride, $/gal of 12.5%<br />
100% Chlorine Dose, mg/L (year-round, see Note A)<br />
0% Electrical Power, $/kwhr<br />
20<br />
5.00% FTE Annual Salary with Benefits, $<br />
1% Finance, Operations, Cust Service<br />
Legal<br />
Engineering<br />
Length of Distribution System (mi) Annual Avg Flow/Demand (MGD)<br />
1.0<br />
Summary of Capital Cost Estimates<br />
Description<br />
Treatment Facilities<br />
Storage Facilities<br />
Pump Station<br />
Piping<br />
TOTAL CAPITAL<br />
Cost Components Basis/Methodology<br />
Debt Service (Capital Cost)<br />
Pumping System<br />
Based on debt service payment<br />
Maintenance Labor hours/week at operator rate input-see Note B<br />
Equipment Maintenance Based on % of capital cost input<br />
Electrical Power<br />
Reuse Treatment at WWTP<br />
Based on per Kwh rate input; see Note C<br />
Chlorine Disinfection $/gallon at %Conc input; see Note A<br />
Other From Treatment Module<br />
Laboratory Lab cost input<br />
Electrical Power From Treatment Module<br />
Equipment Maintenance&Labor Based on % of capital cost input<br />
Distribution System Maintenance<br />
General System Management<br />
Equals water system cost/mile-see Note B<br />
Engineering 0.15 FTE base; .05% increase per mgd<br />
Finance and Accounting 0.15 FTE<br />
Legal 0.05 FTE<br />
Customer Service 0.05 FTE<br />
TOTAL OF ALL COST COMPONENTS FOR RECLAIMED WATER:<br />
Length of Distribution System (mi) Annual Avg Flow/Demand (MGD)<br />
1.5<br />
Summary of Capital Cost Estimates<br />
Description<br />
Treatment Facilities<br />
Storage Facilities<br />
Pump Station<br />
Piping<br />
TOTAL CAPITAL<br />
Cost Components Basis/Methodology<br />
Debt Service (Capital Cost) Based on debt service payment<br />
Pumping System<br />
Maintenance Labor hours/week at operator rate input-see Note B<br />
Equipment Maintenance Based on % of capital cost input<br />
Electrical Power Based on per Kwh rate input; see Note C<br />
Reuse Treatment at WWTP<br />
Chlorine Disinfection $/gallon at %Conc input; see Note A<br />
Other From Treatment Module<br />
Laboratory Lab cost input<br />
Electrical Power From Treatment Module<br />
Equipment Maintenance&Labor Based on % of capital cost input<br />
Distribution System Maintenance Equals water system cost/mile-see Note B<br />
General System Management<br />
Engineering 0.15 FTE base; .05% increase per mgd<br />
Finance and Accounting 0.15 FTE<br />
Legal 0.05 FTE<br />
Customer Service 0.05 FTE<br />
TOTAL OF ALL COST COMPONENTS FOR RECLAIMED WATER:<br />
2 2.5 3 3.5 4 4.5 5 10 15 30<br />
Year 1 Cost, $ $/1000 gallons Year 1 Cost, $ $/1000 gallons Year 1 Cost, $ $/1000 gallons Year 1 Cost, $ $/1000 gallons Year 1 Cost, $ $/1000 gallons Year 1 Cost, $ $/1000 gallons Year 1 Cost, $ $/1000 gallons Year 1 Cost, $ $/1000 gallons Year 1 Cost, $ $/1000 gallons Year 1 Cost, $ $/1000 gallons<br />
Capital Cost Capital Cost Capital Cost Capital Cost Capital Cost Capital Cost Capital Cost Capital Cost Capital Cost Capital Cost<br />
$210,000 $225,000 $240,000 $255,000 $270,000 $285,000 $300,000 $400,000 $475,000 $700,000<br />
$0 $0 $0 $0 $0 $0 $0 $0 $0 $0<br />
$971,261 $1,214,076 $1,456,891 $1,699,706 $1,942,522 $2,185,337 $2,428,152 $4,046,920 $6,070,380 $12,140,759<br />
$988,112 $1,108,567 $1,229,021 $1,349,476 $1,469,930 $1,590,385 $1,812,174 $2,518,974 $3,225,774 $5,346,174<br />
$2,169,373 $2,547,642 $2,925,912 $3,304,182 $3,682,452 $4,060,721 $4,540,326 $6,965,894 $9,771,154 $18,186,933<br />
$167,445 $0.23 $196,642 $0.22 $225,839 $0.21 $255,036 $0.20 $284,233 $0.19 $313,430 $0.19 $350,448 $0.19 $537,668 $0.15 $754,194 $0.14 $1,403,772 $0.13<br />
$8,800 $0.01 $8,800 $0.01 $8,800 $0.01 $8,800 $0.01 $8,800 $0.01 $8,800 $0.01 $8,800 $0.00 $10,400 $0.00 $12,800 $0.00 $16,000 $0.00<br />
$9,713 $0.01 $12,141 $0.01 $14,569 $0.01 $16,997 $0.01 $19,425 $0.01 $21,853 $0.01 $24,282 $0.01 $40,469 $0.01 $60,704 $0.01 $121,408 $0.01<br />
$26,800 $0.04 $32,491 $0.04 $38,027 $0.03 $43,437 $0.03 $48,741 $0.03 $53,956 $0.03 $59,091 $0.03 $107,468 $0.03 $152,486 $0.03 $277,324 $0.03<br />
$28,685 $0.04 $35,856 $0.04 $43,027 $0.04 $50,198 $0.04 $57,370 $0.04 $64,541 $0.04 $71,712 $0.04 $143,424 $0.04 $215,136 $0.04 $430,272 $0.04<br />
$0 $0.00 $0 $0.00 $0 $0.00 $0 $0.00 $0 $0.00 $0 $0.00 $0 $0.00 $0 $0.00 $0 $0.00 $0 $0.00<br />
$20,000 $0.03 $20,000 $0.02 $20,000 $0.02 $20,000 $0.02 $20,000 $0.01 $20,000 $0.01 $20,000 $0.01 $20,000 $0.01 $20,000 $0.00 $20,000 $0.00<br />
$0 $0.00 $0 $0.00 $0 $0.00 $0 $0.00 $0 $0.00 $0 $0.00 $0 $0.00 $0 $0.00 $0 $0.00 $0 $0.00<br />
$10,500 $0.01 $11,250 $0.01 $12,000 $0.01 $12,750 $0.01 $13,500 $0.01 $14,250 $0.01 $15,000 $0.01 $20,000 $0.01 $23,750 $0.00 $35,000 $0.00<br />
$5,500 $0.01 $5,500 $0.01 $5,500 $0.01 $5,500 $0.00 $5,500 $0.00 $5,500 $0.00 $5,500 $0.00 $5,500 $0.00 $5,500 $0.00 $5,500 $0.00<br />
$15,750 $0.02 $16,125 $0.02 $16,500 $0.02 $16,875 $0.01 $17,250 $0.01 $17,625 $0.01 $18,000 $0.01 $21,750 $0.01 $25,500 $0.00 $36,750 $0.00<br />
$12,600 $0.02 $12,900 $0.01 $13,200 $0.01 $13,500 $0.01 $13,800 $0.01 $14,100 $0.01 $14,400 $0.01 $17,400 $0.00 $20,400 $0.00 $29,400 $0.00<br />
$7,875 $0.01 $8,063 $0.01 $8,250 $0.01 $8,438 $0.01 $8,625 $0.01 $8,813 $0.01 $9,000 $0.00 $10,875 $0.00 $12,750 $0.00 $18,375 $0.00<br />
$4,200 $0.01 $4,300 $0.00 $4,400 $0.00 $4,500 $0.00 $4,600 $0.00 $4,700 $0.00 $4,800 $0.00 $5,800 $0.00 $6,800 $0.00 $9,800 $0.00<br />
$0.44 $0.40 $0.37 $0.36 $0.34 $0.33 $0.33 $0.26 $0.24 $0.22<br />
2 2.5 3 3.5 4 4.5 5 10 15 30<br />
Year 1 Cost, $ $/1000 gallons Year 1 Cost, $ $/1000 gallons Year 1 Cost, $ $/1000 gallons Year 1 Cost, $ $/1000 gallons Year 1 Cost, $ $/1000 gallons Year 1 Cost, $ $/1000 gallons Year 1 Cost, $ $/1000 gallons Year 1 Cost, $ $/1000 gallons Year 1 Cost, $ $/1000 gallons Year 1 Cost, $ $/1000 gallons<br />
Capital Cost Capital Cost Capital Cost Capital Cost Capital Cost Capital Cost Capital Cost Capital Cost Capital Cost Capital Cost<br />
$210,000 $225,000 $240,000 $255,000 $270,000 $285,000 $300,000 $400,000 $475,000 $700,000<br />
$0 $0 $0 $0 $0 $0 $0 $0 $0 $0<br />
$971,261 $1,214,076 $1,456,891 $1,699,706 $1,942,522 $2,185,337 $2,428,152 $4,046,920 $6,070,380 $12,140,759<br />
$1,482,168 $1,662,850 $1,843,532 $2,024,214 $2,204,896 $2,385,578 $2,718,260 $3,778,460 $4,838,660 $8,019,260<br />
$2,663,429 $3,101,926 $3,540,423 $3,978,920 $4,417,418 $4,855,915 $5,446,412 $8,225,380 $11,384,040 $20,860,019<br />
$205,579 $0.28 $239,424 $0.26 $273,270 $0.25 $307,116 $0.24 $340,962 $0.23 $374,807 $0.23 $420,385 $0.23 $634,882 $0.17 $878,685 $0.16 $1,610,096 $0.15<br />
$8,800 $0.01 $8,800 $0.01 $8,800 $0.01 $8,800 $0.01 $8,800 $0.01 $8,800 $0.01 $8,800 $0.00 $10,400 $0.00 $12,800 $0.00 $16,000 $0.00<br />
$9,713 $0.01 $12,141 $0.01 $14,569 $0.01 $16,997 $0.01 $19,425 $0.01 $21,853 $0.01 $24,282 $0.01 $40,469 $0.01 $60,704 $0.01 $121,408 $0.01<br />
$30,611 $0.04 $36,796 $0.04 $42,766 $0.04 $48,564 $0.04 $54,217 $0.04 $59,748 $0.04 $65,172 $0.04 $115,430 $0.03 $161,266 $0.03 $285,628 $0.03<br />
$28,685 $0.04 $35,856 $0.04 $43,027 $0.04 $50,198 $0.04 $57,370 $0.04 $64,541 $0.04 $71,712 $0.04 $143,424 $0.04 $215,136 $0.04 $430,272 $0.04<br />
$0 $0.00 $0 $0.00 $0 $0.00 $0 $0.00 $0 $0.00 $0 $0.00 $0 $0.00 $0 $0.00 $0 $0.00 $0 $0.00<br />
$20,000 $0.03 $20,000 $0.02 $20,000 $0.02 $20,000 $0.02 $20,000 $0.01 $20,000 $0.01 $20,000 $0.01 $20,000 $0.01 $20,000 $0.00 $20,000 $0.00<br />
$0 $0.00 $0 $0.00 $0 $0.00 $0 $0.00 $0 $0.00 $0 $0.00 $0 $0.00 $0 $0.00 $0 $0.00 $0 $0.00<br />
$10,500 $0.01 $11,250 $0.01 $12,000 $0.01 $12,750 $0.01 $13,500 $0.01 $14,250 $0.01 $15,000 $0.01 $20,000 $0.01 $23,750 $0.00 $35,000 $0.00<br />
$8,250 $0.01 $8,250 $0.01 $8,250 $0.01 $8,250 $0.01 $8,250 $0.01 $8,250 $0.01 $8,250 $0.00 $8,250 $0.00 $8,250 $0.00 $8,250 $0.00<br />
$15,750 $0.02 $16,125 $0.02 $16,500 $0.02 $16,875 $0.01 $17,250 $0.01 $17,625 $0.01 $18,000 $0.01 $21,750 $0.01 $25,500 $0.00 $36,750 $0.00<br />
$12,600 $0.02 $12,900 $0.01 $13,200 $0.01 $13,500 $0.01 $13,800 $0.01 $14,100 $0.01 $14,400 $0.01 $17,400 $0.00 $20,400 $0.00 $29,400 $0.00<br />
$7,875 $0.01 $8,063 $0.01 $8,250 $0.01 $8,438 $0.01 $8,625 $0.01 $8,813 $0.01 $9,000 $0.00 $10,875 $0.00 $12,750 $0.00 $18,375 $0.00<br />
$4,200 $0.01 $4,300 $0.00 $4,400 $0.00 $4,500 $0.00 $4,600 $0.00 $4,700 $0.00 $4,800 $0.00 $5,800 $0.00 $6,800 $0.00 $9,800 $0.00<br />
$0.50 $0.45 $0.42 $0.40 $0.39 $0.38 $0.37 $0.29 $0.26 $0.24<br />
Total Reuse System Costs_BASE-043007-FORPRINTING-2.xls, CURVE Model Page 6 of 10 5/2/2007
WATER REUSE SYSTEM COST OF SERVICE TABLE BASE SYSTEM<br />
tions General Items<br />
Variable Lab Costs, $<br />
$0 Sodium Hypochloride, $/gal of 12.5%<br />
100% Chlorine Dose, mg/L (year-round, see Note A)<br />
0% Electrical Power, $/kwhr<br />
20<br />
5.00% FTE Annual Salary with Benefits, $<br />
1% Finance, Operations, Cust Service<br />
Legal<br />
Engineering<br />
Length of Distribution System (mi) Annual Avg Flow/Demand (MGD)<br />
2.0<br />
Summary of Capital Cost Estimates<br />
Description<br />
Treatment Facilities<br />
Storage Facilities<br />
Pump Station<br />
Piping<br />
TOTAL CAPITAL<br />
Cost Components Basis/Methodology<br />
Debt Service (Capital Cost) Based on debt service payment<br />
Pumping System<br />
Maintenance Labor hours/week at operator rate input-see Note B<br />
Equipment Maintenance Based on % of capital cost input<br />
Electrical Power Based on per Kwh rate input; see Note C<br />
Reuse Treatment at WWTP<br />
Chlorine Disinfection $/gallon at %Conc input; see Note A<br />
Other From Treatment Module<br />
Laboratory Lab cost input<br />
Electrical Power From Treatment Module<br />
Equipment Maintenance&Labor Based on % of capital cost input<br />
Distribution System Maintenance Equals water system cost/mile-see Note B<br />
General System Management<br />
Engineering 0.15 FTE base; .05% increase per mgd<br />
Finance and Accounting 0.15 FTE<br />
Legal 0.05 FTE<br />
Customer Service 0.05 FTE<br />
TOTAL OF ALL COST COMPONENTS FOR RECLAIMED WATER:<br />
Length of Distribution System (mi) Annual Avg Flow/Demand (MGD)<br />
2.5<br />
Summary of Capital Cost Estimates<br />
Description<br />
Treatment Facilities<br />
Storage Facilities<br />
Pump Station<br />
Piping<br />
TOTAL CAPITAL<br />
Cost Components Basis/Methodology<br />
Debt Service (Capital Cost) Based on debt service payment<br />
Pumping System<br />
Maintenance Labor hours/week at operator rate input-see Note B<br />
Equipment Maintenance Based on % of capital cost input<br />
Electrical Power Based on per Kwh rate input; see Note C<br />
Reuse Treatment at WWTP<br />
Chlorine Disinfection $/gallon at %Conc input; see Note A<br />
Other From Treatment Module<br />
Laboratory Lab cost input<br />
Electrical Power From Treatment Module<br />
Equipment Maintenance&Labor Based on % of capital cost input<br />
Distribution System Maintenance Equals water system cost/mile-see Note B<br />
General System Management<br />
Engineering 0.15 FTE base; .05% increase per mgd<br />
Finance and Accounting 0.15 FTE<br />
Legal 0.05 FTE<br />
Customer Service 0.05 FTE<br />
TOTAL OF ALL COST COMPONENTS FOR RECLAIMED WATER:<br />
2 2.5 3 3.5 4 4.5 5 10 15 30<br />
Year 1 Cost, $ $/1000 gallons Year 1 Cost, $ $/1000 gallons Year 1 Cost, $ $/1000 gallons Year 1 Cost, $ $/1000 gallons Year 1 Cost, $ $/1000 gallons Year 1 Cost, $ $/1000 gallons Year 1 Cost, $ $/1000 gallons Year 1 Cost, $ $/1000 gallons Year 1 Cost, $ $/1000 gallons Year 1 Cost, $ $/1000 gallons<br />
Capital Cost Capital Cost Capital Cost Capital Cost Capital Cost Capital Cost Capital Cost Capital Cost Capital Cost Capital Cost<br />
$210,000 $225,000 $240,000 $255,000 $270,000 $285,000 $300,000 $400,000 $475,000 $700,000<br />
$0 $0 $0 $0 $0 $0 $0 $0 $0 $0<br />
$971,261 $1,214,076 $1,456,891 $1,699,706 $1,942,522 $2,185,337 $2,428,152 $4,046,920 $6,070,380 $12,140,759<br />
$1,976,200 $2,217,100 $2,458,000 $2,698,900 $2,939,800 $3,180,700 $3,624,200 $5,037,700 $6,451,200 $10,691,700<br />
$3,157,461 $3,656,176 $4,154,891 $4,653,606 $5,152,322 $5,651,037 $6,352,352 $9,484,620 $12,996,580 $23,532,459<br />
$243,711 $0.33 $282,205 $0.31 $320,698 $0.29 $359,192 $0.28 $397,686 $0.27 $436,179 $0.27 $490,311 $0.27 $732,077 $0.20 $1,003,150 $0.18 $1,816,370 $0.17<br />
$8,800 $0.01 $8,800 $0.01 $8,800 $0.01 $8,800 $0.01 $8,800 $0.01 $8,800 $0.01 $8,800 $0.00 $10,400 $0.00 $12,800 $0.00 $16,000 $0.00<br />
$9,713 $0.01 $12,141 $0.01 $14,569 $0.01 $16,997 $0.01 $19,425 $0.01 $21,853 $0.01 $24,282 $0.01 $40,469 $0.01 $60,704 $0.01 $121,408 $0.01<br />
$34,245 $0.05 $40,934 $0.04 $47,359 $0.04 $53,571 $0.04 $59,607 $0.04 $65,494 $0.04 $71,251 $0.04 $124,020 $0.03 $171,512 $0.03 $298,537 $0.03<br />
$28,685 $0.04 $35,856 $0.04 $43,027 $0.04 $50,198 $0.04 $57,370 $0.04 $64,541 $0.04 $71,712 $0.04 $143,424 $0.04 $215,136 $0.04 $430,272 $0.04<br />
$0 $0.00 $0 $0.00 $0 $0.00 $0 $0.00 $0 $0.00 $0 $0.00 $0 $0.00 $0 $0.00 $0 $0.00 $0 $0.00<br />
$20,000 $0.03 $20,000 $0.02 $20,000 $0.02 $20,000 $0.02 $20,000 $0.01 $20,000 $0.01 $20,000 $0.01 $20,000 $0.01 $20,000 $0.00 $20,000 $0.00<br />
$0 $0.00 $0 $0.00 $0 $0.00 $0 $0.00 $0 $0.00 $0 $0.00 $0 $0.00 $0 $0.00 $0 $0.00 $0 $0.00<br />
$10,500 $0.01 $11,250 $0.01 $12,000 $0.01 $12,750 $0.01 $13,500 $0.01 $14,250 $0.01 $15,000 $0.01 $20,000 $0.01 $23,750 $0.00 $35,000 $0.00<br />
$11,000 $0.02 $11,000 $0.01 $11,000 $0.01 $11,000 $0.01 $11,000 $0.01 $11,000 $0.01 $11,000 $0.01 $11,000 $0.00 $11,000 $0.00 $11,000 $0.00<br />
$15,750 $0.02 $16,125 $0.02 $16,500 $0.02 $16,875 $0.01 $17,250 $0.01 $17,625 $0.01 $18,000 $0.01 $21,750 $0.01 $25,500 $0.00 $36,750 $0.00<br />
$12,600 $0.02 $12,900 $0.01 $13,200 $0.01 $13,500 $0.01 $13,800 $0.01 $14,100 $0.01 $14,400 $0.01 $17,400 $0.00 $20,400 $0.00 $29,400 $0.00<br />
$7,875 $0.01 $8,063 $0.01 $8,250 $0.01 $8,438 $0.01 $8,625 $0.01 $8,813 $0.01 $9,000 $0.00 $10,875 $0.00 $12,750 $0.00 $18,375 $0.00<br />
$4,200 $0.01 $4,300 $0.00 $4,400 $0.00 $4,500 $0.00 $4,600 $0.00 $4,700 $0.00 $4,800 $0.00 $5,800 $0.00 $6,800 $0.00 $9,800 $0.00<br />
$0.56 $0.51 $0.47 $0.45 $0.43 $0.42 $0.42 $0.32 $0.29 $0.26<br />
2 2.5 3 3.5 4 4.5 5 10 15 30<br />
Year 1 Cost, $ $/1000 gallons Year 1 Cost, $ $/1000 gallons Year 1 Cost, $ $/1000 gallons Year 1 Cost, $ $/1000 gallons Year 1 Cost, $ $/1000 gallons Year 1 Cost, $ $/1000 gallons Year 1 Cost, $ $/1000 gallons Year 1 Cost, $ $/1000 gallons Year 1 Cost, $ $/1000 gallons Year 1 Cost, $ $/1000 gallons<br />
Capital Cost Capital Cost Capital Cost Capital Cost Capital Cost Capital Cost Capital Cost Capital Cost Capital Cost Capital Cost<br />
$210,000 $225,000 $240,000 $255,000 $270,000 $285,000 $300,000 $400,000 $475,000 $700,000<br />
$0 $0 $0 $0 $0 $0 $0 $0 $0 $0<br />
$971,261 $1,214,076 $1,456,891 $1,699,706 $1,942,522 $2,185,337 $2,428,152 $4,046,920 $6,070,380 $12,140,759<br />
$2,470,300 $2,771,450 $3,072,600 $3,373,750 $3,674,900 $3,976,050 $4,530,400 $6,297,400 $8,064,400 $13,365,400<br />
$3,651,561 $4,210,526 $4,769,491 $5,328,456 $5,887,422 $6,446,387 $7,258,552 $10,744,320 $14,609,780 $26,206,159<br />
$281,848 $0.39 $324,993 $0.36 $368,137 $0.34 $411,281 $0.32 $454,425 $0.31 $497,569 $0.30 $560,257 $0.31 $829,308 $0.23 $1,127,666 $0.21 $2,022,741 $0.18<br />
$8,800 $0.01 $8,800 $0.01 $8,800 $0.01 $8,800 $0.01 $8,800 $0.01 $8,800 $0.01 $8,800 $0.00 $10,400 $0.00 $12,800 $0.00 $16,000 $0.00<br />
$9,713 $0.01 $12,141 $0.01 $14,569 $0.01 $16,997 $0.01 $19,425 $0.01 $21,853 $0.01 $24,282 $0.01 $40,469 $0.01 $60,704 $0.01 $121,408 $0.01<br />
$37,957 $0.05 $45,022 $0.05 $51,761 $0.05 $58,239 $0.05 $64,503 $0.04 $70,585 $0.04 $76,510 $0.04 $130,019 $0.04 $177,303 $0.03 $301,303 $0.03<br />
$28,685 $0.04 $35,856 $0.04 $43,027 $0.04 $50,198 $0.04 $57,370 $0.04 $64,541 $0.04 $71,712 $0.04 $143,424 $0.04 $215,136 $0.04 $430,272 $0.04<br />
$0 $0.00 $0 $0.00 $0 $0.00 $0 $0.00 $0 $0.00 $0 $0.00 $0 $0.00 $0 $0.00 $0 $0.00 $0 $0.00<br />
$20,000 $0.03 $20,000 $0.02 $20,000 $0.02 $20,000 $0.02 $20,000 $0.01 $20,000 $0.01 $20,000 $0.01 $20,000 $0.01 $20,000 $0.00 $20,000 $0.00<br />
$0 $0.00 $0 $0.00 $0 $0.00 $0 $0.00 $0 $0.00 $0 $0.00 $0 $0.00 $0 $0.00 $0 $0.00 $0 $0.00<br />
$10,500 $0.01 $11,250 $0.01 $12,000 $0.01 $12,750 $0.01 $13,500 $0.01 $14,250 $0.01 $15,000 $0.01 $20,000 $0.01 $23,750 $0.00 $35,000 $0.00<br />
$13,750 $0.02 $13,750 $0.02 $13,750 $0.01 $13,750 $0.01 $13,750 $0.01 $13,750 $0.01 $13,750 $0.01 $13,750 $0.00 $13,750 $0.00 $13,750 $0.00<br />
$15,750 $0.02 $16,125 $0.02 $16,500 $0.02 $16,875 $0.01 $17,250 $0.01 $17,625 $0.01 $18,000 $0.01 $21,750 $0.01 $25,500 $0.00 $36,750 $0.00<br />
$12,600 $0.02 $12,900 $0.01 $13,200 $0.01 $13,500 $0.01 $13,800 $0.01 $14,100 $0.01 $14,400 $0.01 $17,400 $0.00 $20,400 $0.00 $29,400 $0.00<br />
$7,875 $0.01 $8,063 $0.01 $8,250 $0.01 $8,438 $0.01 $8,625 $0.01 $8,813 $0.01 $9,000 $0.00 $10,875 $0.00 $12,750 $0.00 $18,375 $0.00<br />
$4,200 $0.01 $4,300 $0.00 $4,400 $0.00 $4,500 $0.00 $4,600 $0.00 $4,700 $0.00 $4,800 $0.00 $5,800 $0.00 $6,800 $0.00 $9,800 $0.00<br />
$0.62 $0.56 $0.52 $0.50 $0.48 $0.46 $0.46 $0.35 $0.31 $0.28<br />
Total Reuse System Costs_BASE-043007-FORPRINTING-2.xls, CURVE Model Page 7 of 10 5/2/2007
WATER REUSE SYSTEM COST OF SERVICE TABLE BASE SYSTEM<br />
tions General Items<br />
Variable Lab Costs, $<br />
$0 Sodium Hypochloride, $/gal of 12.5%<br />
100% Chlorine Dose, mg/L (year-round, see Note A)<br />
0% Electrical Power, $/kwhr<br />
20<br />
5.00% FTE Annual Salary with Benefits, $<br />
1% Finance, Operations, Cust Service<br />
Legal<br />
Engineering<br />
Length of Distribution System (mi) Annual Avg Flow/Demand (MGD)<br />
3.0<br />
Summary of Capital Cost Estimates<br />
Description<br />
Treatment Facilities<br />
Storage Facilities<br />
Pump Station<br />
Piping<br />
TOTAL CAPITAL<br />
Cost Components Basis/Methodology<br />
Debt Service (Capital Cost) Based on debt service payment<br />
Pumping System<br />
Maintenance Labor hours/week at operator rate input-see Note B<br />
Equipment Maintenance Based on % of capital cost input<br />
Electrical Power Based on per Kwh rate input; see Note C<br />
Reuse Treatment at WWTP<br />
Chlorine Disinfection $/gallon at %Conc input; see Note A<br />
Other From Treatment Module<br />
Laboratory Lab cost input<br />
Electrical Power From Treatment Module<br />
Equipment Maintenance&Labor Based on % of capital cost input<br />
Distribution System Maintenance Equals water system cost/mile-see Note B<br />
General System Management<br />
Engineering 0.15 FTE base; .05% increase per mgd<br />
Finance and Accounting 0.15 FTE<br />
Legal 0.05 FTE<br />
Customer Service 0.05 FTE<br />
TOTAL OF ALL COST COMPONENTS FOR RECLAIMED WATER:<br />
Length of Distribution System (mi) Annual Avg Flow/Demand (MGD)<br />
3.5<br />
Summary of Capital Cost Estimates<br />
Description<br />
Treatment Facilities<br />
Storage Facilities<br />
Pump Station<br />
Piping<br />
TOTAL CAPITAL<br />
Cost Components Basis/Methodology<br />
Debt Service (Capital Cost) Based on debt service payment<br />
Pumping System<br />
Maintenance Labor hours/week at operator rate input-see Note B<br />
Equipment Maintenance Based on % of capital cost input<br />
Electrical Power Based on per Kwh rate input; see Note C<br />
Reuse Treatment at WWTP<br />
Chlorine Disinfection $/gallon at %Conc input; see Note A<br />
Other From Treatment Module<br />
Laboratory Lab cost input<br />
Electrical Power From Treatment Module<br />
Equipment Maintenance&Labor Based on % of capital cost input<br />
Distribution System Maintenance Equals water system cost/mile-see Note B<br />
General System Management<br />
Engineering 0.15 FTE base; .05% increase per mgd<br />
Finance and Accounting 0.15 FTE<br />
Legal 0.05 FTE<br />
Customer Service 0.05 FTE<br />
TOTAL OF ALL COST COMPONENTS FOR RECLAIMED WATER:<br />
2 2.5 3 3.5 4 4.5 5 10 15 30<br />
Year 1 Cost, $ $/1000 gallons Year 1 Cost, $ $/1000 gallons Year 1 Cost, $ $/1000 gallons Year 1 Cost, $ $/1000 gallons Year 1 Cost, $ $/1000 gallons Year 1 Cost, $ $/1000 gallons Year 1 Cost, $ $/1000 gallons Year 1 Cost, $ $/1000 gallons Year 1 Cost, $ $/1000 gallons Year 1 Cost, $ $/1000 gallons<br />
Capital Cost Capital Cost Capital Cost Capital Cost Capital Cost Capital Cost Capital Cost Capital Cost Capital Cost Capital Cost<br />
$210,000 $225,000 $240,000 $255,000 $270,000 $285,000 $300,000 $400,000 $475,000 $700,000<br />
$0 $0 $0 $0 $0 $0 $0 $0 $0 $0<br />
$971,261 $1,214,076 $1,456,891 $1,699,706 $1,942,522 $2,185,337 $2,428,152 $4,046,920 $6,070,380 $12,140,759<br />
$2,964,300 $3,325,650 $3,687,000 $4,048,350 $4,409,700 $4,771,050 $5,436,600 $7,557,100 $9,677,600 $16,039,100<br />
$4,145,561 $4,764,726 $5,383,891 $6,003,056 $6,622,222 $7,241,387 $8,164,752 $12,004,020 $16,222,980 $28,879,859<br />
$319,978 $0.44 $367,769 $0.40 $415,560 $0.38 $463,350 $0.36 $511,141 $0.35 $558,932 $0.34 $630,202 $0.35 $926,539 $0.25 $1,252,182 $0.23 $2,229,113 $0.20<br />
$8,800 $0.01 $8,800 $0.01 $8,800 $0.01 $8,800 $0.01 $8,800 $0.01 $8,800 $0.01 $8,800 $0.00 $10,400 $0.00 $12,800 $0.00 $16,000 $0.00<br />
$9,713 $0.01 $12,141 $0.01 $14,569 $0.01 $16,997 $0.01 $19,425 $0.01 $21,853 $0.01 $24,282 $0.01 $40,469 $0.01 $60,704 $0.01 $121,408 $0.01<br />
$39,662 $0.05 $47,177 $0.05 $54,362 $0.05 $61,285 $0.05 $67,991 $0.05 $74,512 $0.05 $80,874 $0.04 $138,640 $0.04 $190,028 $0.03 $325,760 $0.03<br />
$28,685 $0.04 $35,856 $0.04 $43,027 $0.04 $50,198 $0.04 $57,370 $0.04 $64,541 $0.04 $71,712 $0.04 $143,424 $0.04 $215,136 $0.04 $430,272 $0.04<br />
$0 $0.00 $0 $0.00 $0 $0.00 $0 $0.00 $0 $0.00 $0 $0.00 $0 $0.00 $0 $0.00 $0 $0.00 $0 $0.00<br />
$20,000 $0.03 $20,000 $0.02 $20,000 $0.02 $20,000 $0.02 $20,000 $0.01 $20,000 $0.01 $20,000 $0.01 $20,000 $0.01 $20,000 $0.00 $20,000 $0.00<br />
$0 $0.00 $0 $0.00 $0 $0.00 $0 $0.00 $0 $0.00 $0 $0.00 $0 $0.00 $0 $0.00 $0 $0.00 $0 $0.00<br />
$10,500 $0.01 $11,250 $0.01 $12,000 $0.01 $12,750 $0.01 $13,500 $0.01 $14,250 $0.01 $15,000 $0.01 $20,000 $0.01 $23,750 $0.00 $35,000 $0.00<br />
$16,500 $0.02 $16,500 $0.02 $16,500 $0.02 $16,500 $0.01 $16,500 $0.01 $16,500 $0.01 $16,500 $0.01 $16,500 $0.00 $16,500 $0.00 $16,500 $0.00<br />
$15,750 $0.02 $16,125 $0.02 $16,500 $0.02 $16,875 $0.01 $17,250 $0.01 $17,625 $0.01 $18,000 $0.01 $21,750 $0.01 $25,500 $0.00 $36,750 $0.00<br />
$12,600 $0.02 $12,900 $0.01 $13,200 $0.01 $13,500 $0.01 $13,800 $0.01 $14,100 $0.01 $14,400 $0.01 $17,400 $0.00 $20,400 $0.00 $29,400 $0.00<br />
$7,875 $0.01 $8,063 $0.01 $8,250 $0.01 $8,438 $0.01 $8,625 $0.01 $8,813 $0.01 $9,000 $0.00 $10,875 $0.00 $12,750 $0.00 $18,375 $0.00<br />
$4,200 $0.01 $4,300 $0.00 $4,400 $0.00 $4,500 $0.00 $4,600 $0.00 $4,700 $0.00 $4,800 $0.00 $5,800 $0.00 $6,800 $0.00 $9,800 $0.00<br />
$0.68 $0.61 $0.57 $0.54 $0.52 $0.50 $0.50 $0.38 $0.34 $0.30<br />
2 2.5 3 3.5 4 4.5 5 10 15 30<br />
Year 1 Cost, $ $/1000 gallons Year 1 Cost, $ $/1000 gallons Year 1 Cost, $ $/1000 gallons Year 1 Cost, $ $/1000 gallons Year 1 Cost, $ $/1000 gallons Year 1 Cost, $ $/1000 gallons Year 1 Cost, $ $/1000 gallons Year 1 Cost, $ $/1000 gallons Year 1 Cost, $ $/1000 gallons Year 1 Cost, $ $/1000 gallons<br />
Capital Cost Capital Cost Capital Cost Capital Cost Capital Cost Capital Cost Capital Cost Capital Cost Capital Cost Capital Cost<br />
$210,000 $225,000 $240,000 $255,000 $270,000 $285,000 $300,000 $400,000 $475,000 $700,000<br />
$0 $0 $0 $0 $0 $0 $0 $0 $0 $0<br />
$971,261 $1,214,076 $1,456,891 $1,699,706 $1,942,522 $2,185,337 $2,428,152 $4,046,920 $6,070,380 $12,140,759<br />
$3,458,400 $3,880,000 $4,301,600 $4,723,200 $5,144,800 $5,566,400 $6,342,800 $8,816,800 $11,290,800 $18,712,800<br />
$4,639,661 $5,319,076 $5,998,491 $6,677,906 $7,357,322 $8,036,737 $9,070,952 $13,263,720 $17,836,180 $31,553,559<br />
$358,116 $0.49 $410,557 $0.45 $462,998 $0.42 $515,439 $0.40 $567,880 $0.39 $620,321 $0.38 $700,148 $0.38 $1,023,770 $0.28 $1,376,698 $0.25 $2,435,484 $0.22<br />
$8,800 $0.01 $8,800 $0.01 $8,800 $0.01 $8,800 $0.01 $8,800 $0.01 $8,800 $0.01 $8,800 $0.00 $10,400 $0.00 $12,800 $0.00 $16,000 $0.00<br />
$9,713 $0.01 $12,141 $0.01 $14,569 $0.01 $16,997 $0.01 $19,425 $0.01 $21,853 $0.01 $24,282 $0.01 $40,469 $0.01 $60,704 $0.01 $121,408 $0.01<br />
$42,062 $0.06 $49,955 $0.05 $57,492 $0.05 $64,744 $0.05 $71,762 $0.05 $78,581 $0.05 $85,228 $0.05 $145,408 $0.04 $198,747 $0.04 $339,082 $0.03<br />
$28,685 $0.04 $35,856 $0.04 $43,027 $0.04 $50,198 $0.04 $57,370 $0.04 $64,541 $0.04 $71,712 $0.04 $143,424 $0.04 $215,136 $0.04 $430,272 $0.04<br />
$0 $0.00 $0 $0.00 $0 $0.00 $0 $0.00 $0 $0.00 $0 $0.00 $0 $0.00 $0 $0.00 $0 $0.00 $0 $0.00<br />
$20,000 $0.03 $20,000 $0.02 $20,000 $0.02 $20,000 $0.02 $20,000 $0.01 $20,000 $0.01 $20,000 $0.01 $20,000 $0.01 $20,000 $0.00 $20,000 $0.00<br />
$0 $0.00 $0 $0.00 $0 $0.00 $0 $0.00 $0 $0.00 $0 $0.00 $0 $0.00 $0 $0.00 $0 $0.00 $0 $0.00<br />
$10,500 $0.01 $11,250 $0.01 $12,000 $0.01 $12,750 $0.01 $13,500 $0.01 $14,250 $0.01 $15,000 $0.01 $20,000 $0.01 $23,750 $0.00 $35,000 $0.00<br />
$19,250 $0.03 $19,250 $0.02 $19,250 $0.02 $19,250 $0.02 $19,250 $0.01 $19,250 $0.01 $19,250 $0.01 $19,250 $0.01 $19,250 $0.00 $19,250 $0.00<br />
$15,750 $0.02 $16,125 $0.02 $16,500 $0.02 $16,875 $0.01 $17,250 $0.01 $17,625 $0.01 $18,000 $0.01 $21,750 $0.01 $25,500 $0.00 $36,750 $0.00<br />
$12,600 $0.02 $12,900 $0.01 $13,200 $0.01 $13,500 $0.01 $13,800 $0.01 $14,100 $0.01 $14,400 $0.01 $17,400 $0.00 $20,400 $0.00 $29,400 $0.00<br />
$7,875 $0.01 $8,063 $0.01 $8,250 $0.01 $8,438 $0.01 $8,625 $0.01 $8,813 $0.01 $9,000 $0.00 $10,875 $0.00 $12,750 $0.00 $18,375 $0.00<br />
$4,200 $0.01 $4,300 $0.00 $4,400 $0.00 $4,500 $0.00 $4,600 $0.00 $4,700 $0.00 $4,800 $0.00 $5,800 $0.00 $6,800 $0.00 $9,800 $0.00<br />
$0.74 $0.67 $0.62 $0.59 $0.56 $0.54 $0.54 $0.41 $0.36 $0.32<br />
Total Reuse System Costs_BASE-043007-FORPRINTING-2.xls, CURVE Model Page 8 of 10 5/2/2007
WATER REUSE SYSTEM COST OF SERVICE TABLE BASE SYSTEM<br />
tions General Items<br />
Variable Lab Costs, $<br />
$0 Sodium Hypochloride, $/gal of 12.5%<br />
100% Chlorine Dose, mg/L (year-round, see Note A)<br />
0% Electrical Power, $/kwhr<br />
20<br />
5.00% FTE Annual Salary with Benefits, $<br />
1% Finance, Operations, Cust Service<br />
Legal<br />
Engineering<br />
Length of Distribution System (mi) Annual Avg Flow/Demand (MGD)<br />
4.0<br />
Summary of Capital Cost Estimates<br />
Description<br />
Treatment Facilities<br />
Storage Facilities<br />
Pump Station<br />
Piping<br />
TOTAL CAPITAL<br />
Cost Components Basis/Methodology<br />
Debt Service (Capital Cost) Based on debt service payment<br />
Pumping System<br />
Maintenance Labor hours/week at operator rate input-see Note B<br />
Equipment Maintenance Based on % of capital cost input<br />
Electrical Power Based on per Kwh rate input; see Note C<br />
Reuse Treatment at WWTP<br />
Chlorine Disinfection $/gallon at %Conc input; see Note A<br />
Other From Treatment Module<br />
Laboratory Lab cost input<br />
Electrical Power From Treatment Module<br />
Equipment Maintenance&Labor Based on % of capital cost input<br />
Distribution System Maintenance Equals water system cost/mile-see Note B<br />
General System Management<br />
Engineering 0.15 FTE base; .05% increase per mgd<br />
Finance and Accounting 0.15 FTE<br />
Legal 0.05 FTE<br />
Customer Service 0.05 FTE<br />
TOTAL OF ALL COST COMPONENTS FOR RECLAIMED WATER:<br />
Length of Distribution System (mi) Annual Avg Flow/Demand (MGD)<br />
4.5<br />
Summary of Capital Cost Estimates<br />
Description<br />
Treatment Facilities<br />
Storage Facilities<br />
Pump Station<br />
Piping<br />
TOTAL CAPITAL<br />
Cost Components Basis/Methodology<br />
Debt Service (Capital Cost) Based on debt service payment<br />
Pumping System<br />
Maintenance Labor hours/week at operator rate input-see Note B<br />
Equipment Maintenance Based on % of capital cost input<br />
Electrical Power Based on per Kwh rate input; see Note C<br />
Reuse Treatment at WWTP<br />
Chlorine Disinfection $/gallon at %Conc input; see Note A<br />
Other From Treatment Module<br />
Laboratory Lab cost input<br />
Electrical Power From Treatment Module<br />
Equipment Maintenance&Labor Based on % of capital cost input<br />
Distribution System Maintenance Equals water system cost/mile-see Note B<br />
General System Management<br />
Engineering 0.15 FTE base; .05% increase per mgd<br />
Finance and Accounting 0.15 FTE<br />
Legal 0.05 FTE<br />
Customer Service 0.05 FTE<br />
TOTAL OF ALL COST COMPONENTS FOR RECLAIMED WATER:<br />
2 2.5 3 3.5 4 4.5 5 10 15 30<br />
Year 1 Cost, $ $/1000 gallons Year 1 Cost, $ $/1000 gallons Year 1 Cost, $ $/1000 gallons Year 1 Cost, $ $/1000 gallons Year 1 Cost, $ $/1000 gallons Year 1 Cost, $ $/1000 gallons Year 1 Cost, $ $/1000 gallons Year 1 Cost, $ $/1000 gallons Year 1 Cost, $ $/1000 gallons Year 1 Cost, $ $/1000 gallons<br />
Capital Cost Capital Cost Capital Cost Capital Cost Capital Cost Capital Cost Capital Cost Capital Cost Capital Cost Capital Cost<br />
$210,000 $225,000 $240,000 $255,000 $270,000 $285,000 $300,000 $400,000 $475,000 $700,000<br />
$0 $0 $0 $0 $0 $0 $0 $0 $0 $0<br />
$971,261 $1,214,076 $1,456,891 $1,699,706 $1,942,522 $2,185,337 $2,428,152 $4,046,920 $6,070,380 $12,140,759<br />
$3,952,400 $4,434,200 $4,916,000 $5,397,800 $5,879,600 $6,361,400 $7,248,500 $10,075,500 $12,902,500 $21,383,500<br />
$5,133,661 $5,873,276 $6,612,891 $7,352,506 $8,092,122 $8,831,737 $9,976,652 $14,522,420 $19,447,880 $34,224,259<br />
$396,245 $0.54 $453,333 $0.50 $510,421 $0.47 $567,509 $0.44 $624,596 $0.43 $681,684 $0.42 $770,055 $0.42 $1,120,924 $0.31 $1,501,099 $0.27 $2,641,624 $0.24<br />
$8,800 $0.01 $8,800 $0.01 $8,800 $0.01 $8,800 $0.01 $8,800 $0.01 $8,800 $0.01 $8,800 $0.00 $10,400 $0.00 $12,800 $0.00 $16,000 $0.00<br />
$9,713 $0.01 $12,141 $0.01 $14,569 $0.01 $16,997 $0.01 $19,425 $0.01 $21,853 $0.01 $24,282 $0.01 $40,469 $0.01 $60,704 $0.01 $121,408 $0.01<br />
$49,141 $0.07 $58,647 $0.06 $67,763 $0.06 $76,568 $0.06 $85,115 $0.06 $93,443 $0.06 $101,580 $0.06 $175,944 $0.05 $242,620 $0.04 $420,236 $0.04<br />
$28,685 $0.04 $35,856 $0.04 $43,027 $0.04 $50,198 $0.04 $57,370 $0.04 $64,541 $0.04 $71,712 $0.04 $143,424 $0.04 $215,136 $0.04 $430,272 $0.04<br />
$0 $0.00 $0 $0.00 $0 $0.00 $0 $0.00 $0 $0.00 $0 $0.00 $0 $0.00 $0 $0.00 $0 $0.00 $0 $0.00<br />
$20,000 $0.03 $20,000 $0.02 $20,000 $0.02 $20,000 $0.02 $20,000 $0.01 $20,000 $0.01 $20,000 $0.01 $20,000 $0.01 $20,000 $0.00 $20,000 $0.00<br />
$0 $0.00 $0 $0.00 $0 $0.00 $0 $0.00 $0 $0.00 $0 $0.00 $0 $0.00 $0 $0.00 $0 $0.00 $0 $0.00<br />
$10,500 $0.01 $11,250 $0.01 $12,000 $0.01 $12,750 $0.01 $13,500 $0.01 $14,250 $0.01 $15,000 $0.01 $20,000 $0.01 $23,750 $0.00 $35,000 $0.00<br />
$22,000 $0.03 $22,000 $0.02 $22,000 $0.02 $22,000 $0.02 $22,000 $0.02 $22,000 $0.01 $22,000 $0.01 $22,000 $0.01 $22,000 $0.00 $22,000 $0.00<br />
$15,750 $0.02 $16,125 $0.02 $16,500 $0.02 $16,875 $0.01 $17,250 $0.01 $17,625 $0.01 $18,000 $0.01 $21,750 $0.01 $25,500 $0.00 $36,750 $0.00<br />
$12,600 $0.02 $12,900 $0.01 $13,200 $0.01 $13,500 $0.01 $13,800 $0.01 $14,100 $0.01 $14,400 $0.01 $17,400 $0.00 $20,400 $0.00 $29,400 $0.00<br />
$7,875 $0.01 $8,063 $0.01 $8,250 $0.01 $8,438 $0.01 $8,625 $0.01 $8,813 $0.01 $9,000 $0.00 $10,875 $0.00 $12,750 $0.00 $18,375 $0.00<br />
$4,200 $0.01 $4,300 $0.00 $4,400 $0.00 $4,500 $0.00 $4,600 $0.00 $4,700 $0.00 $4,800 $0.00 $5,800 $0.00 $6,800 $0.00 $9,800 $0.00<br />
$0.80 $0.73 $0.68 $0.64 $0.61 $0.59 $0.59 $0.44 $0.40 $0.35<br />
2 2.5 3 3.5 4 4.5 5 10 15 30<br />
Year 1 Cost, $ $/1000 gallons Year 1 Cost, $ $/1000 gallons Year 1 Cost, $ $/1000 gallons Year 1 Cost, $ $/1000 gallons Year 1 Cost, $ $/1000 gallons Year 1 Cost, $ $/1000 gallons Year 1 Cost, $ $/1000 gallons Year 1 Cost, $ $/1000 gallons Year 1 Cost, $ $/1000 gallons Year 1 Cost, $ $/1000 gallons<br />
Capital Cost Capital Cost Capital Cost Capital Cost Capital Cost Capital Cost Capital Cost Capital Cost Capital Cost Capital Cost<br />
$210,000 $225,000 $240,000 $255,000 $270,000 $285,000 $300,000 $400,000 $475,000 $700,000<br />
$0 $0 $0 $0 $0 $0 $0 $0 $0 $0<br />
$971,261 $1,214,076 $1,456,891 $1,699,706 $1,942,522 $2,185,337 $2,428,152 $4,046,920 $6,070,380 $12,140,759<br />
$4,446,500 $4,988,550 $5,530,600 $6,072,650 $6,614,700 $7,156,750 $8,154,700 $11,335,200 $14,515,700 $24,057,200<br />
$5,627,761 $6,427,626 $7,227,491 $8,027,356 $8,827,222 $9,627,087 $10,882,852 $15,782,120 $21,061,080 $36,897,959<br />
$434,383 $0.60 $496,121 $0.54 $557,859 $0.51 $619,597 $0.49 $681,336 $0.47 $743,074 $0.45 $840,001 $0.46 $1,218,154 $0.33 $1,625,615 $0.30 $2,847,996 $0.26<br />
$8,800 $0.01 $8,800 $0.01 $8,800 $0.01 $8,800 $0.01 $8,800 $0.01 $8,800 $0.01 $8,800 $0.00 $10,400 $0.00 $12,800 $0.00 $16,000 $0.00<br />
$9,713 $0.01 $12,141 $0.01 $14,569 $0.01 $16,997 $0.01 $19,425 $0.01 $21,853 $0.01 $24,282 $0.01 $40,469 $0.01 $60,704 $0.01 $121,408 $0.01<br />
$45,805 $0.06 $54,376 $0.06 $62,557 $0.06 $70,426 $0.06 $78,039 $0.05 $85,435 $0.05 $92,642 $0.05 $157,837 $0.04 $215,562 $0.04 $367,260 $0.03<br />
$28,685 $0.04 $35,856 $0.04 $43,027 $0.04 $50,198 $0.04 $57,370 $0.04 $64,541 $0.04 $71,712 $0.04 $143,424 $0.04 $215,136 $0.04 $430,272 $0.04<br />
$0 $0.00 $0 $0.00 $0 $0.00 $0 $0.00 $0 $0.00 $0 $0.00 $0 $0.00 $0 $0.00 $0 $0.00 $0 $0.00<br />
$20,000 $0.03 $20,000 $0.02 $20,000 $0.02 $20,000 $0.02 $20,000 $0.01 $20,000 $0.01 $20,000 $0.01 $20,000 $0.01 $20,000 $0.00 $20,000 $0.00<br />
$0 $0.00 $0 $0.00 $0 $0.00 $0 $0.00 $0 $0.00 $0 $0.00 $0 $0.00 $0 $0.00 $0 $0.00 $0 $0.00<br />
$10,500 $0.01 $11,250 $0.01 $12,000 $0.01 $12,750 $0.01 $13,500 $0.01 $14,250 $0.01 $15,000 $0.01 $20,000 $0.01 $23,750 $0.00 $35,000 $0.00<br />
$24,750 $0.03 $24,750 $0.03 $24,750 $0.02 $24,750 $0.02 $24,750 $0.02 $24,750 $0.02 $24,750 $0.01 $24,750 $0.01 $24,750 $0.00 $24,750 $0.00<br />
$15,750 $0.02 $16,125 $0.02 $16,500 $0.02 $16,875 $0.01 $17,250 $0.01 $17,625 $0.01 $18,000 $0.01 $21,750 $0.01 $25,500 $0.00 $36,750 $0.00<br />
$12,600 $0.02 $12,900 $0.01 $13,200 $0.01 $13,500 $0.01 $13,800 $0.01 $14,100 $0.01 $14,400 $0.01 $17,400 $0.00 $20,400 $0.00 $29,400 $0.00<br />
$7,875 $0.01 $8,063 $0.01 $8,250 $0.01 $8,438 $0.01 $8,625 $0.01 $8,813 $0.01 $9,000 $0.00 $10,875 $0.00 $12,750 $0.00 $18,375 $0.00<br />
$4,200 $0.01 $4,300 $0.00 $4,400 $0.00 $4,500 $0.00 $4,600 $0.00 $4,700 $0.00 $4,800 $0.00 $5,800 $0.00 $6,800 $0.00 $9,800 $0.00<br />
$0.85 $0.77 $0.72 $0.68 $0.65 $0.63 $0.63 $0.46 $0.41 $0.36<br />
Total Reuse System Costs_BASE-043007-FORPRINTING-2.xls, CURVE Model Page 9 of 10 5/2/2007
WATER REUSE SYSTEM COST OF SERVICE TABLE BASE SYSTEM<br />
tions General Items<br />
Variable Lab Costs, $<br />
$0 Sodium Hypochloride, $/gal of 12.5%<br />
100% Chlorine Dose, mg/L (year-round, see Note A)<br />
0% Electrical Power, $/kwhr<br />
20<br />
5.00% FTE Annual Salary with Benefits, $<br />
1% Finance, Operations, Cust Service<br />
Legal<br />
Engineering<br />
Length of Distribution System (mi) Annual Avg Flow/Demand (MGD)<br />
5.0<br />
Summary of Capital Cost Estimates<br />
Description<br />
Treatment Facilities<br />
Storage Facilities<br />
Pump Station<br />
Piping<br />
TOTAL CAPITAL<br />
Cost Components Basis/Methodology<br />
Debt Service (Capital Cost) Based on debt service payment<br />
Pumping System<br />
Maintenance Labor hours/week at operator rate input-see Note B<br />
Equipment Maintenance Based on % of capital cost input<br />
Electrical Power Based on per Kwh rate input; see Note C<br />
Reuse Treatment at WWTP<br />
Chlorine Disinfection $/gallon at %Conc input; see Note A<br />
Other From Treatment Module<br />
Laboratory Lab cost input<br />
Electrical Power From Treatment Module<br />
Equipment Maintenance&Labor Based on % of capital cost input<br />
Distribution System Maintenance Equals water system cost/mile-see Note B<br />
General System Management<br />
Engineering 0.15 FTE base; .05% increase per mgd<br />
Finance and Accounting 0.15 FTE<br />
Legal 0.05 FTE<br />
Customer Service 0.05 FTE<br />
TOTAL OF ALL COST COMPONENTS FOR RECLAIMED WATER:<br />
Length of Distribution System (mi) Annual Avg Flow/Demand (MGD)<br />
10.0<br />
Summary of Capital Cost Estimates<br />
Description<br />
Treatment Facilities<br />
Storage Facilities<br />
Pump Station<br />
Piping<br />
TOTAL CAPITAL<br />
Cost Components Basis/Methodology<br />
Debt Service (Capital Cost) Based on debt service payment<br />
Pumping System<br />
Maintenance Labor hours/week at operator rate input-see Note B<br />
Equipment Maintenance Based on % of capital cost input<br />
Electrical Power Based on per Kwh rate input; see Note C<br />
Reuse Treatment at WWTP<br />
Chlorine Disinfection $/gallon at %Conc input; see Note A<br />
Other From Treatment Module<br />
Laboratory Lab cost input<br />
Electrical Power From Treatment Module<br />
Equipment Maintenance&Labor Based on % of capital cost input<br />
Distribution System Maintenance Equals water system cost/mile-see Note B<br />
General System Management<br />
Engineering 0.15 FTE base; .05% increase per mgd<br />
Finance and Accounting 0.15 FTE<br />
Legal 0.05 FTE<br />
Customer Service 0.05 FTE<br />
TOTAL OF ALL COST COMPONENTS FOR RECLAIMED WATER:<br />
NOTES:<br />
A - based on a dose of 6.0 mg/l <strong>for</strong> additional disinfection and residual disinfection during Apr-<br />
B - escalates 10% <strong>for</strong> flows from 1-10 mgd and 30% <strong>for</strong> flows greater than 10 mgd.<br />
C - costs based on cost curves developed and included in separate worksheet<br />
2 2.5 3 3.5 4 4.5 5 10 15 30<br />
Year 1 Cost, $ $/1000 gallons Year 1 Cost, $ $/1000 gallons Year 1 Cost, $ $/1000 gallons Year 1 Cost, $ $/1000 gallons Year 1 Cost, $ $/1000 gallons Year 1 Cost, $ $/1000 gallons Year 1 Cost, $ $/1000 gallons Year 1 Cost, $ $/1000 gallons Year 1 Cost, $ $/1000 gallons Year 1 Cost, $ $/1000 gallons<br />
Capital Cost Capital Cost Capital Cost Capital Cost Capital Cost Capital Cost Capital Cost Capital Cost Capital Cost Capital Cost<br />
$210,000 $225,000 $240,000 $255,000 $270,000 $285,000 $300,000 $400,000 $475,000 $700,000<br />
$0 $0 $0 $0 $0 $0 $0 $0 $0 $0<br />
$971,261 $1,214,076 $1,456,891 $1,699,706 $1,942,522 $2,185,337 $2,428,152 $4,046,920 $6,070,380 $12,140,759<br />
$4,940,500 $5,542,750 $6,145,000 $6,747,250 $7,349,500 $7,951,750 $9,060,900 $12,594,900 $16,128,900 $26,730,900<br />
$6,121,761 $6,981,826 $7,841,891 $8,701,956 $9,562,022 $10,422,087 $11,789,052 $17,041,820 $22,674,280 $39,571,659<br />
$472,513 $0.65 $538,897 $0.59 $605,282 $0.55 $671,667 $0.53 $738,052 $0.51 $804,436 $0.49 $909,947 $0.50 $1,315,385 $0.36 $1,750,131 $0.32 $3,054,367 $0.28<br />
$8,800 $0.01 $8,800 $0.01 $8,800 $0.01 $8,800 $0.01 $8,800 $0.01 $8,800 $0.01 $8,800 $0.00 $10,400 $0.00 $12,800 $0.00 $16,000 $0.00<br />
$9,713 $0.01 $12,141 $0.01 $14,569 $0.01 $16,997 $0.01 $19,425 $0.01 $21,853 $0.01 $24,282 $0.01 $40,469 $0.01 $60,704 $0.01 $121,408 $0.01<br />
$46,886 $0.06 $55,745 $0.06 $64,212 $0.06 $72,367 $0.06 $80,263 $0.05 $87,941 $0.05 $95,429 $0.05 $163,365 $0.04 $223,736 $0.04 $383,015 $0.03<br />
$28,685 $0.04 $35,856 $0.04 $43,027 $0.04 $50,198 $0.04 $57,370 $0.04 $64,541 $0.04 $71,712 $0.04 $143,424 $0.04 $215,136 $0.04 $430,272 $0.04<br />
$0 $0.00 $0 $0.00 $0 $0.00 $0 $0.00 $0 $0.00 $0 $0.00 $0 $0.00 $0 $0.00 $0 $0.00 $0 $0.00<br />
$20,000 $0.03 $20,000 $0.02 $20,000 $0.02 $20,000 $0.02 $20,000 $0.01 $20,000 $0.01 $20,000 $0.01 $20,000 $0.01 $20,000 $0.00 $20,000 $0.00<br />
$0 $0.00 $0 $0.00 $0 $0.00 $0 $0.00 $0 $0.00 $0 $0.00 $0 $0.00 $0 $0.00 $0 $0.00 $0 $0.00<br />
$10,500 $0.01 $11,250 $0.01 $12,000 $0.01 $12,750 $0.01 $13,500 $0.01 $14,250 $0.01 $15,000 $0.01 $20,000 $0.01 $23,750 $0.00 $35,000 $0.00<br />
$27,500 $0.04 $27,500 $0.03 $27,500 $0.03 $27,500 $0.02 $27,500 $0.02 $27,500 $0.02 $27,500 $0.02 $27,500 $0.01 $27,500 $0.01 $27,500 $0.00<br />
$15,750 $0.02 $16,125 $0.02 $16,500 $0.02 $16,875 $0.01 $17,250 $0.01 $17,625 $0.01 $18,000 $0.01 $21,750 $0.01 $25,500 $0.00 $36,750 $0.00<br />
$12,600 $0.02 $12,900 $0.01 $13,200 $0.01 $13,500 $0.01 $13,800 $0.01 $14,100 $0.01 $14,400 $0.01 $17,400 $0.00 $20,400 $0.00 $29,400 $0.00<br />
$7,875 $0.01 $8,063 $0.01 $8,250 $0.01 $8,438 $0.01 $8,625 $0.01 $8,813 $0.01 $9,000 $0.00 $10,875 $0.00 $12,750 $0.00 $18,375 $0.00<br />
$4,200 $0.01 $4,300 $0.00 $4,400 $0.00 $4,500 $0.00 $4,600 $0.00 $4,700 $0.00 $4,800 $0.00 $5,800 $0.00 $6,800 $0.00 $9,800 $0.00<br />
$0.91 $0.82 $0.77 $0.72 $0.69 $0.67 $0.67 $0.49 $0.44 $0.38<br />
2 2.5 3 3.5 4 4.5 5 10 15<br />
30<br />
Year 1 Cost, $ $/1000 gallons Year 1 Cost, $ $/1000 gallons Year 1 Cost, $ $/1000 gallons Year 1 Cost, $ $/1000 gallons Year 1 Cost, $ $/1000 gallons Year 1 Cost, $ $/1000 gallons Year 1 Cost, $ $/1000 gallons Year 1 Cost, $ $/1000 gallons Year 1 Cost, $ $/1000 gallons Year 1 Cost, $ $/1000 gallons<br />
Capital Cost Capital Cost Capital Cost Capital Cost Capital Cost Capital Cost Capital Cost Capital Cost Capital Cost Capital Cost<br />
$210,000 $225,000 $240,000 $255,000 $270,000 $285,000 $300,000 $400,000 $475,000 $700,000<br />
$0 $0 $0 $0 $0 $0 $0 $0 $0 $0<br />
$971,261 $1,214,076 $1,456,891 $1,699,706 $1,942,522 $2,185,337 $2,428,152 $4,046,920 $6,070,380 $12,140,759<br />
$9,880,600 $11,085,050 $12,289,500 $13,493,950 $14,698,400 $15,902,850 $18,122,000 $25,190,000 $32,258,000 $53,462,000<br />
$11,061,861 $12,524,126 $13,986,391 $15,448,656 $16,910,922 $18,373,187 $20,850,152 $29,636,920 $38,803,380 $66,302,759<br />
$853,818 $1.17 $966,684 $1.06 $1,079,550 $0.99 $1,192,416 $0.93 $1,305,282 $0.89 $1,418,148 $0.86 $1,609,334 $0.88 $2,287,547 $0.63 $2,995,067 $0.55 $5,117,627 $0.47<br />
$8,800 $0.01 $8,800 $0.01 $8,800 $0.01 $8,800 $0.01 $8,800 $0.01 $8,800 $0.01 $8,800 $0.00 $10,400 $0.00 $12,800 $0.00 $16,000 $0.00<br />
$9,713 $0.01 $12,141 $0.01 $14,569 $0.01 $16,997 $0.01 $19,425 $0.01 $21,853 $0.01 $24,282 $0.01 $40,469 $0.01 $60,704 $0.01 $121,408 $0.01<br />
$73,053 $0.10 $85,171 $0.09 $96,550 $0.09 $107,349 $0.08 $117,675 $0.08 $127,605 $0.08 $137,195 $0.08 $220,997 $0.06 $292,080 $0.05 $470,491 $0.04<br />
$28,685 $0.04 $35,856 $0.04 $43,027 $0.04 $50,198 $0.04 $57,370 $0.04 $64,541 $0.04 $71,712 $0.04 $143,424 $0.04 $215,136 $0.04 $430,272 $0.04<br />
$0 $0.00 $0 $0.00 $0 $0.00 $0 $0.00 $0 $0.00 $0 $0.00 $0 $0.00 $0 $0.00 $0 $0.00 $0 $0.00<br />
$20,000 $0.03 $20,000 $0.02 $20,000 $0.02 $20,000 $0.02 $20,000 $0.01 $20,000 $0.01 $20,000 $0.01 $20,000 $0.01 $20,000 $0.00 $20,000 $0.00<br />
$0 $0.00 $0 $0.00 $0 $0.00 $0 $0.00 $0 $0.00 $0 $0.00 $0 $0.00 $0 $0.00 $0 $0.00 $0 $0.00<br />
$10,500 $0.01 $11,250 $0.01 $12,000 $0.01 $12,750 $0.01 $13,500 $0.01 $14,250 $0.01 $15,000 $0.01 $20,000 $0.01 $23,750 $0.00 $35,000 $0.00<br />
$55,000 $0.08 $55,000 $0.06 $55,000 $0.05 $55,000 $0.04 $55,000 $0.04 $55,000 $0.03 $55,000 $0.03 $55,000 $0.02 $55,000 $0.01 $55,000 $0.01<br />
$15,750 $0.02 $16,125 $0.02 $16,500 $0.02 $16,875 $0.01 $17,250 $0.01 $17,625 $0.01 $18,000 $0.01 $21,750 $0.01 $25,500 $0.00 $36,750 $0.00<br />
$12,600 $0.02 $12,900 $0.01 $13,200 $0.01 $13,500 $0.01 $13,800 $0.01 $14,100 $0.01 $14,400 $0.01 $17,400 $0.00 $20,400 $0.00 $29,400 $0.00<br />
$7,875 $0.01 $8,063 $0.01 $8,250 $0.01 $8,438 $0.01 $8,625 $0.01 $8,813 $0.01 $9,000 $0.00 $10,875 $0.00 $12,750 $0.00 $18,375 $0.00<br />
$4,200 $0.01 $4,300 $0.00 $4,400 $0.00 $4,500 $0.00 $4,600 $0.00 $4,700 $0.00 $4,800 $0.00 $5,800 $0.00 $6,800 $0.00 $9,800 $0.00<br />
$1.51 $1.35 $1.25 $1.18 $1.12 $1.08 $1.09 $0.78 $0.68 $0.58<br />
Total Reuse System Costs_BASE-043007-FORPRINTING-2.xls, CURVE Model Page 10 of 10 5/2/2007
Appendix D-1<br />
<strong>Water</strong> Reuse System Costs<br />
Tertiary 1 – Conventional Treatment
<strong>Water</strong> Reuse System Estimated Cost of Service, $/1000 gallons<br />
Tertiary 1 - Conventional<br />
Pipe Length, Miles<br />
Flow, mgd 1 1.5 2 2.5 3 3.5 4 4.5 5 10<br />
0.1 10.66 11.31 11.96 12.62 13.25 13.90 14.55 15.18 15.82 22.31<br />
0.25 5.25 5.53 5.81 6.09 6.36 6.64 6.92 7.19 7.46 10.24<br />
0.5 3.18 3.34 3.49 3.65 3.80 3.95 4.11 4.25 4.40 5.95<br />
0.75 2.78 2.90 3.01 3.13 3.24 3.35 3.47 3.57 3.68 4.80<br />
1 2.33 2.42 2.52 2.61 2.70 2.79 2.89 2.97 3.06 3.97<br />
1.25 2.06 2.14 2.22 2.30 2.38 2.45 2.54 2.61 2.68 3.47<br />
1.5 1.88 1.95 2.02 2.09 2.16 2.23 2.31 2.37 2.44 3.14<br />
1.75 1.75 1.81 1.88 1.94 2.01 2.07 2.14 2.20 2.26 2.90<br />
2 1.65 1.71 1.77 1.83 1.89 1.95 2.02 2.07 2.12 2.72<br />
2.5 1.51 1.57 1.62 1.68 1.73 1.78 1.84 1.89 1.94 2.47<br />
3 1.42 1.47 1.52 1.57 1.62 1.67 1.72 1.76 1.81 2.30<br />
3.5 1.34 1.39 1.44 1.48 1.53 1.58 1.63 1.67 1.71 2.17<br />
4 1.25 1.30 1.34 1.39 1.43 1.47 1.52 1.56 1.60 2.03<br />
4.5 1.18 1.23 1.27 1.31 1.35 1.39 1.44 1.48 1.52 1.93<br />
5 1.13 1.17 1.22 1.26 1.30 1.34 1.39 1.43 1.47 1.89<br />
10 0.84 0.87 0.90 0.93 0.96 0.99 1.02 1.05 1.08 1.37<br />
15 0.75 0.78 0.80 0.83 0.85 0.88 0.91 0.93 0.95 1.20<br />
30 0.66 0.68 0.70 0.72 0.74 0.76 0.79 0.80 0.82 1.02<br />
Total Reuse System Costs_Conv-042607.xls, Cost of Service Summary CURVES 5/3/2007
<strong>Water</strong> Reuse System Estimates of Probable Cost - Capital and Operation and Maintenance<br />
Tertiary 1 - Conventional<br />
Treatment Facilities<br />
Total System-1 mile Total System-5 mile<br />
Flow, mgd Capital, $ O&M, $ Capital, $ O&M, $ Capital, $ O&M, $<br />
0.1 2,024,700 132,600 2,615,800 187,200 4,737,300 211,800<br />
0.25 2,570,600 167,000 3,288,900 224,900 5,555,000 251,800<br />
0.5 3,232,900 195,800 4,163,100 258,900 6,670,100 288,800<br />
0.75 4,400,700 274,100 5,451,800 341,200 8,199,700 373,600<br />
1 4,999,200 297,400 6,232,100 369,700 9,220,900 404,400<br />
1.25 5,597,800 320,600 7,012,300 397,800 10,242,000 434,500<br />
1.5 6,196,400 343,900 7,792,500 425,900 11,263,100 464,500<br />
1.75 6,795,000 367,200 8,572,700 453,800 12,284,200 494,200<br />
2 7,393,600 390,500 9,352,900 481,700 13,305,300 523,800<br />
2.5 8,590,700 437,000 10,913,400 537,300 15,347,600 582,600<br />
3 9,787,900 483,500 12,473,800 592,800 17,389,800 641,000<br />
3.5 10,985,000 516,100 14,034,200 634,100 19,432,000 685,100<br />
4 11,619,600 543,000 15,032,000 669,800 20,911,600 723,300<br />
4.5 12,254,100 570,000 16,029,800 705,300 22,391,200 761,300<br />
5 12,888,600 596,900 17,128,900 740,700 24,377,600 799,100<br />
10 19,183,600 865,600 25,749,500 1,085,300 35,825,500 1,163,200<br />
15 25,453,700 1,134,100 34,749,900 1,431,100 47,653,000 1,524,300<br />
30 44,263,900 1,939,600 61,750,900 2,454,200 83,135,600 2,581,900<br />
Total Reuse System Costs_Conv-070707.xls, Cap_O&M Cost Summary 7/7/2007
Cost of Service, $/1000 gallon<br />
10.00<br />
9.00<br />
8.00<br />
7.00<br />
6.00<br />
5.00<br />
4.00<br />
3.00<br />
2.00<br />
1.00<br />
0.00<br />
Transmission, miles<br />
1<br />
2<br />
3<br />
4<br />
5<br />
10<br />
$2/1000 gallons - Typical Potable <strong>Water</strong> Supply Cost<br />
0 0.5 1 1.5 2 2.5 3 3.5 4 4.5 5<br />
Reclaimed <strong>Water</strong> Flow/Demand, mgd<br />
Figure D-1a. Reclaimed <strong>Water</strong> System Cost of Service <strong>for</strong> 0-5 mgd Capacity<br />
Urban Area - Treatment: Tertiary 1 - Conventional
Cost of Service, $/1000 gallon<br />
2.00<br />
1.80<br />
1.60<br />
1.40<br />
1.20<br />
1.00<br />
0.80<br />
0.60<br />
0.40<br />
0.20<br />
0.00<br />
$2/1000 gallons - Typical Potable <strong>Water</strong> Supply Cost<br />
Transmission, miles<br />
1<br />
2<br />
3<br />
4<br />
5<br />
10<br />
5 10 15 20 25 30<br />
Reclaimed <strong>Water</strong> Flow/Demand, mgd<br />
Figure D-1b. Reclaimed <strong>Water</strong> System Cost of Service <strong>for</strong> 5-30 mgd Capacity<br />
Urban Area - Treatment: Tertiary 1 - Conventional
Cost Curves as Basis <strong>for</strong> Tertiary 1-Conventional Treatment Costs*<br />
Coagulant Addition/Flocculation/Sedimentation<br />
Capital Cost<br />
Design<br />
Flow<br />
Capital Cost<br />
(mgd) ($)<br />
0.0001 $1,200,000<br />
0.007 $1,200,000<br />
0.022 $1,200,000<br />
0.037 $1,200,000<br />
0.091 $1,200,000<br />
0.18 $1,200,000<br />
0.27 $1,200,000<br />
0.36 $1,200,000<br />
0.68 $1,200,000<br />
1 $1,326,582<br />
1.2 $1,405,696<br />
2 $1,722,152<br />
3.5 $2,315,506<br />
7 $3,700,000<br />
17 $6,859,420<br />
22 $8,439,130<br />
76 $25,500,000<br />
210 $67,836,232<br />
430 $137,343,478<br />
520 $165,778,261<br />
1,500.00 $475,401,449<br />
Cost, $<br />
Cost, $<br />
$5,000,000<br />
$4,000,000<br />
$3,000,000<br />
$2,000,000<br />
$1,000,000<br />
$0<br />
$30,000,000<br />
$25,000,000<br />
$20,000,000<br />
$15,000,000<br />
$10,000,000<br />
$5,000,000<br />
$0<br />
y = 395569.63x + 931012.51<br />
R 2 = 1.00<br />
0 2 4 6 8 10<br />
Flow, mgd<br />
y = 315942.03x + 1488405.54<br />
R 2 = 1.00<br />
0 10 20 30 40<br />
Flow, mgd<br />
50 60 70 80<br />
Curve fit equations<br />
CCI Index 1.16<br />
Avg Flow Range (O&M) 0.23-3.0 mgd >3-30 mgd<br />
Design Flow Range (Capital) 0.68-07.0 mgd >7-60 mgd<br />
Design/Avg Flow Ratio 2<br />
Note: Adustments were made with vendor supplied costs <strong>for</strong> lower flows and to evaluate<br />
application of these costs <strong>for</strong> treated wastewater effluent (developed <strong>for</strong> potable supply).<br />
*Source: Environmental Protection Agency (EPA), 2003. Technologies and Costs Document <strong>for</strong> the Final Long Term 2<br />
Enhanced Surface <strong>Water</strong> Treatment Rule and Final Stage 2 Disinfectants and Disinfection Byproducts Rule. December.<br />
EPA 815-R-05-013.<br />
Conventional Treatment.xls, Summ-Sed Page 1 of 2 5/3/2007 1:22 PM
Cost Curves as Basis <strong>for</strong> Tertiary 1-Conventional Treatment Costs*<br />
Coagulant Addition/Flocculation/Sedimentation<br />
O&M Cost<br />
Design<br />
Flow<br />
O&M Cost<br />
(mgd) ($)<br />
0.00005 $37,000<br />
0.0015 $37,000<br />
0.0054 $37,000<br />
0.0095 $37,000<br />
0.025 $37,000<br />
0.054 $37,000<br />
0.084 $37,000<br />
0.11 $37,000<br />
0.23 $37,000<br />
0.35 $40,552<br />
0.41 $42,329<br />
0.77 $52,986<br />
1.4 $71,635<br />
3 $119,000<br />
7.8 $179,480<br />
11 $219,800<br />
38 $560,000<br />
120 $1,593,200<br />
270 $3,483,200<br />
350 $4,491,200<br />
750 $9,531,200<br />
Cost, $<br />
Cost, $<br />
$140,000<br />
$120,000<br />
$100,000<br />
$80,000<br />
$60,000<br />
$40,000<br />
$20,000<br />
$0<br />
$600,000<br />
$500,000<br />
$400,000<br />
$300,000<br />
$200,000<br />
$100,000<br />
$0<br />
y = 29602.83x + 30191.43<br />
R 2 = 1.00<br />
0 0.5 1 1.5 2 2.5 3 3.5<br />
Flow, mgd<br />
y = 12600.00x + 81200.00<br />
R 2 = 1.00<br />
0 5 10 15 20<br />
Flow, mgd<br />
25 30 35 40<br />
*Source: Environmental Protection Agency (EPA), 2003. Technologies and Costs Document <strong>for</strong> the Final Long Term 2<br />
Enhanced Surface <strong>Water</strong> Treatment Rule and Final Stage 2 Disinfectants and Disinfection Byproducts Rule. December.<br />
EPA 815-R-05-013.<br />
Conventional Treatment.xls, Summ-Sed Page 2 of 2 5/3/2007 1:22 PM
Cost Curves as Basis <strong>for</strong> Tertiary 1-Conventional Treatment Costs*<br />
Gravity Filtration<br />
Capital Cost<br />
Design<br />
Flow<br />
Capital Cost<br />
(mgd) ($)<br />
0.0001 $1,106,000<br />
0.007 $1,106,000<br />
0.022 $1,106,000<br />
0.037 $1,106,000<br />
0.091 $1,106,000<br />
0.18 $1,106,000<br />
0.27 $1,106,000<br />
0.36 $1,106,000<br />
0.68 $1,106,000<br />
1 $1,331,013<br />
1.2 $1,471,646<br />
2 $2,034,177<br />
3.5 $3,088,924<br />
7 $5,550,000<br />
17 $7,731,159<br />
22 $8,821,739<br />
76 $20,600,000<br />
210 $49,827,536<br />
430 $97,813,043<br />
520 $117,443,478<br />
1,500.00 $331,197,101<br />
Cost, $<br />
Cost, $<br />
$6,000,000<br />
$5,000,000<br />
$4,000,000<br />
$3,000,000<br />
$2,000,000<br />
$1,000,000<br />
y = 703164.52x + 627848.28<br />
R 2 = 1.00<br />
Curve fit equations<br />
CCI Index Multiplier 1.16<br />
Avg Flow Range 0.23-3.0 mgd >3-30 mgd<br />
Design Flow Range 0.68-07.0 mgd >7-60 mgd<br />
Design/Avg Flow Ratio 2<br />
Note: Adustments were made with vendor supplied costs <strong>for</strong> lower flows and to evaluate<br />
application of these costs <strong>for</strong> treated wastewater effluent (developed <strong>for</strong> potable supply).<br />
$0<br />
$25,000,000<br />
$20,000,000<br />
$15,000,000<br />
$10,000,000<br />
$5,000,000<br />
$0<br />
0 1 2 3 4<br />
Flow, mgd<br />
5 6 7 8<br />
y = 218115.94x + 4023188.20<br />
R 2 = 1.00<br />
0 10 20 30 40<br />
Flow, mgd<br />
50 60 70 80<br />
*Source: Environmental Protection Agency (EPA), 2003. Technologies and Costs Document <strong>for</strong> the Final Long Term 2<br />
Enhanced Surface <strong>Water</strong> Treatment Rule and Final Stage 2 Disinfectants and Disinfection Byproducts Rule. December.<br />
EPA 815-R-05-013.<br />
Conventional Treatment.xls, Summ-Filt 5/3/2007 1:23 PM
Cost Curves as Basis <strong>for</strong> Tertiary 1-Conventional Treatment Costs*<br />
Gravity Filtration<br />
O&M Cost<br />
Design<br />
Flow<br />
O&M Cost<br />
(mgd) ($)<br />
0.00005 $62,300<br />
0.0015 $62,300<br />
0.0054 $62,300<br />
0.0095 $62,300<br />
0.025 $62,300<br />
0.054 $62,300<br />
0.084 $62,300<br />
0.11 $62,300<br />
0.23 $62,300<br />
0.35 $66,034<br />
0.41 $67,901<br />
0.77 $79,104<br />
1.4 $98,709<br />
3 $148,500<br />
7.8 $182,031<br />
11 $204,386<br />
38 $393,000<br />
120 $965,829<br />
270 $2,013,686<br />
350 $2,572,543<br />
750 $5,366,829<br />
Cost, $<br />
Cost, $<br />
$160,000<br />
$140,000<br />
$120,000<br />
$100,000<br />
$80,000<br />
$60,000<br />
$40,000<br />
$20,000<br />
$450,000<br />
$400,000<br />
$350,000<br />
$300,000<br />
$250,000<br />
$200,000<br />
$150,000<br />
$100,000<br />
$50,000<br />
$0<br />
$0<br />
y = 31119.21x + 55142.28<br />
R 2 = 1.00<br />
0 0.5 1 1.5 2 2.5 3 3.5<br />
Flow, mgd<br />
y = 6985.72x + 127542.78<br />
R 2 = 1.00<br />
0 5 10 15 20<br />
Flow, mgd<br />
25 30 35 40<br />
*Source: Environmental Protection Agency (EPA), 2003. Technologies and Costs Document <strong>for</strong> the Final Long Term 2<br />
Enhanced Surface <strong>Water</strong> Treatment Rule and Final Stage 2 Disinfectants and Disinfection Byproducts Rule. December.<br />
EPA 815-R-05-013.<br />
Conventional Treatment.xls, Summ-Filt 5/3/2007 1:23 PM
Appendix D-2<br />
<strong>Water</strong> Reuse System Costs<br />
Tertiary 2 – Membrane Filtration
<strong>Water</strong> Reuse System Estimated Cost of Service, $/1000 gallons<br />
Tertiary 2 - Membrane Filtration<br />
Pipe Length, Miles<br />
Flow, mgd 1 1.5 2 2.5 3 3.5 4 4.5 5 10<br />
0.1 6.61 7.26 7.91 8.57 9.21 9.85 10.50 11.13 11.77 18.26<br />
0.25 3.46 3.75 4.03 4.31 4.58 4.86 5.14 5.41 5.68 8.46<br />
0.5 2.31 2.47 2.63 2.78 2.93 3.09 3.24 3.39 3.54 5.08<br />
0.75 1.90 2.01 2.13 2.24 2.35 2.46 2.58 2.68 2.79 3.92<br />
1 1.70 1.80 1.89 1.98 2.07 2.16 2.26 2.34 2.43 3.35<br />
1.25 1.59 1.67 1.75 1.83 1.90 1.98 2.07 2.14 2.21 3.00<br />
1.5 1.51 1.58 1.65 1.72 1.79 1.86 1.94 2.00 2.07 2.77<br />
1.75 1.45 1.52 1.58 1.65 1.71 1.78 1.85 1.90 1.96 2.60<br />
2 1.41 1.47 1.53 1.59 1.65 1.71 1.78 1.83 1.88 2.48<br />
2.5 1.35 1.40 1.46 1.51 1.57 1.62 1.68 1.72 1.77 2.31<br />
3 1.31 1.36 1.41 1.46 1.51 1.56 1.61 1.65 1.70 2.19<br />
3.5 1.28 1.33 1.38 1.42 1.47 1.51 1.56 1.60 1.65 2.10<br />
4 1.29 1.34 1.38 1.42 1.47 1.51 1.56 1.60 1.64 2.07<br />
4.5 1.25 1.30 1.34 1.38 1.42 1.46 1.51 1.55 1.59 2.00<br />
5 1.23 1.27 1.31 1.35 1.40 1.44 1.49 1.52 1.56 1.99<br />
10 1.05 1.08 1.11 1.14 1.17 1.20 1.24 1.26 1.29 1.58<br />
15 1.00 1.03 1.05 1.08 1.10 1.13 1.16 1.18 1.20 1.44<br />
30 0.95 0.97 0.99 1.01 1.03 1.05 1.08 1.09 1.11 1.31<br />
Total Reuse System Costs_Microfilt-042307.xls, Cost of Service Summary CURVES 5/3/2007
<strong>Water</strong> Reuse System Estimates of Probable Cost - Capital and Operation and Maintenance<br />
Tertiary 2 - Membrane Filtration<br />
Treatment Facilities<br />
Total System-1 mile Total System-5 mile<br />
Flow, mgd Capital, $ O&M, $ Capital, $ O&M, $ Capital, $ O&M, $<br />
0.1 874,200 73,600 1,465,300 128,300 3,586,800 152,800<br />
0.25 1,369,900 97,000 2,088,200 155,000 4,354,300 181,900<br />
0.5 1,966,000 135,500 2,896,200 198,600 5,403,200 228,500<br />
0.75 2,559,600 173,900 3,610,800 241,000 6,358,700 273,500<br />
1 3,138,100 212,200 4,371,000 284,600 7,359,800 319,200<br />
1.25 3,716,700 250,400 5,131,200 327,700 8,360,900 364,400<br />
1.5 4,295,300 288,700 5,891,400 370,700 9,362,000 409,300<br />
1.75 4,873,900 327,000 6,651,700 413,600 10,363,200 454,000<br />
2 5,452,500 365,200 7,411,900 456,500 11,364,300 498,600<br />
2.5 6,609,700 441,800 8,932,300 542,100 13,366,500 587,300<br />
3 7,766,900 518,300 10,452,800 627,600 15,368,800 675,700<br />
3.5 8,924,100 594,800 11,973,300 712,900 17,371,000 763,800<br />
4 10,436,700 689,600 13,849,100 816,300 19,728,700 869,900<br />
4.5 11,347,800 754,800 15,123,500 890,200 21,484,900 946,200<br />
5 12,258,900 820,100 16,499,200 963,900 23,747,900 1,022,300<br />
10 21,319,900 1,471,800 27,885,800 1,691,500 37,961,700 1,769,400<br />
15 30,355,900 2,123,400 39,652,000 2,420,300 52,555,100 2,513,600<br />
30 57,463,800 4,078,000 74,950,700 4,592,500 96,335,500 4,720,200<br />
Total Reuse System Costs_Microfilt-070707.xls, Cap_O&M Cost Summary 7/7/2007
Cost of Service, $/1000 gallon<br />
10.00<br />
9.00<br />
8.00<br />
7.00<br />
6.00<br />
5.00<br />
4.00<br />
3.00<br />
2.00<br />
1.00<br />
0.00<br />
$2/1000 gallons - Typical Potable <strong>Water</strong> Supply Cost<br />
Transmission, miles<br />
1<br />
2<br />
3<br />
4<br />
5<br />
10<br />
0 0.5 1 1.5 2 2.5 3 3.5 4 4.5 5<br />
Reclaimed <strong>Water</strong> Flow/Demand, mgd<br />
Figure D-2a. Reclaimed <strong>Water</strong> System Probable Cost of Service <strong>for</strong> 0-5 mgd Capacity<br />
Urban Area - Treatment: Tertiary 2 - Membrane Filtration
Cost of Service, $/1000 gallon<br />
2.00<br />
1.80<br />
1.60<br />
1.40<br />
1.20<br />
1.00<br />
0.80<br />
0.60<br />
0.40<br />
0.20<br />
0.00<br />
$2/1000 gallons - Typical Potable <strong>Water</strong> Supply Cost<br />
Transmission, miles<br />
1<br />
2<br />
3<br />
4<br />
5<br />
10<br />
5 10 15 20 25 30<br />
Reclaimed <strong>Water</strong> Flow/Demand, mgd<br />
Figure D-2b. Reclaimed <strong>Water</strong> System Probable Cost of Service <strong>for</strong> 5-30 mgd Capacity<br />
Urban Area - Treatment: Tertiary 2 - Membrane Filtration
Cost Curves as Basis <strong>for</strong> Tertiary 2 - Membrane Filtration Costs*<br />
Microfiltration<br />
Capital Costs<br />
Design Flow Cost<br />
(mgd) ($)<br />
0.0001 $131,478<br />
0.007 $131,478<br />
0.022 $214,432<br />
0.037 $270,819<br />
0.091 $409,983<br />
0.18 $628,117<br />
0.27 $748,563<br />
0.36 $850,970<br />
0.68 $1,133,988<br />
1 $1,594,911<br />
1.2 $1,738,505<br />
2 $2,720,593<br />
3.5 $4,142,559<br />
7 $7,382,351<br />
17 $15,991,348<br />
22 $20,058,196<br />
76 $61,150,358<br />
210 $153,184,031<br />
430 $293,759,889<br />
520 $349,252,221<br />
1,500.00 $953,502,064<br />
$900,000<br />
$800,000<br />
$700,000<br />
$600,000<br />
$500,000<br />
$400,000<br />
$300,000<br />
$200,000<br />
$100,000<br />
$0<br />
$8,000,000<br />
$7,000,000<br />
$6,000,000<br />
$5,000,000<br />
$4,000,000<br />
$3,000,000<br />
$2,000,000<br />
$1,000,000<br />
$0<br />
$70,000,000<br />
$60,000,000<br />
$50,000,000<br />
$40,000,000<br />
$30,000,000<br />
$20,000,000<br />
$10,000,000<br />
$0<br />
y = -4,127,066.48x 2 + 3,465,173.74x + 130,768.04<br />
R 2 = 1.00<br />
0 0.05 0.1 0.15 0.2 0.25 0.3 0.35 0.4<br />
y = 984643.02x + 580799.40<br />
R 2 = 1.00<br />
0 1 2 3 4 5 6 7 8<br />
y = 772498.50x + 2584359.08<br />
R 2 = 1.00<br />
5 15 25 35 45 55 65 75 85 95<br />
Curve fit equations<br />
CCI Index Multiplier 1.16<br />
Avg Flow Range 0-0.11mgd >0.11-3mgd >3-30mgd<br />
Design Flow Range 0-0.36mgd >0.36-7 mgd >7-90 mgd<br />
Design/Avg Flow Ratio 2<br />
*Source: Environmental Protection Agency (EPA), 2003. Technologies and Costs Document <strong>for</strong> the Final Long Term 2<br />
Enhanced Surface <strong>Water</strong> Treatment Rule and Final Stage 2 Disinfectants and Disinfection Byproducts Rule. December.<br />
EPA 815-R-05-013.<br />
Membranes.xls, Summ-Microfiltration Page 1 of 2 5/3/2007 1:47 PM
Cost Curves as Basis <strong>for</strong> Tertiary 2 - Membrane Filtration Costs*<br />
Microfiltration<br />
O&M Costs<br />
Average Flow Cost<br />
(mgd) ($)<br />
0.00005 $6,230<br />
0.0015 $6,230<br />
0.0054 $6,686<br />
0.0095 $7,156<br />
0.025 $9,329<br />
0.054 $22,042<br />
0.084 $26,348<br />
0.11 $29,272<br />
0.23 $41,522<br />
0.35 $69,214<br />
0.41 $75,317<br />
0.77 $106,798<br />
1.4 $164,173<br />
3 $324,393<br />
7.8 $786,427<br />
11 $1,034,793<br />
38 $3,301,730<br />
120 $9,888,387<br />
270 $21,519,157<br />
350 $27,300,426<br />
750 $56,206,770<br />
$35,000<br />
$30,000<br />
$25,000<br />
$20,000<br />
$15,000<br />
$10,000<br />
$5,000<br />
$0<br />
$350,000<br />
$300,000<br />
$250,000<br />
$200,000<br />
$150,000<br />
$100,000<br />
$50,000<br />
$0<br />
$3,500,000<br />
$3,000,000<br />
$2,500,000<br />
$2,000,000<br />
$1,500,000<br />
$1,000,000<br />
$500,000<br />
$0<br />
y = -892866x 2 + 324576x + 4964.8<br />
R 2 = 0.9738<br />
0 0.02 0.04 0.06 0.08 0.1 0.12<br />
y = 99642x + 26562<br />
R 2 = 0.9957<br />
0 0.5 1 1.5 2 2.5 3 3.5<br />
y = 84389.12x + 100218.35<br />
R 2 = 1.00<br />
5 10 15 20 25 30 35 40<br />
*Source: Environmental Protection Agency (EPA), 2003. Technologies and Costs Document <strong>for</strong> the Final Long Term 2<br />
Enhanced Surface <strong>Water</strong> Treatment Rule and Final Stage 2 Disinfectants and Disinfection Byproducts Rule. December.<br />
EPA 815-R-05-013.<br />
Membranes.xls, Summ-Microfiltration Page 2 of 2 5/3/2007 1:47 PM
Appendix D-3<br />
<strong>Water</strong> Reuse System Costs<br />
Tertiary 3 – Membrane Softening
<strong>Water</strong> Reuse System Estimated Cost of Service, $/1000 gallons<br />
Tertiary 3 - Membrane Softening<br />
Pipe Length, Miles<br />
Flow, mgd 1 1.5 2 2.5 3 3.5 4 4.5 5 10<br />
0.1 8.58 9.23 9.88 10.53 11.17 11.81 12.46 13.10 13.73 20.22<br />
0.25 5.00 5.28 5.56 5.85 6.12 6.39 6.67 6.94 7.21 10.00<br />
0.5 3.71 3.86 4.02 4.18 4.33 4.48 4.64 4.78 4.93 6.47<br />
0.75 3.24 3.36 3.47 3.59 3.70 3.81 3.92 4.03 4.14 5.26<br />
1 3.02 3.12 3.21 3.30 3.39 3.48 3.58 3.66 3.75 4.66<br />
1.25 2.89 2.97 3.05 3.13 3.21 3.29 3.37 3.44 3.52 4.30<br />
1.5 2.80 2.87 2.94 3.02 3.09 3.16 3.23 3.29 3.36 4.06<br />
1.75 2.74 2.80 2.87 2.93 3.00 3.06 3.13 3.19 3.25 3.89<br />
2 2.69 2.75 2.81 2.87 2.93 2.99 3.05 3.11 3.16 3.76<br />
2.5 2.62 2.67 2.73 2.78 2.84 2.89 2.95 2.99 3.04 3.58<br />
3 2.57 2.62 2.67 2.72 2.77 2.82 2.87 2.92 2.96 3.45<br />
3.5 2.54 2.59 2.63 2.68 2.72 2.77 2.82 2.86 2.90 3.36<br />
4 2.54 2.59 2.63 2.68 2.72 2.76 2.81 2.85 2.89 3.32<br />
4.5 2.50 2.54 2.59 2.63 2.67 2.71 2.76 2.79 2.83 3.25<br />
5 2.47 2.51 2.56 2.60 2.64 2.68 2.73 2.77 2.81 3.23<br />
10 2.27 2.30 2.33 2.36 2.39 2.41 2.45 2.47 2.50 2.79<br />
15 2.19 2.22 2.24 2.26 2.29 2.31 2.35 2.36 2.39 2.63<br />
30 2.07 2.09 2.11 2.13 2.15 2.17 2.19 2.21 2.23 2.43<br />
Total Reuse System Costs_NanofiltB-042307.xls, Cost of Service Summary CURVES 5/3/2007
<strong>Water</strong> Reuse System Estimates of Probable Cost - Capital and Operation and Maintenance<br />
Tertiary 3 - Membrane Softening<br />
Treatment Facilities<br />
Total System-1 mile Total System-5 mile<br />
Flow, mgd Capital, $ O&M, $ Capital, $ O&M, $ Capital, $ O&M, $<br />
0.1 1,145,200 124,400 1,736,300 179,000 3,857,900 203,600<br />
0.25 1,973,500 190,600 2,691,800 248,600 4,957,900 275,500<br />
0.5 3,122,800 300,400 4,053,100 363,500 6,560,100 393,400<br />
0.75 4,268,000 410,000 5,319,200 477,100 8,067,100 509,600<br />
1 5,396,700 519,400 6,629,500 591,800 9,618,300 626,400<br />
1.25 6,523,800 628,700 7,938,300 705,900 11,168,000 742,600<br />
1.5 7,649,400 737,900 9,245,600 819,900 12,716,100 858,500<br />
1.75 8,773,500 847,000 10,551,300 933,700 14,262,800 974,100<br />
2 9,896,100 956,100 11,855,400 1,047,300 15,807,800 1,089,400<br />
2.5 12,136,600 1,173,900 14,459,200 1,274,200 18,893,400 1,319,400<br />
3 14,370,900 1,391,300 17,056,800 1,500,600 21,972,800 1,548,700<br />
3.5 16,599,200 1,608,400 19,648,300 1,726,400 25,046,100 1,777,400<br />
4 19,176,700 1,843,300 22,589,100 1,970,100 28,468,700 2,023,600<br />
4.5 21,146,500 2,048,400 24,922,300 2,183,800 31,283,600 2,239,700<br />
5 23,110,300 2,253,100 27,350,600 2,397,000 34,599,300 2,455,300<br />
10 42,360,300 4,279,900 48,926,200 4,499,600 59,002,100 4,577,500<br />
15 60,971,800 6,270,700 70,268,000 6,567,600 83,171,100 6,660,900<br />
30 113,126,100 12,028,000 130,613,000 12,542,600 151,997,800 12,670,300<br />
Total Reuse System Costs_NanofiltB-070707.xls, Cap_O&M Cost Summary 7/7/2007
Cost of Service, $/1000 gallon<br />
5.00<br />
4.50<br />
4.00<br />
3.50<br />
3.00<br />
2.50<br />
2.00<br />
1.50<br />
1.00<br />
0.50<br />
0.00<br />
$2/1000 gallons - Typical Potable <strong>Water</strong> Supply Cost<br />
Transmission, miles<br />
1<br />
2<br />
3<br />
4<br />
5<br />
10<br />
0 0.5 1 1.5 2 2.5 3 3.5 4 4.5 5<br />
Reclaimed <strong>Water</strong> Flow/Demand, mgd<br />
Figure D-3a. Reclaimed <strong>Water</strong> System Probable Cost of Service <strong>for</strong> 0-5 mgd Capacity<br />
Urban Area - Treatment: Tertiary 3 - Membrane Softening
Cost of Service, $/1000 gallon<br />
5.00<br />
4.50<br />
4.00<br />
3.50<br />
3.00<br />
2.50<br />
2.00<br />
1.50<br />
1.00<br />
0.50<br />
0.00<br />
Transmission, miles<br />
1<br />
2<br />
3<br />
4<br />
5<br />
10<br />
$2/1000 gallons - Typical Potable <strong>Water</strong> Supply Cost<br />
5 10 15 20 25 30<br />
Reclaimed <strong>Water</strong> Flow/Demand, mgd<br />
Figure D-3b. Reclaimed <strong>Water</strong> System Probable Cost of Service <strong>for</strong> 5-30 mgd Capacity<br />
Urban Area - Treatment: Tertiary 3 - Membrane Softening
Cost Curves as Basis <strong>for</strong> Tertiary 3 - Reverse Osmosis Costs*<br />
Capital Costs<br />
Design Capital Cost<br />
(mgd) ($)<br />
0.0001 $51,894<br />
0.007 $51,894<br />
0.022 $69,241<br />
0.037 $86,588<br />
0.091 $156,079<br />
0.18 $222,829<br />
0.27 $315,937<br />
0.36 $357,087<br />
0.68 $663,375<br />
1 $912,423<br />
1.2 $1,080,532<br />
2 $2,018,579<br />
3.5 $3,404,129<br />
7 $6,745,258<br />
17 $15,456,118<br />
22 $19,862,964<br />
76 $57,558,238<br />
210 $129,659,099<br />
430 $265,356,059<br />
520 $318,914,577<br />
1,500.00 $902,107,327<br />
Cost, $<br />
$70,000,000<br />
$60,000,000<br />
$50,000,000<br />
$40,000,000<br />
$30,000,000<br />
$20,000,000<br />
$10,000,000<br />
$0<br />
y = -2643.6x 2 + 957682x + 42226<br />
R 2 = 1<br />
0 10 20 30 40<br />
Flow, mgd<br />
50 60 70 80<br />
Curve fit equations<br />
CCI Index Multiplier 1.16<br />
Avg Flow Range 0-30 mgd<br />
Design Flow Range 0-60mgd<br />
Design/Avg Flow Ratio 2<br />
*Source: Environmental Protection Agency (EPA), 2003. Technologies and Costs Document <strong>for</strong> the Final Long Term 2<br />
Enhanced Surface <strong>Water</strong> Treatment Rule and Final Stage 2 Disinfectants and Disinfection Byproducts Rule. December.<br />
EPA 815-R-05-013.<br />
Membranes.xls,Summ-RO-Nanofiltration Page 1 of 2 5/3/2007 2:36 PM
Cost Curves as Basis <strong>for</strong> Tertiary 3 - Reverse Osmosis Costs*<br />
O&M Costs<br />
Average<br />
Flow<br />
O&M Cost<br />
(mgd) ($)<br />
0.00005 $6,909<br />
0.0015 $6,909<br />
0.0054 $7,937<br />
0.0095 $9,025<br />
0.025 $13,703<br />
0.054 $29,539<br />
0.084 $37,904<br />
0.11 $43,223<br />
0.23 $70,725<br />
0.35 $112,309<br />
0.41 $126,572<br />
0.77 $205,817<br />
1.4 $343,298<br />
3 $710,894<br />
7.8 $1,780,761<br />
11 $2,429,844<br />
38 $7,914,024<br />
120 $23,845,168<br />
270 $52,975,344<br />
350 $68,097,181<br />
750 $143,706,367<br />
Cost, $<br />
$9,000,000<br />
$8,000,000<br />
$7,000,000<br />
$6,000,000<br />
$5,000,000<br />
$4,000,000<br />
$3,000,000<br />
$2,000,000<br />
$1,000,000<br />
$0<br />
y = -511.65x 2 + 227183x + 18714<br />
R 2 = 1<br />
0 5 10 15 20<br />
Flow, mgd<br />
25 30 35 40<br />
*Source: Environmental Protection Agency (EPA), 2003. Technologies and Costs Document <strong>for</strong> the Final Long Term 2<br />
Enhanced Surface <strong>Water</strong> Treatment Rule and Final Stage 2 Disinfectants and Disinfection Byproducts Rule. December.<br />
EPA 815-R-05-013.<br />
Membranes.xls,Summ-RO-Nanofiltration Page 2 of 2 5/3/2007 2:36 PM
Appendix D-4<br />
<strong>Water</strong> Reuse System Costs<br />
Tertiary 4 – Membrane Softening and GAC
<strong>Water</strong> Reuse System Estimated Cost of Service, $/1000 gallons<br />
Tertiary 4 - Advanced with GAC<br />
Pipe Length, Miles<br />
Flow, mgd 1 1.5 2 2.5 3 3.5 4 4.5 5 10<br />
0.1 11.48 12.13 12.78 13.43 14.07 14.72 15.36 16.00 16.64 23.13<br />
0.25 7.30 7.58 7.86 8.14 8.41 8.69 8.97 9.24 9.51 12.29<br />
0.5 5.79 5.94 6.10 6.26 6.41 6.56 6.72 6.86 7.01 8.55<br />
0.75 4.81 4.92 5.04 5.15 5.26 5.37 5.49 5.59 5.70 6.82<br />
1 4.33 4.42 4.52 4.61 4.70 4.79 4.89 4.97 5.06 5.97<br />
1.25 4.04 4.12 4.20 4.28 4.36 4.44 4.52 4.59 4.67 5.45<br />
1.5 3.85 3.92 3.99 4.06 4.13 4.20 4.28 4.34 4.41 5.11<br />
1.75 3.71 3.77 3.84 3.91 3.97 4.03 4.10 4.16 4.22 4.86<br />
2 3.60 3.67 3.73 3.79 3.85 3.90 3.97 4.02 4.08 4.68<br />
2.5 3.46 3.51 3.57 3.62 3.67 3.72 3.78 3.83 3.88 4.41<br />
3 3.36 3.41 3.46 3.51 3.55 3.60 3.66 3.70 3.75 4.23<br />
3.5 3.28 3.33 3.38 3.42 3.47 3.51 3.57 3.61 3.65 4.11<br />
4 3.26 3.30 3.35 3.39 3.44 3.48 3.53 3.56 3.61 4.04<br />
4.5 3.19 3.24 3.28 3.32 3.36 3.40 3.45 3.49 3.53 3.94<br />
5 3.14 3.19 3.23 3.27 3.32 3.36 3.41 3.44 3.48 3.90<br />
10 2.85 2.88 2.91 2.94 2.97 3.00 3.03 3.05 3.08 3.37<br />
15 2.73 2.75 2.78 2.80 2.83 2.85 2.89 2.90 2.93 3.17<br />
30 2.53 2.55 2.57 2.59 2.61 2.63 2.66 2.67 2.69 2.89<br />
Total Reuse System Costs_GAC20-042307.xls, Cost of Service Summary CURVES 5/4/2007
<strong>Water</strong> Reuse System Estimates of Probable Cost - Capital and Operation and Maintenance<br />
Tertiary 4 - GAC<br />
Treatment Facilities<br />
Total System-1 mile Total System-5 mile<br />
Flow, mgd Capital, $ O&M, $ Capital, $ O&M, $ Capital, $ O&M, $<br />
0.1 1,430,100 208,300 2,021,200 262,900 4,142,800 287,500<br />
0.25 2,627,700 349,700 3,346,000 407,600 5,612,100 434,500<br />
0.5 5,100,600 527,500 6,030,900 590,600 8,537,900 620,500<br />
0.75 6,581,000 659,700 7,632,200 726,800 10,380,100 759,300<br />
1 8,043,300 791,700 9,276,200 864,100 12,265,000 898,700<br />
1.25 9,502,800 923,500 10,917,200 1,000,800 14,146,900 1,037,500<br />
1.5 10,959,300 1,055,300 12,555,400 1,137,200 16,026,000 1,175,800<br />
1.75 12,412,800 1,186,900 14,190,600 1,273,500 17,902,100 1,313,900<br />
2 13,863,500 1,318,300 15,822,800 1,409,600 19,775,200 1,451,700<br />
2.5 16,755,900 1,580,900 19,078,500 1,681,200 23,512,700 1,726,500<br />
3 19,636,500 1,842,900 22,322,500 1,952,200 27,238,400 2,000,400<br />
3.5 22,505,400 2,104,500 25,554,600 2,222,500 30,952,400 2,273,500<br />
4 25,718,000 2,383,800 29,130,500 2,510,500 35,010,000 2,564,000<br />
4.5 28,317,300 2,633,000 32,093,100 2,768,300 38,454,400 2,824,300<br />
5 30,904,900 2,881,700 35,145,200 3,025,600 42,393,900 3,083,900<br />
10 56,083,700 5,340,600 62,649,600 5,560,200 72,725,500 5,638,100<br />
15 80,061,700 7,748,500 89,357,800 8,045,400 102,261,000 8,138,700<br />
30 144,941,100 14,668,300 162,428,000 15,182,900 183,812,700 15,310,600<br />
Total Reuse System Costs_GAC20-070707.xls, Cap_O&M Cost Summary 7/7/2007
Cost of Service, $/1000 gallon<br />
10.00<br />
9.00<br />
8.00<br />
7.00<br />
6.00<br />
5.00<br />
4.00<br />
3.00<br />
2.00<br />
1.00<br />
0.00<br />
$2/1000 gallons - Typical Potable <strong>Water</strong> Supply Cost<br />
Transmission, miles<br />
1<br />
2<br />
3<br />
4<br />
5<br />
10<br />
0 0.5 1 1.5 2 2.5 3 3.5 4 4.5 5<br />
Reclaimed <strong>Water</strong> Flow/Demand, mgd<br />
Figure D-4a. Reclaimed <strong>Water</strong> System Cost of Service <strong>for</strong> 0-5 mgd Capacity<br />
Urban Area - Tertiary 4 with GAC
Cost of Service, $/1000 gallon<br />
5.00<br />
4.50<br />
4.00<br />
3.50<br />
3.00<br />
2.50<br />
2.00<br />
1.50<br />
1.00<br />
0.50<br />
0.00<br />
Transmission, miles<br />
1<br />
2<br />
3<br />
4<br />
5<br />
10<br />
$2/1000 gallons - Typical Potable <strong>Water</strong> Supply Cost<br />
5 10 15 20 25 30<br />
Reclaimed <strong>Water</strong> Flow/Demand, mgd<br />
Figure D-4b. Reclaimed <strong>Water</strong> System Cost of Service <strong>for</strong> 5-30 mgd Capacity<br />
Urban Area - Tertiary 4 with GAC
Cost Curves as Basis <strong>for</strong> Tertiary 4 - GAC*<br />
Capital Cost<br />
Design Flow Capital Cost<br />
(mgd) ($)<br />
0.0001 $36,117<br />
0.007 $36,117<br />
0.022 $53,091<br />
0.037 $70,491<br />
0.091 $137,932<br />
0.18 $241,793<br />
0.27 $340,528<br />
0.36 $435,155<br />
0.68 $739,387<br />
1 $1,228,620<br />
1.2 $1,551,122<br />
2 $2,203,728<br />
3.5 $3,275,153<br />
7 $5,411,638<br />
17 $10,411,502<br />
22 $12,611,714<br />
76 $31,503,622<br />
210 $67,096,117<br />
430 $114,813,572<br />
520 $132,437,789<br />
1,500.00 $324,345,925<br />
Cost, $<br />
Cost, $<br />
$1,800,000<br />
$1,600,000<br />
$1,400,000<br />
$1,200,000<br />
$1,000,000<br />
$800,000<br />
$600,000<br />
$400,000<br />
$200,000<br />
y = 334592x 2 + 826982x + 66833<br />
R 2 = 0.9978<br />
Curve fit equations<br />
CCI Index 1.16<br />
Avg Flow Range 0.037-0.35 mgd >0.35-30 mgd<br />
Design Flow Range 0.037-1.2 mgd >1.2-60 mgd<br />
Design/Avg Flow Ratio 2<br />
Note: Based on GAC reactivation frequency of 90 days (GAC-20 designation in EPA, 2005).<br />
$0<br />
$35,000,000<br />
$30,000,000<br />
$25,000,000<br />
$20,000,000<br />
$15,000,000<br />
$10,000,000<br />
$5,000,000<br />
$0<br />
0 0.2 0.4 0.6 0.8 1 1.2 1.4<br />
Flow, mgd<br />
y = -2423.81x 2 + 583824.08x + 1123641.87<br />
R 2 = 1.00<br />
0 10 20 30 40<br />
Flow, mgd<br />
50 60 70 80<br />
*Source: Environmental Protection Agency (EPA), 2005. Technologies and Costs Document <strong>for</strong> the Final Long<br />
Term 2 Enhanced Surface <strong>Water</strong> Treatment Rule and Final Stage 2 Disinfectants and Disinfection Byproducts<br />
Rule. December. EPA 815-R-05-013.<br />
Trace Const Removal Technologies.xls, Summ-GAC20 Page 1 of 2 5/4/2007
Cost Curves as Basis <strong>for</strong> Tertiary 4 - GAC*<br />
O&M Cost<br />
Design Flow O&M Cost<br />
(mgd) ($)<br />
0.00005 $9,222<br />
0.0015 $9,222<br />
0.0054 $18,223<br />
0.0095 $25,644<br />
0.025 $47,782<br />
0.054 $47,639<br />
0.084 $61,728<br />
0.11 $74,417<br />
0.23 $123,691<br />
0.35 $171,149<br />
0.41 $177,242<br />
0.77 $199,489<br />
1.4 $237,836<br />
3 $330,703<br />
7.8 $656,235<br />
11 $863,063<br />
38 $2,448,311<br />
120 $6,727,479<br />
270 $14,362,281<br />
350 $18,123,898<br />
750 $36,931,984<br />
Cost, $<br />
$180,000<br />
$160,000<br />
$140,000<br />
$120,000<br />
$100,000<br />
Cost, $<br />
$80,000<br />
$60,000<br />
$40,000<br />
$20,000<br />
$0<br />
$3,000,000<br />
$2,500,000<br />
$2,000,000<br />
$1,500,000<br />
$1,000,000<br />
$500,000<br />
y = -51607x 2 + 428667x + 27507<br />
R 2 = 0.9912<br />
0 0.05 0.1 0.15 0.2 0.25 0.3 0.35 0.4<br />
Flow, mgd<br />
y = -159.09x 2 + 66654.67x + 145415.32<br />
R 2 = 1.00<br />
Note: Based on GAC reactivation frequency of 90 days (GAC-20 designation in EPA, 2005).<br />
*Source: Environmental Protection Agency (EPA), 2005. Technologies and Costs Document <strong>for</strong> the Final<br />
Long Term 2 Enhanced Surface <strong>Water</strong> Treatment Rule and Final Stage 2 Disinfectants and Disinfection<br />
Byproducts Rule. December. EPA 815-R-05-013.<br />
$0<br />
0 5 10 15 Flow, 20mgd 25 30 35 40<br />
Trace Const Removal Technologies.xls, Summ-GAC20 Page 2 of 2 5/4/2007
Appendix D-5<br />
<strong>Water</strong> Reuse System Costs<br />
Tertiary 4 – Membrane Softening<br />
and Ion Exchange
<strong>Water</strong> Reuse System Estimated Cost of Service, $/1000 gallons<br />
Tertiary 4 - Membrane Softening with Ion Exchange<br />
Pipe Length, Miles<br />
Flow, mgd 1 1.5 2 2.5 3 3.5 4 4.5 5 10<br />
0.1 9.88 10.53 11.18 11.84 12.48 13.12 13.77 14.40 15.04 21.53<br />
0.25 6.02 6.30 6.58 6.87 7.14 7.42 7.70 7.96 8.23 11.02<br />
0.5 4.63 4.79 4.95 5.10 5.25 5.41 5.56 5.71 5.86 7.40<br />
0.75 4.14 4.25 4.37 4.48 4.59 4.70 4.82 4.92 5.03 6.16<br />
1 3.90 4.00 4.09 4.18 4.27 4.36 4.46 4.54 4.63 5.54<br />
1.25 3.76 3.84 3.92 4.00 4.08 4.16 4.24 4.31 4.39 5.18<br />
1.5 3.67 3.74 3.81 3.88 3.95 4.02 4.10 4.16 4.23 4.93<br />
1.75 3.60 3.66 3.73 3.79 3.86 3.92 3.99 4.05 4.11 4.75<br />
2 3.54 3.61 3.67 3.73 3.79 3.85 3.91 3.96 4.02 4.62<br />
2.5 3.47 3.53 3.58 3.63 3.69 3.74 3.80 3.84 3.90 4.43<br />
3 3.42 3.47 3.52 3.57 3.62 3.67 3.72 3.76 3.81 4.30<br />
3.5 3.38 3.43 3.48 3.53 3.57 3.62 3.67 3.71 3.75 4.21<br />
4 3.39 3.43 3.48 3.52 3.56 3.61 3.66 3.69 3.74 4.17<br />
4.5 3.34 3.39 3.43 3.47 3.51 3.55 3.60 3.64 3.68 4.09<br />
5 3.31 3.36 3.40 3.44 3.48 3.53 3.57 3.61 3.65 4.07<br />
10 3.11 3.13 3.16 3.19 3.22 3.25 3.29 3.31 3.34 3.63<br />
15 3.03 3.05 3.08 3.10 3.13 3.15 3.18 3.20 3.23 3.47<br />
30 2.90 2.92 2.94 2.96 2.98 3.00 3.03 3.04 3.06 3.26<br />
Total Reuse System Costs_IE-042907.xls, Cost of Service Summary CURVES 5/4/2007
<strong>Water</strong> Reuse System Estimates of Probable Cost - Capital and Operation and Maintenance<br />
Tertiary 4 - Ion Exchange<br />
Treatment Facilities<br />
Total System-1 mile Total System-5 mile<br />
Flow, mgd Capital, $ O&M, $ Capital, $ O&M, $ Capital, $ O&M, $<br />
0.1 1,400,300 152,400 1,991,300 207,000 4,112,900 231,600<br />
0.25 2,314,600 257,600 3,032,900 315,500 5,299,000 342,400<br />
0.5 3,607,200 432,200 4,537,500 495,400 7,044,500 525,300<br />
0.75 4,895,800 606,800 5,947,000 674,000 8,694,900 706,400<br />
1 6,167,800 781,200 7,400,700 853,500 10,389,500 888,200<br />
1.25 7,438,400 955,400 8,852,800 1,032,600 12,082,500 1,069,300<br />
1.5 8,707,300 1,129,600 10,303,400 1,211,500 13,774,000 1,250,100<br />
1.75 9,974,800 1,303,600 11,752,500 1,390,200 15,464,000 1,430,600<br />
2 11,240,700 1,477,600 13,200,100 1,568,800 17,152,400 1,610,900<br />
2.5 13,767,900 1,825,300 16,090,600 1,925,600 20,524,700 1,970,900<br />
3 16,289,000 2,172,600 18,974,900 2,281,900 23,890,900 2,330,000<br />
3.5 18,804,000 2,519,600 21,853,100 2,637,600 27,250,900 2,688,600<br />
4 21,668,200 2,884,400 25,080,700 3,011,200 30,960,200 3,064,700<br />
4.5 23,924,800 3,219,400 27,700,500 3,354,700 34,061,900 3,410,700<br />
5 26,175,300 3,554,000 30,415,600 3,697,800 37,664,300 3,756,200<br />
10 48,292,500 6,879,600 54,858,400 7,099,300 64,934,400 7,177,200<br />
15 69,771,400 10,169,300 79,067,500 10,466,200 91,970,700 10,559,500<br />
30 130,527,500 19,823,300 148,014,500 20,337,800 169,399,200 20,465,500<br />
Total Reuse System Costs_IE-070707.xls, Cap_O&M Cost Summary 7/7/2007
Cost of Service, $/1000 gallon<br />
10.00<br />
9.00<br />
8.00<br />
7.00<br />
6.00<br />
5.00<br />
4.00<br />
3.00<br />
2.00<br />
1.00<br />
0.00<br />
$2/1000 gallons - Typical Potable <strong>Water</strong> Supply Cost<br />
Transmission, miles<br />
1<br />
2<br />
3<br />
4<br />
5<br />
10<br />
0 0.5 1 1.5 2 2.5 3 3.5 4 4.5 5<br />
Reclaimed <strong>Water</strong> Flow/Demand, mgd<br />
Figure D-4a. Reclaimed <strong>Water</strong> System Cost of Service <strong>for</strong> 0-5 mgd Capacity<br />
Urban Area - Tertiary 4 with Ion Exchange
Cost of Service, $/1000 gallon<br />
5.00<br />
4.50<br />
4.00<br />
3.50<br />
3.00<br />
2.50<br />
2.00<br />
1.50<br />
1.00<br />
0.50<br />
0.00<br />
Transmission, miles<br />
1<br />
2<br />
3<br />
4<br />
5<br />
10<br />
$2/1000 gallons - Typical Potable <strong>Water</strong> Supply Cost<br />
5 10 15 20 25 30<br />
Reclaimed <strong>Water</strong> Flow/Demand, mgd<br />
Figure D-4b. Reclaimed <strong>Water</strong> System Cost of Service <strong>for</strong> 5-30 mgd Capacity<br />
Urban Area - Tertiary 4 with Ion Exchange
Cost Curves as Basis <strong>for</strong> Tertiary 4 - Ion Exchange*<br />
Plant Capacity, mgd 1.1 3.1 6.1<br />
Excavation 740 1140 1470 1970<br />
Manufactured $39,960 $89,580 $137,770 $258,230<br />
Media $92,790 $313,160 $521,940 $1,043,880<br />
Concrete $2,410 $3,580 $4,750 $6,320<br />
Steel $3,830 $5,680 $7,530 $9,950<br />
Labor $17,420 $33,510 $61,460 $125,080<br />
Pipes $14,040 $38,780 $69,740 $139,480<br />
Electrical $27,700 $38,510 $60,820 $120,210<br />
Housing $21,920 $35,660 $57,440 $79,820<br />
Contingencies $33,120 $83,940 $138,440 $267,740<br />
Total $253,930 $643,540 $1,061,360 $2,052,680<br />
Total 2000 2006Sep W/ Contg O&M O&M<br />
Plant Capacity, mgd Chemicals Labor Total<br />
1.1 $253,930 $317,412.50 $396,766 $240,900 $10,000 $250,900<br />
3.1 $643,540 $804,425.00 $1,005,531 $678,900 $10,000 $688,900<br />
6.1 $1,061,360 $1,326,700.00 $1,658,375 $1,335,900 $15,000 $1,350,900<br />
12.3 $2,052,680 $2,565,850.00 $3,207,313 $2,693,700 $15,000 $2,708,700<br />
Flow Cap Cost O&M cost Chemical cost= 0.0006 $/gal<br />
1.1 $396,766 $240,900<br />
3.1 $1,005,531 $678,900 Curve fit equations<br />
6.1 $1,658,375 $1,335,900 CCI Index 1.16<br />
12.3 $3,207,313 $2,693,700 Avg Flow Range 0-15<br />
Design Flow Range 0-30<br />
Design/Avg Flow Ratio 2<br />
$3,500,000<br />
$3,000,000<br />
$2,500,000<br />
$2,000,000<br />
$1,500,000<br />
$1,000,000<br />
$500,000<br />
$0<br />
y = 247180x + 170429<br />
R 2 = 0.9984<br />
y = 219000.00x + 0.00<br />
R 2 = 1.00<br />
0 2 4 6 8 10 12 14<br />
Capital<br />
*Source: Environmental Protection Agency (EPA), 2005. Technologies and Costs Document <strong>for</strong> the Final Long Term 2<br />
Enhanced Surface <strong>Water</strong> Treatment Rule and Final Stage 2 Disinfectants and Disinfection Byproducts Rule. December.<br />
EPA 815-R-05-013.<br />
O&M<br />
12.3<br />
Linear (Capital)<br />
Linear (O&M)<br />
Trace Const Removal Technologies.xls, Summ-Ion Exchange Page 1 of 1 5/4/2007
Appendix D-6<br />
<strong>Water</strong> Reuse System Costs<br />
Tertiary 4 – Membrane Softening<br />
and Ultraviolet Radiation
<strong>Water</strong> Reuse System Estimated Cost of Service, $/1000 gallons<br />
Tertiary 4 - Membrane Softening with UV<br />
Pipe Length, Miles<br />
Flow, mgd 1 1.5 2 2.5 3 3.5 4 4.5 5 10<br />
0.1 8.96 9.61 10.27 10.92 11.56 12.20 12.85 13.49 14.12 20.61<br />
0.25 5.24 5.52 5.80 6.08 6.36 6.63 6.91 7.18 7.45 10.24<br />
0.5 3.99 4.15 4.30 4.46 4.61 4.76 4.92 5.07 5.21 6.76<br />
0.75 3.44 3.56 3.67 3.78 3.89 4.01 4.12 4.23 4.33 5.46<br />
1 3.18 3.27 3.36 3.46 3.55 3.64 3.73 3.82 3.91 4.82<br />
1.25 3.02 3.10 3.18 3.26 3.34 3.42 3.50 3.57 3.65 4.43<br />
1.5 2.91 2.99 3.06 3.13 3.20 3.27 3.34 3.41 3.47 4.18<br />
1.75 2.84 2.90 2.97 3.04 3.10 3.16 3.23 3.29 3.35 3.99<br />
2 2.78 2.84 2.90 2.96 3.02 3.08 3.15 3.20 3.26 3.85<br />
2.5 2.70 2.76 2.81 2.86 2.92 2.97 3.03 3.07 3.13 3.66<br />
3 2.65 2.70 2.75 2.80 2.85 2.89 2.95 2.99 3.04 3.53<br />
3.5 2.61 2.66 2.70 2.75 2.79 2.84 2.89 2.93 2.97 3.43<br />
4 2.61 2.65 2.70 2.74 2.79 2.83 2.88 2.92 2.96 3.39<br />
4.5 2.57 2.61 2.65 2.69 2.73 2.78 2.82 2.86 2.90 3.31<br />
5 2.53 2.58 2.62 2.66 2.70 2.75 2.80 2.83 2.87 3.29<br />
10 2.33 2.36 2.39 2.42 2.45 2.48 2.52 2.54 2.57 2.86<br />
15 2.25 2.27 2.30 2.32 2.35 2.37 2.40 2.42 2.45 2.69<br />
30 2.11 2.13 2.15 2.17 2.19 2.21 2.23 2.25 2.27 2.47<br />
Total Reuse System Costs_UV-042707.xls, Cost of Service Summary CURVES 5/4/2007
<strong>Water</strong> Reuse System Estimates of Probable Cost - Capital and Operation and Maintenance<br />
Tertiary 4 - UV<br />
Treatment Facilities<br />
Total System-1 mile Total System-5 mile<br />
Flow, mgd Capital, $ O&M, $ Capital, $ O&M, $ Capital, $ O&M, $<br />
0.1 1,206,500 133,800 1,797,600 188,500 3,919,200 213,000<br />
0.25 2,090,200 203,300 2,808,500 261,300 5,074,600 288,200<br />
0.5 3,550,400 319,200 4,480,700 382,300 6,987,700 412,200<br />
0.75 4,712,900 429,800 5,764,100 497,000 8,512,000 529,400<br />
1 5,860,600 540,200 7,093,400 612,600 10,082,200 647,300<br />
1.25 7,008,600 650,600 8,423,100 727,800 11,652,800 764,500<br />
1.5 8,156,900 760,800 9,753,000 842,800 13,223,600 881,400<br />
1.75 9,305,400 870,900 11,083,200 957,600 14,794,600 998,000<br />
2 10,454,200 981,000 12,413,600 1,072,300 16,366,000 1,114,300<br />
2.5 12,752,700 1,200,900 15,075,300 1,301,200 19,509,500 1,346,500<br />
3 15,052,300 1,420,400 17,738,200 1,529,700 22,654,200 1,577,900<br />
3.5 17,352,900 1,639,600 20,402,100 1,757,700 25,799,900 1,808,600<br />
4 20,010,100 1,876,700 23,422,600 2,003,400 29,302,100 2,057,000<br />
4.5 22,066,900 2,083,900 25,842,600 2,219,200 32,204,000 2,275,200<br />
5 24,124,700 2,290,800 28,365,100 2,434,600 35,613,800 2,493,000<br />
10 44,713,800 4,340,200 51,279,700 4,559,900 61,355,600 4,637,800<br />
15 63,975,700 6,347,400 73,271,800 6,644,300 86,175,000 6,737,600<br />
30 117,245,800 12,146,400 134,732,800 12,661,000 156,117,500 12,788,700<br />
Total Reuse System Costs_UV-070707.xls, Cap_O&M Cost Summary 7/7/2007
Cost of Service, $/1000 gallon<br />
10.00<br />
9.00<br />
8.00<br />
7.00<br />
6.00<br />
5.00<br />
4.00<br />
3.00<br />
2.00<br />
1.00<br />
0.00<br />
$2/1000 gallons - Typical Potable <strong>Water</strong> Supply Cost<br />
Transmission, miles<br />
1<br />
2<br />
3<br />
4<br />
5<br />
10<br />
0 0.5 1 1.5 2 2.5 3 3.5 4 4.5 5<br />
Reclaimed <strong>Water</strong> Flow/Demand, mgd<br />
Figure D-6a. Reclaimed <strong>Water</strong> System Cost of Service <strong>for</strong> 0-5 mgd Capacity<br />
Urban Area - Tertiary 4 with UV
Cost of Service, $/1000 gallon<br />
5.00<br />
4.50<br />
4.00<br />
3.50<br />
3.00<br />
2.50<br />
2.00<br />
1.50<br />
1.00<br />
0.50<br />
0.00<br />
Transmission, miles<br />
1<br />
2<br />
3<br />
4<br />
5<br />
10<br />
$2/1000 gallons - Typical Potable <strong>Water</strong> Supply Cost<br />
5 10 15 20 25 30<br />
Reclaimed <strong>Water</strong> Flow/Demand, mgd<br />
Figure D-6b. Reclaimed <strong>Water</strong> System Cost of Service <strong>for</strong> 5-30 mgd Capacity<br />
Urban Area - Tertiary 4 with UV
Cost Curves as Basis <strong>for</strong> Tertiary 4 - Ultraviolet Radiation*<br />
Capital Cost<br />
Design Flow Capital Cost<br />
(mgd) ($)<br />
0.0001 $10,195<br />
0.007 $10,195<br />
0.022 $13,034<br />
0.037 $15,834<br />
0.091 $25,596<br />
0.18 $40,597<br />
0.27 $54,386<br />
0.36 $66,790<br />
0.68 $99,661<br />
1 $310,154<br />
1.2 $313,662<br />
2 $333,331<br />
3.5 $362,965<br />
7 $544,728<br />
17 $1,342,022<br />
22 $1,933,041<br />
76 $3,367,751<br />
210 $8,074,450<br />
430 $15,798,603<br />
520 $18,601,681<br />
1,500.00 $49,124,085<br />
Capital Cost, $<br />
Capital Cost, $<br />
Capital Cost, $<br />
$120,000<br />
$100,000<br />
$80,000<br />
$60,000<br />
$40,000<br />
$20,000<br />
$0<br />
$2,500,000<br />
$2,000,000<br />
$1,500,000<br />
$1,000,000<br />
$500,000<br />
$0<br />
$4,000,000<br />
$3,000,000<br />
$2,000,000<br />
$1,000,000<br />
$0<br />
y = -85591x 2 + 191737x + 8857<br />
R 2 = 1<br />
0 0.1 0.2 0.3 0.4 0.5 0.6 0.7 0.8<br />
Flow/Demand, mgd<br />
y = 2583.2x 2 + 18160x + 284721<br />
R 2 = 0.9999<br />
0 5 10 15 20 25<br />
Flow/Demand, mgd<br />
y = 26569x + 1348530<br />
R 2 = 1<br />
0 10 20 30 40 50 60 70 80<br />
Flow/Demand, mgd<br />
Curve fit equations<br />
CCI Index 1.16<br />
Avg Flow Range 0.005-0.35 0.35-11 11-38<br />
Design Flow Range 0.022-0.99 1-22 22-76<br />
Design/Avg Flow Ratio 2<br />
*Source: Environmental Protection Agency (EPA), 2005. Technologies and Costs Document <strong>for</strong> the Final Long Term 2<br />
Enhanced Surface <strong>Water</strong> Treatment Rule and Final Stage 2 Disinfectants and Disinfection Byproducts Rule.<br />
December. EPA 815-R-05-013.<br />
Trace Const Removal Technologies.xls, Summ-UV Page 1 of 2 5/4/2007
Cost Curves as Basis <strong>for</strong> Tertiary 4 - Ultraviolet Radiation*<br />
O&M Cost<br />
Design Flow O&M Cost<br />
(mgd) ($)<br />
0.00005 $3,350<br />
0.0015 $3,350<br />
0.0054 $3,380<br />
0.0095 $3,769<br />
0.025 $4,549<br />
0.054 $4,736<br />
0.084 $6,115<br />
0.11 $6,493<br />
0.23 $8,152<br />
0.35 $9,016<br />
0.41 $9,450<br />
0.77 $11,512<br />
1.4 $13,979<br />
3 $16,183<br />
7.8 $22,908<br />
11 $27,531<br />
38 $66,755<br />
120 $188,219<br />
270 $422,455<br />
350 $551,123<br />
750 $1,194,464<br />
Annual Cost, $<br />
Annual Cost, $<br />
Annual Cost, $<br />
$10,000<br />
$8,000<br />
$6,000<br />
$4,000<br />
$2,000<br />
$0<br />
$30,000<br />
$25,000<br />
$20,000<br />
$15,000<br />
$10,000<br />
$5,000<br />
$0<br />
$80,000<br />
$70,000<br />
$60,000<br />
$50,000<br />
$40,000<br />
$30,000<br />
$20,000<br />
$10,000<br />
$0<br />
y = -65649x 2 + 35917x + 3366.2<br />
R 2 = 0.9811<br />
0 0.05 0.1 0.15 0.2 0.25<br />
Flow/Demand, mgd<br />
y = -77.948x 2 + 2489.2x + 9159.7<br />
R 2 = 0.9829<br />
0 2 4 6 8 10 12<br />
Flow/Demand, mgd<br />
y = 1453x + 11551<br />
R 2 = 1<br />
0 5 10 15 20 25 30 35 40<br />
Flow/Demand, mgd<br />
*Source: Environmental Protection Agency (EPA), 2005. Technologies and Costs Document <strong>for</strong> the Final Long Term 2<br />
Enhanced Surface <strong>Water</strong> Treatment Rule and Final Stage 2 Disinfectants and Disinfection Byproducts Rule.<br />
December. EPA 815-R-05-013.<br />
Trace Const Removal Technologies.xls, Summ-UV Page 2 of 2 5/4/2007
Appendix D-7<br />
<strong>Water</strong> Reuse Treatment Process<br />
Schematics <strong>for</strong> Reclaimed <strong>Water</strong> Quality<br />
Classifications (Base and Tertiary 1-4)
Secondary<br />
Treatment<br />
Assumptions<br />
Suspended,<br />
Colloidal &<br />
Dissolved<br />
Solids<br />
Removal<br />
Residual<br />
Suspended<br />
Solids<br />
Removal<br />
Residual<br />
Colloidal<br />
Solids<br />
Removal<br />
Residual<br />
Dissolved<br />
Solids<br />
Removal<br />
Residual and<br />
Specific Trace<br />
Constituent<br />
Removal<br />
Disinfection<br />
Adapted from Metcalf & Eddy, 2007<br />
Conventional Secondary Treatment<br />
Facility with Nutrient Removal<br />
(Base WWTP)<br />
Microfiltration Depth<br />
Filtration<br />
Coagulation/Flocculation/<br />
Sedimentation<br />
Surface<br />
Filtration<br />
Microfiltration Ultrafiltration<br />
Membrane Secondary Treatment<br />
Facility with Nutrient Removal<br />
Dissolved Air<br />
Flotation<br />
Nanofiltration Reverse Osmosis Electrodialysis<br />
Ion Exchange Carbon Adsorption Advanced Oxidation<br />
Chlorination Ultraviolet Radiation Ozone<br />
Residual Disinfection<br />
<strong>Water</strong> to Reuse Customer<br />
Figure D-7a. Base System Treatment Train as Basis of Cost
Secondary<br />
Treatment<br />
Assumptions<br />
Suspended,<br />
Colloidal &<br />
Dissolved<br />
Solids<br />
Removal<br />
Residual<br />
Suspended<br />
Solids<br />
Removal<br />
Residual<br />
Colloidal<br />
Solids<br />
Removal<br />
Residual<br />
Dissolved<br />
Solids<br />
Removal<br />
Residual and<br />
Specific Trace<br />
Constituent<br />
Removal<br />
Disinfection<br />
Adapted from Metcalf & Eddy, 2007<br />
Conventional Secondary Treatment<br />
Facility with Nutrient Removal<br />
(Base WWTP)<br />
Microfiltration Depth<br />
Filtration<br />
Coagulation/Flocculation/<br />
Sedimentation<br />
Surface<br />
Filtration<br />
Microfiltration Ultrafiltration<br />
Membrane Secondary Treatment<br />
Facility with Nutrient Removal<br />
Dissolved Air<br />
Flotation<br />
Nanofiltration Reverse Osmosis Electrodialysis<br />
Ion Exchange Carbon Adsorption Advanced Oxidation<br />
Chlorination Ultraviolet Radiation Ozone<br />
Residual Disinfection<br />
<strong>Water</strong> to Reuse Customer<br />
Figure D-7b. Tertiary 1 - Conventional Treatment Train as Basis of Cost
Secondary<br />
Treatment<br />
Assumptions<br />
Suspended,<br />
Colloidal &<br />
Dissolved<br />
Solids<br />
Removal<br />
Residual<br />
Suspended<br />
Solids<br />
Removal<br />
Residual<br />
Colloidal<br />
Solids<br />
Removal<br />
Residual<br />
Dissolved<br />
Solids<br />
Removal<br />
Residual and<br />
Specific Trace<br />
Constituent<br />
Removal<br />
Disinfection<br />
Adapted from Metcalf & Eddy, 2007<br />
Conventional Secondary Treatment<br />
Facility with Nutrient Removal<br />
(Base WWTP)<br />
Microfiltration Depth<br />
Filtration<br />
Coagulation/Flocculation/<br />
Sedimentation<br />
Surface<br />
Filtration<br />
Microfiltration Ultrafiltration<br />
Membrane Secondary Treatment<br />
Facility with Nutrient Removal<br />
Dissolved Air<br />
Flotation<br />
Nanofiltration Reverse Osmosis Electrodialysis<br />
Ion Exchange Carbon Adsorption Advanced Oxidation<br />
Chlorination Ultraviolet Radiation Ozone<br />
Residual Disinfection<br />
<strong>Water</strong> to Reuse Customer<br />
Figure D-7c. Tertiary 2 – Membrane Filtration Treatment Train as Basis of Cost
Secondary<br />
Treatment<br />
Assumptions<br />
Suspended,<br />
Colloidal &<br />
Dissolved<br />
Solids<br />
Removal<br />
Residual<br />
Suspended<br />
Solids<br />
Removal<br />
Residual<br />
Colloidal<br />
Solids<br />
Removal<br />
Residual<br />
Dissolved<br />
Solids<br />
Removal<br />
Residual and<br />
Specific Trace<br />
Constituent<br />
Removal<br />
Disinfection<br />
Adapted from Metcalf & Eddy, 2007<br />
Conventional Secondary Treatment<br />
Facility with Nutrient Removal<br />
(Base WWTP)<br />
Microfiltration Depth<br />
Filtration<br />
Coagulation/Flocculation/<br />
Sedimentation<br />
Surface<br />
Filtration<br />
Microfiltration Ultrafiltration<br />
Membrane Secondary Treatment<br />
Facility with Nutrient Removal<br />
Dissolved Air<br />
Flotation<br />
Nanofiltration Reverse Osmosis Electrodialysis<br />
Ion Exchange Carbon Adsorption Advanced Oxidation<br />
Chlorination Ultraviolet Radiation Ozone<br />
Residual Disinfection<br />
<strong>Water</strong> to Reuse Customer<br />
Figure D-7d. Tertiary 3 – Membrane Softening Treatment Train as Basis of Cost
Secondary<br />
Treatment<br />
Assumptions<br />
Suspended,<br />
Colloidal &<br />
Dissolved<br />
Solids<br />
Removal<br />
Residual<br />
Suspended<br />
Solids<br />
Removal<br />
Residual<br />
Colloidal<br />
Solids<br />
Removal<br />
Residual<br />
Dissolved<br />
Solids<br />
Removal<br />
Residual and<br />
Specific Trace<br />
Constituent<br />
Removal<br />
Disinfection<br />
Adapted from Metcalf & Eddy, 2007<br />
Conventional Secondary Treatment<br />
Facility with Nutrient Removal<br />
(Base WWTP)<br />
Microfiltration Depth<br />
Filtration<br />
Coagulation/Flocculation/<br />
Sedimentation<br />
Surface<br />
Filtration<br />
Microfiltration Ultrafiltration<br />
Membrane Secondary Treatment<br />
Facility with Nutrient Removal<br />
Dissolved Air<br />
Flotation<br />
Nanofiltration Reverse Osmosis Electrodialysis<br />
Ion Exchange Carbon Adsorption Advanced Oxidation<br />
Chlorination Ultraviolet Radiation Ozone<br />
Residual Disinfection<br />
<strong>Water</strong> to Reuse Customer<br />
Figure D-7e. Tertiary 4 – Advanced with GAC Treatment Train as Basis of Cost
Secondary<br />
Treatment<br />
Assumptions<br />
Suspended,<br />
Colloidal &<br />
Dissolved<br />
Solids<br />
Removal<br />
Residual<br />
Suspended<br />
Solids<br />
Removal<br />
Residual<br />
Colloidal<br />
Solids<br />
Removal<br />
Residual<br />
Dissolved<br />
Solids<br />
Removal<br />
Residual and<br />
Specific Trace<br />
Constituent<br />
Removal<br />
Disinfection<br />
Adapted from Metcalf & Eddy, 2007<br />
Conventional Secondary Treatment<br />
Facility with Nutrient Removal<br />
(Base WWTP)<br />
Microfiltration Depth<br />
Filtration<br />
Coagulation/Flocculation/<br />
Sedimentation<br />
Surface<br />
Filtration<br />
Microfiltration Ultrafiltration<br />
Membrane Secondary Treatment<br />
Facility with Nutrient Removal<br />
Dissolved Air<br />
Flotation<br />
Nanofiltration Reverse Osmosis Electrodialysis<br />
Ion Exchange Carbon Adsorption Advanced Oxidation<br />
Chlorination Ultraviolet Radiation Ozone<br />
Residual Disinfection<br />
<strong>Water</strong> to Reuse Customer<br />
Figure D-7f. Tertiary 4 – Advanced with Ion Exchange Treatment Train as Basis of Cost
Secondary<br />
Treatment<br />
Assumptions<br />
Suspended,<br />
Colloidal &<br />
Dissolved<br />
Solids<br />
Removal<br />
Residual<br />
Suspended<br />
Solids<br />
Removal<br />
Residual<br />
Colloidal<br />
Solids<br />
Removal<br />
Residual<br />
Dissolved<br />
Solids<br />
Removal<br />
Residual and<br />
Specific Trace<br />
Constituent<br />
Removal<br />
Disinfection<br />
Adapted from Metcalf & Eddy, 2007<br />
Conventional Secondary Treatment<br />
Facility with Nutrient Removal<br />
(Base WWTP)<br />
Microfiltration Depth<br />
Filtration<br />
Coagulation/Flocculation/<br />
Sedimentation<br />
Surface<br />
Filtration<br />
Microfiltration Ultrafiltration<br />
Membrane Secondary Treatment<br />
Facility with Nutrient Removal<br />
Dissolved Air<br />
Flotation<br />
Nanofiltration Reverse Osmosis Electrodialysis<br />
Ion Exchange Carbon Adsorption Advanced Oxidation*<br />
Chlorination Ultraviolet Radiation* Ozone<br />
Residual Disinfection<br />
<strong>Water</strong> to Reuse Customer<br />
*UV can precede reverse osmosis;<br />
one advanced oxidation process<br />
is UV and hydrogen peroxide;<br />
cost model <strong>for</strong> study is based on<br />
Tertiary 3 water with UV only<br />
Figure D-7g. Tertiary 4 – Advanced with UV Treatment Train as Basis of Cost
Metropolitan Council<br />
<strong>Recycling</strong> <strong>Treated</strong> <strong>Municipal</strong><br />
<strong>Wastewater</strong> <strong>for</strong><br />
<strong>Industrial</strong> <strong>Water</strong> <strong>Use</strong><br />
LCMR05-07d<br />
MCES Project Number 070186<br />
TECHNICAL MEMORANDUM 4<br />
<strong>Wastewater</strong> Treatment Plant Effluent Quality<br />
June 30, 2007<br />
Craddock Consulting Engineers<br />
In Association with<br />
CDM and James Crook
Craddock Consulting Engineers 1<br />
In Association with CDM & James Crook<br />
TM4-WWTP Eff Quality_0707.doc<br />
1.0 Introduction<br />
This technical memorandum is the fourth in a series of memoranda developed under<br />
a Metropolitan Council (Council) project titled “<strong>Recycling</strong> <strong>Treated</strong> <strong>Municipal</strong><br />
<strong>Wastewater</strong> <strong>for</strong> <strong>Industrial</strong> <strong>Water</strong> <strong>Use</strong>.” Funding <strong>for</strong> this project was recommended by<br />
the Legislative Commission on Minnesota Resources (LCMR) from the Minnesota<br />
Environment and Natural Resources Trust Fund. The Met Council is providing<br />
additional funding <strong>for</strong> the project through in-kind contributions of staff time. Other<br />
state agencies are participating via stakeholder meetings and technical review and<br />
input.<br />
Objective<br />
This memorandum summarizes the effluent quality of wastewater treatment plants<br />
(WWTPs) in Minnesota. The purpose of the WWTP effluent quality analysis is to<br />
assess the applicability of WWTP effluent as a water source <strong>for</strong> industries in<br />
Minnesota. The constituents evaluated serve as indicators of the level of treatment<br />
provided by a WWTP and depending on the industrial use of the water, as specific<br />
water quality parameters of concern.<br />
Constituents of Concern<br />
The analysis focuses on the following constituents: 5-day carbonaceous biochemical<br />
oxygen demand (CBOD5), total suspended solids (TSS), ammonia (NH3), total<br />
phosphorous (TP), and fecal coli<strong>for</strong>ms. Table 1 lists the constituents evaluated and<br />
reasons <strong>for</strong> concern in industrial water reuse. These constituents are routinely<br />
measured in WWTP effluent as part of the National Pollutant Discharge Elimination<br />
System (NPDES) Permit requirements.<br />
Table 1. <strong>Water</strong> Quality Concerns <strong>for</strong> <strong>Industrial</strong> Applications<br />
Constituent Reason <strong>for</strong> Concern<br />
CBOD5 (indicator of organic content) Biological fouling, foaming, imparts color or odor,<br />
interference with disinfection<br />
TSS Deposition, clogging, interference with disinfection<br />
Ammonia Corrosion, interference with disinfection<br />
Phosphorous Scaling, microbial growth<br />
Fecal Coli<strong>for</strong>ms (indicator organism) Infectious disease<br />
The water quality constituents listed in Table 1 are only a subset of the constituents<br />
industries evaluate to select a water source and possibly treat as part of their routine<br />
facility operations. Technical Memoranda 1, 2, and 3 produced <strong>for</strong> this project provide<br />
additional in<strong>for</strong>mation on the water quality parameters of concern <strong>for</strong> industrial<br />
water use. These five constituents are evaluated in detail because they provide a<br />
general indicator of the level of treatment at individual WWTPs and there is a well<br />
documented database with a high level of quality control and assurance associated<br />
with the database.
TM4: WWTP Effluent Quality<br />
<strong>Recycling</strong> <strong>Treated</strong> <strong>Municipal</strong> <strong>Wastewater</strong> <strong>for</strong> <strong>Industrial</strong> <strong>Water</strong> <strong>Use</strong><br />
2.0 Analysis Background and Results<br />
Data Source<br />
All WWTPs are required to submit discharge monitoring reports in accordance with<br />
their NPDES permit. Historic records of WWTP influent and effluent quantity and<br />
quality are maintained by the Minnesota Pollution Control Agency (MPCA). These<br />
data and the corresponding GIS data were provided by MPCA through the<br />
Environmental Data Access system and used in this analysis (MPCA, 2005).<br />
The discharge monitoring report data are entered into the Environmental Data Access<br />
system as reported by the municipality. In<strong>for</strong>mation can be incorrectly listed on the<br />
monitoring reports by the municipality (i.e. misplacement of a decimal point is a<br />
common error). These “incorrect” values are not identified or changed unless the<br />
municipality contacts the MPCA with revised values or if the reported values exceed<br />
permitted limits and MPCA takes en<strong>for</strong>cement action and inquires about the<br />
exceedance. For this study, all data are presented as contained in the database.<br />
Data Analysis Methods<br />
Monthly discharge data were summarized as annual average flows and concentration<br />
to per<strong>for</strong>m statistical analyses. The 2005 water quality data were linked to the WWTPs<br />
location shapefile and maps were generated to characterize the average annual<br />
effluent quality of Minnesota’s municipal WWTPs. A summary of the data analysis is<br />
presented below. Appendix A presents the detailed data analysis methods.<br />
The constituents of concern evaluated in this study are not monitored in the effluent<br />
of all facilities. This study identifies a constituent as “not measured” if it is not<br />
monitored at these facilities. The term “not measured” is also used to designate<br />
missing data <strong>for</strong> a specific constituent at an individual WWTP, but this is a rare<br />
occurrence.<br />
Results<br />
CBOD5<br />
The organic concentration in the water supply needs to be kept at a minimum <strong>for</strong><br />
most industrial water uses. Organic matter provides a food source <strong>for</strong> microbial<br />
growth which can lead to biological fouling and related scaling problems.<br />
Consumption of oxygen and reduced oxygen levels could be a concern <strong>for</strong> some<br />
industries. Also disinfection processes are less stable with higher organic<br />
concentrations. Several states with water reuse regulations require reclaimed water to<br />
meet a CBOD5 limit of 20 mg/L <strong>for</strong> various uses. CBOD5, or related parameters such<br />
as BOD5 or TOC, are constituents routinely tested in WWTP effluent, with CBOD5 the<br />
most common one <strong>for</strong> Minnesota’s WWTPs. Higher effluent CBOD5 concentrations<br />
are often indicative of facilities with lower levels of treatment or possibly facilities that<br />
are operating at the capacity limit and are not achieving the per<strong>for</strong>mance expected <strong>for</strong><br />
critical treatment processes.<br />
2 Craddock Consulting Engineers<br />
In Association with CDM & James Crook<br />
TM4-WWTP Eff Quality_0707.doc
TM4: WWTP Effluent Quality<br />
<strong>Recycling</strong> <strong>Treated</strong> <strong>Municipal</strong> <strong>Wastewater</strong> <strong>for</strong> <strong>Industrial</strong> <strong>Water</strong> <strong>Use</strong><br />
Craddock Consulting Engineers 3<br />
In Association with CDM & James Crook<br />
TM4-WWTP Eff Quality_0707.doc<br />
Figure 1 presents the frequency of occurrence of CBOD5 concentration in the effluent<br />
of all Minnesota WWTPs in 2005. Similar in<strong>for</strong>mation is shown in Figure 2 <strong>for</strong><br />
facilities with design capacities greater than 1 mgd, defined as larger facilities <strong>for</strong> this<br />
technical memorandum. The variability of effluent CBOD5 is also characterized <strong>for</strong> the<br />
following ranges: < 5 mg/L, 5-10 mg/L, 10-20 mg/L, and >20 mg/L.<br />
The average WWTP effluent CBOD5 concentrations are depicted by location and<br />
facility capacity in Figure 3. As shown and further detailed in Figures 4-7, a high<br />
percentage of Minnesota facilities produce a high quality effluent in terms of organic<br />
concentration. There were 252 facilities with CBOD5 concentrations less than 5 mg/L,<br />
accounting <strong>for</strong> over 600 mgd of the total WWTP design capacity in the state. A similar<br />
number of facilities, with a combined design capacity of nearly 140 mgd, produced<br />
effluent with CBOD5 in the 5-20 mg/L range. Only 16 facilities in Minnesota produced<br />
an effluent with an annual average CBOD5 greater than 20 mg/L. The remaining<br />
facilities did not measure CBOD5 in 2005.
Frequency of Occurrence, %<br />
Percentile<br />
TM4: WWTP Effluent Quality<br />
<strong>Recycling</strong> <strong>Treated</strong> <strong>Municipal</strong> <strong>Wastewater</strong> <strong>for</strong> <strong>Industrial</strong> <strong>Water</strong> <strong>Use</strong><br />
100.0%<br />
90.0%<br />
80.0%<br />
70.0%<br />
60.0%<br />
50.0%<br />
40.0%<br />
30.0%<br />
20.0%<br />
10.0%<br />
0.0%<br />
100.0%<br />
90.0%<br />
80.0%<br />
70.0%<br />
60.0%<br />
50.0%<br />
40.0%<br />
30.0%<br />
20.0%<br />
10.0%<br />
0.0%<br />
0.0 5.0 10.0 15.0 20.0 25.0 30.0 35.0 40.0 45.0<br />
Annual Average Concentration, mg/L<br />
Figure 1. Effluent CBOD5 of <strong>Municipal</strong> WWTPs in Minnesota<br />
0.0 2.0 4.0 6.0 8.0 10.0 12.0 14.0<br />
Annual Average Concentration, mg/L<br />
Figure 2. Effluent CBOD5 of <strong>Municipal</strong> WWTPs Greater than 1 mgd in Minnesota<br />
4 Craddock Consulting Engineers<br />
In Association with CDM & James Crook<br />
TM4-WWTP Eff Quality_0707.doc
!( !(<br />
!(<br />
!( !( !(<br />
!(<br />
!(<br />
!(<br />
!(<br />
!(<br />
!(<br />
!(<br />
!(<br />
!(<br />
!(<br />
!(<br />
!(<br />
!(<br />
!(<br />
!(<br />
!(<br />
!(<br />
!(<br />
!(<br />
!(<br />
!(<br />
!(<br />
!(<br />
!(<br />
!(<br />
!(<br />
!(<br />
!(<br />
!(<br />
!(<br />
!(<br />
!(<br />
!(<br />
!(<br />
!(<br />
!(<br />
!(<br />
!(<br />
!(<br />
!(<br />
!(<br />
!(<br />
!(<br />
!(<br />
!(<br />
!(<br />
!(<br />
!(<br />
!(<br />
!(<br />
!(<br />
!(<br />
!(<br />
!(<br />
!(<br />
!(<br />
!(<br />
!(<br />
!(<br />
!(<br />
!(<br />
!(<br />
!(<br />
!(<br />
!(<br />
!(<br />
!(<br />
!(<br />
!(<br />
!(<br />
!(<br />
!(<br />
!(<br />
!(<br />
!(<br />
!(<br />
!(<br />
!( !(<br />
!(<br />
!(<br />
!(<br />
!(<br />
!(<br />
!(<br />
!(<br />
!(<br />
!(<br />
!(<br />
!(<br />
!(<br />
!(<br />
!(<br />
!(<br />
!(<br />
!(<br />
!(<br />
!(<br />
!(<br />
!(<br />
!(<br />
!(<br />
!(<br />
!(<br />
!(<br />
!(<br />
!(<br />
!(<br />
!(<br />
!(<br />
!(<br />
!(<br />
!(<br />
!(<br />
!(<br />
!(<br />
!(<br />
!(<br />
!(<br />
!(<br />
!(<br />
!(<br />
!(<br />
!(<br />
!(<br />
!(<br />
!(<br />
!(<br />
!(<br />
!(<br />
!(<br />
!(<br />
!(<br />
!(<br />
!(<br />
!(<br />
!(<br />
!(<br />
!(<br />
!(<br />
!(<br />
!(<br />
!(<br />
!(<br />
!(<br />
!(<br />
!(<br />
!(<br />
!(<br />
!(<br />
!(<br />
!(<br />
!(<br />
!(<br />
!(<br />
!(<br />
!(<br />
!(<br />
!(<br />
!(<br />
!(<br />
!(<br />
!(<br />
!(<br />
!(<br />
!(<br />
!(<br />
!(<br />
!(<br />
!(<br />
!(<br />
!(<br />
!(<br />
!(<br />
!(<br />
!(<br />
!(<br />
!(<br />
!(<br />
!(<br />
!(<br />
!(<br />
!(<br />
!(<br />
!(<br />
!(<br />
!(<br />
!(<br />
!(<br />
!(<br />
!(<br />
!(<br />
!(<br />
!(<br />
!(<br />
!(<br />
!(<br />
!(<br />
!( !(<br />
!(<br />
!(<br />
!(<br />
!(<br />
!(<br />
!(<br />
!(<br />
!(<br />
!(<br />
!(<br />
!(<br />
!(<br />
!(<br />
!(<br />
!(<br />
!(<br />
!(<br />
!(<br />
!(<br />
!(<br />
!(<br />
!(<br />
!(<br />
!(<br />
!(<br />
!(<br />
!(<br />
!(<br />
!(<br />
!(<br />
!(<br />
!(<br />
!(<br />
!(<br />
!(<br />
!(<br />
!(<br />
!(<br />
!(<br />
!(<br />
!(<br />
!(<br />
!(<br />
!(<br />
!(<br />
!(<br />
!(<br />
!(<br />
!(<br />
!(<br />
!(<br />
!(<br />
!(<br />
!(<br />
!(<br />
!(<br />
!(<br />
!(<br />
!(<br />
!(<br />
!(<br />
!(<br />
!(<br />
!(<br />
!(<br />
!(<br />
!(<br />
!(<br />
!(<br />
!(<br />
!(<br />
!(<br />
!(<br />
!(<br />
!(<br />
!(<br />
!(<br />
!(<br />
!(<br />
!(<br />
!(<br />
!(<br />
!(<br />
!(<br />
!(<br />
!(<br />
!(<br />
!(<br />
!(<br />
!(<br />
!(<br />
!(<br />
!(<br />
!(<br />
!(<br />
!(<br />
!(<br />
!(<br />
!(<br />
!(<br />
!(<br />
!(<br />
!(<br />
!(<br />
!(<br />
!(<br />
!(<br />
!(<br />
!(<br />
!(<br />
!(<br />
!(<br />
!(<br />
!(<br />
!(<br />
!(<br />
!(<br />
!(<br />
!(<br />
!(<br />
!(<br />
!(<br />
!(<br />
!(<br />
!(<br />
!(<br />
!(<br />
!(<br />
!(<br />
!(<br />
!(<br />
!(<br />
!(<br />
!(<br />
!(<br />
!(<br />
!(<br />
!(<br />
!(<br />
!(<br />
!(<br />
!(<br />
!(<br />
!(<br />
!(<br />
!(<br />
!(<br />
!(<br />
!(<br />
!(<br />
!(<br />
!(<br />
!(<br />
!(<br />
!(<br />
!(<br />
!(<br />
!(<br />
!(<br />
!(<br />
!(<br />
!(<br />
!(<br />
!(<br />
!(<br />
!(<br />
!(<br />
!(<br />
!(<br />
!(<br />
!(<br />
!(<br />
!(<br />
!(<br />
!(<br />
!(<br />
!(<br />
!(<br />
!(<br />
!(<br />
!(<br />
!(<br />
!(<br />
!(<br />
!(<br />
!(<br />
!(<br />
!(<br />
!(<br />
!(<br />
!(<br />
!(<br />
!(<br />
!(<br />
!(<br />
!(<br />
!(<br />
!(<br />
!(<br />
!(<br />
!(<br />
!(<br />
!(<br />
!(<br />
!(<br />
!(<br />
!(<br />
!(<br />
!(<br />
!(<br />
!(<br />
!(<br />
!(<br />
!(<br />
!(<br />
!(<br />
!(<br />
!(<br />
!(<br />
!(<br />
!(<br />
!(<br />
!(<br />
!(<br />
!(<br />
!(<br />
!(<br />
!(<br />
!(<br />
!(<br />
!(<br />
!(<br />
!(<br />
!(<br />
!(<br />
!(<br />
!(<br />
!(<br />
!(<br />
!(<br />
!(<br />
!(<br />
!(<br />
!(<br />
!(<br />
!(<br />
!(<br />
!(<br />
!(<br />
!(<br />
!(<br />
!(<br />
!(<br />
!(<br />
!(<br />
!(<br />
!(<br />
!(<br />
!(<br />
!(<br />
!( !(<br />
!(<br />
!(<br />
!(<br />
!(<br />
!(<br />
!(<br />
!(<br />
!(<br />
!(<br />
!(<br />
!(<br />
!(<br />
!(<br />
!(<br />
!(<br />
!(<br />
!(<br />
!(<br />
!(<br />
!(<br />
!(<br />
!(<br />
!(<br />
!(<br />
!(<br />
!(<br />
!(<br />
!(<br />
!(<br />
!(<br />
!(<br />
!(<br />
!( !(<br />
!(<br />
!( !(<br />
!(<br />
!(<br />
!(<br />
!(<br />
!(<br />
!(<br />
!(<br />
!(<br />
!(<br />
!(<br />
!(<br />
!(<br />
!(<br />
!(<br />
0 50 100 Miles<br />
¯<br />
CBOD5 =5 mgd<br />
! WWTP 1-5 mgd<br />
!<br />
County<br />
WWTP 0-1 mgd<br />
!<br />
CBOD5 5-10 mg/L<br />
!(<br />
!(<br />
Figure 3. Effluent CBOD5 of <strong>Municipal</strong> WWTPs in Minnesota<br />
CBOD5_2005 Annual Average<br />
CBOD5 10-20 mg/L<br />
CBOD5 >20 mg/L<br />
!(<br />
!(<br />
Source: Discharge Monitoring Reports, MPCA, 2005.<br />
Not Measured/Data Unavailable<br />
!(
TM4: WWTP Effluent Quality<br />
<strong>Recycling</strong> <strong>Treated</strong> <strong>Municipal</strong> <strong>Wastewater</strong> <strong>for</strong> <strong>Industrial</strong> <strong>Water</strong> <strong>Use</strong><br />
Total Permitted Design Capacity, mgd<br />
700<br />
600<br />
500<br />
400<br />
300<br />
200<br />
100<br />
0<br />
Figure 4. Annual Average Effluent CBOD5, Capacity, and Number of <strong>Municipal</strong><br />
WWTPs in Minnesota<br />
No. of Plants<br />
300<br />
250<br />
200<br />
150<br />
100<br />
50<br />
0<br />
252<br />
No. of Facilities<br />
166<br />
< 5 5-10 10-20 >20 not measured<br />
<strong>Municipal</strong> WWTP Annual Average Effluent CBOD5 (mg/L)<br />
< 5 5-10 10-20 >20 not<br />
measured<br />
<strong>Municipal</strong> WWTP Annual Average Effluent CBOD5 (mg/L)<br />
Total<br />
Capacity >=1 mgd<br />
Capacity
TM4: WWTP Effluent Quality<br />
<strong>Recycling</strong> <strong>Treated</strong> <strong>Municipal</strong> <strong>Wastewater</strong> <strong>for</strong> <strong>Industrial</strong> <strong>Water</strong> <strong>Use</strong><br />
Craddock Consulting Engineers 7<br />
In Association with CDM & James Crook<br />
TM4-WWTP Eff Quality_0707.doc<br />
>20 mg/L, 16<br />
WWTPs<br />
(2.7%)<br />
10-20 mg/L,<br />
86 WWTPs<br />
(14.8%)<br />
20 mg/L, 1.2 mgd (0.2%)<br />
not measured, 11.1 mgd (1.5%)<br />
TM4: WWTP Effluent Quality<br />
<strong>Recycling</strong> <strong>Treated</strong> <strong>Municipal</strong> <strong>Wastewater</strong> <strong>for</strong> <strong>Industrial</strong> <strong>Water</strong> <strong>Use</strong><br />
TSS<br />
Total suspended solids (TSS) is a gross measure of the amount of particulate in the<br />
water. In wastewater, it is typically sand, silt, clay, organic matter, including<br />
microorganisms. Elevated TSS levels can create deposition and clogging problems <strong>for</strong><br />
industrial applications. Particulate matter can also interfere with disinfection and<br />
other processes such as reverse osmosis. Several states with water reuse regulations<br />
require reclaimed water to meet a TSS limit of 30 mg/L <strong>for</strong> various uses.<br />
Figure 8 presents the frequency of occurrence of TSS concentration in the effluent of<br />
all Minnesota WWTPs in 2005. Similar in<strong>for</strong>mation is shown in Figure 9 <strong>for</strong> facilities<br />
with design capacities greater than 1 mgd. The variability of effluent TSS is also<br />
characterized <strong>for</strong> the following ranges: < 5 mg/L, 5-10 mg/L, 10-20 mg/L, and >20<br />
mg/L.<br />
The average annual WWTP effluent TSS concentrations are depicted by location and<br />
facility capacity in Figure 10 and further detailed in Figures 11-14. There were 100<br />
facilities with less than 5 mg/L of TSS. Those facilities have a combined design<br />
capacity of 380 mgd, which is 50% of the total combined capacity of all WWTPs in<br />
Minnesota. Over 300 WWTPs, with a combined capacity of nearly 300 mgd, produce<br />
an effluent with TSS concentrations in the 5-20 mg/L. Over 100 facilities have effluent<br />
TSS concentrations greater than 20 mg/L.<br />
8 Craddock Consulting Engineers<br />
In Association with CDM & James Crook<br />
TM4-WWTP Eff Quality_0707.doc
Frequency of Occurrence, %<br />
Frequency of Occurrence, %<br />
100.0%<br />
90.0%<br />
80.0%<br />
70.0%<br />
60.0%<br />
50.0%<br />
40.0%<br />
30.0%<br />
20.0%<br />
10.0%<br />
0.0%<br />
100.0%<br />
80.0%<br />
60.0%<br />
40.0%<br />
20.0%<br />
TM4: WWTP Effluent Quality<br />
<strong>Recycling</strong> <strong>Treated</strong> <strong>Municipal</strong> <strong>Wastewater</strong> <strong>for</strong> <strong>Industrial</strong> <strong>Water</strong> <strong>Use</strong><br />
Craddock Consulting Engineers 9<br />
In Association with CDM & James Crook<br />
TM4-WWTP Eff Quality_0707.doc<br />
0.0 20.0 40.0 60.0 80.0 100.0 120.0 140.0 160.0<br />
Annual Average Concentration (mg/L)<br />
Figure 8. Effluent TSS of <strong>Municipal</strong> WWTPs in Minnesota<br />
0.0%<br />
0.0 2.0 4.0 6.0 8.0 10.0 12.0 14.0 16.0 18.0 20.0<br />
Annual Average Concentration (mg/L)<br />
Figure 9. Effluent TSS of <strong>Municipal</strong> WWTPs Greater than 1 mgd in Minnesota
!( !(<br />
!(<br />
!( !( !(<br />
!(<br />
!(<br />
!(<br />
!(<br />
!(<br />
!(<br />
!(<br />
!(<br />
!(<br />
!(<br />
!(<br />
!(<br />
!(<br />
!(<br />
!(<br />
!(<br />
!(<br />
!(<br />
!(<br />
!(<br />
!(<br />
!(<br />
!(<br />
!(<br />
!(<br />
!(<br />
!(<br />
!(<br />
!(<br />
!(<br />
!(<br />
!(<br />
!(<br />
!(<br />
!(<br />
!(<br />
!(<br />
!(<br />
!(<br />
!(<br />
!(<br />
!(<br />
!(<br />
!(<br />
!(<br />
!(<br />
!(<br />
!(<br />
!(<br />
!(<br />
!(<br />
!(<br />
!(<br />
!(<br />
!(<br />
!(<br />
!(<br />
!(<br />
!(<br />
!(<br />
!(<br />
!(<br />
!(<br />
!(<br />
!(<br />
!(<br />
!(<br />
!(<br />
!(<br />
!(<br />
!(<br />
!(<br />
!(<br />
!(<br />
!(<br />
!(<br />
!(<br />
!( !(<br />
!(<br />
!(<br />
!(<br />
!(<br />
!(<br />
!(<br />
!(<br />
!(<br />
!(<br />
!(<br />
!(<br />
!(<br />
!(<br />
!(<br />
!(<br />
!(<br />
!(<br />
!(<br />
!(<br />
!(<br />
!(<br />
!(<br />
!(<br />
!(<br />
!(<br />
!(<br />
!(<br />
!(<br />
!(<br />
!(<br />
!(<br />
!(<br />
!(<br />
!(<br />
!(<br />
!(<br />
!(<br />
!(<br />
!(<br />
!(<br />
!(<br />
!(<br />
!(<br />
!(<br />
!(<br />
!(<br />
!(<br />
!(<br />
!(<br />
!(<br />
!(<br />
!(<br />
!(<br />
!(<br />
!(<br />
!(<br />
!(<br />
!(<br />
!(<br />
!(<br />
!(<br />
!(<br />
!(<br />
!(<br />
!(<br />
!(<br />
!(<br />
!(<br />
!(<br />
!(<br />
!(<br />
!(<br />
!(<br />
!(<br />
!(<br />
!(<br />
!(<br />
!(<br />
!(<br />
!(<br />
!(<br />
!(<br />
!(<br />
!(<br />
!(<br />
!(<br />
!(<br />
!(<br />
!(<br />
!(<br />
!(<br />
!(<br />
!(<br />
!(<br />
!(<br />
!(<br />
!(<br />
!(<br />
!(<br />
!(<br />
!(<br />
!(<br />
!(<br />
!(<br />
!(<br />
!(<br />
!(<br />
!(<br />
!(<br />
!(<br />
!(<br />
!(<br />
!(<br />
!(<br />
!(<br />
!(<br />
!(<br />
!(<br />
!(<br />
!( !(<br />
!(<br />
!(<br />
!(<br />
!(<br />
!(<br />
!(<br />
!(<br />
!(<br />
!(<br />
!(<br />
!(<br />
!(<br />
!(<br />
!(<br />
!(<br />
!(<br />
!(<br />
!(<br />
!(<br />
!(<br />
!(<br />
!(<br />
!(<br />
!(<br />
!(<br />
!(<br />
!(<br />
!(<br />
!(<br />
!(<br />
!(<br />
!(<br />
!(<br />
!(<br />
!(<br />
!(<br />
!(<br />
!(<br />
!(<br />
!(<br />
!(<br />
!(<br />
!(<br />
!(<br />
!(<br />
!(<br />
!(<br />
!(<br />
!(<br />
!(<br />
!(<br />
!(<br />
!(<br />
!(<br />
!(<br />
!(<br />
!(<br />
!(<br />
!(<br />
!(<br />
!(<br />
!(<br />
!(<br />
!(<br />
!(<br />
!(<br />
!(<br />
!(<br />
!(<br />
!(<br />
!(<br />
!(<br />
!(<br />
!(<br />
!(<br />
!(<br />
!(<br />
!(<br />
!(<br />
!(<br />
!(<br />
!(<br />
!(<br />
!(<br />
!(<br />
!(<br />
!(<br />
!(<br />
!(<br />
!(<br />
!(<br />
!(<br />
!(<br />
!(<br />
!(<br />
!(<br />
!(<br />
!(<br />
!(<br />
!(<br />
!(<br />
!(<br />
!(<br />
!(<br />
!(<br />
!(<br />
!(<br />
!(<br />
!(<br />
!(<br />
!(<br />
!(<br />
!(<br />
!(<br />
!(<br />
!(<br />
!(<br />
!(<br />
!(<br />
!(<br />
!(<br />
!(<br />
!(<br />
!(<br />
!(<br />
!(<br />
!(<br />
!(<br />
!(<br />
!(<br />
!(<br />
!(<br />
!(<br />
!(<br />
!(<br />
!(<br />
!(<br />
!(<br />
!(<br />
!(<br />
!(<br />
!(<br />
!(<br />
!(<br />
!(<br />
!(<br />
!(<br />
!(<br />
!(<br />
!(<br />
!(<br />
!(<br />
!(<br />
!(<br />
!(<br />
!(<br />
!(<br />
!(<br />
!(<br />
!(<br />
!(<br />
!(<br />
!(<br />
!(<br />
!(<br />
!(<br />
!(<br />
!(<br />
!(<br />
!(<br />
!(<br />
!(<br />
!(<br />
!(<br />
!(<br />
!(<br />
!(<br />
!(<br />
!(<br />
!(<br />
!(<br />
!(<br />
!(<br />
!(<br />
!(<br />
!(<br />
!(<br />
!(<br />
!(<br />
!(<br />
!(<br />
!(<br />
!(<br />
!(<br />
!(<br />
!(<br />
!(<br />
!(<br />
!(<br />
!(<br />
!(<br />
!(<br />
!(<br />
!(<br />
!(<br />
!(<br />
!(<br />
!(<br />
!(<br />
!(<br />
!(<br />
!(<br />
!(<br />
!(<br />
!(<br />
!(<br />
!(<br />
!(<br />
!(<br />
!(<br />
!(<br />
!(<br />
!(<br />
!(<br />
!(<br />
!(<br />
!(<br />
!(<br />
!(<br />
!(<br />
!(<br />
!(<br />
!(<br />
!(<br />
!(<br />
!(<br />
!(<br />
!(<br />
!(<br />
!(<br />
!(<br />
!(<br />
!(<br />
!(<br />
!(<br />
!(<br />
!(<br />
!(<br />
!(<br />
!(<br />
!(<br />
!(<br />
!(<br />
!(<br />
!(<br />
!(<br />
!(<br />
!(<br />
!(<br />
!(<br />
!(<br />
!(<br />
!(<br />
!(<br />
!(<br />
!(<br />
!(<br />
!(<br />
!(<br />
!(<br />
!(<br />
!(<br />
!(<br />
!(<br />
!(<br />
!(<br />
!(<br />
!(<br />
!(<br />
!(<br />
!(<br />
!(<br />
!(<br />
!(<br />
!(<br />
!(<br />
!(<br />
!(<br />
!(<br />
!(<br />
!(<br />
!(<br />
!(<br />
!(<br />
!(<br />
!(<br />
!(<br />
!(<br />
!(<br />
!(<br />
!(<br />
!(<br />
!(<br />
!(<br />
!(<br />
!(<br />
!(<br />
!(<br />
!(<br />
!(<br />
!(<br />
!(<br />
!(<br />
!(<br />
!(<br />
!(<br />
!(<br />
!(<br />
!(<br />
!(<br />
!(<br />
!(<br />
!(<br />
!( !(<br />
!(<br />
!(<br />
!(<br />
!(<br />
!(<br />
!(<br />
!(<br />
!(<br />
!(<br />
!(<br />
!(<br />
!(<br />
!(<br />
!(<br />
!(<br />
!(<br />
!(<br />
!(<br />
!(<br />
!(<br />
!(<br />
!(<br />
!(<br />
!(<br />
!(<br />
!(<br />
!(<br />
!(<br />
!(<br />
!(<br />
!(<br />
!(<br />
!( !(<br />
!(<br />
!( !(<br />
!(<br />
!(<br />
!(<br />
!(<br />
!(<br />
!(<br />
!(<br />
!(<br />
!(<br />
!(<br />
!(<br />
!(<br />
!(<br />
!(<br />
0 50 100 Miles<br />
¯<br />
TSS =5 mgd<br />
!<br />
WWTP 1-5 mgd<br />
!<br />
County<br />
WWTP 0-1 mgd<br />
!<br />
TSS 5-10 mg/L<br />
!(<br />
!(<br />
Figure 10. Effluent TSS of <strong>Municipal</strong> WWTPs in Minnesota<br />
TSS - 2005 Annual Average<br />
TSS 10-20 mg/L<br />
TSS >20 mg/L<br />
!(<br />
!(<br />
Source: Discharge Monitoring Reports, MPCA, 2005.<br />
Not Measured/<br />
Data Unavailable<br />
!(
No. of Plants<br />
Total Permitting Design Capacity, mgd<br />
TM4: WWTP Effluent Quality<br />
<strong>Recycling</strong> <strong>Treated</strong> <strong>Municipal</strong> <strong>Wastewater</strong> <strong>for</strong> <strong>Industrial</strong> <strong>Water</strong> <strong>Use</strong><br />
Craddock Consulting Engineers 11<br />
In Association with CDM & James Crook<br />
TM4-WWTP Eff Quality_0707.doc<br />
450<br />
400<br />
350<br />
300<br />
250<br />
200<br />
150<br />
100<br />
180<br />
160<br />
140<br />
120<br />
100<br />
50<br />
0<br />
100<br />
160<br />
No. of Facilities<br />
< 5 5-10 10-20 >20 not measured<br />
<strong>Municipal</strong> WWTP Annual Average Effluent TSS (mg/L)<br />
Figure 11. Annual Average Effluent TSS, Capacity, and Number of <strong>Municipal</strong><br />
WWTPs in Minnesota<br />
80<br />
60<br />
40<br />
20<br />
0<br />
Figure 12. Annual Average Effluent TSS and Number of <strong>Municipal</strong> WWTPs in<br />
Minnesota<br />
157<br />
105<br />
< 5 5-10 10-20 >20 not<br />
measured<br />
<strong>Municipal</strong> WWTP Annual Average Effluent TSS (mg/L)<br />
61<br />
Total<br />
Capacity>=1 mgd<br />
Capacity < 1 mgd
TM4: WWTP Effluent Quality<br />
<strong>Recycling</strong> <strong>Treated</strong> <strong>Municipal</strong> <strong>Wastewater</strong> <strong>for</strong> <strong>Industrial</strong> <strong>Water</strong> <strong>Use</strong><br />
>20 mg/L, 105<br />
WWTPs (18%)<br />
10-20 mg/L, 157<br />
WWTPs<br />
(26.9%)<br />
Figure 13. Effluent TSS and Number of <strong>Municipal</strong> WWTPs in Minnesota<br />
>20 mg/L, 13.1 mgd<br />
(1.7%)<br />
10-20 mg/L,<br />
65.4 mgd<br />
(8.6%)<br />
5-10 mg/L, 293.5 mgd (38.5%)<br />
Not measured, 61 WWTPs (10.5%)<br />
not measured, 11 mgd (1.4%)<br />
< 5mg/L, 100 WWTPs (17.2%)<br />
5-10 mg/L, 160<br />
WWTPs (27.4%)<br />
TM4: WWTP Effluent Quality<br />
<strong>Recycling</strong> <strong>Treated</strong> <strong>Municipal</strong> <strong>Wastewater</strong> <strong>for</strong> <strong>Industrial</strong> <strong>Water</strong> <strong>Use</strong><br />
Craddock Consulting Engineers 13<br />
In Association with CDM & James Crook<br />
TM4-WWTP Eff Quality_0707.doc<br />
Total Phosphorous (TP)<br />
Elevated phosphorus concentrations together with high residual organic constituents<br />
in reclaimed water can cause biological fouling and scaling in industrial water<br />
systems.<br />
Figure 15 presents the frequency of occurrence of TP concentration in the effluent of<br />
all Minnesota WWTPs. Similar in<strong>for</strong>mation is shown in Figure 16 <strong>for</strong> WWTPs with<br />
design capacities greater than 1 mgd. The variability of effluent TP is also<br />
characterized <strong>for</strong> the following ranges: < 1 mg/L, 1-5 mg/L, and >5 mg/L.<br />
The average WWTP effluent TP concentrations are depicted by location and facility<br />
capacity in Figure 17 and further detailed in Figures 18-21. Over 25% of the WWTPs,<br />
corresponding to more than 60% of the WWTP capacity, have phosphorus treatment<br />
removal processes, indicative of those facilities with effluent concentrations less than<br />
1 mg/L. The majority of the facilities have effluent TP concentrations between 1-5<br />
mg/L. There were 35 facilities with effluent TP greater than 5 mg/L. Those facilities<br />
have a combined design capacity of 63 mgd. The remaining facilities did not measure<br />
TP in 2005.
TM4: WWTP Effluent Quality<br />
<strong>Recycling</strong> <strong>Treated</strong> <strong>Municipal</strong> <strong>Wastewater</strong> <strong>for</strong> <strong>Industrial</strong> <strong>Water</strong> <strong>Use</strong><br />
Frequency of Occurrence, %<br />
Frequency of Occurrence, %<br />
100.0%<br />
90.0%<br />
80.0%<br />
70.0%<br />
60.0%<br />
50.0%<br />
40.0%<br />
30.0%<br />
20.0%<br />
10.0%<br />
0.0%<br />
100.0%<br />
90.0%<br />
80.0%<br />
70.0%<br />
60.0%<br />
50.0%<br />
40.0%<br />
30.0%<br />
20.0%<br />
10.0%<br />
0.0%<br />
0.00 10.00 20.00 30.00 40.00 50.00 60.00<br />
Annual Average Concentration, mg/L<br />
Figure 15. Effluent Total Phosphorous of <strong>Municipal</strong> WWTPs in Minnesota<br />
0.00 1.00 2.00 3.00 4.00 5.00 6.00 7.00 8.00 9.00<br />
Annual Average Concentration, mg/L<br />
Figure 16. Effluent Total Phosphorous of <strong>Municipal</strong> WWTPs Greater than 1 mgd in<br />
Minnesota<br />
14 Craddock Consulting Engineers<br />
In Association with CDM & James Crook<br />
TM4-WWTP Eff Quality_0707.doc
!( !(<br />
!(<br />
!( !( !(<br />
!(<br />
!(<br />
!(<br />
!(<br />
!(<br />
!(<br />
!(<br />
!(<br />
!(<br />
!(<br />
!(<br />
!(<br />
!(<br />
!(<br />
!(<br />
!(<br />
!(<br />
!(<br />
!(<br />
!(<br />
!(<br />
!(<br />
!(<br />
!(<br />
!(<br />
!(<br />
!(<br />
!(<br />
!(<br />
!(<br />
!(<br />
!(<br />
!(<br />
!(<br />
!(<br />
!(<br />
!(<br />
!(<br />
!(<br />
!(<br />
!(<br />
!(<br />
!(<br />
!(<br />
!(<br />
!(<br />
!(<br />
!(<br />
!(<br />
!(<br />
!(<br />
!(<br />
!(<br />
!(<br />
!(<br />
!(<br />
!(<br />
!(<br />
!(<br />
!(<br />
!(<br />
!(<br />
!(<br />
!(<br />
!(<br />
!(<br />
!(<br />
!(<br />
!(<br />
!(<br />
!(<br />
!(<br />
!(<br />
!(<br />
!(<br />
!(<br />
!(<br />
!( !(<br />
!(<br />
!(<br />
!(<br />
!(<br />
!(<br />
!(<br />
!(<br />
!(<br />
!(<br />
!(<br />
!(<br />
!(<br />
!(<br />
!(<br />
!(<br />
!(<br />
!(<br />
!(<br />
!(<br />
!(<br />
!(<br />
!(<br />
!(<br />
!(<br />
!(<br />
!(<br />
!(<br />
!(<br />
!(<br />
!(<br />
!(<br />
!(<br />
!(<br />
!(<br />
!(<br />
!(<br />
!(<br />
!(<br />
!(<br />
!(<br />
!(<br />
!(<br />
!(<br />
!(<br />
!(<br />
!(<br />
!(<br />
!(<br />
!(<br />
!(<br />
!(<br />
!(<br />
!(<br />
!(<br />
!(<br />
!(<br />
!(<br />
!(<br />
!(<br />
!(<br />
!(<br />
!(<br />
!(<br />
!(<br />
!(<br />
!(<br />
!(<br />
!(<br />
!(<br />
!(<br />
!(<br />
!(<br />
!(<br />
!(<br />
!(<br />
!(<br />
!(<br />
!(<br />
!(<br />
!(<br />
!(<br />
!(<br />
!(<br />
!(<br />
!(<br />
!(<br />
!(<br />
!(<br />
!(<br />
!(<br />
!(<br />
!(<br />
!(<br />
!(<br />
!(<br />
!(<br />
!(<br />
!(<br />
!(<br />
!(<br />
!(<br />
!(<br />
!(<br />
!(<br />
!(<br />
!(<br />
!(<br />
!(<br />
!(<br />
!(<br />
!(<br />
!(<br />
!(<br />
!(<br />
!(<br />
!(<br />
!(<br />
!(<br />
!(<br />
!( !(<br />
!(<br />
!(<br />
!(<br />
!(<br />
!(<br />
!(<br />
!(<br />
!(<br />
!(<br />
!(<br />
!(<br />
!(<br />
!(<br />
!(<br />
!(<br />
!(<br />
!(<br />
!(<br />
!(<br />
!(<br />
!(<br />
!(<br />
!(<br />
!(<br />
!(<br />
!(<br />
!(<br />
!(<br />
!(<br />
!(<br />
!(<br />
!(<br />
!(<br />
!(<br />
!(<br />
!(<br />
!(<br />
!(<br />
!(<br />
!(<br />
!(<br />
!(<br />
!(<br />
!(<br />
!(<br />
!(<br />
!(<br />
!(<br />
!(<br />
!(<br />
!(<br />
!(<br />
!(<br />
!(<br />
!(<br />
!(<br />
!(<br />
!(<br />
!(<br />
!(<br />
!(<br />
!(<br />
!(<br />
!(<br />
!(<br />
!(<br />
!(<br />
!(<br />
!(<br />
!(<br />
!(<br />
!(<br />
!(<br />
!(<br />
!(<br />
!(<br />
!(<br />
!(<br />
!(<br />
!(<br />
!(<br />
!(<br />
!(<br />
!(<br />
!(<br />
!(<br />
!(<br />
!(<br />
!(<br />
!(<br />
!(<br />
!(<br />
!(<br />
!(<br />
!(<br />
!(<br />
!(<br />
!(<br />
!(<br />
!(<br />
!(<br />
!(<br />
!(<br />
!(<br />
!(<br />
!(<br />
!(<br />
!(<br />
!(<br />
!(<br />
!(<br />
!(<br />
!(<br />
!(<br />
!(<br />
!(<br />
!(<br />
!(<br />
!(<br />
!(<br />
!(<br />
!(<br />
!(<br />
!(<br />
!(<br />
!(<br />
!(<br />
!(<br />
!(<br />
!(<br />
!(<br />
!(<br />
!(<br />
!(<br />
!(<br />
!(<br />
!(<br />
!(<br />
!(<br />
!(<br />
!(<br />
!(<br />
!(<br />
!(<br />
!(<br />
!(<br />
!(<br />
!(<br />
!(<br />
!(<br />
!(<br />
!(<br />
!(<br />
!(<br />
!(<br />
!(<br />
!(<br />
!(<br />
!(<br />
!(<br />
!(<br />
!(<br />
!(<br />
!(<br />
!(<br />
!(<br />
!(<br />
!(<br />
!(<br />
!(<br />
!(<br />
!(<br />
!(<br />
!(<br />
!(<br />
!(<br />
!(<br />
!(<br />
!(<br />
!(<br />
!(<br />
!(<br />
!(<br />
!(<br />
!(<br />
!(<br />
!(<br />
!(<br />
!(<br />
!(<br />
!(<br />
!(<br />
!(<br />
!(<br />
!(<br />
!(<br />
!(<br />
!(<br />
!(<br />
!(<br />
!(<br />
!(<br />
!(<br />
!(<br />
!(<br />
!(<br />
!(<br />
!(<br />
!(<br />
!(<br />
!(<br />
!(<br />
!(<br />
!(<br />
!(<br />
!(<br />
!(<br />
!(<br />
!(<br />
!(<br />
!(<br />
!(<br />
!(<br />
!(<br />
!(<br />
!(<br />
!(<br />
!(<br />
!(<br />
!(<br />
!(<br />
!(<br />
!(<br />
!(<br />
!(<br />
!(<br />
!(<br />
!(<br />
!(<br />
!(<br />
!(<br />
!(<br />
!(<br />
!(<br />
!(<br />
!(<br />
!(<br />
!(<br />
!(<br />
!(<br />
!(<br />
!(<br />
!(<br />
!(<br />
!(<br />
!(<br />
!(<br />
!(<br />
!(<br />
!(<br />
!(<br />
!(<br />
!(<br />
!(<br />
!(<br />
!(<br />
!(<br />
!(<br />
!(<br />
!(<br />
!(<br />
!(<br />
!(<br />
!(<br />
!(<br />
!(<br />
!(<br />
!(<br />
!(<br />
!(<br />
!(<br />
!(<br />
!(<br />
!(<br />
!(<br />
!(<br />
!(<br />
!(<br />
!(<br />
!(<br />
!(<br />
!(<br />
!(<br />
!(<br />
!(<br />
!(<br />
!(<br />
!(<br />
!(<br />
!(<br />
!(<br />
!(<br />
!(<br />
!(<br />
!(<br />
!(<br />
!(<br />
!(<br />
!(<br />
!(<br />
!(<br />
!(<br />
!(<br />
!(<br />
!(<br />
!(<br />
!(<br />
!(<br />
!(<br />
!(<br />
!(<br />
!(<br />
!(<br />
!( !(<br />
!(<br />
!(<br />
!(<br />
!(<br />
!(<br />
!(<br />
!(<br />
!(<br />
!(<br />
!(<br />
!(<br />
!(<br />
!(<br />
!(<br />
!(<br />
!(<br />
!(<br />
!(<br />
!(<br />
!(<br />
!(<br />
!(<br />
!(<br />
!(<br />
!(<br />
!(<br />
!(<br />
!(<br />
!(<br />
!(<br />
!(<br />
!(<br />
!( !(<br />
!(<br />
!( !(<br />
!(<br />
!(<br />
!(<br />
!(<br />
!(<br />
!(<br />
!(<br />
!(<br />
!(<br />
!(<br />
!(<br />
!(<br />
!(<br />
!(<br />
0 50 100 Miles<br />
¯<br />
P =5 mgd<br />
! WWTP 1-5 mgd<br />
!<br />
County<br />
WWTP 0-1 mgd<br />
!<br />
P 1-5 mg/L<br />
!(<br />
!(<br />
Figure 17. Effluent Total Phosphorous of <strong>Municipal</strong> WWTPs in Minnesota<br />
Phosphorous - 2005 Annual Average<br />
P >5 mg/L<br />
!(<br />
!( Not Measured/<br />
Data Unavailable<br />
Source: Discharge Monitoring Reports, MPCA, 2005
TM4: WWTP Effluent Quality<br />
<strong>Recycling</strong> <strong>Treated</strong> <strong>Municipal</strong> <strong>Wastewater</strong> <strong>for</strong> <strong>Industrial</strong> <strong>Water</strong> <strong>Use</strong><br />
Total Permitting Design Capacity, mgd<br />
No. of Plants<br />
600<br />
500<br />
400<br />
300<br />
200<br />
100<br />
0<br />
< 1 1-5 >5 not measured<br />
<strong>Municipal</strong> WWTP Annual Average Effluent P (mg/L)<br />
Figure 18. Annual Average Effluent Total P, Capacity, and Number of <strong>Municipal</strong><br />
WWTPs in Minnesota<br />
350<br />
300<br />
250<br />
200<br />
150<br />
100<br />
50<br />
0<br />
159<br />
No. of Facilities<br />
312<br />
< 1 1-5 >5 not measured<br />
<strong>Municipal</strong> WWTP Annual Average Effluent P (mg/L)<br />
Figure 19. Annual Average Effluent Total P and Number of <strong>Municipal</strong> WWTPs in<br />
Minnesota<br />
16 Craddock Consulting Engineers<br />
In Association with CDM & James Crook<br />
35<br />
Total<br />
77<br />
Capacity >=1 mgd<br />
Capacity < 1 mgd<br />
TM4-WWTP Eff Quality_0707.doc
TM4: WWTP Effluent Quality<br />
<strong>Recycling</strong> <strong>Treated</strong> <strong>Municipal</strong> <strong>Wastewater</strong> <strong>for</strong> <strong>Industrial</strong> <strong>Water</strong> <strong>Use</strong><br />
Craddock Consulting Engineers 17<br />
In Association with CDM & James Crook<br />
TM4-WWTP Eff Quality_0707.doc<br />
>5 mg/L, 35<br />
WWTPs<br />
(6.0%)<br />
not measured, 77 WWTPs (13.2%)<br />
< 1 mg/L, 159<br />
WWTPs (27.3%)<br />
1-5 mg/L, 312 WWTPs<br />
(53.5%)<br />
Figure 20. Effluent Total P and Number of <strong>Municipal</strong> WWTPs in Minnesota<br />
> 5 mg/L, 62.7<br />
mgd (8.2%)<br />
1-5 mg/L, 183.1 mgd (24.0%)<br />
not measured, 40.1 mgd (5.3%)<br />
< 1 mg/L, 477.2 mgd<br />
(62.5%)<br />
Figure 21. Effluent Total P and Combined Capacity of <strong>Municipal</strong> WWTPs in<br />
Minnesota
TM4: WWTP Effluent Quality<br />
<strong>Recycling</strong> <strong>Treated</strong> <strong>Municipal</strong> <strong>Wastewater</strong> <strong>for</strong> <strong>Industrial</strong> <strong>Water</strong> <strong>Use</strong><br />
Ammonia (NH3)<br />
Excess ammonia in reclaimed water is a concern <strong>for</strong> increased corrosion rates,<br />
particularly with cooling water applications. Ammonia also promotes biological<br />
growth and related biofouling and interferes with disinfection.<br />
Figure 22 presents the frequency of occurrence of NH3 concentration in the effluent of<br />
all Minnesota WWTPs. Similar in<strong>for</strong>mation is shown in Figure 23 <strong>for</strong> WWTPs with<br />
design capacities greater than 1 mgd. The variability of effluent NH3 is also<br />
characterized <strong>for</strong> the following ranges: < 1 mg/L, 1-5 mg/L, 5-10 mg/L, and >10<br />
mg/L.<br />
The average WWTP effluent NH3 concentrations are depicted by location and facility<br />
capacity in Figure 24 and further detailed in Figures 25-28. Approximately 15% of<br />
Minnesota’s WWTPs have nitrogen removal processes, indicated by effluent NH3<br />
concentrations less than 5 mg/L. This accounts <strong>for</strong> 600 mgd of the total design<br />
capacity in the state. This also assumes that WWTPs that do not monitor <strong>for</strong> ammonia,<br />
do not nitrify. Approximately 80% of Minnesota’s WWTPs do not measure ammonia.<br />
Of those facilities monitoring <strong>for</strong> ammonia, 16 produce an effluent with a<br />
concentration greater than 5 mg/L.<br />
18 Craddock Consulting Engineers<br />
In Association with CDM & James Crook<br />
TM4-WWTP Eff Quality_0707.doc
Frequency of Occurrence, %<br />
Frequency of Occurrence, %<br />
100.0%<br />
80.0%<br />
60.0%<br />
40.0%<br />
20.0%<br />
0.0%<br />
100.0%<br />
80.0%<br />
60.0%<br />
40.0%<br />
20.0%<br />
TM4: WWTP Effluent Quality<br />
<strong>Recycling</strong> <strong>Treated</strong> <strong>Municipal</strong> <strong>Wastewater</strong> <strong>for</strong> <strong>Industrial</strong> <strong>Water</strong> <strong>Use</strong><br />
Craddock Consulting Engineers 19<br />
In Association with CDM & James Crook<br />
TM4-WWTP Eff Quality_0707.doc<br />
0.00 5.00 10.00 15.00 20.00 25.00<br />
Annual Average Concentration (mg/L)<br />
Figure 22. Effluent Ammonia of <strong>Municipal</strong> WWTPs in Minnesota<br />
0.0%<br />
0.00 5.00 10.00 15.00 20.00 25.00<br />
Annual Average Concentration (mg/L)<br />
Figure 23. Effluent Ammonia of <strong>Municipal</strong> WWTPs Greater than 1 mgd in<br />
Minnesota
!( !(<br />
!(<br />
!( !( !(<br />
!(<br />
!(<br />
!(<br />
!(<br />
!(<br />
!(<br />
!(<br />
!(<br />
!(<br />
!(<br />
!(<br />
!(<br />
!(<br />
!(<br />
!(<br />
!(<br />
!(<br />
!(<br />
!(<br />
!(<br />
!(<br />
!(<br />
!(<br />
!(<br />
!(<br />
!(<br />
!(<br />
!(<br />
!(<br />
!(<br />
!(<br />
!(<br />
!(<br />
!(<br />
!(<br />
!(<br />
!(<br />
!(<br />
!(<br />
!(<br />
!(<br />
!(<br />
!(<br />
!(<br />
!(<br />
!(<br />
!(<br />
!(<br />
!(<br />
!(<br />
!(<br />
!(<br />
!(<br />
!(<br />
!(<br />
!(<br />
!(<br />
!(<br />
!(<br />
!(<br />
!(<br />
!(<br />
!(<br />
!(<br />
!(<br />
!(<br />
!(<br />
!(<br />
!(<br />
!(<br />
!(<br />
!(<br />
!(<br />
!(<br />
!(<br />
!(<br />
!(<br />
!( !(<br />
!(<br />
!(<br />
!(<br />
!(<br />
!(<br />
!(<br />
!(<br />
!(<br />
!(<br />
!(<br />
!(<br />
!(<br />
!(<br />
!(<br />
!(<br />
!(<br />
!(<br />
!(<br />
!(<br />
!(<br />
!(<br />
!(<br />
!(<br />
!(<br />
!(<br />
!(<br />
!(<br />
!(<br />
!(<br />
!(<br />
!(<br />
!(<br />
!(<br />
!(<br />
!(<br />
!(<br />
!(<br />
!(<br />
!(<br />
!(<br />
!(<br />
!(<br />
!(<br />
!(<br />
!(<br />
!(<br />
!(<br />
!(<br />
!(<br />
!(<br />
!(<br />
!(<br />
!(<br />
!(<br />
!(<br />
!(<br />
!(<br />
!(<br />
!(<br />
!(<br />
!(<br />
!(<br />
!(<br />
!(<br />
!(<br />
!(<br />
!(<br />
!(<br />
!(<br />
!(<br />
!(<br />
!(<br />
!(<br />
!(<br />
!(<br />
!(<br />
!(<br />
!(<br />
!(<br />
!(<br />
!(<br />
!(<br />
!(<br />
!(<br />
!(<br />
!(<br />
!(<br />
!(<br />
!(<br />
!(<br />
!(<br />
!(<br />
!(<br />
!(<br />
!(<br />
!(<br />
!(<br />
!(<br />
!(<br />
!(<br />
!(<br />
!(<br />
!(<br />
!(<br />
!(<br />
!(<br />
!(<br />
!(<br />
!(<br />
!(<br />
!(<br />
!(<br />
!(<br />
!(<br />
!(<br />
!(<br />
!(<br />
!(<br />
!(<br />
!( !(<br />
!(<br />
!(<br />
!(<br />
!(<br />
!(<br />
!(<br />
!(<br />
!(<br />
!(<br />
!(<br />
!(<br />
!(<br />
!(<br />
!(<br />
!(<br />
!(<br />
!(<br />
!(<br />
!(<br />
!(<br />
!(<br />
!(<br />
!(<br />
!(<br />
!(<br />
!(<br />
!(<br />
!(<br />
!(<br />
!(<br />
!(<br />
!(<br />
!(<br />
!(<br />
!(<br />
!(<br />
!(<br />
!(<br />
!(<br />
!(<br />
!(<br />
!(<br />
!(<br />
!(<br />
!(<br />
!(<br />
!(<br />
!(<br />
!(<br />
!(<br />
!(<br />
!(<br />
!(<br />
!(<br />
!(<br />
!(<br />
!(<br />
!(<br />
!(<br />
!(<br />
!(<br />
!(<br />
!(<br />
!(<br />
!(<br />
!(<br />
!(<br />
!(<br />
!(<br />
!(<br />
!(<br />
!(<br />
!(<br />
!(<br />
!(<br />
!(<br />
!(<br />
!(<br />
!(<br />
!(<br />
!(<br />
!(<br />
!(<br />
!(<br />
!(<br />
!(<br />
!(<br />
!(<br />
!(<br />
!(<br />
!(<br />
!(<br />
!(<br />
!(<br />
!(<br />
!(<br />
!(<br />
!(<br />
!(<br />
!(<br />
!(<br />
!(<br />
!(<br />
!(<br />
!(<br />
!(<br />
!(<br />
!(<br />
!(<br />
!(<br />
!(<br />
!(<br />
!(<br />
!(<br />
!(<br />
!(<br />
!(<br />
!(<br />
!(<br />
!(<br />
!(<br />
!(<br />
!(<br />
!(<br />
!(<br />
!(<br />
!(<br />
!(<br />
!(<br />
!(<br />
!(<br />
!(<br />
!(<br />
!(<br />
!(<br />
!(<br />
!(<br />
!(<br />
!(<br />
!(<br />
!(<br />
!(<br />
!(<br />
!(<br />
!(<br />
!(<br />
!(<br />
!(<br />
!(<br />
!(<br />
!(<br />
!(<br />
!(<br />
!(<br />
!(<br />
!(<br />
!(<br />
!(<br />
!(<br />
!(<br />
!(<br />
!(<br />
!(<br />
!(<br />
!(<br />
!(<br />
!(<br />
!(<br />
!(<br />
!(<br />
!(<br />
!(<br />
!(<br />
!(<br />
!(<br />
!(<br />
!(<br />
!(<br />
!(<br />
!(<br />
!(<br />
!(<br />
!(<br />
!(<br />
!(<br />
!(<br />
!(<br />
!(<br />
!(<br />
!(<br />
!(<br />
!(<br />
!(<br />
!(<br />
!(<br />
!(<br />
!(<br />
!(<br />
!(<br />
!(<br />
!(<br />
!(<br />
!(<br />
!(<br />
!(<br />
!(<br />
!(<br />
!(<br />
!(<br />
!(<br />
!(<br />
!(<br />
!(<br />
!(<br />
!(<br />
!(<br />
!(<br />
!(<br />
!(<br />
!(<br />
!(<br />
!(<br />
!(<br />
!(<br />
!(<br />
!(<br />
!(<br />
!(<br />
!(<br />
!(<br />
!(<br />
!(<br />
!(<br />
!(<br />
!(<br />
!(<br />
!(<br />
!(<br />
!(<br />
!(<br />
!(<br />
!(<br />
!(<br />
!(<br />
!(<br />
!(<br />
!(<br />
!(<br />
!(<br />
!(<br />
!(<br />
!(<br />
!(<br />
!(<br />
!(<br />
!(<br />
!(<br />
!(<br />
!(<br />
!(<br />
!( !(<br />
!(<br />
!(<br />
!(<br />
!(<br />
!(<br />
!(<br />
!(<br />
!(<br />
!(<br />
!(<br />
!(<br />
!(<br />
!(<br />
!(<br />
!(<br />
!(<br />
!(<br />
!(<br />
!(<br />
!(<br />
!(<br />
!(<br />
!(<br />
!(<br />
!(<br />
!(<br />
!(<br />
!(<br />
!(<br />
!(<br />
!(<br />
!(<br />
!( !(<br />
!(<br />
!( !(<br />
!(<br />
!(<br />
!(<br />
!(<br />
!(<br />
!(<br />
!(<br />
!(<br />
!(<br />
!(<br />
!(<br />
!(<br />
!(<br />
!(<br />
0 50 100 Miles<br />
¯<br />
NH3 =5 mgd<br />
!<br />
WWTP 1-5 mgd<br />
!<br />
County<br />
WWTP 0-1 mgd<br />
!<br />
NH3 1-5 mg/L<br />
!(<br />
!(<br />
Figure 24. Effluent Ammonia of <strong>Municipal</strong> WWTPs in Minnesota<br />
NH3_2005 Annual Average<br />
NH3 5-10 mg/L<br />
NH3 >10 mg/L<br />
!(<br />
!(<br />
Source: Discharge Monitoring Reports, MPCA, 2005.<br />
Not Measured/Data Unavailable<br />
!(
No. of Plants<br />
Total Permitting Design Capacity,<br />
mgd<br />
TM4: WWTP Effluent Quality<br />
<strong>Recycling</strong> <strong>Treated</strong> <strong>Municipal</strong> <strong>Wastewater</strong> <strong>for</strong> <strong>Industrial</strong> <strong>Water</strong> <strong>Use</strong><br />
Craddock Consulting Engineers 21<br />
In Association with CDM & James Crook<br />
TM4-WWTP Eff Quality_0707.doc<br />
500<br />
450<br />
400<br />
350<br />
300<br />
250<br />
200<br />
150<br />
100<br />
50<br />
0<br />
64<br />
22<br />
No. of Facilities 481<br />
< 1 1-5 5-10 >10 not measured<br />
<strong>Municipal</strong> WWTP Annual Average Effluent NH3 (mg/L)<br />
Figure 25. Annual Average Effluent Ammonia, Capacity, and Number of <strong>Municipal</strong><br />
WWTPs in Minnesota<br />
550<br />
500<br />
450<br />
400<br />
350<br />
300<br />
250<br />
200<br />
150<br />
100<br />
50<br />
0<br />
< 1 1-5 5-10 >10 not<br />
measured<br />
<strong>Municipal</strong> WWTP Annual Average Effluent NH3 (mg/L)<br />
Figure 26. Annual Average Effluent Ammonia and Number of <strong>Municipal</strong> WWTPs<br />
in Minnesota<br />
12<br />
4<br />
Total<br />
Capacity>=1 mgd<br />
Capacity
TM4: WWTP Effluent Quality<br />
<strong>Recycling</strong> <strong>Treated</strong> <strong>Municipal</strong> <strong>Wastewater</strong> <strong>for</strong> <strong>Industrial</strong> <strong>Water</strong> <strong>Use</strong><br />
Figure 27. Effluent Ammonia and Number of <strong>Municipal</strong> WWTPs in Minnesota<br />
>10 mg/L,<br />
6.5 mgd<br />
(0.9%)<br />
5-10 mg/L, 24<br />
mgd (3.1%)<br />
1-5 mg/L,<br />
128.5 mgd<br />
(16.8%)<br />
< 1 mg/L, 64 WWTPs (11.0%)<br />
not measured, 139.6 mgd (18.3%)<br />
1-5 mg/L, 22 WWTPs (3.8%)<br />
5-10 mg/L, 12 WWTPs (2.1%)<br />
>10 mg/L, 4 WWTPs (0.7%)<br />
not me a sure d, 481 W W T Ps<br />
(82.5%)<br />
TM4: WWTP Effluent Quality<br />
<strong>Recycling</strong> <strong>Treated</strong> <strong>Municipal</strong> <strong>Wastewater</strong> <strong>for</strong> <strong>Industrial</strong> <strong>Water</strong> <strong>Use</strong><br />
Craddock Consulting Engineers 23<br />
In Association with CDM & James Crook<br />
TM4-WWTP Eff Quality_0707.doc<br />
Fecal Coli<strong>for</strong>ms<br />
Fecal coli<strong>for</strong>ms are commonly used as indicator organisms of pathogenic organisms<br />
found in treated wastewater. The presence of coli<strong>for</strong>m organisms is taken as an<br />
indication that pathogenic organisms may also be present, and the absence of coli<strong>for</strong>m<br />
organisms is taken as an indication that the water is free from disease-producing<br />
organisms. The only constituent regulated by the Cali<strong>for</strong>nia <strong>Water</strong> <strong>Recycling</strong> Criteria<br />
(the regulations Minnesota uses <strong>for</strong> administering permits <strong>for</strong> water reuse) <strong>for</strong><br />
industrial water uses is an indicator organism, total coli<strong>for</strong>ms. For uses that are not<br />
likely to contact humans, the total coli<strong>for</strong>m limit is 23/100 ml. For uses with potential<br />
<strong>for</strong> human contact, the total coli<strong>for</strong>m limit is 2.2/100 ml. Most WWTPs in Minnesota<br />
are permitted to meet a fecal coli<strong>for</strong>m limit of 200. Fecal coli<strong>for</strong>ms are a subset of total<br />
coli<strong>for</strong>ms.<br />
Figure 29 presents the frequency of occurrence of fecal coli<strong>for</strong>ms in the effluent of all<br />
Minnesota WWTPs. Similar in<strong>for</strong>mation is shown in Figure 30 <strong>for</strong> WWTPs with<br />
design capacities greater than 1 mgd. The variability of effluent fecal coli<strong>for</strong>ms is also<br />
characterized <strong>for</strong> the following ranges: 100/100<br />
mL.<br />
The average WWTP effluent fecal coli<strong>for</strong>m concentrations are depicted by location<br />
and facility capacity in Figure 31 and further detailed in Figures 32-35. Minnesota<br />
facilities produce a high quality effluent in terms of fecal coli<strong>for</strong>ms. There were 170<br />
facilities with fecal coli<strong>for</strong>m counts less than 10/100 mL, accounting <strong>for</strong> 150 mgd of<br />
the WWTP capacity in the state. Nearly 300 facilities with a design capacity totaling<br />
535 mgd have effluent fecal coli<strong>for</strong>m concentrations in the 10-100/100 mL range. Over<br />
40 WWTPs, with a combined capacity of 70 mgd, produce an effluent with a fecal<br />
coli<strong>for</strong>m count greater than 100/100 mL.
TM4: WWTP Effluent Quality<br />
<strong>Recycling</strong> <strong>Treated</strong> <strong>Municipal</strong> <strong>Wastewater</strong> <strong>for</strong> <strong>Industrial</strong> <strong>Water</strong> <strong>Use</strong><br />
Frequence of Occurrence, %<br />
Frequency of Occurrence, %<br />
100.0%<br />
80.0%<br />
60.0%<br />
40.0%<br />
20.0%<br />
0.0%<br />
100.0%<br />
80.0%<br />
60.0%<br />
40.0%<br />
20.0%<br />
0.0%<br />
0 1000 2000 3000 4000 5000 6000 7000<br />
Annual Average Concentration (#/100mL)<br />
Figure 29. Effluent Fecal Coli<strong>for</strong>m of <strong>Municipal</strong> WWTPs in Minnesota<br />
0 500 1000 1500 2000 2500 3000 3500<br />
Annual Average Concentration (#/100mL)<br />
Figure 30. Effluent Fecal Coli<strong>for</strong>m of <strong>Municipal</strong> WWTPs Greater than 1 mgd in<br />
Minnesota<br />
24 Craddock Consulting Engineers<br />
In Association with CDM & James Crook<br />
TM4-WWTP Eff Quality_0707.doc
!( !(<br />
!(<br />
!( !( !(<br />
!(<br />
!(<br />
!(<br />
!(<br />
!(<br />
!(<br />
!(<br />
!(<br />
!(<br />
!(<br />
!(<br />
!(<br />
!(<br />
!(<br />
!(<br />
!(<br />
!(<br />
!(<br />
!(<br />
!(<br />
!(<br />
!(<br />
!(<br />
!(<br />
!(<br />
!(<br />
!(<br />
!(<br />
!(<br />
!(<br />
!(<br />
!(<br />
!(<br />
!(<br />
!(<br />
!(<br />
!(<br />
!(<br />
!(<br />
!(<br />
!(<br />
!(<br />
!(<br />
!(<br />
!(<br />
!(<br />
!(<br />
!(<br />
!(<br />
!(<br />
!(<br />
!(<br />
!(<br />
!(<br />
!(<br />
!(<br />
!(<br />
!(<br />
!(<br />
!(<br />
!(<br />
!(<br />
!(<br />
!(<br />
!(<br />
!(<br />
!(<br />
!(<br />
!(<br />
!(<br />
!(<br />
!(<br />
!(<br />
!(<br />
!(<br />
!(<br />
!(<br />
!( !(<br />
!(<br />
!(<br />
!(<br />
!(<br />
!(<br />
!(<br />
!(<br />
!(<br />
!(<br />
!(<br />
!(<br />
!(<br />
!(<br />
!(<br />
!(<br />
!(<br />
!(<br />
!(<br />
!(<br />
!(<br />
!(<br />
!(<br />
!(<br />
!(<br />
!(<br />
!(<br />
!(<br />
!(<br />
!(<br />
!(<br />
!(<br />
!(<br />
!(<br />
!(<br />
!(<br />
!(<br />
!(<br />
!(<br />
!(<br />
!(<br />
!(<br />
!(<br />
!(<br />
!(<br />
!(<br />
!(<br />
!(<br />
!(<br />
!(<br />
!(<br />
!(<br />
!(<br />
!(<br />
!(<br />
!(<br />
!(<br />
!(<br />
!(<br />
!(<br />
!(<br />
!(<br />
!(<br />
!(<br />
!(<br />
!(<br />
!(<br />
!(<br />
!(<br />
!(<br />
!(<br />
!(<br />
!(<br />
!(<br />
!(<br />
!(<br />
!(<br />
!(<br />
!(<br />
!(<br />
!(<br />
!(<br />
!(<br />
!(<br />
!(<br />
!(<br />
!(<br />
!(<br />
!(<br />
!(<br />
!(<br />
!(<br />
!(<br />
!(<br />
!(<br />
!(<br />
!(<br />
!(<br />
!(<br />
!(<br />
!(<br />
!(<br />
!(<br />
!(<br />
!(<br />
!(<br />
!(<br />
!(<br />
!(<br />
!(<br />
!(<br />
!(<br />
!(<br />
!(<br />
!(<br />
!(<br />
!(<br />
!(<br />
!(<br />
!(<br />
!( !(<br />
!(<br />
!(<br />
!(<br />
!(<br />
!(<br />
!(<br />
!(<br />
!(<br />
!(<br />
!(<br />
!(<br />
!(<br />
!(<br />
!(<br />
!(<br />
!(<br />
!(<br />
!(<br />
!(<br />
!(<br />
!(<br />
!(<br />
!(<br />
!(<br />
!(<br />
!(<br />
!(<br />
!(<br />
!(<br />
!(<br />
!(<br />
!(<br />
!(<br />
!(<br />
!(<br />
!(<br />
!(<br />
!(<br />
!(<br />
!(<br />
!(<br />
!(<br />
!(<br />
!(<br />
!(<br />
!(<br />
!(<br />
!(<br />
!(<br />
!(<br />
!(<br />
!(<br />
!(<br />
!(<br />
!(<br />
!(<br />
!(<br />
!(<br />
!(<br />
!(<br />
!(<br />
!(<br />
!(<br />
!(<br />
!(<br />
!(<br />
!(<br />
!(<br />
!(<br />
!(<br />
!(<br />
!(<br />
!(<br />
!(<br />
!(<br />
!(<br />
!(<br />
!(<br />
!(<br />
!(<br />
!(<br />
!(<br />
!(<br />
!(<br />
!(<br />
!(<br />
!(<br />
!(<br />
!(<br />
!(<br />
!(<br />
!(<br />
!(<br />
!(<br />
!(<br />
!(<br />
!(<br />
!(<br />
!(<br />
!(<br />
!(<br />
!(<br />
!(<br />
!(<br />
!(<br />
!(<br />
!(<br />
!(<br />
!(<br />
!(<br />
!(<br />
!(<br />
!(<br />
!(<br />
!(<br />
!(<br />
!(<br />
!(<br />
!(<br />
!(<br />
!(<br />
!(<br />
!(<br />
!(<br />
!(<br />
!(<br />
!(<br />
!(<br />
!(<br />
!(<br />
!(<br />
!(<br />
!(<br />
!(<br />
!(<br />
!(<br />
!(<br />
!(<br />
!(<br />
!(<br />
!(<br />
!(<br />
!(<br />
!(<br />
!(<br />
!(<br />
!(<br />
!(<br />
!(<br />
!(<br />
!(<br />
!(<br />
!(<br />
!(<br />
!(<br />
!(<br />
!(<br />
!(<br />
!(<br />
!(<br />
!(<br />
!(<br />
!(<br />
!(<br />
!(<br />
!(<br />
!(<br />
!(<br />
!(<br />
!(<br />
!(<br />
!(<br />
!(<br />
!(<br />
!(<br />
!(<br />
!(<br />
!(<br />
!(<br />
!(<br />
!(<br />
!(<br />
!(<br />
!(<br />
!(<br />
!(<br />
!(<br />
!(<br />
!(<br />
!(<br />
!(<br />
!(<br />
!(<br />
!(<br />
!(<br />
!(<br />
!(<br />
!(<br />
!(<br />
!(<br />
!(<br />
!(<br />
!(<br />
!(<br />
!(<br />
!(<br />
!(<br />
!(<br />
!(<br />
!(<br />
!(<br />
!(<br />
!(<br />
!(<br />
!(<br />
!(<br />
!(<br />
!(<br />
!(<br />
!(<br />
!(<br />
!(<br />
!(<br />
!(<br />
!(<br />
!(<br />
!(<br />
!(<br />
!(<br />
!(<br />
!(<br />
!(<br />
!(<br />
!(<br />
!(<br />
!(<br />
!(<br />
!(<br />
!(<br />
!(<br />
!(<br />
!(<br />
!(<br />
!(<br />
!(<br />
!(<br />
!(<br />
!(<br />
!(<br />
!(<br />
!(<br />
!(<br />
!(<br />
!(<br />
!(<br />
!(<br />
!(<br />
!(<br />
!(<br />
!(<br />
!(<br />
!(<br />
!(<br />
!(<br />
!(<br />
!(<br />
!(<br />
!(<br />
!(<br />
!(<br />
!(<br />
!(<br />
!(<br />
!(<br />
!(<br />
!(<br />
!(<br />
!(<br />
!(<br />
!(<br />
!(<br />
!(<br />
!(<br />
!(<br />
!(<br />
!(<br />
!(<br />
!(<br />
!(<br />
!(<br />
!(<br />
!(<br />
!(<br />
!(<br />
!(<br />
!(<br />
!(<br />
!(<br />
!(<br />
!(<br />
!(<br />
!(<br />
!(<br />
!(<br />
!(<br />
!(<br />
!(<br />
!(<br />
!(<br />
!(<br />
!(<br />
!(<br />
!(<br />
!(<br />
!(<br />
!(<br />
!(<br />
!(<br />
!(<br />
!(<br />
!(<br />
!(<br />
!(<br />
!( !(<br />
!(<br />
!(<br />
!(<br />
!(<br />
!(<br />
!(<br />
!(<br />
!(<br />
!(<br />
!(<br />
!(<br />
!(<br />
!(<br />
!(<br />
!(<br />
!(<br />
!(<br />
!(<br />
!(<br />
!(<br />
!(<br />
!(<br />
!(<br />
!(<br />
!(<br />
!(<br />
!(<br />
!(<br />
!(<br />
!(<br />
!(<br />
!(<br />
!( !(<br />
!(<br />
!( !(<br />
!(<br />
!(<br />
!(<br />
!(<br />
!(<br />
!(<br />
!(<br />
!(<br />
!(<br />
!(<br />
!(<br />
!(<br />
!(<br />
!(<br />
0 50 100 Miles<br />
¯<br />
Fecal Coli<strong>for</strong>m =5 mgd<br />
! WWTP 1-5 mgd<br />
!<br />
County<br />
WWTP 0-1 mgd<br />
!<br />
Fecal Coli<strong>for</strong>m 10-100/100 mL<br />
!(<br />
!(<br />
Figure 31. Effluent Fecal Coli<strong>for</strong>m of <strong>Municipal</strong> WWTPs in Minnesota<br />
Fecal Coli<strong>for</strong>m - 2005 Annual Average<br />
Fecal Coli<strong>for</strong>m >100 /100 mL<br />
!(<br />
Not Measured/<br />
Data Unavailable<br />
!(<br />
Source: Discharge Monitoring Reports, MPCA, 2005
TM4: WWTP Effluent Quality<br />
<strong>Recycling</strong> <strong>Treated</strong> <strong>Municipal</strong> <strong>Wastewater</strong> <strong>for</strong> <strong>Industrial</strong> <strong>Water</strong> <strong>Use</strong><br />
No. of Plants<br />
Total Permitting Design Capacity, mgd<br />
350<br />
300<br />
250<br />
200<br />
150<br />
100<br />
600<br />
500<br />
400<br />
300<br />
200<br />
100<br />
50<br />
0<br />
0<br />
170<br />
299<br />
No. of Facilities<br />
< 10 10-100 >100 not measured<br />
<strong>Municipal</strong> WWTP Annual Average Effluent Fecal Coli<strong>for</strong>m (#/100 mL)<br />
Figure 32. Annual Average Effluent Fecal Coli<strong>for</strong>m, Capacity, and Number of<br />
<strong>Municipal</strong> WWTPs<br />
< 10 10-100 >100 not measured<br />
<strong>Municipal</strong> WWTP Annual Average Effluent Fecal Coli<strong>for</strong>m<br />
(#/100mL)<br />
Figure 33. Annual Average Effluent Fecal Coli<strong>for</strong>m and Number of <strong>Municipal</strong><br />
WWTPs in Minnesota<br />
26 Craddock Consulting Engineers<br />
In Association with CDM & James Crook<br />
46<br />
68<br />
Total<br />
Capacity>=1 mgd<br />
Capacity
TM4: WWTP Effluent Quality<br />
<strong>Recycling</strong> <strong>Treated</strong> <strong>Municipal</strong> <strong>Wastewater</strong> <strong>for</strong> <strong>Industrial</strong> <strong>Water</strong> <strong>Use</strong><br />
Craddock Consulting Engineers 27<br />
In Association with CDM & James Crook<br />
TM4-WWTP Eff Quality_0707.doc<br />
not measurd, 68 WWTPs (11.7%)<br />
>100/100mL<br />
, 46<br />
WWTPs<br />
(7.9%)<br />
100/100mL,<br />
70.8 mgd<br />
(9.3%)<br />
10-100/100mL, 299 WWTPs (51.3%)<br />
Not measured, 11.4 mgd (1.5%)<br />
TM4: WWTP Effluent Quality<br />
<strong>Recycling</strong> <strong>Treated</strong> <strong>Municipal</strong> <strong>Wastewater</strong> <strong>for</strong> <strong>Industrial</strong> <strong>Water</strong> <strong>Use</strong><br />
3.0 Summary<br />
The majority of the municipal WWTPs in Minnesota produce a good quality<br />
secondary effluent with low nutrient levels (CBOD5 < 5 mg/L, TSS < 5 mg/L, TP < 1<br />
mg/L, NH3 < 5 mg/L, and fecal coli<strong>for</strong>m < 10/100 mL). This provides a good “base<br />
level” water quality <strong>for</strong> supplying reclaimed wastewater from municipalities to<br />
industries. Specific industry water quality requirements will determine if additional<br />
treatment processes will be required. It is most likely that additional disinfection<br />
treatment will be required to meet the total coli<strong>for</strong>m limits required by Minnesota<br />
permitting practices. The majority of plants, particularly the larger WWTPs, will not<br />
need further reduction of organics, particulate solids, and nutrients <strong>for</strong> industrial uses<br />
requiring lower levels of quality or little concern <strong>for</strong> dissolved solid concentrations. If<br />
hardness, dissolved salts, or trace constituents need to be removed, then additional<br />
reduction of organic, suspended solids and nutrients will be required <strong>for</strong> optimum<br />
treatment process per<strong>for</strong>mance.<br />
4.0 References<br />
Minnesota Pollution Control Agency (MPCA). 2005. Minnesota Discharge Monitoring<br />
Report data obtained through the Environmental Data Access system, April 2006.<br />
Refer to: http://www.pca.state.mn.us/data/eda<strong>Water</strong>/index.cfm.<br />
28 Craddock Consulting Engineers<br />
In Association with CDM & James Crook<br />
TM4-WWTP Eff Quality_0707.doc
Craddock Consulting Engineers 1<br />
In Association with CDM & James Crook<br />
TM4-Appendix A_0707.doc<br />
Appendix A Data Analysis Methods<br />
Database <strong>Use</strong>d: MPCA Discharge Monitoring Reports (2003-2005; 2005 focus)<br />
Filenames (as received from MPCA): <strong>Water</strong> Quality Data<br />
(http://www.pca.state.mn.us/data/eda<strong>Water</strong>/index.cfm)<br />
Date data received from MPCA: April 19, 2006<br />
Analysis Approach<br />
Step 1: Import the original MPCA water quality data (in text file <strong>for</strong>mat) into<br />
Microsoft Access.<br />
Step 2: Create queries in the Access database to extract annual maximum,<br />
minimum, and average value of the calendar month average water quality data in<br />
2005 <strong>for</strong> each municipal wastewater treatment facility, discharging to a water<br />
body, in Minnesota. <strong>Water</strong> quality parameters evaluated include CBOD5, TSS,<br />
NH3, P, and fecal coli<strong>for</strong>m.<br />
Step 3: Display average values of effluent quality spatially <strong>for</strong> the state. This<br />
required linking the 2005 water quality data generated from the MS Access query<br />
analysis to the shapefile <strong>for</strong> the wastewater treatment facilities (WWTPs).<br />
Step 4: Generate maps and graphics to characterize average effluent quality of<br />
Minnesota’s municipal WWTPs.<br />
• Evaluate the variability of effluent quality through general statistics<br />
and percentile plots <strong>for</strong> each water quality parameter.<br />
• Determine appropriate ranges to characterize each constituent.<br />
• Create GIS maps that show WWTPs and range of effluent quality.<br />
• Generate bar charts and pie charts to summarize the number of<br />
WWTPs and permitted capacity based on the effluent quality<br />
ranges.
Metropolitan Council<br />
<strong>Recycling</strong> <strong>Treated</strong> <strong>Municipal</strong><br />
<strong>Wastewater</strong> <strong>for</strong> <strong>Industrial</strong> <strong>Water</strong> <strong>Use</strong><br />
LCMR05-07d<br />
MCES Project Number 070186<br />
TECHNICAL MEMORANDUM 5<br />
Stakeholder Input<br />
June 30, 2007<br />
Craddock Consulting Engineers<br />
In Association with<br />
CDM and James Crook
1.0 Introduction<br />
This technical memorandum is the fifth in a series of memoranda developed under a<br />
Metropolitan Council (Council) project titled “<strong>Recycling</strong> <strong>Treated</strong> <strong>Municipal</strong><br />
<strong>Wastewater</strong> <strong>for</strong> <strong>Industrial</strong> <strong>Water</strong> <strong>Use</strong>.” Funding <strong>for</strong> this project was recommended by<br />
the Legislative Commission on Minnesota Resources (LCMR) from the Minnesota<br />
Environment and Natural Resources Trust Fund. The Met Council is providing<br />
additional funding <strong>for</strong> the project through in-kind contributions of staff time. Other<br />
state agencies are participating via stakeholder meetings and technical review and<br />
input.<br />
In addition to technical issues, there are regulatory, legal, and institutional issues such<br />
as funding and fees, agency jurisdictions, ordinances, and public involvement that<br />
must be addressed to successfully implement wastewater recycling programs. To<br />
begin to address the many facets of implementing wastewater recycled projects in<br />
Minnesota, a series of stakeholder meetings were held in conjunction with this study.<br />
There were three stakeholder <strong>for</strong>ums held:<br />
Regulatory<br />
<strong>Industrial</strong><br />
Broader base<br />
This memorandum provides a summary of the meetings and serves to record the<br />
meeting agenda, meeting notes, and relevant handouts.<br />
2.0 Regulatory Meetings<br />
There were two regulatory meetings held early in the project and included<br />
representatives of the MPCA, MDNR, MDH, Dakota County, and Met Council staff<br />
from environmental services. These meetings were used to gain input on the state<br />
agency setting <strong>for</strong> wastewater recycling and how these practices are handled now and<br />
any plans <strong>for</strong> the future. Exhibit A provides the regulatory meeting agendas, meeting<br />
summary notes, and attendance lists.<br />
3.0 Industry Meetings<br />
There were two meetings held with industrial representatives. A total of 11 industries<br />
participated in the workshops with 15 representatives attending. A range of industry<br />
sectors and business sizes were represented. Table 1 lists the industries attending the<br />
two workshops.<br />
The main question addressed was: What issues/concerns does your industry have<br />
with using a recycled wastewater supply? Followup discussions focused on project<br />
elements <strong>for</strong> demonstration projects and any issues the industry might have if looking<br />
to site a new facility. The discussion of issues was segmented into technical issues and<br />
institutional issues. In some cases, issues overlapped these general categories.<br />
Craddock Consulting Engineers 1<br />
In Association with CDM & James Crook<br />
TM5-Stakeholder Input_0707
Table 1. Industry Workshop Attendees<br />
TM6: Stakeholder Input<br />
<strong>Recycling</strong> <strong>Treated</strong> <strong>Municipal</strong> <strong>Wastewater</strong> <strong>for</strong> <strong>Industrial</strong> <strong>Water</strong> <strong>Use</strong><br />
6/14/07<br />
March 8, 2007 March 15, 2007<br />
Great River Energy ADC Telecommunications Inc<br />
Kraemer Mining & Materials, Inc CertainTeed Corporation<br />
Marathon Petroleum Company LLC Fagen Engineering LLC<br />
Rock-Tenn Company Flint Hills Resources LP<br />
Twin City Tanning Co/SB Foot Tanning Co Gopher Resources Corporation<br />
Xcel Energy<br />
Exhibit B provides the industry meeting agendas, meeting summary notes, and<br />
attendance lists.<br />
4.0 Broader Base Meeting<br />
The third <strong>for</strong>um brought together a broader spectrum of stakeholders: the same<br />
regulatory agencies, two industries from the previous meetings (CertainTeed<br />
Corporation and Marathon Petroleum Company), a cross-sector group (Minnesota<br />
Environmental Initiative), wastewater utilities (Mankato and Met Council), and a<br />
representative from the <strong>Water</strong> Utility Council, Minnesota Section, American <strong>Water</strong><br />
Works Association. This group reviewed the outcomes of the previous stakeholder<br />
meetings and discussed next steps to promote wastewater recycling on a broader<br />
scale in Minnesota.<br />
Exhibit C provides the broader base meeting agenda, meeting summary notes, and<br />
attendance list.<br />
4.0 Summary<br />
The general outlook carried from the workshops is that the institutional issues need to<br />
be solved or in the evaluation process be<strong>for</strong>e significant consideration is given to a<br />
recycled wastewater project. While there are certainly some technical issues that must<br />
be resolved and better understood, the meeting participants were confident that<br />
technical solutions could be found. It would be a matter of cost and related benefits<br />
that would dictate the feasibility - if the institutional issues are first addressed.<br />
All participants were encouraged by the interest expressed in the topic of wastewater<br />
recycling. The broader base stakeholder workshop was an important step in bringing<br />
various parties together.<br />
Craddock Consulting Engineers 2<br />
In Association with CDM & James Crook<br />
TM5-Stakeholder Input_0707
Exhibit A<br />
Regulatory Stakeholder Meetings
MCES <strong>Recycling</strong> <strong>Treated</strong> <strong>Wastewater</strong> <strong>for</strong> <strong>Industrial</strong> Reuse Project<br />
Meeting Agenda<br />
Meeting: In<strong>for</strong>mational Meeting-Planning/Regulatory Focus<br />
Meeting No.: ME01 Date: 3/30/06<br />
Location: Mears Park Centre, Rm 1A Time: 1:00 – 3:00 pm<br />
230 E 5 th St. St. Paul<br />
Participants<br />
Claude Anderson MCES Sheila Grow MDH Patti Craddock CCE Team<br />
Bill Cook MCES Bruce Henningsgaard MPCA Jim Crook CCE Team<br />
Chris Elvrum MCES Laurel Reeves MDNR Bob Molzahn CCE Team<br />
Melba Hensel MCES David Sahli MPCA Jen Packer CCE Team<br />
Deborah Manning MCES David Swenson Dakota Co Li Zhang CCE Team<br />
Bryce Pickart MCES<br />
1:00 pm Introductions – Deborah Manning, MCES<br />
1:10 pm Meeting Objectives – Deborah Manning<br />
1:15 pm MCES Direction – Bryce Pickart, MCES<br />
1:25 pm Project Overview & Initial Inquiry – Patti Craddock, Craddock Consulting Engineers<br />
1:40 pm Overview of <strong>Water</strong> Reuse – Jim Crook, Ph.D., P.E.<br />
• Current <strong>Use</strong>s<br />
• <strong>Water</strong> Quality Criteria<br />
• Regulations and Guidelines<br />
• Attributes of a Successful Reuse Program<br />
• Trends in <strong>Water</strong> Reuse<br />
2:15 pm Dialog on Reuse Topics Pertinent to Minnesota – Patti Craddock<br />
2:55 pm Summary – Deborah Manning<br />
• Recap<br />
• Action Items<br />
MCES Project No. 070186 Page 1 of 1<br />
CCE Project No. 06002<br />
CDM Project No. 42588-5085 WWReuse Info Meeting-RegFocus_agenda_033006_final.doc
MCES <strong>Recycling</strong> <strong>Treated</strong> <strong>Wastewater</strong> <strong>for</strong> <strong>Industrial</strong> Reuse Project<br />
Meeting Summary<br />
Meeting: In<strong>for</strong>mational Meeting-Planning/Regulatory Focus<br />
Meeting No.: ME01 Date: 3/30/06<br />
Location: Mears Park Center, Rm 1A Time: 1:00 – 3:00 PM<br />
Attendees:<br />
Name Organization Phone Email<br />
Bryce Pickart MCES 651-602-1091 bryce.pickart@metc.state.mn.us<br />
Deborah Manning MCES 651-602-1114 Deborah.Manning@metc.state.mn.us<br />
Claude Anderson MCES 651-602-8291 claude.anderson@metc.state.mn.us<br />
Bill Cook MCES 651-602-1811 Bill.Cook@metc.state.mn.us<br />
Melba Hensel MCES 651-602-1072 melba.hensel@metc.state.mn.us<br />
Chris Elvrum MCES 651-602-1000 christopher.elvrum@metc.state.mn.us<br />
Shelia Grow MDH 651-201-4692 sheila.grow@health.state.mn.us.<br />
Bruce Henningsgaard MPCA 651-296-6300 bruce.henningsgaard@pca.state.mn.us<br />
Laurel Reeves MDNR 651-296-6157 Laurel.Reeves@dnr.state.mn.us<br />
David Sahli MPCA 651-296-6300 david.sahli@pca.state.mn.us<br />
David Swenson Dakota Co 651-438-4418 David.Swenson@co.dakota.mn.us<br />
Patti Craddock CCE 651-690-0400 pcraddock@craddockconsulting.com<br />
Jim Crook Consultant 781-659-0414 jimcrook@msn.com<br />
Jen Packer CDM 651-772-1313 packerjl@cdm.com<br />
Li Zhang CDM 651-772-1313 zhangl@cdm.com<br />
Bob Molzahn Consultant 651-772-1313 molzahnre@cdm.com<br />
Summary:<br />
1. Introductions – Deborah Manning opened<br />
2. Meeting Objectives – Deborah Manning<br />
Gain broad MCES participation and other stakeholder input in the project.<br />
3. MCES Direction – Bryce Pickart<br />
The project will focus on industrial reuse of reclaimed wastewater on a statewide<br />
basis, with more specific focus given to the metro area. The project will identify<br />
potential industrial customers, evaluate treatment processes required and<br />
estimate the costs associated with providing reclaimed water to industrial users.<br />
The project will also evaluate regulations/ordinances and identify institutional<br />
barriers related to implementation of wastewater reuse.<br />
Project requested by legislator and is funded through the Legislative Commission<br />
on Minnesota Resources (LCMR).<br />
4. Project Overview & Initial Inquiry – Patti Craddock<br />
Refer to presentation slides.<br />
<strong>Industrial</strong> reuse of reclaimed wastewater will be evaluated on three levels (state,<br />
metro area, individual wastewater treatment plants (WWTPs)). Empire will be<br />
one case study of an individual WWTP.<br />
MCES Project No. 070186 Page 1 of 4<br />
CCE Project No. 06002<br />
CDM Project No. 50855
MCES <strong>Recycling</strong> <strong>Treated</strong> <strong>Wastewater</strong> <strong>for</strong> <strong>Industrial</strong> Reuse Project<br />
Meeting Summary<br />
Meeting: In<strong>for</strong>mational Meeting-Planning/Regulatory Focus<br />
Meeting No.: ME01 Date: 3/30/06<br />
Location: Mears Park Center, Rm 1A Time: 1:00 – 3:00 PM<br />
Drivers <strong>for</strong> Reuse in MN:<br />
o Potable water supply availability is becoming an issue in some areas, notably<br />
with planning <strong>for</strong> the next 20-50 years.<br />
o Receiving stream load limitations, under evaluation in the ongoing TMDL<br />
process, may restrict the discharges of some WWTPs.<br />
Initial <strong>Industrial</strong> Cusomer Inventory Results<br />
o Presented bar and pie charts showing 2004 Minnesota general water use and<br />
industrial (9 categories) water use<br />
o Presented state, metro area, and Empire WWTP area maps showing location<br />
of industries, volume of water used (by size of icon), source of water as<br />
surface or ground water, and proximity to WWTPs with capacities greater<br />
than 5 mgd.<br />
5. Overview of <strong>Water</strong> Reuse – James Crook<br />
Refer to presentation slides<br />
The major types of wastewater reuse applications can be categorized as urban,<br />
industrial, agricultural, recreational, habitat restoration/enhancement, ground<br />
water recharge and augmentation of potable supplies.<br />
Treatment technology is dependent on the industrial need and the quality of the<br />
source water. Treatment processes <strong>for</strong> reclaimed wastewater include<br />
coagulation/flocculation, sand filtration, carbon adsorption, membrane processes,<br />
and disinfection. Most recent trend in technologies <strong>for</strong> reuse are with membranes<br />
and UV.<br />
<strong>Industrial</strong> water quality requirements shown <strong>for</strong> several industries including<br />
cooling water and boiler feed water.<br />
Regulations vs. Guidelines – reviewed other states and their reuse regulations.<br />
<strong>Water</strong> Reuse Criteria – reviewed different levels and applications by various<br />
states<br />
o <strong>Water</strong> quality requirements<br />
o Treatment process requirements<br />
o Treatment reliability requirements<br />
o Monitoring requirements<br />
o Operational requirements<br />
o Cross-connection control provisions<br />
o <strong>Use</strong> area controls<br />
Trends in Reuse<br />
6. Dialog on Reuse Topics Pertinent to Minnesota – Deborah Manning<br />
Reuse Involvement<br />
o MPCA:<br />
• Main involvement has been <strong>for</strong> golf course irrigation in MN: no place to<br />
discharge water.<br />
MCES Project No. 070186 Page 2 of 4<br />
CCE Project No. 06002<br />
CDM Project No. 50855
MCES <strong>Recycling</strong> <strong>Treated</strong> <strong>Wastewater</strong> <strong>for</strong> <strong>Industrial</strong> Reuse Project<br />
Meeting Summary<br />
Meeting: In<strong>for</strong>mational Meeting-Planning/Regulatory Focus<br />
Meeting No.: ME01 Date: 3/30/06<br />
Location: Mears Park Center, Rm 1A Time: 1:00 – 3:00 PM<br />
• Involved with Mankato NPDES permit, also one <strong>for</strong> the Shakopee<br />
Mdewakanton Sioux Community (issued by EPA, not MPCA)<br />
• Hennepin Co. Public Works Facility – had no place to discharge<br />
• TMDLS – see reuse as an important option<br />
o MDNR: Previous interaction: to determine if a water appropriation permit is<br />
needed <strong>for</strong> reclaimed water. Possible issues related to funding with the<br />
appropriations.<br />
o MDH: Source water protection is one driver <strong>for</strong> water reuse.<br />
o Dakota County: Interested in reuse of reclaimed water to replenish aquifers<br />
by agricultural irrigation. This is a way to keep water used in the watershed.<br />
o MCES:<br />
• Metro area water sources are being evaluated under another MCES<br />
project: Regional Assessment of <strong>Water</strong> Supply Systems, <strong>Water</strong> Demand,<br />
and Availability and Management Needs. It will provide some additional<br />
data/results to this project <strong>for</strong> metro area water supplies and future<br />
demands.<br />
• Per<strong>for</strong>med literature search on reuse and wrote a white paper.<br />
• Recognize the benefits to municipal wastewater agencies – but need to<br />
keep the focus of the project on industrial reuse. How can reclaimed water<br />
benefit industries, where perhaps location of an industry or growth of an<br />
industry is restricted by water supply.<br />
o Bob Molzahn:<br />
• No water supply issue historically to require a state-perspective on reuse.<br />
• <strong>Water</strong> supply could be an issue in the future. Establishing regulations <strong>for</strong><br />
water reuse now will benefit the implementation of water reuse in the<br />
future.<br />
• In looking at industrial reuse: look to the future and scenarios to promote<br />
industry location and growth with an available water supply nearby.<br />
Sources of Data/Target Areas<br />
o Focus on ethanol plants in the southwestern part of Minnesota where there is<br />
a water supply shortage. Also a high-profile industry right now.<br />
o Mining areas in the north have competing water needs.<br />
o Areas in northwest and southwest of metro area.<br />
Regulations vs. case-by-case<br />
o Threshold to write regulations is uncertain.<br />
o Cali<strong>for</strong>nia & Florida water reuse guideline are good water reuse standards.<br />
o Public involvement is an important factor in the preparation of water reuse<br />
regulation/guidelines.<br />
MCES Project No. 070186 Page 3 of 4<br />
CCE Project No. 06002<br />
CDM Project No. 50855
MCES <strong>Recycling</strong> <strong>Treated</strong> <strong>Wastewater</strong> <strong>for</strong> <strong>Industrial</strong> Reuse Project<br />
Meeting Summary<br />
Meeting: In<strong>for</strong>mational Meeting-Planning/Regulatory Focus<br />
Meeting No.: ME01 Date: 3/30/06<br />
Location: Mears Park Center, Rm 1A Time: 1:00 – 3:00 PM<br />
o Minnesota Department of Health will have input in regulations when water<br />
reuse involves public health issue (e.g., affecting public drinking water supply,<br />
aerosols in spray mists).<br />
o Need to consider notice to solicit, public review periods, etc.<br />
o Issues with large ISTSs occurring now.<br />
o Will come to the <strong>for</strong>efront by legislators – if an issue they’ll be the ones to get<br />
the word out and a call <strong>for</strong> action.<br />
Regional Assessment of Metro Area <strong>Water</strong> Supply Systems: Chris Elvrum<br />
provided a brief overview and schedule <strong>for</strong> the project.<br />
7. Summary<br />
Input from the MCES advisory team and other stakeholders is valuable.<br />
As the project moves on, the project team will be contacting the stakeholders <strong>for</strong><br />
data and comments on the technical memos and the final report.<br />
Next scheduled meeting with stakeholders will be in early 2007. Interim meetings<br />
with the planning/regulatory stakeholders at this meeting may be held, with one<br />
possible in mid-summer.<br />
Decisions:<br />
No major decisions reached. This was an in<strong>for</strong>mational meeting.<br />
MCES Project No. 070186 Page 4 of 4<br />
CCE Project No. 06002<br />
CDM Project No. 50855
<strong>Municipal</strong> <strong>Wastewater</strong> Reuse Regulatory Stakeholder Group<br />
June 12, 2006 2:00 – 3:30 PM<br />
Metropolitan Council<br />
Lower Level Room B, 390 N. Robert Street, St. Paul, MN<br />
Agenda<br />
Introductions, Meeting Purpose, and Agenda Review<br />
Recap of <strong>Treated</strong> <strong>Municipal</strong> <strong>Wastewater</strong> Reuse in MN<br />
Drivers<br />
Existing Applications/Projects<br />
Existing Regulations<br />
Resources from federal government and other states<br />
MN guidelines<br />
Agencies/Institutions with Oversight or Role in Reuse<br />
Mission/goals/roles/jurisdictions<br />
Experience/history with reuse<br />
Approach to dealing with reuse cases and opportunities<br />
Institutional policies/supports/barriers<br />
Is the Regulatory Table Set <strong>for</strong> Fostering <strong>Wastewater</strong> Reuse in MN?<br />
Is the status quo sufficient? What issues need to be addressed that currently<br />
aren’t?<br />
Triggers <strong>for</strong> changing status quo (e.g., moving from guidance to regulations)<br />
Other groups, initiatives, etc. already addressing the issue<br />
Other groups that need to be included or consulted<br />
Examples from other states<br />
What, if anything, additional is required?<br />
Other Issues<br />
<strong>Water</strong> rights<br />
Policies<br />
Local ordinances<br />
Environmental assessment and impact<br />
Public perception/education/involvement<br />
Fee structures
MCES <strong>Recycling</strong> <strong>Treated</strong> <strong>Wastewater</strong> <strong>for</strong> <strong>Industrial</strong> Reuse Project<br />
Meeting Summary<br />
Meeting: <strong>Municipal</strong> <strong>Wastewater</strong> Reuse Regulatory Stakeholder Group<br />
Meeting No.: ME02 Date: 6/12/06<br />
Location: 390 Robert Street, Rm B Lower Level Time: 2:00 – 3:30 PM<br />
Attendees:<br />
Name Organization Phone Email<br />
Bryce Pickart MCES 651-602-1091 bryce.pickart@metc.state.mn.us<br />
Deborah Manning MCES 651-602-1114 Deborah.Manning@metc.state.mn.us<br />
Claude Anderson MCES 651-602-8291 claude.anderson@metc.state.mn.us<br />
Bill Cook MCES 651-602-1811 Bill.Cook@metc.state.mn.us<br />
Melba Hensel MCES 651-602-1072 melba.hensel@metc.state.mn.us<br />
Sara Bertelsen MCES 651-602-1035 sara.bertelsen@metc.state.mn.us<br />
Shelia Grow MDH 651-201-4692 sheila.grow@health.state.mn.us.<br />
Bruce Henningsgaard MPCA 651-296-9289 bruce.henningsgaard@pca.state.mn.us<br />
Laurel Reeves MDNR 651-259-5692 Laurel.Reeves@dnr.state.mn.us<br />
David Sahli MPCA 651-296-8722 david.sahli@pca.state.mn.us<br />
David Swenson Dakota Co 651-438-4418 David.Swenson@co.dakota.mn.us<br />
Patti Craddock CCE 651-690-0400 pcraddock@craddockconsulting.com<br />
Summary:<br />
1. Introductions – Deborah Manning opened<br />
2. Meeting Focus – Deborah Manning<br />
General reuse of treated wastewater effluent.<br />
Broaden the topic from the kickoff meeting which had a focus toward industrial<br />
reuse applications.<br />
Also need to consider reuse in terms of ‘water supply’, not just as a wastewater<br />
discharge option.<br />
3. Recap of <strong>Treated</strong> <strong>Municipal</strong> <strong>Wastewater</strong> Reuse Applications in Minnesota<br />
List of 7 facilities (handout)<br />
o To add: the EPA permitted facility <strong>for</strong> the Shakopee Mdewakanton Sioux<br />
Community,<br />
0.639 mgd<br />
Membrane filtration with UV disinfection<br />
Discharge permitted to a wetland that is used to irrigate the<br />
community’s golf course<br />
o Noted that the list does not include agricultural irrigation practices; these<br />
facilities all have a beneficial end use other than as a discharge <strong>for</strong> treated<br />
wastewater (there are facilities in MN that land discharge, such as with<br />
rapid infiltration basins (RIBs) or to wetlands, which can be considered<br />
reuse applications).<br />
MCES Project No. 070186 Page 1 of 3<br />
CCE Project No. 06002<br />
CDM Project No. 50855
MCES <strong>Recycling</strong> <strong>Treated</strong> <strong>Wastewater</strong> <strong>for</strong> <strong>Industrial</strong> Reuse Project<br />
Meeting Summary<br />
Meeting: <strong>Municipal</strong> <strong>Wastewater</strong> Reuse Regulatory Stakeholder Group<br />
Meeting No.: ME02 Date: 6/12/06<br />
Location: 390 Robert Street, Rm B Lower Level Time: 2:00 – 3:30 PM<br />
Drivers – main driver <strong>for</strong> those on list was to find a suitable discharge <strong>for</strong> the<br />
wastewater; only the Mankato facility had ‘water supply’ as the primary driver,<br />
where Calpine Corporation needed cooling water <strong>for</strong> their new energy facility.<br />
Agency/Institution Roles<br />
o Draft Table – Handout<br />
Lists Agency, Mission/Goals, Role with <strong>Wastewater</strong> Reuse,<br />
Jurisdiction, Approach to Reuse, Issues<br />
Reviewed list and noted other items, such as:<br />
• MPCA: Under Approach to Reuse – note that MN uses the<br />
Cali<strong>for</strong>nia <strong>Recycling</strong> Criteria as basis of water quality criteria<br />
used in NPDES permit; also require under MN Rules that<br />
planning (facility plans) <strong>for</strong> all treatment facilities must<br />
evaluate reuse alternatives.<br />
• MDNR: Noted that there would not be an appropriation fee to<br />
‘reuse’ water <strong>for</strong> most applications. Gray area is with aquifer<br />
recharge applications, where water is reused later by<br />
multiple users.<br />
• MDH: noted that MDH would be involved <strong>for</strong> issues related<br />
to human exposure.<br />
4. Fostering <strong>Wastewater</strong> Reuse in Minnesota<br />
Open discussion on this issue.<br />
Miscellaneous comments provided below.<br />
Groundwater recharge/irrigation<br />
o Groundwater recharge, whether by irrigation or more direct practices, will<br />
benefit local aquifers<br />
o MDH must balance recharge need with source protection; issues arisen<br />
historically in the state<br />
Concern with stormwater basins in wellhead areas<br />
o Issues with agricultural irrigation – wells high in nitrates<br />
o Mechanism to reduce transfer of water outside of local watershed.<br />
Reuse topic has come up at the Metro Area <strong>Water</strong> Supply meetings (MCES<br />
Regional <strong>Water</strong> Supply Assessment Project).<br />
o Some stakeholders are knowledgeable in this area.<br />
o See as a water supply solution.<br />
o Also discussed as a ‘redundant’ supply option.<br />
5. Public Perception<br />
No public comments related to health concerns or water quality issues with<br />
existing reuse projects (through permit process).<br />
MCES Project No. 070186 Page 2 of 3<br />
CCE Project No. 06002<br />
CDM Project No. 50855
MCES <strong>Recycling</strong> <strong>Treated</strong> <strong>Wastewater</strong> <strong>for</strong> <strong>Industrial</strong> Reuse Project<br />
Meeting Summary<br />
Meeting: <strong>Municipal</strong> <strong>Wastewater</strong> Reuse Regulatory Stakeholder Group<br />
Meeting No.: ME02 Date: 6/12/06<br />
Location: 390 Robert Street, Rm B Lower Level Time: 2:00 – 3:30 PM<br />
Not a well-known topic in Minnesota.<br />
<strong>Industrial</strong> sector may need some education in this area. Industries are use to<br />
internally using water, but not ‘reuse’ of water from another supply, like municipal<br />
WWTPs.<br />
6. Other Stakeholders to Involve<br />
Minnesota Environmental Initiative<br />
Minnesota Environmental Partnership<br />
o Over 90 groups<br />
o Help organize groups <strong>for</strong> specific issues<br />
Concurrent project: MCES Regional <strong>Water</strong> Supply Assessment<br />
Southwest and Northwest Metro Area Ground <strong>Water</strong> Groups<br />
Clean <strong>Water</strong> Cabinet<br />
<strong>Industrial</strong><br />
o Mining (iron range)<br />
o Red River Basin Committee (well organized group that had addressed<br />
ground water supply and surface water <strong>for</strong> the watershed)<br />
o Corn Growers (ethanol)<br />
o MEP<br />
o Chamber of Commerce – talk with Mike Robertson<br />
7. Summary<br />
Plan to look to the <strong>Water</strong> Supply Advisory group <strong>for</strong> involvement and tie in the<br />
water supply driver.<br />
Additional meetings with the planning/regulatory stakeholders at this meeting and<br />
an expanded list of stakeholders will be held, with the timing of the meeting(s)<br />
dependent on the other stakeholders that are brought into the project.<br />
Decisions:<br />
No major decisions reached. The intent of this meeting was discussion and in<strong>for</strong>mationsharing.<br />
MCES Project No. 070186 Page 3 of 3<br />
CCE Project No. 06002<br />
CDM Project No. 50855
Exhibit B<br />
Industry Stakeholder Meetings
MCES <strong>Recycling</strong> <strong>Treated</strong> <strong>Wastewater</strong> <strong>for</strong> <strong>Industrial</strong> Reuse Project<br />
Meeting Agenda<br />
Meeting: <strong>Industrial</strong> Stakeholders<br />
Meeting No.: MP03 Date: 3/08/07<br />
Location: Metro 94, Rm 32 South Time: 1:00 – 4:00 pm<br />
455 Etna St Suite 32, St. Paul<br />
1:00 pm Introductions – Deborah Manning, MCES<br />
1:10 pm Meeting Objectives – Deborah Manning<br />
1:15 pm Project Overview – Patti Craddock, Craddock Consulting Engineers<br />
1:25 pm <strong>Water</strong> <strong>Use</strong> Survey – Patti Craddock<br />
1:30 pm Discussion – Bob Matthews, CDM<br />
• Format and Roles<br />
• Questions to Address<br />
What issues/concerns do you have with using a reclaimed water supply?<br />
If you site a new facility, what features would encourage you to use a<br />
reclaimed water supply?<br />
2:30 pm Break<br />
2:40 pm Discussion (Continued)<br />
3:30 pm Q&A – Patti Craddock<br />
3:45 pm Summary – Patti Craddock<br />
• Recap<br />
• Action Items<br />
Adjourn<br />
MCES Project No. 070186 Page 1 of 1<br />
CCE Project No. 06002<br />
CDM Project No. 42588-5085 WWReuse IndustryStakeholderMtg_agenda_030807.doc
<strong>Recycling</strong> <strong>Treated</strong> <strong>Wastewater</strong> For <strong>Industrial</strong> <strong>Water</strong> <strong>Use</strong> in MN<br />
March 8, 2007 Industry Stakeholder Workshop<br />
Issues Table<br />
Technical Issues<br />
Topic Discussion<br />
Reliability • Most industries will require a backup supply; assume can keep existing supply as a backup.<br />
• Envision reclaimed supply <strong>for</strong> a portion of the facility’s water uses; want the flexibility of multiple<br />
supplies.<br />
• Reclaimed water may provide a water supply to areas with groundwater contamination. It is<br />
possible that pumping could be restricted in some areas with contamination and an industry<br />
may not be able to meet their water supply needs with their well system. Reclaimed water<br />
would provide a constant source (emphasizes need <strong>for</strong> multiple supplies or interconnections<br />
between water supply systems in times of emergency).<br />
Pressure • Many industries would want some type of storage facility to provide them the flexibility to meet<br />
various pressure requirements.<br />
• Many have this in their system now and would expect to keep this <strong>for</strong> flexibility.<br />
• There were no specific pressure requirements of concern noted – industries handle this issue<br />
now.<br />
<strong>Water</strong> Quantity • Need detailed in<strong>for</strong>mation on supply availability to understand diurnal, weekly, and seasonal<br />
patterns; previous inquiries with a WWTP by an industry indicated this data was lacking.<br />
• Will there be reservoirs in the system? (depends on demand/supply of specific application;<br />
other states have storage <strong>for</strong> seasonal use [irrigation] and diurnal flow variability)<br />
• Issue: Who owns the water?<br />
o Is it the municipality or the state?<br />
o Who does industry go to <strong>for</strong> appropriation?<br />
o This issue surfaced at the regulatory meeting in Mar06<br />
o Comment from DNR: if water is piped to another entity, there would be no additional<br />
permit process; if the water is put back into the ground or surface water, then a DNR<br />
appropriations permit would be required.<br />
o Need further discussion on this with DNR.<br />
• Industries can also provide a water supply:<br />
o Kraemer Mining quarry reservoirs are currently under evaluation as a municipal water<br />
supply. Looking to provide a water treatment plant.<br />
o Rock Tenn Co discharges good water source as cooling water and is a potential supply.<br />
ExhB-Issues Tables_frMar0807 Ind Stakeh Mtg-FINAL.doc Page 1 of 5
<strong>Recycling</strong> <strong>Treated</strong> <strong>Wastewater</strong> For <strong>Industrial</strong> <strong>Water</strong> <strong>Use</strong> in MN<br />
March 8, 2007 Industry Stakeholder Workshop<br />
Issues Table<br />
Technical Issues<br />
Topic Discussion<br />
o Have industrial discharges been a potential supply source evaluated in the Metro Area<br />
<strong>Water</strong> Supply Master Plan?<br />
• Many industries have reduced water use with internal process changes or with reuse of their<br />
facility’s wastewater effluent.<br />
o In most cases, these internal reuse practices are most cost-effective and should be<br />
evaluated be<strong>for</strong>e looking at a municipal supply.<br />
o The survey and related project inquiry identified industries recycling treated wastewater<br />
from their WWTP as a water supply <strong>for</strong> other uses at their facility.<br />
<strong>Water</strong> Quality • Need better in<strong>for</strong>mation on water quality <strong>for</strong> constituents not sampled <strong>for</strong> NPDES permit.<br />
o Found data lacking on chlorides in evaluating a supply <strong>for</strong> cooling water.<br />
o Need a year of data to evaluate seasonal changes; recommend at least 5 years of data.<br />
o Need to have adequate sample size to characterize the variability in constituents within<br />
and in different seasons.<br />
• Need to know fluctuations in quality to adequately adjust industrial process.<br />
• Prefer a source with consistency or at least enough in<strong>for</strong>mation about variability and when to<br />
expect changes, to adjust industrial processes. Need a warning system <strong>for</strong> abrupt quality<br />
changes.<br />
• Concern with pathogens and public perception.<br />
• “<strong>Water</strong> is water” – know how to treat it, just need to have adequate in<strong>for</strong>mation to know what<br />
treatment is needed and make the right business decision.<br />
• Industries already pretreating water had no problems continuing this practice; those not<br />
pretreating the water might consider it, but some may not have the facility space or staff to<br />
handle new treatment requirements. Reclaimed water is a less desirable water supply option if<br />
it adds to the process needs of a facility.<br />
ExhB-Issues Tables_frMar0807 Ind Stakeh Mtg-FINAL.doc Page 2 of 5
Institutional Issues<br />
Topic Discussion<br />
Agreement<br />
Terms<br />
<strong>Recycling</strong> <strong>Treated</strong> <strong>Wastewater</strong> For <strong>Industrial</strong> <strong>Water</strong> <strong>Use</strong> in MN<br />
March 8, 2007 Industry Stakeholder Workshop<br />
Issues Table<br />
• Term (years) of appropriation can be longer <strong>for</strong> water reuse than existing water supplies to<br />
make it a more attractive source.<br />
• Provide automatic permit renewal <strong>for</strong> DNR appropriation permit if using reclaimed water (one<br />
less permitting task).<br />
• Multiple purposes of reclaimed water could be brought into the agreement process. Discussed<br />
added benefits of nutrients <strong>for</strong> agricultural irrigation practices.<br />
Price and Fees • Cost to treat must be justifiable; need facility planning studies.<br />
• See water reuse as “the right thing to do” – environmental stewardship should factor into the<br />
financial analysis.<br />
• Financial incentives – will encourage industries to investigate water reuse options.<br />
• Consider a pollution tax credit – no sales tax on effluent reuse project equipment. Similar to<br />
previous program in MN.<br />
• Need more in<strong>for</strong>mation to demonstrate that water reuse is economically viable.<br />
• Who invests in the pipeline and treatment facilities?<br />
• Does it make business sense? Is it economically viable?<br />
• Cost-sharing: Who, how, what jurisdictional structures?<br />
• Environmental stewardship should be factored into economics – do not want industries<br />
punished <strong>for</strong> doing their part in water conservation.<br />
Regulations • The regulatory requirements <strong>for</strong> water reuse should reward the environmental stewardship of<br />
participating entities and not excessively add to the permitting process.<br />
o Regulations should not be a ‘disincentive’ to using reclaimed water.<br />
• Initial inquiries into using reclaimed water indicate that many permit requirements are added to<br />
the industry’s NPDES permit – <strong>for</strong> constituents that are currently met by the WWTP.<br />
• The case-by-case basis used by MN:<br />
o Provides uncertainty at the planning level stages on what will be required.<br />
o Limits/requirements could change once planning and design have started.<br />
ExhB-Issues Tables_frMar0807 Ind Stakeh Mtg-FINAL.doc Page 3 of 5
Institutional Issues<br />
Topic Discussion<br />
Liability/<br />
Indemnification<br />
Environmental<br />
Stewardship<br />
Public<br />
Education<br />
Demonstration<br />
Project<br />
<strong>Recycling</strong> <strong>Treated</strong> <strong>Wastewater</strong> For <strong>Industrial</strong> <strong>Water</strong> <strong>Use</strong> in MN<br />
March 8, 2007 Industry Stakeholder Workshop<br />
Issues Table<br />
• If a quality issue causes a health problem – who is liable?<br />
• Industry concerned with taking responsibility <strong>for</strong> a contaminant measured in their effluent that is<br />
from the reclaimed supply – who is at fault <strong>for</strong> a possible violation or health risk?<br />
• Have other states seen problems with contaminants in the reclaimed supply that are<br />
discharged by the industry? (No – just a public perception)<br />
• <strong>Water</strong> reuse is the “right thing to do”<br />
• Consider an award category <strong>for</strong> water reuse to acknowledge industries.<br />
• Need a consistent message from the regulatory community.<br />
o <strong>Water</strong> conservation/resource protection versus public perceptions related to health.<br />
• Need to link environmental stewardship to the regulatory policy and structure – “don’t make it<br />
hard to do the right thing”<br />
• Public education seen as critical to success of reuse projects.<br />
• Need a public education program which includes data about a specific reuse application<br />
(appropriate sampling and measurement to show an application is meeting all regs and<br />
environmental indices).<br />
• See the need <strong>for</strong> education up-front to support the concept so when it is time to implement<br />
there are no obstacles.<br />
• Do not want to begin a capital planning process if public outcry is going to kill it.<br />
• What is a demonstration project? Is this to demonstrate technology, regulatory process, public<br />
education element? (Answer: any or all of the above).<br />
• The implementation issues of a reuse project would be an important focus of a demonstration<br />
project.<br />
o Document and explore the regulatory aspects, public education ef<strong>for</strong>ts and results, data<br />
needs at various levels of project planning through construction.<br />
o Several participants thought the institutional issue inquiry is more important than the<br />
technical or treatment technologies – since the technology-related projects would be a<br />
very site specific applications.<br />
• Better wastewater effluent characterization could be an element of a demonstration project or a<br />
separate project to document characteristics <strong>for</strong> various areas or select WWTPs.<br />
• Demonstration project would be a partnership of various entities to ‘walk hand-in-hand’ through<br />
the planning and implementation process.<br />
ExhB-Issues Tables_frMar0807 Ind Stakeh Mtg-FINAL.doc Page 4 of 5
Institutional Issues<br />
Topic Discussion<br />
Summary/Misc<br />
Comments<br />
<strong>Recycling</strong> <strong>Treated</strong> <strong>Wastewater</strong> For <strong>Industrial</strong> <strong>Water</strong> <strong>Use</strong> in MN<br />
March 8, 2007 Industry Stakeholder Workshop<br />
Issues Table<br />
• If we can address the issues identified in this meeting, then water reuse is a viable water<br />
supply option <strong>for</strong> some industries.<br />
• The larger hurdles are the institutional issues not the technical ones.<br />
ExhB-Issues Tables_frMar0807 Ind Stakeh Mtg-FINAL.doc Page 5 of 5
MCES <strong>Recycling</strong> <strong>Treated</strong> <strong>Wastewater</strong> <strong>for</strong> <strong>Industrial</strong> Reuse Project<br />
Meeting Agenda<br />
Meeting: <strong>Industrial</strong> Stakeholders<br />
Meeting No.: MP04 Date: 3/15/07<br />
Location: 390 North Robert St Time: 1:00 – 4:00 pm<br />
St. Paul, MN 55101 RM LLB<br />
1:00 pm Introductions – Deborah Manning, MCES<br />
1:10 pm Meeting Objectives – Deborah Manning<br />
1:15 pm Project Overview – Patti Craddock, Craddock Consulting Engineers<br />
1:25 pm <strong>Water</strong> <strong>Use</strong> Survey – Patti Craddock<br />
1:30 pm Discussion – Patti Craddock<br />
• Format and Roles<br />
• Questions to Address<br />
What issues/concerns do you have with using a reclaimed water supply?<br />
What issues should be the focus of a demonstration project?<br />
2:30 pm Break<br />
2:40 pm Discussion (Continued)<br />
3:30 pm Q&A<br />
3:45 pm Summary<br />
• Recap<br />
• Action Items<br />
Adjourn<br />
MCES Project No. 070186 Page 1 of 1<br />
CCE Project No. 06002<br />
CDM Project No. 42588-5085 WWReuse IndustryStakeholderMtg_agenda_031507.doc
<strong>Recycling</strong> <strong>Treated</strong> <strong>Wastewater</strong> For <strong>Industrial</strong> <strong>Water</strong> <strong>Use</strong> in MN<br />
March 15, 2007 Industry Stakeholder Workshop<br />
Issues Table<br />
Technical Issues<br />
Topic Discussion<br />
Reliability • Concerned about control of water quality and quantity<br />
o Industries perceive they have that control now<br />
o Relates to their per<strong>for</strong>mance<br />
• How will seasonal quantity requirements be addressed?<br />
• Expect to have some source as a backup<br />
o Maintaining a backup supply has a cost<br />
Need to exercise equipment and maintain pipes<br />
Maintain intakes and other features<br />
Need to account <strong>for</strong> this in a facility analysis<br />
o Will there be permit changes <strong>for</strong> the backup supply?<br />
Could affect both NPDES and Appropriations permits<br />
Ex: some permits have flow-based restrictions that will trigger requirements.<br />
• If a reclaimed supply is not available and a backup supply must be used<br />
and the amount/quality exceeds a permit limit or requirement – who pays<br />
the penalty or the extra costs to meet the permit limit (which would not<br />
have been incurred if the reclaimed supply had been available)?<br />
o If backup supply is used – need to handle two different source waters and the quality<br />
differences<br />
o Could reduce the storage requirements if another supply is used to augment rather than<br />
just backup a reclaimed supply<br />
Need to assess the quality issues with a blended supply<br />
Need to assess the infrastructure requirements (piping, valving, painting and<br />
signage) and costs <strong>for</strong> a specific application<br />
• Reclaimed supply can also be a backup to the main supply (emergency source if the ground or<br />
surface water supply has a contamination – comment brought in from March 8 meeting)<br />
• Who handles the maintenance, particularly of the transmission mains? Will the municipality<br />
have access?<br />
ExhB-Issues Tables_frMar1507 Ind Stakeh Mtg-FINAL.doc Page 1 of 7
<strong>Recycling</strong> <strong>Treated</strong> <strong>Wastewater</strong> For <strong>Industrial</strong> <strong>Water</strong> <strong>Use</strong> in MN<br />
March 15, 2007 Industry Stakeholder Workshop<br />
Issues Table<br />
Technical Issues<br />
Topic Discussion<br />
Pressure • No specific issues identified. Recognize the need to have infrastructure and industry facilities to<br />
meet pressure needs <strong>for</strong> a specific facility.<br />
<strong>Water</strong> Quantity • Relationships of water demand and reclaimed supply in Minnesota.<br />
o Location of larger water users not often near a WWTP or a municipality large enough to<br />
produce a reclaimed supply.<br />
o Proximity of industries and WWTPs not a good fit <strong>for</strong> large facilities (NIMBY).<br />
o In some areas, low flow periods <strong>for</strong> WWTP may be when there is greater demand. For<br />
example, during dry summers, when urban water uses are higher, the wastewater flows<br />
are lower (less influence from storm events).<br />
• Question to Industry: Would you accept an agreement to use a certain amount of water?<br />
o No – <strong>for</strong> industries with production dependent on economic cycles<br />
o Yes – <strong>for</strong> those with very consistent water uses; but would weigh any economic benefits<br />
to a base amount vs the risk of not using the agreed amount<br />
<strong>Water</strong> Quality • Will reuse water bring in metals/other constituents that will cause the industry to exceed<br />
pretreatment or NPDES permit limits?<br />
o Need sampling on influent to industry <strong>for</strong> all parameters in the pretreatment permit<br />
o Likewise <strong>for</strong> any NPDES permits<br />
o This could be done at the exit to the WWTP to alleviate industry from burden of<br />
sampling; however, need assurance to protocol, etc.<br />
o Noted that the federal pretreatment standards apply to the process stream of an<br />
industry, so may not be an issue <strong>for</strong> the discharge stream to the sewer<br />
o Could there be some type of waiver if an industry uses reclaimed water?<br />
• Want to know how uni<strong>for</strong>m the water quality is and will there be a warning if quality changes.<br />
• Need analytical consistency: understand timing of sampling between WWTP and industry.<br />
Need in<strong>for</strong>mation to make process decisions in a timely manner and not affect quality of<br />
product and effluent limits.<br />
• As part of the permitting process, need to evaluate if an industry can move or with a new<br />
industry, discharge back to the WWTP versus having own discharge (NPDES permit)<br />
o Provides more control in permitting process if agency supplying reclaimed water is<br />
receiving industry discharge<br />
ExhB-Issues Tables_frMar1507 Ind Stakeh Mtg-FINAL.doc Page 2 of 7
<strong>Recycling</strong> <strong>Treated</strong> <strong>Wastewater</strong> For <strong>Industrial</strong> <strong>Water</strong> <strong>Use</strong> in MN<br />
March 15, 2007 Industry Stakeholder Workshop<br />
Issues Table<br />
Technical Issues<br />
Topic Discussion<br />
o Mankato-Calpine discussed as an example<br />
• Using a reclaimed supply can result in transfer of pollutants to other watersheds or to different<br />
stream segments of a watershed<br />
o What are the implications of this transfer on the TMDL process?<br />
o What impact will this have on NPDES permits?<br />
o While there are multiple pollutants that could be involved, mercury is one example that<br />
was discussed.<br />
• Source water quality can affect some facilities from meeting their NPDES permits. For<br />
example, during low-flow periods there are TDS requirements. If the TDS of the source water<br />
coming in is too high, it may not be a concern <strong>for</strong> the industry’s process, but could be a<br />
problem <strong>for</strong> the discharge permit.<br />
• Temperature and cooling water: if reclaimed water is warmer than an existing supply, then it<br />
could result in warmer water being discharged and negatively impact the receiving water.<br />
• Need to prepare <strong>for</strong> situation where a WWTP has a process upset – results in catastrophic<br />
failure of the industry’s equipment and service<br />
o How are damages handled?<br />
o How is lost production handled?<br />
ExhB-Issues Tables_frMar1507 Ind Stakeh Mtg-FINAL.doc Page 3 of 7
Institutional Issues<br />
Topic Discussion<br />
Agreement<br />
Terms<br />
• Key item is liability<br />
<strong>Recycling</strong> <strong>Treated</strong> <strong>Wastewater</strong> For <strong>Industrial</strong> <strong>Water</strong> <strong>Use</strong> in MN<br />
March 15, 2007 Industry Stakeholder Workshop<br />
Issues Table<br />
Price and Fees • Initial project/task is needed to evaluate funding sources and incentives <strong>for</strong> both industry and<br />
municipality<br />
o need capital to make changes in a facility to have new water system piping and related<br />
appurtenances<br />
o while municipalities can bond <strong>for</strong> capital projects, need to plan now and without<br />
assurances that implementation hurdles can be overcome, it may delay or keep a water<br />
reuse project from occurring<br />
• Recognized that cost is a factor, but at this point need to handle other issues.<br />
• Incentives and funding <strong>for</strong> initial projects were seen as an important feature in getting reuse<br />
applications going in Minnesota.<br />
Regulations • Case-by-case permitting process was viewed by some industries as preferable.<br />
o The flexibility provided the ability to handle specific quantity and quality issues <strong>for</strong> each<br />
industry.<br />
o Better to build a knowledge base using a case-by-case approach prior to setting overall<br />
standards.<br />
• What agencies will be involved in the permitting process?<br />
• Who will decide whether an industrial water use is contact on non-contact (human)?<br />
o Likely MDH will be involved in this determination<br />
• Issue of pollutant transfer in the watershed(s) is one discussed under water quality and also a<br />
topic <strong>for</strong> overall environmental protection.<br />
Liability/<br />
Indemnification<br />
• See water quality discussion <strong>for</strong> link to regulatory considerations<br />
• Need to evaluate if legislation is necessary to address the issue of liability <strong>for</strong> a municipal entity<br />
supplying reclaimed water.<br />
o Can a government agency accept the liability?<br />
o The liability issue was considered to be above an agreement level and applicable to<br />
state liability laws.<br />
ExhB-Issues Tables_frMar1507 Ind Stakeh Mtg-FINAL.doc Page 4 of 7
<strong>Recycling</strong> <strong>Treated</strong> <strong>Wastewater</strong> For <strong>Industrial</strong> <strong>Water</strong> <strong>Use</strong> in MN<br />
March 15, 2007 Industry Stakeholder Workshop<br />
Issues Table<br />
Institutional Issues<br />
Topic Discussion<br />
o Would be difficult <strong>for</strong> private sector to enter an agreement without liability being<br />
addressed.<br />
o Main issues:<br />
If there is a public health problem that is related to the reclaimed water – who is<br />
at fault?<br />
If the industry has damage or loss of production because of the water quality or<br />
quantity – how is lost revenue to be paid?<br />
If a discharge or pretreatment permit is violated and it is related to the reclaimed<br />
water – who pays penalty, how is fault decided?<br />
o How do different states handle the liability laws?<br />
Environmental<br />
Stewardship<br />
Public<br />
Education<br />
Demonstration<br />
Project<br />
• Are there liability issues with the transmission mains? Who’s right-of-way?<br />
• Interest in a reclaimed water supply at this stage is motivated by the environmental benefits<br />
and not <strong>for</strong> technical and cost reasons. While costs and institutional factors may drive a<br />
decision to use a reclaimed supply, the initial interest is the ‘bigger picture’ view of water<br />
resource protection.<br />
• Recognize the need to educate public; also employees at facilities using reclaimed water.<br />
• Evaluate specific processes to demonstrate human health safety <strong>for</strong> workers and local<br />
community residents.<br />
• Evaluate the implementation process of a water reuse project to identify hurdles and<br />
participation requirements of various state, municipal, and private entities, including the general<br />
public. Envision a team of participants that walks through the process together.<br />
• Evaluate industries where water supply is an issue. This will provide focus to technologies <strong>for</strong><br />
specific source water in areas with most benefit to water supply conservation.<br />
• Further definition of institutional issues that must be addressed in a water reuse project.<br />
o Range of institutional issues including regulatory permitting process, public education,<br />
liability, user agreements.<br />
o Specifically address role of agencies and industry in determining regulatory limits and<br />
which category specific water uses fall under.<br />
ExhB-Issues Tables_frMar1507 Ind Stakeh Mtg-FINAL.doc Page 5 of 7
<strong>Recycling</strong> <strong>Treated</strong> <strong>Wastewater</strong> For <strong>Industrial</strong> <strong>Water</strong> <strong>Use</strong> in MN<br />
March 15, 2007 Industry Stakeholder Workshop<br />
Issues Table<br />
Institutional Issues<br />
Topic Discussion<br />
o Specifically address the risks/unknowns<br />
How to set up an agreement to handle risks?<br />
What happens if the water reuse system does not per<strong>for</strong>m as agreed?<br />
• Establish a multi-agency group to foster water reuse projects.<br />
o This group could promote demonstration projects and be affiliated with the review of<br />
demonstration projects.<br />
o Review and identify funding sources and incentives <strong>for</strong> reuse projects.<br />
o This group could have a liason associated with related groups in the state such as the<br />
Metropolitan Area <strong>Water</strong> Supply Advisory Committee, Ethanol team established by<br />
MPCA, and others<br />
• Evaluate specific facility modifications required to retrofit an existing supply (potable, well, or<br />
surface water source) to a reclaimed supply.<br />
• One component of a project should include education of facility personnel on water reuse.<br />
o Need to understand processes in place to minimize health risks.<br />
o Educate employees on a reclaimed water source at their facility, the piping design<br />
requirements, operational considerations, and maintenance to keep it a safe supply.<br />
• Recognize that there are a multitude of industries with potential uses – could target one case<br />
study that would handle issues common to all (such as the institutional) and technical issues<br />
that would benefit a cross-section of industries.<br />
• Possible funding source <strong>for</strong> demonstration projects or studies to evaluate reuse applications is<br />
a SEP, supplemental environmental project. Most permittees would rather put penalty money<br />
to a good use, with added benefit to their watershed.<br />
Miscellaneous • <strong>Water</strong> discharge versus energy use – this is a topic <strong>for</strong> areas with limited receiving waters that<br />
require zero discharge.<br />
o Some facilities must evaporate and use energy to do this. See tradeoff to the<br />
environment <strong>for</strong> more energy use and related pollutants to those discharged to a water<br />
body.<br />
o <strong>Water</strong> reclamation could offer options to facilities on a specific receiving stream with no<br />
discharge allowed and look to minimize energy use.<br />
ExhB-Issues Tables_frMar1507 Ind Stakeh Mtg-FINAL.doc Page 6 of 7
<strong>Recycling</strong> <strong>Treated</strong> <strong>Wastewater</strong> For <strong>Industrial</strong> <strong>Water</strong> <strong>Use</strong> in MN<br />
March 15, 2007 Industry Stakeholder Workshop<br />
Issues Table<br />
Institutional Issues<br />
Topic Discussion<br />
• Question: Why is MCES evaluating water reuse?<br />
o Protection of water resources<br />
To sustain water supplies - keep potable supplies available <strong>for</strong> potable uses.<br />
To meet water quality goals established <strong>for</strong> Minnesota’s waters – reduced<br />
discharges is one option to meet more stringent discharge limits in the future.<br />
o Requested by the legislature<br />
State-wide evaluation<br />
Metro area focus particularly with access to resources and data <strong>for</strong> metro area<br />
facilities and industries.<br />
• This question promoted discussion of industries using a reclaimed supply – extent of the<br />
benefit.<br />
o Need a consumption of a water supply by an industry to provide benefit to a receiving<br />
stream in terms of reduced pollutant loadings<br />
For facilities using once-through cooling, taking river water and discharging it<br />
back to the river – there is limited benefit to the receiving stream.<br />
However, if the surface water source has limited withdrawals, then replacing the<br />
surface water supply with a reclaimed supply can benefit the waterway with<br />
sustained flows/lake or reservoir levels.<br />
o Replacing a ground water supply with reclaimed water conserves the potable supply,<br />
regardless if the water is consumed by industry operations.<br />
• Reclaimed water can be a competitor to water utilities, particularly those with excess capacity.<br />
ExhB-Issues Tables_frMar1507 Ind Stakeh Mtg-FINAL.doc Page 7 of 7
Industry Stakeholder Workshop Attendance<br />
MCES <strong>Recycling</strong> <strong>Treated</strong> <strong>Wastewater</strong> <strong>for</strong> <strong>Industrial</strong> <strong>Water</strong> <strong>Use</strong><br />
Person Organization Person Organization<br />
Sara Wilson Kraemer Mining & Materials, Inc Sue Newton ADC Telecommunications Inc<br />
Dennis Taylor Great River Energy John Kimble Certainteed Corporation<br />
Herbie Owen Marathon Ashland Petroleum LLC Pete Anderson Certainteed Corporation<br />
Joe Strukel Rock-Tenn Company Mike Rutledge Fagen Engineering LLC<br />
Travis Richins Rock-Tenn Company Mike Falk Flint Hills Resources LP<br />
Brian West Rock-Tenn Company Wayne Duerfeldt Gopher Resources Corporation<br />
John Smith Twin City Tanning Co/SB Foot Tanning Co Patrick Flowers Xcel Energy<br />
Deborah Manning MCES Jeff Berrington Xcel Energy<br />
Bill Cook MCES Deborah Manning MCES<br />
Melba Hensel MCES Melba Hensel MCES<br />
Claude Anderson MCES Claude Anderson MCES<br />
Bob Pohlman MCES Bob Pohlman MCES<br />
Patti Craddock CCE Patti Craddock CCE<br />
Bob Matthews CDM<br />
Li Zhang CDM<br />
March 8, 2007 Meeting<br />
March 15, 2007 Meeting
Exhibit C<br />
Broader Base Stakeholder Meeting
MCES <strong>Recycling</strong> <strong>Treated</strong> <strong>Wastewater</strong> <strong>for</strong> <strong>Industrial</strong> Reuse Project<br />
Meeting Agenda<br />
Meeting: <strong>Water</strong> Reuse Stakeholder<br />
Meeting No.: MP05 Date: 4/24/07<br />
Location: Metro 94, Rm 32 Time: 1:00 – 3:30 pm<br />
455 Etna St Suite 32, St. Paul<br />
1:00 pm Introductions – Deborah Manning, MCES<br />
1:05 pm Meeting Objectives – Deborah Manning<br />
1:10 pm Project Overview – Patti Craddock, Craddock Consulting Engineers<br />
1:15 pm Discussion: <strong>Water</strong> Reuse Implementation Considerations – Patti Craddock<br />
• Environmental Stewardship (complete by 1:30 pm)<br />
• Regulatory Leadership (complete by 1:55 pm)<br />
• Liability (complete by 2:10 pm)<br />
• Partnered Project (complete by 2:25 pm)<br />
2:25 pm Break – 10 minutes<br />
• Economic Incentives (complete by 2:50 pm)<br />
• Supply Issues (complete by 3:15 pm)<br />
3:15 pm Q&A – Patti Craddock<br />
3:25 pm Summary – Deborah Manning<br />
• Recap<br />
• Action Items<br />
3:30 pm Adjourn<br />
MCES Project No. 070186 Page 1 of 1<br />
CCE Project No. 06002<br />
CDM Project No. 42588-5085 <strong>Water</strong> Reuse StakeholderMtg_agenda_042407.doc
<strong>Recycling</strong> <strong>Treated</strong> <strong>Wastewater</strong> For <strong>Industrial</strong> <strong>Water</strong> <strong>Use</strong> in Minnesota<br />
MCES Project 070186 / LCMR 05-07d<br />
4/24/07<br />
<strong>Water</strong> Reuse <strong>for</strong> Minnesota Industries – Implementation Considerations<br />
Discussion with Stakeholders, April 24, 2007<br />
Topic Key Points Potential Actions<br />
Environmental<br />
Stewardship<br />
Regulatory<br />
Leadership<br />
• <strong>Water</strong> reuse <strong>for</strong> many industries will be driven<br />
by their commitment to sustainable resources.<br />
• Approval and Permitting Process: The<br />
regulatory requirements and permitting<br />
process should encourage industries and<br />
municipalities to pursue water reuse.<br />
• <strong>Water</strong> Reuse Image: Recognition that this is<br />
a practice the state encourages <strong>for</strong> water<br />
resource protection.<br />
• <strong>Water</strong>shed Transfer of Pollutants: Address<br />
pollutant transfer in the TMDL process and<br />
NPDES permitting.<br />
• Appropriations Permit: Clarify the need <strong>for</strong> a<br />
DNR Appropriations Permit.<br />
Liability • Industries need to be assured they are not<br />
taking on undue liability with the use of a<br />
reclaimed supply. There is concern <strong>for</strong> facility<br />
damages/loss of production, permit violations,<br />
and health problems associated with using a<br />
reclaimed supply.<br />
• Establish an award program <strong>for</strong> water reuse.<br />
• Evaluate existing award programs and how<br />
water reuse practices would fit under these<br />
programs.<br />
• Support a public education/outreach ef<strong>for</strong>t<br />
linking water reuse to environmental<br />
stewardship and sustainability.<br />
• Establish a regulatory ‘water reuse group’ with<br />
individuals as the key point of contact <strong>for</strong> each<br />
agency involved in establishing a permit to<br />
provide and use a reclaimed water supply.<br />
• The water reuse group or a subcommittee will<br />
engage in a partnered project that<br />
recommends regulatory topics <strong>for</strong> further<br />
evaluation.<br />
• Provide fact sheets and other guidance<br />
documents <strong>for</strong> municipalities and industries to<br />
reference as they consider water reuse<br />
applications, to include:<br />
o Related permits required<br />
o State agency approvals required<br />
• Other in<strong>for</strong>mation as deemed necessary<br />
• Establish a group or fund a project to resolve<br />
the liability and indemnification issues of water<br />
reuse applications.<br />
Exh C-<strong>Water</strong> Reuse Implementation Consid&Recomm Table-short_042407.doc Page 1 of 3
<strong>Recycling</strong> <strong>Treated</strong> <strong>Wastewater</strong> For <strong>Industrial</strong> <strong>Water</strong> <strong>Use</strong> in Minnesota<br />
MCES Project 070186 / LCMR 05-07d<br />
4/24/07<br />
<strong>Water</strong> Reuse <strong>for</strong> Minnesota Industries – Implementation Considerations<br />
Discussion with Stakeholders, April 24, 2007<br />
Topic Key Points Potential Actions<br />
Partnered Project • Projects initiated, reviewed and documented<br />
by the various stakeholders will provide a<br />
resource that will encourage water reuse<br />
practices.<br />
Economic<br />
Incentives<br />
• Incentives are needed to attract industries to<br />
use a reclaimed supply and municipalities to<br />
incorporate reuse in their WWTP practices.<br />
• <strong>Water</strong> reuse systems can be funded and<br />
operated by a variety of management<br />
structures – different options should be<br />
considered to provide the best incentives and<br />
optimize system costs.<br />
• Identify regulatory, industry, municipal<br />
wastewater utility, water utility, local community<br />
groups, and other partners to <strong>for</strong>m a working<br />
group that is involved with the project(s). This<br />
group would walk “hand-in-hand” through the<br />
project and provide review and assessment of<br />
the project upon completion.<br />
• Projects can be case studies of the complete<br />
project process or focus on key features of<br />
water reuse projects, such as: public<br />
in<strong>for</strong>mation programs, specific technologies, or<br />
regulatory guidelines.<br />
• Evaluate and promote the use of the<br />
Supplemental Environmental Project (SEP)<br />
program as a source of money <strong>for</strong> water reuse<br />
projects.<br />
• Recommend state grants (LCMR) <strong>for</strong> initiation<br />
projects with in-kind contributions by partnering<br />
entities.<br />
• Evaluate SRF project selection process to<br />
identify features that would encourage water<br />
reuse projects.<br />
• Consider a pollution tax credit <strong>for</strong> equipment<br />
used in a water reuse project.<br />
Exh C-<strong>Water</strong> Reuse Implementation Consid&Recomm Table-short_042407.doc Page 2 of 3
<strong>Recycling</strong> <strong>Treated</strong> <strong>Wastewater</strong> For <strong>Industrial</strong> <strong>Water</strong> <strong>Use</strong> in Minnesota<br />
MCES Project 070186 / LCMR 05-07d<br />
4/24/07<br />
<strong>Water</strong> Reuse <strong>for</strong> Minnesota Industries – Implementation Considerations<br />
Discussion with Stakeholders, April 24, 2007<br />
Topic<br />
Supply Issues<br />
Key Points Potential Actions<br />
• Reliability: A reclaimed supply can be the<br />
primary supply, backup supply or<br />
supplemental supply <strong>for</strong> an industry. The<br />
management of multiple water supplies must<br />
be considered in the facility infrastructure and<br />
processes, the storage requirements to meet<br />
variable demand patterns, and related permit<br />
requirements.<br />
• Dual Systems: Future development should<br />
consider dual water systems (potable and<br />
reclaimed supplies).<br />
• <strong>Water</strong> Quality Data: There are insufficient<br />
data available on the WWTP effluent from<br />
most municipalities. This makes it difficult to<br />
assess the treatment requirements and<br />
associated costs that would be needed to use<br />
a reclaimed supply.<br />
• <strong>Water</strong> Sampling to Assure Permit<br />
Compliance and Acceptability <strong>for</strong> Intended<br />
<strong>Use</strong>: The potential unknown contaminants that<br />
could occur in a municipal WWTP effluent and<br />
the concern <strong>for</strong> industry process problems and<br />
discharge permit compliance will require<br />
additional sampling to assure established<br />
water quality goals are met.<br />
• Establish a funded program <strong>for</strong> analysis of<br />
municipal WWTP effluent <strong>for</strong> parameters of<br />
concern <strong>for</strong> water reuse applications. This<br />
program could target WWTP with highest<br />
benefits <strong>for</strong> reuse and establish a historic data<br />
base <strong>for</strong> water quality that can be referenced in<br />
the planning <strong>for</strong> water reuse projects.<br />
• Incorporate reliability, water sampling, and<br />
other supply consideration issues as key<br />
elements of study in a ‘partnered project’.<br />
Exh C-<strong>Water</strong> Reuse Implementation Consid&Recomm Table-short_042407.doc Page 3 of 3
<strong>Recycling</strong> <strong>Treated</strong> <strong>Wastewater</strong> For <strong>Industrial</strong> <strong>Water</strong> <strong>Use</strong> in Minnesota<br />
MCES Project 070186 / LCMR 05-07d<br />
5/1/07<br />
<strong>Water</strong> Reuse Stakeholder Meeting<br />
April 24, 2007<br />
Discussion Summary<br />
Overview<br />
The <strong>Water</strong> Reuse Stakeholder Meeting, held April 24, 2007 from 1-3:30 pm at<br />
Metropolitan Council Environmental Services (MCES) Metro 94 Complex Meeting Rm<br />
32, brought together regulatory, industrial, water utility, wastewater utility, and<br />
community representatives. This document summarizes the questions and comments<br />
made during the meeting. The discussion documentation follows the table of<br />
Implementation Topics and Initial Recommendations handed out at the meeting and<br />
provided in Exhibit 1. The topics summarize issues and practices identified through<br />
earlier workshops with regulators and industries and the recommendations listed<br />
served as an initial list to generate discussion with this group of stakeholders, as<br />
presented below. Exhibit 2 contains the meeting participant list and agenda.<br />
Discussion Summary<br />
Environmental Stewardship<br />
1. How or are we going to incorporate goals <strong>for</strong> water reuse?<br />
a. Have we established any benchmarks?<br />
b. MCES still needs to discuss this with Council members.<br />
2. One goal could be to implement a project (demonstration or partnered project).<br />
3. Rewards program could be fostered after community programs similar to solid<br />
waste recycling programs. These are ongoing programs that acknowledge industry’s<br />
commitment to using recycled materials/products and recycling their byproducts.<br />
4. MnTap Award – could qualify <strong>for</strong> one based on industry’s commitment to reducing<br />
water use.<br />
5. Important that the award program is an ongoing program, this fosters competition<br />
and more recognition.<br />
6. Industry supports these award programs, but there is an economic threshold.<br />
7. Responsible Care – American Chemistry Council sponsored award program.<br />
Acknowledges reductions in green house gas emissions and other air and water<br />
quality pollutant reductions.<br />
Page 1 of 8
<strong>Recycling</strong> <strong>Treated</strong> <strong>Wastewater</strong> For <strong>Industrial</strong> <strong>Water</strong> <strong>Use</strong> in Minnesota<br />
MCES Project 070186 / LCMR 05-07d<br />
5/1/07<br />
<strong>Water</strong> Reuse Stakeholder Meeting<br />
April 24, 2007<br />
Discussion Summary<br />
8. Brewing company in Colorado – took on the corporate culture <strong>for</strong> environmental<br />
stewardship and conservation. This affected the construction, materials selection, etc<br />
<strong>for</strong> their facility and daily operations.<br />
9. Reuse of water will offset use of ground and surface waters = protect natural<br />
resources.<br />
Regulatory<br />
1. One industry had difficulty in early discussions with a municipality and regulators<br />
on a potential water reuse project. The extra monitoring and hoops to jump through<br />
were too many and the industry did not make much progress on evaluating reuse.<br />
2. Industry would like direction on pre-approved processes to know if their water uses<br />
would qualify.<br />
a. It would be helpful to know options be<strong>for</strong>e they get too far in the planning<br />
process.<br />
b. Want clarification on uses that qualify as ‘non-contact’ water uses.<br />
3. The CA <strong>Recycling</strong> Criteria specify water quality criteria <strong>for</strong> specific uses and can be<br />
referenced as a source.<br />
4. Current regulations: MN handles on a case-by-case basis using the Cali<strong>for</strong>nia <strong>Water</strong><br />
<strong>Recycling</strong> Criteria.<br />
a. How do we begin the process to decide if regulations, guidelines, or case-by-case<br />
approach is best <strong>for</strong> Minnesota?<br />
o One method is to set up a Technical Advisory Committee (TAC)<br />
• TAC consists of experts from other states and within the state,<br />
regulators, industries, and community groups.<br />
• Who leads this ef<strong>for</strong>t <strong>for</strong> a TAC? In other states it is lead by the<br />
regulatory agency that permits water reuse.<br />
b. Can we just adopt the Cali<strong>for</strong>nia criteria given the differences in climate? For<br />
example the influence of humidity and more significant seasonal temperature<br />
changes.<br />
o In Texas, they first adopted tougher turbidity criteria than the CA criteria<br />
<strong>for</strong> turbidity and then went back and revised this because they could not<br />
technically justify it.<br />
5. MN has prepared case-by-case water reuse permits <strong>for</strong> the following applications:<br />
a. Golf course irrigation<br />
Page 2 of 8
<strong>Recycling</strong> <strong>Treated</strong> <strong>Wastewater</strong> For <strong>Industrial</strong> <strong>Water</strong> <strong>Use</strong> in Minnesota<br />
MCES Project 070186 / LCMR 05-07d<br />
5/1/07<br />
<strong>Water</strong> Reuse Stakeholder Meeting<br />
April 24, 2007<br />
Discussion Summary<br />
b. Agricultural irrigation, mostly alfalfa and corn <strong>for</strong> animal feed<br />
c. Toilet flush water<br />
d. Power plant cooling water with mist spray from towers<br />
6. Invest in a pilot study to demonstrate that a process meets the public health and<br />
other water quality criteria.<br />
a. Example provided <strong>for</strong> industry that made cardboard boxes that were in contact<br />
with fruits and vegetables.<br />
b. Documented process parameters such as temperature and water quality<br />
parameters, plus final product use<br />
c. No health issues noted; met water quality criteria<br />
7. <strong>Water</strong> reuse in<strong>for</strong>mation can be provided on the MPCA website (given followup<br />
with other MPCA departments).<br />
8. Is there a demand <strong>for</strong> reclaimed water that requires investment in water regulation<br />
development?<br />
a. How do we <strong>for</strong>ecast this demand and plan <strong>for</strong> it?<br />
b. Regulatory community would support setting criteria if there was a demand.<br />
9. Questions were raised by municipalities on whether their NPDES limits would be<br />
changed given the changes in their discharge from the receiving stream to reuse<br />
applications.<br />
a. There are some cases where the reduced quantity could affect a municipality<br />
from meeting a concentration limit. For example, <strong>for</strong> plants with ammonia limits<br />
that handle ammonia recycle from their digesters – often need the volume to<br />
meet the concentration limit, but are fine with the mass limit.<br />
b. Will the NPDES limits be changed to correspond to the reduced flow and mass to<br />
the receiving stream that is directed to reuse?<br />
c. For reclaimed water that is used by an entity and a portion discharged back to a<br />
receiving stream located in a different watershed or stream segment – how will<br />
this affect the TMDL <strong>for</strong> the associated streams?<br />
d. Concern expressed that in the TMDL process, the existing allocation <strong>for</strong> the<br />
WWTP will be reallocated because of the reduction in discharge <strong>for</strong> reuse.<br />
However, the reuse customer may go out of business or change practices and<br />
then the municipality would need to go back to the receiving stream. The WWTP<br />
would then be in violation of their permit.<br />
e. How the TMDL process affects a permit will depend on the timing of the NPDES<br />
permit revisions <strong>for</strong> water reuse with the TMDL process <strong>for</strong> the associated<br />
receiving stream.<br />
Page 3 of 8
<strong>Recycling</strong> <strong>Treated</strong> <strong>Wastewater</strong> For <strong>Industrial</strong> <strong>Water</strong> <strong>Use</strong> in Minnesota<br />
MCES Project 070186 / LCMR 05-07d<br />
5/1/07<br />
<strong>Water</strong> Reuse Stakeholder Meeting<br />
April 24, 2007<br />
Discussion Summary<br />
10. How did the TMDL process fit with existing reuse applications in MN?<br />
a. For the golf course irrigation projects, land application was required <strong>for</strong> WWTP<br />
effluent because there was no discharge to waterways available/allowed.<br />
b. Mankato is in an area with an existing TMDL. In this case it was unique, because<br />
the reclaimed flow was directed back to the WWTP and was discharged with<br />
their effluent.<br />
11. Is a DNR Appropriations Permit required? In most cases no. As with<br />
Mankato/Calpine Corporation, Calpine did not need one. It is possible if the<br />
reclaimed supply passes a watershed divide or other circumstances, then an<br />
appropriations permit may be required.<br />
12. Seasonal nutrient removal limits <strong>for</strong> receiving streams promote reuse <strong>for</strong> agricultural<br />
or urban irrigation.<br />
Liability<br />
1. In other states, compliance with permit limits provides the assurance of a safe<br />
supply <strong>for</strong> public health. Agreements are used to list specific requirements <strong>for</strong><br />
quality and quantity <strong>for</strong> a given industry. Monitoring assesses compliance with<br />
limits and serves as a record to determine if the supply causes a problem in the<br />
industry’s production process<br />
2. If a problem arises from use of a potable supply, an industry would not make a claim<br />
against a public water utility <strong>for</strong> resulting damages.<br />
3. Liability related caps:<br />
• Environmental damage - $250,000<br />
• Product damage - $1M<br />
4. <strong>Wastewater</strong> quality is more variable and there is limited control over illegal<br />
dumping into the system. A wastewater utility could track a problem to an<br />
industrial discharge – putting fault on another entity.<br />
5. <strong>Use</strong> reservoirs/storage to dampen spikes or other variability in wastewater quality.<br />
6. Concern expressed on cross-connections to the potable supply.<br />
a. Need an ongoing inspection program to ensure infrastructure is per<strong>for</strong>ming<br />
adequately to prevent backflow of reclaimed system into potable system.<br />
b. Need standards <strong>for</strong> back-flow prevention devices.<br />
c. Place as a requirement of the user.<br />
Page 4 of 8
<strong>Recycling</strong> <strong>Treated</strong> <strong>Wastewater</strong> For <strong>Industrial</strong> <strong>Water</strong> <strong>Use</strong> in Minnesota<br />
MCES Project 070186 / LCMR 05-07d<br />
5/1/07<br />
<strong>Water</strong> Reuse Stakeholder Meeting<br />
April 24, 2007<br />
Discussion Summary<br />
Partnered Project<br />
1. Goal: to implement a project with the supplier, user, and regulators that documents<br />
the steps, obstacles, and decisions made from planning through operation.<br />
a. Purpose would be more <strong>for</strong> the institutional issues vs. the technical ones<br />
b. Multiple options or points of focus<br />
2. MPCA would be interested in working with a wastewater utility and industry on<br />
this project. There was a good working team with Calpine and Mankato in<br />
developing that project.<br />
3. How would a project be funded?<br />
a. There are national funding sources from WateReuse Foundation, AWWARF,<br />
WERF. Not many on industrial projects from these sources.<br />
4. There is not a widespread understanding that there are water supply issues in MN.<br />
Education is required to show reuse is important <strong>for</strong> MN’s water resources.<br />
5. There are different issues or considerations <strong>for</strong> adding reuse to existing<br />
infrastructure than <strong>for</strong> future facilities. Future WWTPs could be sited to incorporate<br />
industry, agricultural land, transportation, etc. around the beneficial reuse of water.<br />
6. What criteria will be used to determine if reuse is necessary? If we look 50 years<br />
down the road, what will push the state to reuse? Will the TMDL process bring us<br />
there? Will our visionary approach to the metro area water supply indicate it is<br />
water supply? How about other MN communities?<br />
7. Who would be in the project group? MPCA, MN OSHA, MDH with industry and<br />
wastewater utility.<br />
8. Lead organization:<br />
a. Some participants felt it was too early to state this.<br />
b. Others thought it should be those that want to make it happen – the municipality<br />
or the industry.<br />
c. See regulator as the protector of citizen’s interests.<br />
d. Ex. Mankato/Calpine Corporation.<br />
9. DNR supported working with a group with multiple agencies to look at<br />
opportunities <strong>for</strong> reuse or ways to promote reuse.<br />
10. TMDL process is not an issue <strong>for</strong> a partnering project.<br />
Page 5 of 8
<strong>Recycling</strong> <strong>Treated</strong> <strong>Wastewater</strong> For <strong>Industrial</strong> <strong>Water</strong> <strong>Use</strong> in Minnesota<br />
MCES Project 070186 / LCMR 05-07d<br />
5/1/07<br />
<strong>Water</strong> Reuse Stakeholder Meeting<br />
April 24, 2007<br />
Discussion Summary<br />
11. Conservation. Our discussion today has not focused on this. It is important to ensure<br />
the project notes that all conservation practices should continue to be pursued and<br />
that water reuse presents an additional conservation practice. We should continue to<br />
reduce water use and what water we use we should recycle.<br />
Economic Incentives/Funding<br />
1. What type of financial plan has been considered <strong>for</strong> a reuse system? Answer: none<br />
yet.<br />
2. Proximity of a reuse customer to the WWTP would be important given transmission<br />
costs.<br />
3. Funding and financing depends on the driver. In the case of MCES, if it is water<br />
quality driven then funding could follow the same method as done <strong>for</strong> treatment<br />
and discharge to our waterways – cost is shared in the metro area.<br />
4. Priority List <strong>for</strong> PFA funding:<br />
a. Get more points or higher on list if discharge is to land treatment vs. receiving<br />
stream. This will help projects with irrigation reuse, but not reuse to industries.<br />
b. Need a rule change to get higher points <strong>for</strong> water reuse.<br />
5. Concern expressed by industry if looking at reuse to offset costs required to treat<br />
wastewater based on revised water quality limits – and cost is transferred to the<br />
industry.<br />
6. <strong>Industrial</strong> facility near a WWTP – why pay <strong>for</strong> the water if industry pays <strong>for</strong> pipe to<br />
get it there and provides any additional treatment <strong>for</strong> their water supply<br />
requirements?<br />
7. Could the water utility structure the rates to provide more incentive <strong>for</strong> industry to<br />
consider reuse?<br />
a. Concern expressed that <strong>for</strong> those with few options and that have already<br />
reduced water use this would not be fair.<br />
b. Idea is to consider linking water utility and reclaimed rates. This is easier to do<br />
with a community that has same entity <strong>for</strong> both the water and wastewater<br />
utilities.<br />
8. Need incentives to look ahead and be prepared – drivers may not be here now, but<br />
expect reuse will have a role in the future.<br />
Page 6 of 8
<strong>Recycling</strong> <strong>Treated</strong> <strong>Wastewater</strong> For <strong>Industrial</strong> <strong>Water</strong> <strong>Use</strong> in Minnesota<br />
MCES Project 070186 / LCMR 05-07d<br />
5/1/07<br />
<strong>Water</strong> Reuse Stakeholder Meeting<br />
April 24, 2007<br />
Discussion Summary<br />
Technical Supply Issues/Public Perception<br />
1. Technical issues are site specific and variable.<br />
2. Example provided of the SMSC plant<br />
a. 2 trains with different treatment to meet different end quality requirements<br />
b. Aquifer recharge is an ongoing discussion<br />
3. All points noted in the Implementation Considerations table need to be considered.<br />
Public Education – not addressed earlier<br />
4. The topic of public awareness is critical to address in the implementation of water<br />
reuse practices in Minnesota.<br />
5. The Minnesota public needs to be aware that reuse is <strong>for</strong> the good of the<br />
environment and that health concerns are addressed.<br />
6. Reuse is an opportunity to be of benefit to the environment.<br />
7. Public involvement process must begin early – up-front in the planning process need<br />
to involve community.<br />
8. Issue <strong>for</strong> some – is this going into the tap water?<br />
9. Consider TCAAP and Riley Tar – contaminated supplies are being treated and used<br />
by the communities. Community was educated on the treatment process and<br />
accepting of technology to use the supply. Cost was covered by federal funds <strong>for</strong> site<br />
cleanup and remediation.<br />
10. Similar public perception issue seen with biosolids. Some communities are not<br />
allowing biosolids applications on their fields.<br />
11. Cali<strong>for</strong>nia regulations are based on significant studies. These can serve as sources to<br />
show the public the extent of scientific research that has been done in the<br />
development of regulations and related risk assessments.<br />
12. Reuse can be part of our environmental ethic.<br />
13. In other similar ef<strong>for</strong>ts to promote an environmental issue or treatment technology –<br />
it took one person or agency to take the lead. A similar model could work <strong>for</strong> water<br />
Page 7 of 8
<strong>Recycling</strong> <strong>Treated</strong> <strong>Wastewater</strong> For <strong>Industrial</strong> <strong>Water</strong> <strong>Use</strong> in Minnesota<br />
MCES Project 070186 / LCMR 05-07d<br />
5/1/07<br />
<strong>Water</strong> Reuse Stakeholder Meeting<br />
April 24, 2007<br />
Discussion Summary<br />
reuse. Also, implementation could target one industry sector and gain acceptance<br />
from that type industry and type of water uses.<br />
14. The Office of Environmental Assistance and their mission appear to align with the<br />
conservation basis of water reuse. Can they become involved?<br />
Page 8 of 8
<strong>Water</strong> Reuse Stakeholder Meeting - April 24, 2007<br />
Participant List<br />
MCES <strong>Recycling</strong> <strong>Treated</strong> <strong>Wastewater</strong> <strong>for</strong> <strong>Industrial</strong> <strong>Water</strong> <strong>Use</strong><br />
First Name Last Name Organization<br />
Lih-in Rezania MN Dept of Health<br />
Jim Japs MN Dept of Natural Resources<br />
Lisa Thorvig MN Pollution Control Agency<br />
David Sahli MN Pollution Control Agency<br />
Katrina Kessler MN Pollution Control Agency<br />
Bradley Nordberg MN Pollution Control Agency<br />
Mary Fralish City of Mankato<br />
Bob Cockriel City of Bloomington/WUC Representative<br />
Shelley Shreffler Minnesota Environmental Initiative<br />
Herbie Owen Marathon Petroleum<br />
John Kimble CertainTeed Corporation<br />
Bryce Pickart MCES<br />
Bill Cook MCES<br />
Deborah Manning MCES<br />
Melba Hensel MCES<br />
Claude Anderson MCES<br />
Bob Pohlman MCES<br />
Chris Elvrum MCES<br />
Patti Craddock Craddock Consulting Engineers<br />
Bob Molzahn CDM<br />
Bob Matthews CDM<br />
<strong>Water</strong>Reuse Mtg_042407_participants.xls Page 1 of 1 6/14/2007