Leveling the curve of Spee with a continuous archwire technique: A ...
Leveling the curve of Spee with a continuous archwire technique: A ...
Leveling the curve of Spee with a continuous archwire technique: A ...

Create successful ePaper yourself
Turn your PDF publications into a flip-book with our unique Google optimized e-Paper software.
366 Bernstein, Preston, and Lampasso<br />
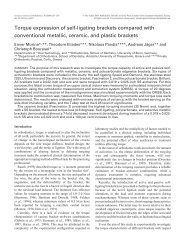
Table II. Changes in cephalometric measurements from T1 to T3<br />
Measurement<br />
T1 T2 T3<br />
Mean SD Mean SD Mean SD<br />
L4-COS line (mm) 2.47 0.69 0.19 0.31 0.69 0.64<br />
L1-MP perp (mm) 38.89 3.02 39.42 2.94 41.08 3.27<br />
L4-MP perp (mm) 32.50 2.76 35.31 3.01 36.31 3.18<br />
L6-MP perp (mm) 29.16 2.14 31.47 2.81 32.70 3.20<br />
L1-MP (°) 94.85 5.43 95.68 6.93 94.50 5.80<br />
L1 to A-Po (mm) 1.18 1.98 0.34 1.51 0.24 2.04<br />
L1-NB (°) 22.81 5.16 24.18 4.82 23.15 4.94<br />
SNA angle (°) 82.03 3.33 79.39 4.08 79.76 4.14<br />
SNB angle (°) 76.87 3.34 77.21 3.75 77.76 3.91<br />
ANB angle (°) 5.16 1.60 2.18 1.76 2.00 2.25<br />
Y-axis (°) 66.21 2.91 67.26 3.36 66.92 3.77<br />
SN-MP (°) 31.23 4.35 32.21 5.54 31.65 6.30<br />
SN-OP (°) 17.76 3.31 14.77 2.94 14.58 3.63<br />
OP-MP (°) 13.47 3.18 17.44 4.58 17.06 4.23<br />
SN-PP (°) 8.00 2.89 8.95 3.35 8.23 3.04<br />
U6-PP perp (mm) 20.00 4.15 22.73 2.52 23.97 2.84<br />
U6-PP (°) 78.89 6.29 81.00 6.24 83.11 6.27<br />
U1-PP perp 26.29 2.46 26.87 2.84 28.29 3.10<br />
U1-PP (°) 109.24 9.31 111.23 5.30 111.97 7.87<br />
U1-NA (°) 19.18 8.27 22.68 4.25 23.68 5.74<br />
U1-L1 (°) 134.27 13.56 130.53 7.02 131.35 7.98<br />
L6-MP (°) 84.95 4.10 78.53 5.60 80.40 6.05<br />
Perp, Perpendicular.<br />
American Journal <strong>of</strong> Orthodontics and Dent<strong>of</strong>acial Orthopedics<br />
March 2007<br />
OP-MP angle was 3.90° (SD, 3.83). Both changes molar (L6), <strong>the</strong> most infra-occluded premolar (L4), and<br />
were statistically significant (P .0001).<br />
<strong>the</strong> most extruded incisor (L1) were measured <strong>with</strong><br />
According to <strong>the</strong> literature, angular changes <strong>of</strong> less reference to <strong>the</strong> mandibular plane. Since appositional<br />
than 10° in <strong>the</strong> long axes <strong>of</strong> <strong>the</strong> teeth do not have a bony growth at <strong>the</strong> inferior border <strong>of</strong> <strong>the</strong> mandible can<br />
significant effect on <strong>the</strong> perpendicular linear measure-<br />
38<br />
ments made from L1, L4, or L6 to <strong>the</strong> MP. In this<br />
radiographic study, no patients had angular changes<br />
greater than 10° for any teeth in question (Table III).<br />
The mean COS at T1 for <strong>the</strong> 31 patients treated <strong>with</strong><br />
<strong>the</strong> <strong>continuous</strong> <strong>archwire</strong> <strong>technique</strong> was 2.47 mm (SD,<br />
0.69 mm; range, 2.00-4.00 mm). The mean COS at T2<br />
for this sample was 0.19 mm (SD, 0.31 mm; range,<br />
0.00-1.00 mm) (P .0001). During treatment, <strong>the</strong> mean<br />
reduction in <strong>the</strong> COS was 2.27 mm (SD, 0.77 mm),<br />
which corresponds to a 92.16% average reduction in<br />
this measurement. Twenty-one <strong>of</strong> <strong>the</strong> 31 subjects<br />
(about 67.80%) were completely level at T2, but 10 had<br />
slight residual COS at <strong>the</strong> end <strong>of</strong> this phase. The mean<br />
COS at T3 was 0.69 mm (SD, 0.64 mm; range,<br />
0.00-2.00 mm). The mean increase in <strong>the</strong> COS from T2<br />
to T3 was 0.49 mm (SD, 0.69 mm) (P .001). The<br />
overall mean time from T1 to T3 was 14 years 4<br />
add significant amounts to <strong>the</strong>se measurements, growth<br />
prediction charts for normal white American youths<br />
were used to calculate net treatment (T2-T1) and<br />
posttreatment (T3-T2) changes.<br />
months, <strong>with</strong> a range <strong>of</strong> 7 years to 28 years 8 months.<br />
Over this period, <strong>the</strong> overall effect on <strong>the</strong> COS was an<br />
average reduction <strong>of</strong> 1.78 mm, which represents a<br />
72.97% reduction.<br />
The perpendicular heights <strong>of</strong> <strong>the</strong> mandibular first<br />
36 No growth data were<br />
found for mandibular premolar heights (L4-MP); <strong>the</strong>refore,<br />
figures midway between those <strong>of</strong> <strong>the</strong> molars and<br />
36<br />
<strong>the</strong> incisors were used for comparison. Growth adjustments<br />
were made by adding <strong>the</strong> relevant mean<br />
growth increments from <strong>the</strong> growth charts to <strong>the</strong><br />
respective measurements made at T2 and T3. Paired<br />
t tests (<strong>with</strong> set at 0.01) were calculated for both<br />
<strong>the</strong> growth-adjusted and <strong>the</strong> unadjusted measurements<br />
(Table IV).<br />
Analysis <strong>of</strong> <strong>the</strong> data, unadjusted for growth, showed<br />
that <strong>the</strong>re were statistically significant changes associated<br />
<strong>with</strong> treatment for premolar (L4-MP) and first<br />
molar (L6-MP) vertical heights (P .0001). The mean<br />
treatment changes for <strong>the</strong> dental heights were 0.53 mm<br />
(SD, 1.60 mm) for L1-MP, 2.81 mm (SD, 1.69<br />
mm) for L4-MP, and 2.31 mm (SD, 2.28 mm) for<br />
L6-MP (Table III). All unadjusted posttreatment (T3-<br />
T2) t test results for <strong>the</strong> L1, L4, and L6 perpendiculars