Leveling the curve of Spee with a continuous archwire technique: A ...
Leveling the curve of Spee with a continuous archwire technique: A ...
Leveling the curve of Spee with a continuous archwire technique: A ...

Create successful ePaper yourself
Turn your PDF publications into a flip-book with our unique Google optimized e-Paper software.
American Journal <strong>of</strong> Orthodontics and Dent<strong>of</strong>acial Orthopedics<br />
Volume 131, Number 3<br />
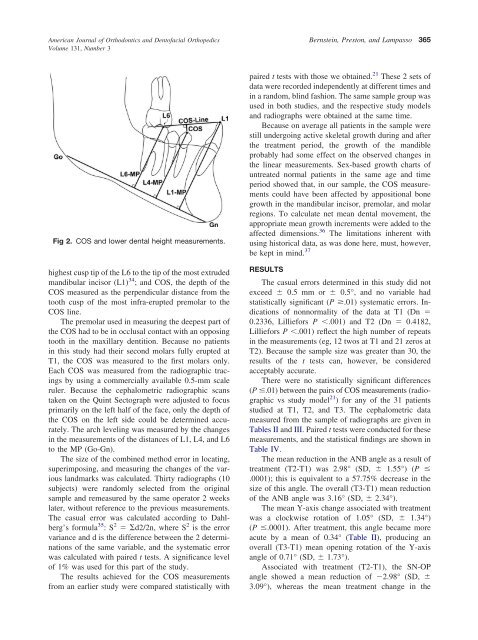
Fig 2. COS and lower dental height measurements.<br />
highest cusp tip <strong>of</strong> <strong>the</strong> L6 to <strong>the</strong> tip <strong>of</strong> <strong>the</strong> most extruded<br />
mandibular incisor (L1) 34 ; and COS, <strong>the</strong> depth <strong>of</strong> <strong>the</strong><br />
COS measured as <strong>the</strong> perpendicular distance from <strong>the</strong><br />
tooth cusp <strong>of</strong> <strong>the</strong> most infra-erupted premolar to <strong>the</strong><br />
COS line.<br />
The premolar used in measuring <strong>the</strong> deepest part <strong>of</strong><br />
<strong>the</strong> COS had to be in occlusal contact <strong>with</strong> an opposing<br />
tooth in <strong>the</strong> maxillary dentition. Because no patients<br />
in this study had <strong>the</strong>ir second molars fully erupted at<br />
T1, <strong>the</strong> COS was measured to <strong>the</strong> first molars only.<br />
Each COS was measured from <strong>the</strong> radiographic tracings<br />
by using a commercially available 0.5-mm scale<br />
ruler. Because <strong>the</strong> cephalometric radiographic scans<br />
taken on <strong>the</strong> Quint Sectograph were adjusted to focus<br />
primarily on <strong>the</strong> left half <strong>of</strong> <strong>the</strong> face, only <strong>the</strong> depth <strong>of</strong><br />
<strong>the</strong> COS on <strong>the</strong> left side could be determined accurately.<br />
The arch leveling was measured by <strong>the</strong> changes<br />
in <strong>the</strong> measurements <strong>of</strong> <strong>the</strong> distances <strong>of</strong> L1, L4, and L6<br />
to <strong>the</strong> MP (Go-Gn).<br />
The size <strong>of</strong> <strong>the</strong> combined method error in locating,<br />
superimposing, and measuring <strong>the</strong> changes <strong>of</strong> <strong>the</strong> various<br />
landmarks was calculated. Thirty radiographs (10<br />
subjects) were randomly selected from <strong>the</strong> original<br />
sample and remeasured by <strong>the</strong> same operator 2 weeks<br />
later, <strong>with</strong>out reference to <strong>the</strong> previous measurements.<br />
The casual error was calculated according to Dahlberg’s<br />
formula 35 :S 2 d2/2n, where S 2 is <strong>the</strong> error<br />
variance and d is <strong>the</strong> difference between <strong>the</strong> 2 determinations<br />
<strong>of</strong> <strong>the</strong> same variable, and <strong>the</strong> systematic error<br />
was calculated <strong>with</strong> paired t tests. A significance level<br />
<strong>of</strong> 1% was used for this part <strong>of</strong> <strong>the</strong> study.<br />
The results achieved for <strong>the</strong> COS measurements<br />
from an earlier study were compared statistically <strong>with</strong><br />
Bernstein, Preston, and Lampasso 365<br />
21<br />
paired t tests <strong>with</strong> those we obtained. These 2 sets <strong>of</strong><br />
data were recorded independently at different times and<br />
in a random, blind fashion. The same sample group was<br />
used in both studies, and <strong>the</strong> respective study models<br />
and radiographs were obtained at <strong>the</strong> same time.<br />
Because on average all patients in <strong>the</strong> sample were<br />
still undergoing active skeletal growth during and after<br />
<strong>the</strong> treatment period, <strong>the</strong> growth <strong>of</strong> <strong>the</strong> mandible<br />
probably had some effect on <strong>the</strong> observed changes in<br />
<strong>the</strong> linear measurements. Sex-based growth charts <strong>of</strong><br />
untreated normal patients in <strong>the</strong> same age and time<br />
period showed that, in our sample, <strong>the</strong> COS measurements<br />
could have been affected by appositional bone<br />
growth in <strong>the</strong> mandibular incisor, premolar, and molar<br />
regions. To calculate net mean dental movement, <strong>the</strong><br />
appropriate mean growth increments were added to <strong>the</strong><br />
affected dimensions. 36 The limitations inherent <strong>with</strong><br />
using historical data, as was done here, must, however,<br />
be kept in mind.<br />
37<br />
RESULTS<br />
The casual errors determined in this study did not<br />
exceed 0.5 mm or 0.5°, and no variable had<br />
statistically significant (P .01) systematic errors. Indications<br />
<strong>of</strong> nonnormality <strong>of</strong> <strong>the</strong> data at T1 (Dn <br />
0.2336, Lilliefors P .001) and T2 (Dn 0.4182,<br />
Lilliefors P .001) reflect <strong>the</strong> high number <strong>of</strong> repeats<br />
in <strong>the</strong> measurements (eg, 12 twos at T1 and 21 zeros at<br />
T2). Because <strong>the</strong> sample size was greater than 30, <strong>the</strong><br />
results <strong>of</strong> <strong>the</strong> t tests can, however, be considered<br />
acceptably accurate.<br />
There were no statistically significant differences<br />
(P .01) between <strong>the</strong> pairs <strong>of</strong> COS measurements (radiographic<br />
vs study model<br />
21 ) for any <strong>of</strong> <strong>the</strong> 31 patients<br />
studied at T1, T2, and T3. The cephalometric data<br />
measured from <strong>the</strong> sample <strong>of</strong> radiographs are given in<br />
Tables II and III. Paired t tests were conducted for <strong>the</strong>se<br />
measurements, and <strong>the</strong> statistical findings are shown in<br />
Table IV.<br />
The mean reduction in <strong>the</strong> ANB angle as a result <strong>of</strong><br />
treatment (T2-T1) was 2.98° (SD, 1.55°) (P <br />
.0001); this is equivalent to a 57.75% decrease in <strong>the</strong><br />
size <strong>of</strong> this angle. The overall (T3-T1) mean reduction<br />
<strong>of</strong> <strong>the</strong> ANB angle was 3.16° (SD, 2.34°).<br />
The mean Y-axis change associated <strong>with</strong> treatment<br />
was a clockwise rotation <strong>of</strong> 1.05° (SD, 1.34°)<br />
(P .0001). After treatment, this angle became more<br />
acute by a mean <strong>of</strong> 0.34° (Table II), producing an<br />
overall (T3-T1) mean opening rotation <strong>of</strong> <strong>the</strong> Y-axis<br />
angle <strong>of</strong> 0.71° (SD, 1.73°).<br />
Associated <strong>with</strong> treatment (T2-T1), <strong>the</strong> SN-OP<br />
angle showed a mean reduction <strong>of</strong> 2.98° (SD, <br />
3.09°), whereas <strong>the</strong> mean treatment change in <strong>the</strong>