Data Analysis: Confounders, Mediators, and Moderators
Data Analysis: Confounders, Mediators, and Moderators
Data Analysis: Confounders, Mediators, and Moderators

You also want an ePaper? Increase the reach of your titles
YUMPU automatically turns print PDFs into web optimized ePapers that Google loves.
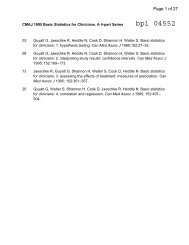
5. Consider the two graphs below. Is there an interaction<br />
between exposure <strong>and</strong> age? Incidence of disease is plotted<br />
on the vertical axis <strong>and</strong> age (a potential confounder) is<br />
plotted on the horizontal axis. Separate lines are drawn the<br />
exposed (E+) <strong>and</strong> unexposed groups (E-).<br />
AGE<br />
E+<br />
E–<br />
AGE<br />
A Evans, March 2006 <strong>Confounders</strong>, <strong>Mediators</strong>, <strong>Moderators</strong> 6<br />
E+<br />
E–