Journal of Accident Investigation
Journal of Accident Investigation
Journal of Accident Investigation

You also want an ePaper? Increase the reach of your titles
YUMPU automatically turns print PDFs into web optimized ePapers that Google loves.
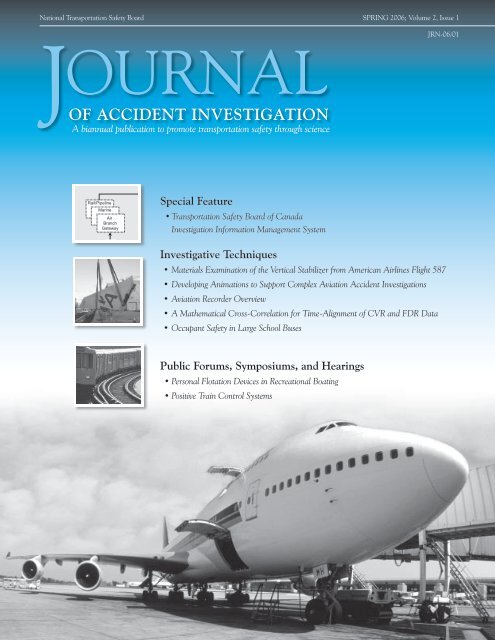
National Transportation Safety Board SPRING 2006; Volume 2, Issue 1<br />
OURNAL<br />
JOF ACCIDENT INVESTIGATION<br />
A biannual publication to promote transportation safety through science<br />
TIMMS<br />
Navigation<br />
Structure<br />
Data<br />
Collection<br />
Workbench<br />
Rail/Pipeline<br />
Marine<br />
Air<br />
Branch<br />
Gateway<br />
Are accessible through related<br />
Rail<br />
Pipeline<br />
Marine<br />
Air<br />
<strong>Investigation</strong><br />
Workspace<br />
Are associated to every<br />
Safety<br />
Analysis<br />
Workbench<br />
<strong>Investigation</strong><br />
Services<br />
Gateway<br />
Report<br />
Production<br />
Workbench<br />
TSB<br />
Gateway<br />
Special <strong>Investigation</strong> Feature<br />
Services<br />
Gateways<br />
Gateway • Transportation Safety Provide a Board point to aggregate <strong>of</strong> Canada<br />
Are accessible through<br />
Information across many<br />
workspaces<br />
Investigative Techniques<br />
Workspaces<br />
Workload<br />
Management<br />
Corporate<br />
Services<br />
Gateway<br />
Central area (or website) for<br />
collaboration on a specific<br />
investigation where all information<br />
related to an investigation is<br />
collected and exchanged<br />
Workbenches<br />
Governance<br />
Gateway<br />
<strong>Investigation</strong> Information Management System<br />
Tabs with the <strong>Investigation</strong><br />
Workspace where specialized tools<br />
and information required for specific<br />
sets <strong>of</strong> activities related to an<br />
investigation are organized<br />
JRN-06/01<br />
• Materials Examination <strong>of</strong> the Vertical Stabilizer from American Airlines Flight 587<br />
• Developing Animations to Support Complex Aviation <strong>Accident</strong> <strong>Investigation</strong>s<br />
• Aviation Recorder Overview<br />
• A Mathematical Cross-Correlation for Time-Alignment <strong>of</strong> CVR and FDR Data<br />
• Occupant Safety in Large School Buses<br />
Public Forums, Symposiums, and Hearings<br />
• Personal Flotation Devices in Recreational Boating<br />
• Positive Train Control Systems
About The Cover<br />
Featured on the cover is a Boeing 747. NTSB<br />
accident investigations in all modes, including<br />
aviation, use a variety <strong>of</strong> investigative techniques<br />
that are discussed in this issue, including wreckage<br />
examination, vehicle recorder analysis, and vehicle<br />
performance simulations and animations.<br />
Editorial Policy<br />
Research/Technical Articles<br />
The NTSB <strong>Journal</strong> will publish research and technical articles on accident investigations<br />
that may be <strong>of</strong> interest to pr<strong>of</strong>essionals in safety, accident investigation, engineering, and the<br />
behavioral sciences. Papers may be empirical or concerned with the development and use <strong>of</strong><br />
accident investigation methods, techniques, or technologies. All papers should have a strong<br />
scientific or technical basis and be related to accident investigation or transportation safety<br />
analysis.<br />
Organization <strong>of</strong> material for empirical investigations should follow standard reporting<br />
format: problem, method, results, discussion, and summary. Papers discussing accident<br />
investigation methods, techniques, or technologies should include a clear and concise<br />
description <strong>of</strong> the method, technique, or technology that uses accident data and information<br />
to illustrate the approach and a discussion <strong>of</strong> the added benefit the approach brings to<br />
accident investigation or transportation safety analysis.<br />
Public Forums, Symposiums, and Hearings<br />
The NTSB <strong>Journal</strong> will publish papers describing public forums, symposiums, and hearings<br />
conducted by NTSB. The papers will describe the purpose <strong>of</strong> the event, the participants, and<br />
the topics covered by the event. The paper should include clear and concise statements <strong>of</strong><br />
the areas <strong>of</strong> open discussion, topics identified for further analysis, conclusions reached, and<br />
any recommendations that were made as a result <strong>of</strong> the event.<br />
Special Features<br />
Articles that treat policy issues related to transportation safety will be accepted for<br />
consideration as special features <strong>of</strong> the <strong>Journal</strong>. These papers may be solicited from both<br />
internal and external sources. These articles should represent a balanced view <strong>of</strong> the various<br />
aspects <strong>of</strong> an important safety issue.<br />
Business <strong>of</strong> the Academy<br />
The <strong>Journal</strong> will include short reports <strong>of</strong> major developments, news, events, research<br />
efforts, and announcements <strong>of</strong> upcoming courses, forums, symposiums, and topical public<br />
hearings.<br />
Editorial Board<br />
The Editorial Board comprises the NTSB Managing Director, the Director <strong>of</strong> the Office<br />
<strong>of</strong> Research and Engineering, and the Chief <strong>of</strong> the Safety Studies and Statistical Analysis<br />
Division. The Editorial Board may solicit critiques or counterpoints on matters open to<br />
debate. Unsolicited articles may be accepted subject to space availability. Special features<br />
may be edited for suitability and fit.<br />
Guidelines for Submissions to the <strong>Journal</strong><br />
• Submissions to the NTSB <strong>Journal</strong> must be submitted as Word documents. Any documents<br />
submitted as PDF files will be returned to the author for reformatting.<br />
• Graphics should be submitted in native format, preferably as high-resolution 300 dpi files<br />
in Jpeg or Tiff format.<br />
• NTSB staff should ensure that text is edited to comply with the NTSB Style Guide prior<br />
to submission.<br />
• Submissions must include a brief biography <strong>of</strong> all authors, including the following<br />
information: full pr<strong>of</strong>essional name (initials are acceptable), pr<strong>of</strong>essional titles (e.g.,<br />
Ph.D., M.D.), education, and a brief description <strong>of</strong> pr<strong>of</strong>essional experience specific to<br />
the subject <strong>of</strong> the article. Including an e-mail address or point <strong>of</strong> contact information is<br />
recommended but optional.<br />
2 NTSB JOURNAL OF ACCIDENT INVESTIGATION, SPRING 2006; VOLUME 2, ISSUE 1
OURNAL<br />
JOF ACCIDENT INVESTIGATION<br />
A biannual publication to promote transportation safety through science<br />
Spring 2006; Volume 2, Issue 1<br />
Mission Statement<br />
The <strong>Journal</strong> is an interdisciplinary<br />
publication that provides for the public<br />
exchange <strong>of</strong> ideas and information<br />
developed through accident investigations<br />
at the National Transportation Safety<br />
Board in all modes <strong>of</strong> transportation. The<br />
intended audience is pr<strong>of</strong>essionals in safety,<br />
accident investigations, engineering, and<br />
the behavioral sciences.<br />
Table <strong>of</strong> Contents<br />
Special Feature<br />
Transportation Safety Board <strong>of</strong> Canada 5<br />
<strong>Investigation</strong> Information Management System<br />
Charles H. Simpson, Transportation Safety Board <strong>of</strong> Canada<br />
Investigative Techniques<br />
Materials Examination <strong>of</strong> the 9<br />
Vertical Stabilizer from American Airlines Flight 587<br />
Matthew R. Fox and Carl R. Schultheisz, National Transportation Safety<br />
Board, James R. Reeder and Brian J. Jensen, NASA Langley Research Center<br />
Developing Animations to Support Complex 23<br />
Aviation <strong>Accident</strong> <strong>Investigation</strong>s<br />
Alice Park and Christy Spangler, National Transportation Safety Board<br />
Aviation Recorder Overview 31<br />
Dennis R. Grossi, National Transportation Safety Board<br />
A Mathematical Cross-Correlation for Time-Alignment <strong>of</strong> 43<br />
Cockpit Voice Recorder and Flight Data Recorder Data<br />
Joseph A. Gregor, National Transportation Safety Board<br />
Occupant Safety in Large School Buses: 55<br />
Crash <strong>Investigation</strong>s, Testing, and Modeling Kristin M. Poland,<br />
National Transportation Safety Board,<br />
Linda McCray, National Highway Transportation Safety Administration<br />
and Aida Barsan-Anelli, Information Systems and Services, Inc.<br />
Public Forums, Symposiums, and Hearings<br />
Personal Flotation Devices in Recreational Boating 67<br />
Bruce G. Coury, National Transportation Safety Board<br />
Positive Train Control Systems 75<br />
Jana Price and Jim Southworth, National Transportation Safety Board<br />
NTSB JOURNAL OF ACCIDENT INVESTIGATION, SPRING 2006; VOLUME 2, ISSUE 1 3
TIMMS<br />
Navigation<br />
Structure<br />
Rail/Pipeline<br />
Marine<br />
Air<br />
Branch<br />
Gateway<br />
Rail<br />
Pipeline<br />
Marine<br />
Air<br />
<strong>Investigation</strong><br />
Workspace<br />
Special Feature<br />
<strong>Investigation</strong><br />
Services<br />
Gateway<br />
The NTSB <strong>Investigation</strong> <strong>Journal</strong> <strong>of</strong> <strong>Accident</strong> <strong>Investigation</strong> Special Features presents articles that treat policy issues related to<br />
Services<br />
transportation safety. These papers Gateways<br />
Gateway<br />
may be solicited from within the government or from public sources. These<br />
Provide a point to aggregate<br />
articles are intended to represent Information a balanced across many view <strong>of</strong> the various aspects <strong>of</strong> an important safety issue. They do not<br />
workspaces<br />
represent an <strong>of</strong>ficial view <strong>of</strong> the Safety Board.<br />
Workspaces<br />
Central area (or website) for<br />
collaboration on a specific<br />
investigation where all information<br />
related to an investigation is<br />
collected and exchanged<br />
Are associated to every<br />
Transportation Safety Board Workbenches <strong>of</strong> Canada<br />
Data<br />
Tabs with the <strong>Investigation</strong><br />
Safety<br />
Report<br />
Workspace where specialized tools<br />
Analysis<br />
Workload<br />
<strong>Investigation</strong> Production Information Management Management and information required for specific System<br />
Collection<br />
Workbench<br />
Are accessible through related<br />
Workbench<br />
Workbench<br />
TSB<br />
Gateway<br />
Are accessible through<br />
Corporate<br />
Services<br />
Gateway<br />
sets <strong>of</strong> activities related to an<br />
investigation are organized<br />
Charles H. Simpson, Transportation Safety Board <strong>of</strong> Canada<br />
NTSB JOURNAL OF ACCIDENT INVESTIGATION, SPRING 2006; VOLUME 2, ISSUE 1<br />
Governance<br />
Gateway<br />
I am highly appreciative <strong>of</strong> the invitation to contribute to this second edition <strong>of</strong> the NTSB’s<br />
<strong>Journal</strong> <strong>of</strong> <strong>Accident</strong> <strong>Investigation</strong>. The <strong>Journal</strong> clearly enjoys a global readership and, as such,<br />
it provides an incomparable venue in which to share perspectives, experiences, and lessons<br />
learned. Many subjects could, and will, benefit from discussion in the pages <strong>of</strong> the <strong>Journal</strong>.<br />
However, I will focus my comments on a subject that is critical to all organizations, but<br />
particularly investigative organizations, around the world. I refer specifically to the challenge<br />
<strong>of</strong> information management.<br />
National safety investigation agencies are universally charged with investigating occurrences<br />
in federally regulated sectors <strong>of</strong> the transportation industry. Their primary objective is to<br />
identify risks and ensure that mistakes are not repeated or that unsafe conditions are not<br />
allowed to persist. To achieve this, the Transportation Safety Board <strong>of</strong> Canada (TSB) has<br />
the sole authority under Canadian law to conduct safety investigations into transportation<br />
occurrences in the rail, marine, air, and pipeline industries, to collect and analyze the<br />
facts, and to convey the resultant information to agents <strong>of</strong> change via such mechanisms as<br />
investigation reports and recommendations. As in most countries, the TSB is not empowered<br />
to direct changes; change decisions and implementation are the purview <strong>of</strong> regulators and<br />
industry itself.<br />
The primary products <strong>of</strong> the TSB are, therefore, information and knowledge. It is critical<br />
that the information it imparts be viewed as credible, comprehensive, and compelling in all<br />
respects in order that those who have the power to implement change will be motivated to<br />
take immediate remedial action. By extension, excellence in how information is gathered,<br />
employed, stored, and distributed is absolutely fundamental to the TSB in the achievement<br />
<strong>of</strong> its mandate.<br />
Over the past several years, our management team has harbored a growing concern that<br />
the information management business practices in use at the TSB were not supporting its<br />
overall objective well. A comprehensive risk assessment confirmed that significant gaps<br />
did, indeed, exist. For example, traditional, paper-based techniques were no longer able to<br />
contend with the proliferation <strong>of</strong> electronic information. The discipline <strong>of</strong> centrally stored
CHARLES H. SIMPSON<br />
and controlled records had been eroded, making it increasingly<br />
difficult to access the right information in a timely manner.<br />
Information technology tools were amassing increasing amounts<br />
<strong>of</strong> information but were not designed to manage it in an<br />
enterprise-wide fashion. In short, technology was contributing<br />
to the problem, not helping to solve it. It was apparent that if<br />
the gaps were not dealt with in a substantive way, the strength<br />
<strong>of</strong> the TSB’s product, quality information, would be weakened,<br />
its credibility would be negatively impacted, and its value to<br />
Canadians would diminish.<br />
The challenge, <strong>of</strong> course, was how to address the problem.<br />
Like most safety investigation agencies, the TSB is relatively<br />
small with modest resources dedicated almost entirely to<br />
supporting day-to-day operations. Any commitment to address<br />
the information management shortcomings in a sustainable<br />
manner would require a substantial deflection <strong>of</strong> human and<br />
financial resources over a protracted period <strong>of</strong> time.<br />
Convinced <strong>of</strong> the long-term imperative, the TSB embarked<br />
upon a project to develop an integrated IM/IT platform to<br />
support the organization and, in particular, our investigation<br />
teams. Known as the TSB <strong>Investigation</strong> Information<br />
Management System (TIIMS), the goal is to implement an<br />
integrated set <strong>of</strong> documents, content, records, cases, workflow,<br />
forms, and project management practices and tools. Another<br />
notable feature <strong>of</strong> the system is the development <strong>of</strong> a Reference<br />
Centre that will consolidate those <strong>of</strong>ten hard-to-find policies,<br />
guidelines, operations manuals, checklists, and other reference<br />
tools into a single area for easier access. Accomplishing this<br />
goal will require a major effort <strong>of</strong> employees who are already<br />
busy with their normal functions. “Buy in,” particularly amongst<br />
managers, and the recognition that people and substantial<br />
financial resources would have to be diverted full-time to this<br />
undertaking, were the two first critical hurdles to overcome.<br />
Indeed, two and a half years into the project, they are never far<br />
from the surface.<br />
Two other fundamental decisions concerned the s<strong>of</strong>tware<br />
tools and the methodology to be employed in the project. The<br />
first was relatively straightforward; a small agency would never<br />
be able to afford development <strong>of</strong> new s<strong>of</strong>tware from the ground<br />
up. A team-oriented plug and play environment was required<br />
and for that, Micros<strong>of</strong>t’s Sharepoint Portal and Services products<br />
were chosen as the foundation pieces.<br />
The change management tool employed is based upon<br />
the use <strong>of</strong> business reference models. These models provide<br />
a common description <strong>of</strong>, and context for, an organization’s<br />
business practices. They are used to facilitate user consultation,<br />
to manage project scope, and to assist in the transition to the<br />
new practices and tools. The effort required to develop and<br />
obtain agreement with these models is considerable but, without<br />
that foundation, the development <strong>of</strong> an integrated information<br />
system would be impossible. In particular, their use leads to a<br />
standardization <strong>of</strong> practices and terminology that can only<br />
strengthen the organization in a variety <strong>of</strong> ways. However, in<br />
the early stages <strong>of</strong> the project, these eventual advantages were<br />
not apparent to everyone and sustaining momentum required<br />
ongoing effort.<br />
The essential problem with our current system is that<br />
automated investigation tools, data systems, document<br />
management, and the various business practices by which<br />
information products are produced and stored are not<br />
connected. This results in multiple entry and information<br />
collation challenges that are not only time consuming but<br />
also create the risk that information will not be available for a<br />
specific requirement at the right time.<br />
The new platform will replace the TSB’s current Intranet and<br />
will comprise a hierarchy <strong>of</strong> gateways or portals and pre-defined<br />
investigation workspaces (figure 1). The gateways will be<br />
primarily information based while the investigation workspaces<br />
will organize and integrate the many tools needed by our<br />
investigation teams. Since it is recognized that the system will<br />
evolve with time, the approach has been to build the system in<br />
modules so elements can be easily added, removed, or modified<br />
and to establish the appropriate governance tools needed to<br />
manage these changes.<br />
As part <strong>of</strong> the development and implementation process,<br />
a series <strong>of</strong> pilots has been undertaken, using real-life<br />
investigations, to validate the new tools. This approach<br />
maximizes input from those for whom the workspaces are being<br />
developed, thereby enhancing the potential for buy-in and<br />
successful implementation. The objective is to have the first<br />
version <strong>of</strong> the new system in operation by the end <strong>of</strong> March<br />
2006. Other modules remain to be developed and incorporated<br />
in the following year(s). Nevertheless, we are confident that<br />
most <strong>of</strong> the critical gaps identified in our risk assessments will<br />
be resolved or significantly remediated by the first operating<br />
version; identified risks will have been substantially reduced.<br />
There is one other key decision that has been required<br />
to optimize the probability <strong>of</strong> success for this project. The<br />
individual accountable for the developmental aspects <strong>of</strong> the<br />
system cannot be expected to also manage the transition to, and<br />
permanent operation <strong>of</strong>, that system. Therefore, the TSB has<br />
assigned those responsibilities to a full-time operations manager,<br />
once again from within current resources. It would be tempting<br />
to ignore this additional commitment simply because <strong>of</strong> its<br />
short-term impact on current activities. However, for an<br />
undertaking as fundamental and far-reaching as this, it would<br />
be unrealistic to assume that once development is “complete,”<br />
transition and steady-state operations would automatically fall<br />
into place.<br />
6 NTSB JOURNAL OF ACCIDENT INVESTIGATION, SPRING 2006; VOLUME 2, ISSUE 1
Since undertaking the TIIMS project, it has become<br />
increasingly apparent to me that many organizations, and not<br />
just those with an investigation mandate, are wrestling with<br />
the same issues as the TSB faces. Most executives recognize<br />
the imperative to address these issues but they are all faced<br />
with the same challenges: time, money, and human resource<br />
constraints. The TSB experience to this point <strong>of</strong>fers some<br />
valuable points to consider and some tangible product elements<br />
that could be applied with relative ease to other organizations.<br />
A recently signed memorandum <strong>of</strong> understanding with the<br />
Australian TSB is an example whereby the TSB’s efforts will be<br />
applied to advantage by another agency with a similar mandate,<br />
objectives, and change imperatives. Furthermore, both agencies<br />
THE AUTHOR<br />
TIMMS<br />
Navigation<br />
Structure<br />
Data<br />
Collection<br />
Workbench<br />
Rail/Pipeline<br />
Marine<br />
Air<br />
Branch<br />
Gateway<br />
Are accessible through related<br />
Rail<br />
Pipeline<br />
Marine<br />
Air<br />
<strong>Investigation</strong><br />
Workspace<br />
Are associated to every<br />
Safety<br />
Analysis<br />
Workbench<br />
TRANSPORTATION SAFETY BOARD OF CANADA INVESTIGATION INFORMATION MANAGEMENT SYSTEM<br />
<strong>Investigation</strong><br />
Services<br />
Gateway<br />
Report<br />
Production<br />
Workbench<br />
TSB<br />
Gateway<br />
<strong>Investigation</strong><br />
Services<br />
Gateway<br />
Are accessible through<br />
Workload<br />
Management<br />
Figure 1.<br />
Corporate<br />
Services<br />
Gateway<br />
Gateways<br />
Provide a point to aggregate<br />
Information across many<br />
workspaces<br />
Governance<br />
Gateway<br />
Workspaces<br />
Central area (or website) for<br />
collaboration on a specific<br />
investigation where all information<br />
related to an investigation is<br />
collected and exchanged<br />
Workbenches<br />
Tabs with the <strong>Investigation</strong><br />
Workspace where specialized tools<br />
and information required for specific<br />
sets <strong>of</strong> activities related to an<br />
investigation are organized<br />
stand to benefit from an ongoing exchange <strong>of</strong> experiences with<br />
the system and developmental activities in the years to come.<br />
The TSB has some way to go before it can declare victory with<br />
its TIIMS project. However, there is a high level <strong>of</strong> confidence<br />
that the organization-wide approach to managing information<br />
will be far superior to the piece meal approach fostered by<br />
the current series <strong>of</strong> independent information systems and<br />
paper-based protocols. We have already accumulated a number<br />
<strong>of</strong> important “lessons learned” that we would be happy to<br />
share with other organizations who have embarked upon or are<br />
considering a similar project.<br />
Once again, I thank the NTSB for this opportunity to share<br />
the TSB’s perspectives on this vitally important subject.<br />
CHARLES H. SIMPSON was appointed to the Transportation Safety Board <strong>of</strong> Canada in 1996 and was the Acting Chairman from<br />
2004 to 200 . Before joining the TSB, he worked for many years for Air Canada, first as a pilot and flight instructor and later in various<br />
corporate positions, including Executive Vice-President, Operations. He also served on the Board <strong>of</strong> Directors <strong>of</strong> the Canadian Air<br />
Line Pilots Association, including a term as President. On January 12, 1988, Captain Simpson established the <strong>of</strong>ficial speed record for<br />
Class C1 Jet Aircraft from Honolulu to Montreal with a Boeing 747 (8 hours, 26 minutes, 09 seconds), for which he was recognized<br />
by the National Aeronautic Association. On November 28, 200 , the Safety Board commemorated Captain Simpson’s retirement<br />
from the TSB with a Special Recognition Award.<br />
NTSB JOURNAL OF ACCIDENT INVESTIGATION, SPRING 2006; VOLUME 2, ISSUE 1 7
Investigative Techniques<br />
Materials Examination <strong>of</strong> the Vertical Stabilizer from<br />
American Airlines Flight 87<br />
Matthew R. Fox and Carl R. Schultheisz, National Transportation Safety Board<br />
James R. Reeder and Brian J. Jensen, NASA Langley Research Center<br />
ABSTRACT<br />
The first in-flight failure <strong>of</strong> a primary structural component made from composite material<br />
on a commercial airplane led to the crash <strong>of</strong> American Airlines flight 87. As part <strong>of</strong> the<br />
National Transportation Safety Board investigation <strong>of</strong> the accident, the composite materials<br />
<strong>of</strong> the vertical stabilizer were tested, microstructure was analyzed, and fractured composite<br />
lugs that attached the vertical stabilizer to the aircraft tail were examined. This paper<br />
discusses the materials testing and analysis, the composite fractures, and resulting clues to<br />
the failure events.<br />
INTRODUCTION<br />
On November 12, 2001, shortly after American Airlines flight 87 took <strong>of</strong>f from Kennedy<br />
International Airport, the composite vertical stabilizer and rudder separated from the<br />
fuselage, rendering the airplane uncontrollable. The Airbus A300-600 airplane crashed into<br />
a neighborhood in Belle Harbor, New York, killing all 260 persons aboard the airplane and<br />
persons on the ground. This accident was unique in part because it was the first time<br />
a primary structural component fabricated from composite materials failed in flight on a<br />
commercial airplane.<br />
As a result <strong>of</strong> its nearly 3-year-long investigation <strong>of</strong> the accident, the National Transportation<br />
Safety Board determined that the probable cause <strong>of</strong> the accident was “the in-flight separation<br />
<strong>of</strong> the vertical stabilizer as a result <strong>of</strong> the loads beyond ultimate design that were created<br />
by the first <strong>of</strong>ficer’s unnecessary and excessive rudder pedal inputs. Contributing to these<br />
rudder pedal inputs were characteristics <strong>of</strong> the Airbus A300-600 rudder system design and<br />
elements <strong>of</strong> the American Airlines Advanced Aircraft Maneuvering Program.” 1<br />
1 National Transportation Safety Board, In-Flight Separation <strong>of</strong> Vertical Stabilizer, American Airlines Flight 587,<br />
Airbus Industrie A300-605R, Belle Harbor, New York, November 12, 2001, Aircraft <strong>Accident</strong> Report<br />
NTSB/AAR-04/04 (NTSB Public Docket, 2004).<br />
NTSB JOURNAL OF ACCIDENT INVESTIGATION, SPRING 2006; VOLUME 2, ISSUE 1 9
MATTHEW R. FOX, CARL R. SCHULTHEISZ, JAMES R. REEDER, AND BRIAN J. JENSEN<br />
Analysis <strong>of</strong> the flight data recorder revealed that the airplane<br />
had performed a series <strong>of</strong> yawing maneuvers in the seconds before<br />
separation <strong>of</strong> the vertical stabilizer, and that the separation <strong>of</strong><br />
the vertical stabilizer occurred while the airplane was pointed to<br />
the left <strong>of</strong> its flight path. This orientation would have produced<br />
a bending moment on the vertical stabilizer, leading to tension<br />
on the right-side attachments and compression on the left.<br />
Most <strong>of</strong> the separated pieces <strong>of</strong> the vertical stabilizer and<br />
rudder were recovered from the water <strong>of</strong> Jamaica Bay, some<br />
distance from the main crash site. The vertical stabilizer was<br />
largely intact, and had separated from the fuselage by fractures<br />
at the lower end where it had been connected to the fuselage.<br />
Although a detailed examination <strong>of</strong> the rudder was completed<br />
during the accident investigation, early indications from the<br />
performance analysis <strong>of</strong> the flight recorder data indicated<br />
that the rudder performed as designed through the accident<br />
sequence until the vertical stabilizer separated from the fuselage,<br />
and loads analysis indicated that the vertical stabilizer would<br />
fail before the rudder. Thus, investigators determined that<br />
the rudder failure was secondary to the failure <strong>of</strong> the vertical<br />
stabilizer. As part <strong>of</strong> the overall investigation into the accident,<br />
investigators examined and tested the composite materials <strong>of</strong><br />
the vertical stabilizer and conducted a detailed examination <strong>of</strong><br />
the fractures in the vertical stabilizer to determine the failure<br />
mechanism and direction <strong>of</strong> fracture propagation, where<br />
possible. The possibilities <strong>of</strong> pre-existing damage, fatigue<br />
cracking, or inadequacies in the manufacturing process were<br />
also addressed.<br />
Using accident loads derived from analysis <strong>of</strong> recorded flight<br />
data, three lug tests were conducted on vertical stabilizer aft lugs<br />
from an unused skin panel and from another airplane. Fracture<br />
patterns for these three test specimens were compared to the<br />
corresponding structure on the accident airplane.<br />
This paper describes the structure <strong>of</strong> the vertical stabilizer, the<br />
results <strong>of</strong> the materials testing and microstructural examination,<br />
fractography <strong>of</strong> the vertical stabilizer, and how the results led<br />
investigators to understand the failure. The paper also presents<br />
fractographic examination results for the three lug tests and<br />
significance <strong>of</strong> the fracture features.<br />
DESCRIPTION OF THE STRUCTURE<br />
Development <strong>of</strong> the Airbus A300-600 model began in 1980,<br />
and certification occurred in 1984. The accident airplane was<br />
delivered new to American Airlines in 1988.<br />
Vertical Stabilizer Structure<br />
An internal view <strong>of</strong> the vertical stabilizer is shown in figure 1.<br />
The vertical stabilizer for the Airbus A300-600 series airplane<br />
is a stiffened box with removable leading edge fairings and<br />
trailing edge panels. The stiffened box consists <strong>of</strong> two integrally<br />
stiffened skin panels for the left and right sides, spars for the<br />
forward and aft sides, and closure ribs at the upper and lower<br />
ends. The integral stiffeners in the skin panels consist <strong>of</strong><br />
Figure 1. Airbus A300-600 vertical stabilizer construction. The vertical stabilizer and rudder for this model airplane, which has a symmetric airfoil shape,<br />
are 27 feet 3 inches tall and from leading edge to trailing edge, 25 feet wide at the base, and 10 feet 2 inches wide at the tip. The vertical stabilizer and<br />
rudder were made almost entirely <strong>of</strong> composite materials, including the composite lugs at the six main attachment locations for connecting the vertical<br />
stabilizer to the fuselage.<br />
10 NTSB JOURNAL OF ACCIDENT INVESTIGATION, SPRING 2006; VOLUME 2, ISSUE 1
24 “I”-shaped stringers that span the length <strong>of</strong> the stabilizer,<br />
parallel to the aft spar. Internal stiffeners for the box consist<br />
<strong>of</strong> a center spar at the lower end <strong>of</strong> the span and 16 ribs, not<br />
including the two closure ribs. The components <strong>of</strong> the box are<br />
riveted together, and the leading edge fairings and trailing edge<br />
panels are attached with threaded fasteners.<br />
Except for the fasteners, lightning protection strips, and<br />
trailing edge panel support frames, the vertical stabilizer is<br />
made entirely <strong>of</strong> composite materials. The stiffened box <strong>of</strong><br />
the vertical stabilizer is a solid carbon-fiber reinforced polymer<br />
(CFRP) laminate composed <strong>of</strong> T300 carbon fibers in a CIBA<br />
913 epoxy matrix. The laminate includes both unidirectional<br />
tape and eight-harness satin fabric layers in the construction.<br />
The zero-degree fibers <strong>of</strong> the fabric and tape layers in the<br />
composite run parallel to the stringers and the aft spar, which<br />
are at a 33.3-degree angle aft <strong>of</strong> vertical. The leading edge<br />
fairings and the trailing edge panels are sandwich composites<br />
having a Nomex® honeycomb core with glass-fiber reinforced<br />
polymer (GFRP) facesheets for the leading edge fairings and<br />
both GFRP and CFRP facesheets for the trailing edge panels.<br />
The vertical stabilizer is attached to the fuselage primarily<br />
by six CFRP lugs (main lugs) on the lower end <strong>of</strong> the vertical<br />
stabilizer, three on either side. These lugs connect by bolts<br />
approximately 2 inches in diameter to six metal clevis fittings<br />
on the fuselage.<br />
Figure 2 shows a cross-section <strong>of</strong> a typical main-lug assembly.<br />
After the assembly is cured during manufacturing, the lug<br />
attachment boltholes are core-drilled out. At the thickest<br />
point, the forward main lugs are approximately 1.62 inches<br />
thick, the center lugs, approximately 2.48 inches thick, and<br />
the aft lugs, approximately 2.17 inches thick. The aft lugs<br />
alone are composed <strong>of</strong> more than 170 layers <strong>of</strong> fabric and tape:<br />
approximately 0 percent, ±4 -degree fabric; 2 percent,<br />
0/90-degree fabric; and 2 percent, 0-degree tape. The thickness<br />
<strong>of</strong> each lug decreases as plies are dropped in the lug-to-skin<br />
transition area. The skin layers are made <strong>of</strong> ±4 -degree fabric.<br />
The I-shaped stringers have 0-degree tape at the caps and<br />
±4 -degree fabric in the web.<br />
MATERIALS TESTING AND<br />
MICROSTRUCTURAL EXAMINATION<br />
Materials Testing<br />
The materials testing and microstructural examination<br />
<strong>of</strong> samples from the accident vertical stabilizer were<br />
completed primarily at the National Aeronautics and Space<br />
Administration’s Langley Research Center (NASA Langley) in<br />
MATERIALS EXAMINATION OF THE VERTICAL STABILIZER FROM AMERICAN AIRLINES FLIGHT 87<br />
Hampton, Virginia. In addition, some testing and microscopy<br />
were completed at Airbus Industrie in Bremen, Germany. 2<br />
Samples were selected from multiple locations on the vertical<br />
stabilizer for materials testing and microscopic examination to<br />
determine chemical composition, extent <strong>of</strong> cure, glass transition<br />
temperature (Tg), fiber and void volume fractions, and ply<br />
stacking sequence (layup). (See table 1.)<br />
Samples from each area were tested using differential scanning<br />
calorimetry (DSC) and infrared spectroscopy (IR). Samples<br />
from one area were tested using dynamic mechanical analysis<br />
(DMA) and modulated differential scanning calorimetry<br />
(MDSC). The fiber volume fraction, void volume fraction,<br />
and layup in each area were determined using microscopic<br />
examination <strong>of</strong> polished cross-sections, described later in this<br />
paper.<br />
Figure 2. Cross-section <strong>of</strong> main lug assembly. Each lug contains two<br />
separate pieces that are cured separately before the final assembly. In<br />
the final assembly, the outer precured half is laid down, followed in order<br />
by the skin layers, the inner precured half, the compensation layers, the<br />
rib 1 attach flange, the stringer outer flange (tape) layers, and the stringer<br />
module layers. The boltholes are drilled after the assembly is cured.<br />
2 National Transportation Safety Board, Materials Laboratory Factual<br />
Report 02-082, NTSB Public Docket, 2002.<br />
NTSB JOURNAL OF ACCIDENT INVESTIGATION, SPRING 2006; VOLUME 2, ISSUE 1 11
MATTHEW R. FOX, CARL R. SCHULTHEISZ, JAMES R. REEDER, AND BRIAN J. JENSEN<br />
According to Airbus, the curing temperature for the CFRP<br />
laminate was specified to be 2 0 degrees Fahrenheit. According<br />
to Airbus material qualification data, the onset glass transition<br />
temperature (Tg-onset) was 144 degrees Celsius in the dry<br />
condition and 122 degrees Celsius after exposure to a climate<br />
<strong>of</strong> 0 percent relative humidity (corresponding to a moisture<br />
content <strong>of</strong> 0.7 weight percent). According to the engineering<br />
drawings, the fiber volume fraction for the CFRP laminate was<br />
60% ± 4%. The maximum volume fraction porosity permitted<br />
in the cross-section was 2. percent.<br />
The chemical composition <strong>of</strong> samples from each area was<br />
assessed using IR spectroscopy; results were typical for this<br />
composite material with no significant variances in the spectra<br />
for each specimen.<br />
The extent <strong>of</strong> cure and the Tg <strong>of</strong> the sample from the upper<br />
end <strong>of</strong> the right skin panel were analyzed using MDSC, DMA,<br />
and DSC. Portions <strong>of</strong> this sample were tested in the as-received<br />
condition and after drying. The moisture content for the<br />
as-received condition was approximately 0. 8 percent.<br />
•<br />
•<br />
Table 1. Fifteen samples were selected from both damaged and undamaged areas<br />
on the accident airplane vertical stabilizer.<br />
Area Number <strong>of</strong> samples Damaged Undamaged<br />
Right skin panel, near the aft spar 4 X<br />
Left skin panel, near the forward spar 3 X<br />
Right aft lug 1 X<br />
Right forward lug 1 X<br />
Left forward lug 1 X<br />
Forward spar 1 X<br />
Center spar 1 X<br />
Aft spar 1 X<br />
Rib 1 1 X<br />
Rib 3 1 X<br />
The MDSC results showed an average residual heat<br />
value <strong>of</strong> 4. joules per gram, which corresponded to<br />
an extent <strong>of</strong> cure that was greater than 97 percent.<br />
The DMA results showed that in the as-received<br />
condition, the Tg-onset measured 134 degrees Celsius,<br />
which was between the qualification values <strong>of</strong> 144<br />
degrees Celsius for the dry condition and 122 degrees<br />
Celsius for the 0 percent relative humidity (0.7<br />
percent moisture content) condition. The portion <strong>of</strong><br />
sample from the upper end <strong>of</strong> the right skin panel that<br />
was tested in the dry condition had a Tg-onset <strong>of</strong> 149<br />
degrees Celsius.<br />
•<br />
The extent <strong>of</strong> cure and the Tg <strong>of</strong> each sample,<br />
including the sample from the upper end <strong>of</strong> the right<br />
skin panel, were assessed using DSC. Results among<br />
all samples showed no significant variance, indicating<br />
that the extent <strong>of</strong> cure for each sample was sufficient.<br />
MICROSTRUCTURAL EXAMINATION AND<br />
QUANTITATIVE ANALYSIS<br />
Sections <strong>of</strong> each sample were cut, mounted, and polished<br />
for microstructural examination and quantitative analysis.<br />
Cross-sections from the vertical stabilizer were prepared<br />
and analyzed at NASA Langley and at Airbus. A typical<br />
cross-sectional view is shown in figure 3 for a sample from the<br />
lower end <strong>of</strong> the right skin panel.<br />
Results <strong>of</strong> the microstructural examination and analysis<br />
indicated that the composite structure <strong>of</strong> the vertical stabilizer<br />
was constructed to the desired fiber volume fraction with<br />
acceptable void content. No evidence <strong>of</strong> microcracking was<br />
observed. The observed layups were compared to the engineering<br />
drawings obtained from the manufacturer and, among the 1<br />
samples, only one sample from the right forward lug showed any<br />
discrepancies. Within the 124 layers <strong>of</strong> this sample, two layers<br />
had orientations that were different from the drawing. Also,<br />
two layers appeared to be missing from one position through<br />
the thickness, but two additional layers were present at another<br />
position. The total number <strong>of</strong> layers for each orientation in the<br />
right forward lug was correct, and the discrepancies represented<br />
a small fraction <strong>of</strong> the total number <strong>of</strong> layers.<br />
12 NTSB JOURNAL OF ACCIDENT INVESTIGATION, SPRING 2006; VOLUME 2, ISSUE 1
Fractographic Examination Procedures and Challenges<br />
For most common airplane structural metals, visual<br />
inspection or low-power magnification is <strong>of</strong>ten sufficient to<br />
determine fracture mechanism and direction. For metals, the<br />
fracture plane, surface roughness, radial marks, chevrons, shear<br />
lips, and general deformation all provide macroscopic clues to<br />
the fracture mechanisms, direction <strong>of</strong> fracture propagation,<br />
and relative motion <strong>of</strong> mating surfaces. Preexisting cracks in<br />
metals <strong>of</strong>ten show staining or changes in color associated with<br />
corrosion. 4 Using these clues, experienced investigators can<br />
examine large areas <strong>of</strong> damaged structure relatively quickly to<br />
identify fracture origins and areas requiring closer inspection.<br />
However, composites by their nature present their own<br />
set <strong>of</strong> challenges. Visual clues to preexisting fractures, such<br />
as flat fracture surfaces with curving boundaries or staining<br />
from corrosion, which are easy to see in structural metals, are<br />
in general not as visible in composites. Furthermore, visual<br />
cues to fracture propagation direction that are sometimes<br />
apparent in composite structures, such as crack branching in<br />
translaminar fractures (fractures that break fibers) or banding<br />
in delaminations (fractures between layers), were not apparent<br />
in many <strong>of</strong> the fractures <strong>of</strong> interest on the accident airplane.<br />
Because visual cues were not present in many <strong>of</strong> the fractures,<br />
3 Fractography is the examination <strong>of</strong> fracture surfaces and adjacent areas<br />
to determine conditions that caused the fracture. See ASM Handbook,<br />
Volume 11: Failure Analysis and Prevention, eds. W.T. Becker and R.J.<br />
Shipley, ASM International, 2002.<br />
4 K. Mills and others, eds., Fractography, ASM Handbook Vol. 12 (ASM<br />
International: Metals Park, Ohio, 1987).<br />
MATERIALS EXAMINATION OF THE VERTICAL STABILIZER FROM AMERICAN AIRLINES FLIGHT 87<br />
two 45-degree fabric layers<br />
two zero-degree tape layers<br />
stringer outer flange layers<br />
(zero-degree tape)<br />
Figure 3. Microstructure <strong>of</strong> sample RS1. The cross-section shown is in a plane that is oriented parallel to the<br />
plus or minus 45-degree fiber direction. Fiber and void content were determined using computer optical image<br />
analysis <strong>of</strong> polished micrographs. The layup in each sample was determined from optical micrographs <strong>of</strong> the<br />
specimens that were assembled into mosaics like the one shown here.<br />
the composite fractures in the accident airplane required an<br />
especially time-consuming examination because the area to<br />
be examined using high magnification was substantially larger<br />
than what is typically required for overstress fractures <strong>of</strong> similar<br />
metal structures.<br />
Investigators first conducted a visual inspection <strong>of</strong> the<br />
translaminar fractures and delaminations. This examination<br />
included mapping the fractures to help determine fracture<br />
propagation directions from crack branching patterns, recording<br />
features indicating translaminar fracture under tension or<br />
compression, and, in the delaminations, identifying any visual<br />
cues to changes in fracture mechanism or mode.<br />
Using results <strong>of</strong> the visual examination as a guide, investigators<br />
used scanning electron microscopy (SEM) to determine the<br />
fracture mechanism and fracture propagation direction on the<br />
translaminar fractures and on the delamination surfaces, and<br />
to identify the layers involved, fracture mechanisms, modes <strong>of</strong><br />
fracture, and propagation directions. The SEM examination also<br />
enabled investigators to distinguish between fatigue fractures<br />
and preexisting cracks, which may appear similar during a visual<br />
examination. Results <strong>of</strong> the SEM examination were used to<br />
check construction <strong>of</strong> the vertical stabilizer and rudder against<br />
the manufacturing drawings and to determine how the fractures<br />
related to the loading <strong>of</strong> the overall structure.<br />
Two samples, one from each <strong>of</strong> the two large delaminations,<br />
were not cleaned, and were examined first in order to explore<br />
R.J. Kar, “Atlas <strong>of</strong> Fractographs,” in Composite Failure Analysis Handbook<br />
Volume 2: Technical Handbook (Northrop Corporation, Aircraft Division,<br />
1992).<br />
NTSB JOURNAL OF ACCIDENT INVESTIGATION, SPRING 2006; VOLUME 2, ISSUE 1 13
MATTHEW R. FOX, CARL R. SCHULTHEISZ, JAMES R. REEDER, AND BRIAN J. JENSEN<br />
the surface for matrix rollers (pieces <strong>of</strong> fractured matrix<br />
material rolled into cylindrical shapes by the relative motion <strong>of</strong><br />
the fracture surface during cyclic loading), which would have<br />
indicated fatigue. Fracture surfaces <strong>of</strong> the remaining samples<br />
were cleaned ultrasonically in water before being coated with a<br />
conductive layer <strong>of</strong> gold and palladium. 6 Typically, delamination<br />
samples about 2 inches square were taken from widely spaced<br />
areas on the exposed fracture surfaces in an effort to identify<br />
overall trends. (See table 1.) Samples were also taken from<br />
areas where the delamination surface morphology changed<br />
(mostly at the ends <strong>of</strong> plies in the lay-up) to explore for local<br />
differences in stress state or crack propagation direction.<br />
Investigators took more than 300 SEM photographs <strong>of</strong><br />
translaminar fractures in the main attachment areas <strong>of</strong> the<br />
vertical stabilizer and examined more than 1 0 square inches<br />
<strong>of</strong> the delamination surfaces at high magnification. For<br />
translaminar fractures intersecting the lug attachment hole, they<br />
examined the entire fracture surface at high magnification, and<br />
for translaminar fractures above the lugholes, they examined<br />
several inches <strong>of</strong> the total extent <strong>of</strong> the fracture.<br />
One challenge facing investigators during the fractographic<br />
analysis was the relatively small amount <strong>of</strong> reference material<br />
dealing specifically with fractographic examination <strong>of</strong><br />
fabric-reinforced composites. Most <strong>of</strong> the literature describing<br />
fractography <strong>of</strong> composites focuses on unidirectional tape<br />
lay-ups. However, fabrics have unique characteristics, such as<br />
variation in resin content on delamination surfaces and less<br />
fiber pullout in translaminar fractures relative to tape-reinforced<br />
materials, as investigators found in the accident airplane. For<br />
example, in the unidirectional lay-ups reported in the literature,<br />
river marks were typically only observed in Mode I (opening<br />
displacement between fracture faces) loading. However, in the<br />
fabric construction <strong>of</strong> the accident airplane where evidence <strong>of</strong><br />
Mode II (sliding displacement between fracture faces) loading<br />
was observed, river marks were also found in the matrix-rich<br />
areas near the bundle crossings, and in the base <strong>of</strong> hackles 7 where<br />
a bundle at one orientation transitioned to a perpendicular<br />
crossing bundle. River marks in the bundle crossings were used<br />
to identify a general direction <strong>of</strong> fracture propagation upward<br />
and aftward for both <strong>of</strong> the large delaminations (at the forward<br />
left and aft left attachments). (Investigators also explored the<br />
river marks at the base <strong>of</strong> the hackles during their examination<br />
6 A. Sjögren, L.E. Asp, and E.S. Greenhalgh, Interlaminar Crack Propagation<br />
in CFRP: Effects <strong>of</strong> Temperature and Loading Conditions on Fracture<br />
Morphology and Toughness, in Composite Materials: Testing and Design, and<br />
Acceptance Criteria ASTM STP 1416, Nettles and Zureick, eds., 2002.<br />
7 “Hackles are matrix fracture features that indicate a significant<br />
component <strong>of</strong> shear across the fracture surface. Hackles are formed<br />
when matrix microcracks that are spaced fairly regularly along planes <strong>of</strong><br />
maximum tension join together.” National Transportation Safety Board,<br />
In-Flight Separation <strong>of</strong> Vertical Stabilizer, Aircraft <strong>Accident</strong> Report NTSB/<br />
AAR-04/04, NTSB Public Docket (Washington, DC: NTSB, 2004).<br />
<strong>of</strong> the delaminations at the forward right lug as described later<br />
in this paper.) Because manufacturers are increasing their use<br />
<strong>of</strong> composites with fabric reinforcements in airplane structures,<br />
more research is needed to characterize fracture surfaces<br />
generated under controlled laboratory conditions to help failure<br />
analysts in interpreting fractographic details.<br />
Fracture Surface Observations and Discussion<br />
During the visual examination, investigators found that the<br />
vertical stabilizer was largely intact with no significant areas <strong>of</strong><br />
skin buckling. An overall view <strong>of</strong> the vertical stabilizer as it<br />
was being recovered from the water <strong>of</strong> Jamaica Bay is shown in<br />
figure 4. At the lower end, each <strong>of</strong> the six attachment locations<br />
had separated from the fuselage either by fractures that<br />
intersected the lug attachment hole or by fractures through the<br />
structure above the hole. A schematic <strong>of</strong> the lower end <strong>of</strong> the<br />
vertical stabilizer is shown in figure , which shows a general<br />
fracture location for each lug, pointing to overall views <strong>of</strong> each<br />
lug fracture. Portions <strong>of</strong> rib 1, the rib 1 rib-to-skin attach angle,<br />
and the lower end <strong>of</strong> the forward spar also were fractured. In<br />
addition, the trailing edge panels were damaged in several<br />
locations. 8<br />
Description <strong>of</strong> Main Lug Fractures<br />
Translaminar fractures on the right aft, right forward, and left<br />
forward main lugs intersected the attachment hole. For the<br />
remaining three main lugs, translaminar fractures intersected<br />
the structure above the lug. Each <strong>of</strong> the lugs had delaminations<br />
in the lug area and/or in the structure above the lug. Safety<br />
Board Materials Laboratory factual reports contain details <strong>of</strong><br />
the fractographic examination. 9 Some <strong>of</strong> the delaminations<br />
extended into the main portion <strong>of</strong> the vertical stabilizer,<br />
and the extent <strong>of</strong> these delaminations was determined using<br />
nondestructive inspection (NDI), including ultrasonic<br />
inspection and x-ray-computed tomography scanning and<br />
imaging. Safety Board Materials Laboratory factual reports<br />
contain the results <strong>of</strong> the NDI. 10<br />
MACROSCOPIC FRACTURE FEATURES<br />
On the right side <strong>of</strong> the vertical stabilizer, the roughness <strong>of</strong> the<br />
main lug translaminar fractures was in general consistent with<br />
overstress fracture in primarily tensile loading. Delaminations<br />
8 National Transportation Safety Board, Materials Laboratory Factual Report<br />
02-083, NTSB Public Docket, 2002.<br />
9 (a) NTSB, Materials Laboratory Factual Report 02-083, NTSB Public<br />
Docket, 2002; (b) NTSB, Materials Laboratory Factual Report 03-018,<br />
NTSB Public Docket, 2003.<br />
10 (a) NTSB, Materials Laboratory Factual Report 02-078, NTSB Public<br />
Docket, 2002; (b) NTSB, Materials Laboratory Factual Report 03-033,<br />
NTSB Public Docket, 2003.<br />
14 NTSB JOURNAL OF ACCIDENT INVESTIGATION, SPRING 2006; VOLUME 2, ISSUE 1
MATERIALS EXAMINATION OF THE VERTICAL STABILIZER FROM AMERICAN AIRLINES FLIGHT 87<br />
Figure 4. Vertical stabilizer as recovered from Jamaica Bay.<br />
Figure 5. Overall views <strong>of</strong> main lug fractures with relative locations on vertical stabilizer.<br />
NTSB JOURNAL OF ACCIDENT INVESTIGATION, SPRING 2006; VOLUME 2, ISSUE 1 1
MATTHEW R. FOX, CARL R. SCHULTHEISZ, JAMES R. REEDER AND BRIAN J. JENSEN<br />
were observed at the edges <strong>of</strong> each lug on the right side. The<br />
extent <strong>of</strong> the delaminations as determined using NDI was<br />
limited to within the fractured lugs or within approximately<br />
4 inches <strong>of</strong> a translaminar fracture.<br />
The right aft lug failed by translaminar fracture through the<br />
bolthole, as shown in figure 6. The rough appearance <strong>of</strong> the<br />
translaminar fracture surfaces was consistent with fractures<br />
under primarily tensile loading. Fractures on each leg <strong>of</strong> the<br />
lug were on different translaminar planes, and the change in<br />
planes occurred near the center <strong>of</strong> the lug thickness. On the<br />
aft side <strong>of</strong> the bolthole, the outboard side <strong>of</strong> the fracture was in<br />
a plane nearly perpendicular to the 0-degree fiber direction, and<br />
the inboard side <strong>of</strong> the fracture was in a plane approximately<br />
parallel to the 4 -degree fiber direction. On the forward side<br />
<strong>of</strong> the bolthole, the outboard side <strong>of</strong> the fracture was in a plane<br />
approximately parallel to the 0-degree fiber direction, and the<br />
inboard side <strong>of</strong> the fracture was in a plane nearly parallel to<br />
rib 1. Bearing damage was observed at the bore surface near<br />
both fracture surfaces, as indicated by white unlabeled arrows<br />
in figure 6.<br />
The right center lug failed above the bolthole in the<br />
lug-to-skin transition area above rib 1. Translaminar fracture<br />
features were relatively rough, consistent with overstress<br />
fracture under tensile loading.<br />
Fractures on the right forward lug intersected the lughole.<br />
Translaminar fracture features were relatively rough, consistent<br />
with overstress fracture under tensile loading. Some evidence<br />
<strong>of</strong> local compressive loading was observed near the aft side <strong>of</strong><br />
the lug, indicating that fracture first occurred at the forward<br />
side <strong>of</strong> the lug, allowing the lower ligament to hinge toward the<br />
aft side <strong>of</strong> the lug.<br />
The rough appearance <strong>of</strong> the main lug translaminar fractures<br />
on the left side <strong>of</strong> the vertical stabilizer was also consistent<br />
with overstress fracture in primarily tensile loading, but the<br />
fractures also showed indications <strong>of</strong> bending to the left. The<br />
left forward lug had multiple delaminations in the lug area, and<br />
an impression on the left side corresponded to contact with the<br />
fuselage attachment clevis. This impression indicated that the<br />
left skin panel <strong>of</strong> the vertical stabilizer bent to the left, damage<br />
that can only be explained if the right side skin panel was already<br />
separated from the fuselage. The left forward lug also had a<br />
delamination that extended upward into the structure, up to<br />
43 inches from the lower end <strong>of</strong> the vertical stabilizer. The left<br />
center lug showed compression fracture features at the outboard<br />
side <strong>of</strong> the translaminar fracture, consistent with bending loads<br />
Looking Forward 2 in.<br />
Looking Aft<br />
Figure 6. Right aft lug translaminar fractures (pictured from below the lug), which failed through the bolthole.<br />
16 NTSB JOURNAL OF ACCIDENT INVESTIGATION, SPRING 2006; VOLUME 2, ISSUE 1
to the left. The left aft lug had delaminations extending up to<br />
37 inches from the lower end <strong>of</strong> the vertical stabilizer. Multiple<br />
delaminations through the thickness were present in the<br />
lug-to-skin transition area, allowing most <strong>of</strong> the precured halves<br />
<strong>of</strong> the lug to separate from the rest <strong>of</strong> the structure.<br />
MICROSCOPIC FRACTURE FEATURES<br />
This section describes the investigators findings based<br />
on the SEM examination <strong>of</strong> the translaminar fractures and<br />
delaminations.<br />
On the translaminar fractures, the ends <strong>of</strong> some fibers<br />
were oriented roughly perpendicular to the fracture plane.<br />
A typical SEM view <strong>of</strong> these fiber ends is shown in figure 7.<br />
Fiber ends like these were examined to help determine the<br />
fracture mechanism and propagation direction. For fibers with<br />
radial patterns indicative <strong>of</strong> tensile fracture, the local fracture<br />
propagation direction could be determined from the direction<br />
<strong>of</strong> the radial pattern <strong>of</strong> several fibers. 11 General directions <strong>of</strong><br />
fracture propagation for the translaminar fractures could then<br />
be determined by averaging the directions indicated by the radial<br />
patterns across many areas <strong>of</strong> the fracture surfaces. In addition,<br />
because fatigue and overstress fractures can appear similar when<br />
examined visually, the microscopic examination also looked for<br />
evidence <strong>of</strong> fatigue, such as rounded edges on fiber ends 12 or<br />
striations in the matrix. 13 However, no evidence <strong>of</strong> fatigue was<br />
observed on any <strong>of</strong> the translaminar fracture surfaces.<br />
Although fiber end fractures for fibers oriented perpendicular<br />
to the fracture plane generally showed radial fracture features<br />
consistent with fracture under tensile loading, the fiber ends in<br />
an area near the outboard surface <strong>of</strong> the left center lug were<br />
different, showing chop marks (lines across the fractured fiber<br />
ends) indicative <strong>of</strong> local compressive loading. Examples <strong>of</strong> these<br />
chop marks can be seen in figure 8 on the fiber ends marked<br />
with a “C.” The combination <strong>of</strong> tension on the inside edge<br />
and compression on the outboard surface was associated with<br />
an overall lug bending to the left. Using the radial patterns on<br />
the lug translaminar fractures, investigators determined that<br />
fracture propagation directions extended outward from the lug<br />
hole bored for the right forward, left forward, and right aft lugs<br />
(all lugs with fractures intersecting the lug hole). For the right<br />
center lug, fracture propagated from aft to forward, and for the<br />
left center and left aft lugs, fracture propagated from forward<br />
to aft.<br />
11 (a) D. Purslow, Matrix Fractography Of Fibre-Reinforced Thermoplastics, Part<br />
2. Shear Failures. Composites Vol. 19, 1988; (b) P.L. Stumpff, Fractography,<br />
in ASM Handbook, Vol. 21: Composites. 2001. pp. 977-987.<br />
12 P.L., Stumpff, personal communication, 2002.<br />
13 (a) Sjögren, Asp, and Greenhalgh, Interlaminar Crack Propagation in<br />
CFRP; (b) Stumpff, Fractography; (c) J.F. Mandell, Fatigue Behavior <strong>of</strong> Short<br />
Fiber Composite Materials, in Fatigue and Fracture <strong>of</strong> Composite Materials,<br />
K.L. Reifsnider, Editor. 1990, Elsevier, pp. 231-337.<br />
MATERIALS EXAMINATION OF THE VERTICAL STABILIZER FROM AMERICAN AIRLINES FLIGHT 87<br />
Figure 7. SEM photograph showing crack in the fractured carbon fibers.<br />
Radial patterns indicate tensile fractures and were used to determine<br />
the general direction <strong>of</strong> fracture propagation. Arrows indicate fracture<br />
direction in individual fibers that were averaged to determine direction at<br />
this location.<br />
Figure 8. Fractured carbon fibers showing compression chop marks (C).<br />
Arrows indicate fracture propagation in fibers with radial patterns.<br />
NTSB JOURNAL OF ACCIDENT INVESTIGATION, SPRING 2006; VOLUME 2, ISSUE 1 17
MATTHEW R. FOX, CARL R. SCHULTHEISZ, JAMES R. REEDER, AND BRIAN J. JENSEN<br />
Samples <strong>of</strong> the delamination fracture surfaces were examined<br />
in the scanning electron microscope to determine the<br />
orientation <strong>of</strong> the shear stress at the fracture and to identify<br />
the direction <strong>of</strong> crack propagation. Fracture features that were<br />
used to make these determinations included hackles (thin<br />
plates <strong>of</strong> fractured matrix material between fibers oriented<br />
perpendicular to the fiber axis, with free edges that point in<br />
a general direction opposite to the local shear applied at the<br />
fracture surface) 14 and river marks (related to the initiation <strong>of</strong><br />
matrix cracks that coalescence into larger cracks, indicating<br />
the direction <strong>of</strong> propagation). 1 A typical view <strong>of</strong> hackles and<br />
river marks observed on one <strong>of</strong> the delaminations is shown in<br />
figure 9. The fracture surfaces were carefully examined for<br />
indications <strong>of</strong> fatigue crack propagation, such as striations in<br />
the fiber impressions in the matrix, 16 matrix rollers, 17 or rubbed<br />
hackle formations 18 ; however, no evidence <strong>of</strong> fatigue was<br />
observed on any <strong>of</strong> the delamination surfaces.<br />
Figure 9. Typical fracture features observed<br />
on delamination fracture surfaces.<br />
14 (a) S. Singh and E. Greenhalgh, “Micromechanisms <strong>of</strong> Interlaminar<br />
Fracture in Carbon-Epoxy Composites at Multidirectional Ply Interfaces,”<br />
4th International Conference on Deformation & Fracture <strong>of</strong> Composites<br />
(Manchester, UK: UMIST, 1998); (b) M.F. Hibbs and W.L. Bradley,<br />
“Correlations Between Micromechanical Failure Processes and the<br />
Delamination Toughness <strong>of</strong> Graphite/Epoxy Systems,” Fractography <strong>of</strong><br />
Modern Engineering Materials: Composites and Metals, ASTM STP 948,<br />
J.E. Masters and J.J. Au, eds.(American Society for Testing and Materials:<br />
Philadelphia: 1987), pp. 68-97.<br />
1 Kar, Atlas <strong>of</strong> Fractographs.<br />
16 (a) Sjögren, Asp, and Greenhalgh, Interlaminar Crack Propagation in<br />
CFRP; (b) P.L. Stumpff, “Fractography,” pp. 977-987.<br />
17 (a) Sjögren, Asp, and Greenhalgh, Interlaminar Crack Propagation in<br />
CFRP; (b) P.L. Stumpff, “Fractography,” pp. 977-987.<br />
18 Sjögren, Asp, and Greenhalgh, Interlaminar Crack Propagation in CFRP.<br />
Hackles that form in CFRP laminates line up perpendicular<br />
to the fiber axes, so the hackles in the orthogonal bundles <strong>of</strong> the<br />
woven fabric would generally point in two orthogonal directions.<br />
In some cases, the superimposed imprints <strong>of</strong> unidirectional tape<br />
oriented at a 4 -degree angle to those bundles added hackles<br />
at a third direction. Hackles also point generally opposite the<br />
locally applied shear at the fracture surface, so the multiple<br />
orientations <strong>of</strong> hackles from the different fiber bundles bound<br />
the direction <strong>of</strong> the local shear within an angle <strong>of</strong> 90 degrees.<br />
River marks were observed in matrix-rich areas near the<br />
bundle crossings and could be seen at the base <strong>of</strong> hackles in the<br />
transition from a bundle at one orientation to a perpendicular<br />
crossing bundle. River marks in the matrix-rich bundle crossings<br />
were used to identify a general direction <strong>of</strong> fracture propagation<br />
upward and aftward for both <strong>of</strong> the large delaminations (at the<br />
forward left and aft left attachments). River marks at the base<br />
<strong>of</strong> the hackles were used to determine delamination growth<br />
direction in the forward right lug delaminations.<br />
At the matrix-rich areas where bundles crossed, investigators<br />
observed some porosity with a somewhat angular appearance, as<br />
shown in figure 10. These pores were identified as arising from<br />
excess curing agent that had crystallized within the matrix but<br />
was physically removed during the fracture process or dissolved<br />
by the water <strong>of</strong> Jamaica Bay.<br />
Figure 10. Porosity in matrix-rich regions where bundles cross as<br />
observed on delamination fracture surfaces.<br />
On the left forward lug delamination surfaces, hackles on<br />
average pointed downward and forward on the outboard side<br />
<strong>of</strong> the delamination and upward and aft on the mating side,<br />
indicating a shear direction consistent with fracture under<br />
tensile loading and/or bending to the left. River patterns<br />
coalesced upward and aft, indicating crack propagation<br />
extending upward from the lower end. On the left aft lug<br />
delamination surfaces, hackles on average pointed downward<br />
18 NTSB JOURNAL OF ACCIDENT INVESTIGATION, SPRING 2006; VOLUME 2, ISSUE 1
and forward on the side <strong>of</strong> the delamination associated with<br />
the lug layers, and on average pointed upward and aft on<br />
the mating sides, consistent with the lug pieces moving<br />
downward relative to the remaining structure. In the portion<br />
<strong>of</strong> the delamination above the lug-to-skin transition, hackles<br />
generally pointed downward and forward on the outboard<br />
side and upward and aft on the mating side, indicating a shear<br />
direction consistent with fracture that occurred with bending<br />
to the left. River patterns generally coalesced upward and aft,<br />
indicating crack propagation extending upward from the lower<br />
end. Investigators looked for but did not find any evidence <strong>of</strong><br />
fatigue, such as striations in the matrix or edge rounding <strong>of</strong> the<br />
fiber ends on the translaminar fracture surfaces or matrix rollers<br />
or striations on the delamination surfaces.<br />
A schematic summarizing the observed fracture patterns is<br />
shown in figure 11. Results <strong>of</strong> the microscopic examination<br />
showed that the failure pattern <strong>of</strong> fracture in tension on the<br />
right side was consistent with an overall bending <strong>of</strong> the vertical<br />
stabilizer to the left. On the left side, the failure pattern <strong>of</strong><br />
tension and bending to the left was consistent with an overall<br />
bending <strong>of</strong> the vertical stabilizer to the left after the lugs on the<br />
right side fractured.<br />
Overstress tension and<br />
bending to the left<br />
FORWARD<br />
LEFT<br />
RIGHT<br />
MATERIALS EXAMINATION OF THE VERTICAL STABILIZER FROM AMERICAN AIRLINES FLIGHT 87<br />
Overstress tension and<br />
bending to the left<br />
Investigators noted that the only compression translaminar<br />
failure features were present on the vertical stabilizer at the<br />
outboard side <strong>of</strong> the center aft lug. Typically, composites have<br />
less strength in compression than in tension. However, the<br />
design <strong>of</strong> the vertical stabilizer was such that the magnitude <strong>of</strong><br />
the load needed to fail a lug in tension was less than the load<br />
needed to fail the lug in compression. Furthermore, after the<br />
lugs on the right side failed, the curvature <strong>of</strong> the panel would<br />
have caused tension loading in the forward and aft lug and<br />
compression in the center lug with continued bending to the<br />
left. Other unknown factors, such as changes in air loading as<br />
the vertical stabilizer deflected after the initial fractures on the<br />
right side, would further influence the failure patterns on the<br />
left side.<br />
Lug Tests<br />
Using aerodynamic loads calculated from information<br />
gathered on flight data recorders, investigators conducted a<br />
comprehensive structural analysis in conjunction with the<br />
materials examination <strong>of</strong> the vertical stabilizer and rudder to<br />
determine stresses that developed in the structure during the<br />
accident flight. Structural analysis indicated that under accident<br />
Overstress tension and<br />
bending to the left<br />
Overstress tension<br />
Overstress tension Overstress tension<br />
Figure 11. Main lug fracture pattern as summarized in a schematic view <strong>of</strong> the lower end <strong>of</strong> the vertical stabilizer. Fracture features on the right side were<br />
consistent with fracture under tensile loads. Fracture features on the left side were consistent with fracture under tensile loads and bending to the left.<br />
Unlabeled arrows in the schematic indicate fracture propagation directions at each lug as determined from translaminar fracture features. Both <strong>of</strong> the<br />
forward lugs and the right aft lug failed through the bolthole—that is, the lug fractured at the bolt location. Translaminar fracture features indicated that<br />
as these lugs failed, fracture propagated outward from the bolt holes. The two center lugs and the left aft lug failed above the bolthole, in the lug-to-skin<br />
transition area. Translaminar fracture features at the right center lug indicated that as the lug separated from the rest <strong>of</strong> the vertical stabilizer, fracture<br />
propagated aft to forward. Translaminar fracture features at the left center and left aft lugs indicated that as these lugs separated from the rest <strong>of</strong> the<br />
vertical stabilizer, fracture propagated forward to aft.<br />
NTSB JOURNAL OF ACCIDENT INVESTIGATION, SPRING 2006; VOLUME 2, ISSUE 1 19<br />
AFT
MATTHEW R. FOX, CARL R. SCHULTHEISZ, JAMES R. REEDER, AND BRIAN J. JENSEN<br />
Figure 12. Comparison <strong>of</strong> aft lugs from the accident vertical stabilizer and subsequent subcomponent tests. In each photo, the small, unlabeled arrows<br />
indicate where translaminar cracks or fractures intersected the outboard surfaces <strong>of</strong> the lugs, and a large, unlabeled arrow indicates loading direction (the<br />
force vector for the horizontal and vertical loading components for each lug). The lugs from the first and second tests were left aft lugs, and as such, the<br />
orientations are mirror images <strong>of</strong> the accident right aft lug and the third test lug.<br />
loading conditions, fracture <strong>of</strong> the vertical stabilizer would<br />
have initiated at the right aft lug. Accordingly, three aft lugs<br />
were obtained for mechanical testing under applied loads that<br />
matched those that were derived from recorded flight accident<br />
data. The lug for the first test was obtained from a production<br />
left skin panel from which sections were cut for destructive<br />
testing, while the aft lug was not disturbed. Lugs for the second<br />
and third tests were obtained from a vertical stabilizer that had<br />
been removed from service after experiencing loads exceeding<br />
design limit loads. The three lug specimens were tested at<br />
Airbus under Safety Board supervision in a loading fixture that<br />
applied the prescribed forces and moments to the lugs. Testing<br />
<strong>of</strong> each lug continued until a load change associated with a<br />
translaminar fracture or crack was observed. Fracture loads for<br />
these three tests were consistent with calculated accident loads<br />
and with earlier tests completed by Airbus during certification. 19<br />
19 (a) National Transportation Safety Board, Structures Group Factual<br />
Report Addendum 17, NTSB Public Docket, 2004; (b) National<br />
Transportation Safety Board, Structures Group Factual Report<br />
Addendum 16, NTSB Public Docket, 2004; (c) National Transportation<br />
Safety Board, Structures Group Factual Report Addendum 1 , NTSB<br />
Public Docket, 2004; (d) National Transportation Safety Board,<br />
Structures Group Factual Report Addendum 8C, NTSB Public Docket,<br />
2004; (e) National Transportation Safety Board, Structures Group<br />
Factual Report Addendum 6 (Rev A), NTSB Public Docket, 2004.<br />
A fractographic examination <strong>of</strong> each lug was conducted after<br />
completing the tests, as documented by the Safety Board. 20<br />
Before being tested, each lug was examined for non-visible<br />
defects or damage using ultrasonic inspection. 21 No defects<br />
were observed in the first test lug. Some damage was detected<br />
in the second and third test lugs near the lug attachment<br />
hole and in some areas, in the lug fitting assembly transition<br />
area above the lowermost rib, but these lugs had experienced<br />
in-service loads exceeding design limit loads. Following the<br />
tests, the lugs were examined again using ultrasonic inspection,<br />
which showed that the preexisting damage in these lugs grew in<br />
size during the testing. Overall views <strong>of</strong> the lugs from each test<br />
are shown in figure 12 (outboard surface view).<br />
Results from the fractographic examination showed that<br />
the test lugs fractured at locations similar to those on the<br />
accident right aft lug. In test 1, loading was interrupted after<br />
a translaminar crack occurred at the location indicated by<br />
the large arrow in the upper right photo in figure 12. The<br />
translaminar fracture was located on the forward part <strong>of</strong> the<br />
20 National Transportation Safety Board, Materials Laboratory Factual<br />
Report 04-06 , NTSB Public Docket, 2004.<br />
21 National Transportation Safety Board, Materials Laboratory Factual<br />
Report 04-06 , NTSB Public Docket, 2004.<br />
20 NTSB JOURNAL OF ACCIDENT INVESTIGATION, SPRING 2006; VOLUME 2, ISSUE 1
lug in a plane nearly parallel to the resultant force direction,<br />
similar to one <strong>of</strong> the translaminar fractures in the accident right<br />
aft lug. Fracture features for the lugs from tests 2 and 3 were<br />
similar to each other. The outboard side <strong>of</strong> each <strong>of</strong> these lugs<br />
had a translaminar fracture on the forward sides <strong>of</strong> the holes<br />
in a plane nearly parallel to the loading direction and another<br />
translaminar fracture at the aft side <strong>of</strong> the hole in a plane<br />
approximately perpendicular to the loading direction. These<br />
fractures were similar to those <strong>of</strong> the accident lug. In addition,<br />
on the outboard sides, a compression buckling fracture was<br />
observed on the forward sides <strong>of</strong> each lug above the fracture<br />
parallel to the loading direction; this fracture was different from<br />
fractures on the accident lug but was attributed to constraints<br />
<strong>of</strong> the loading fixture. On the inboard sides <strong>of</strong> lugs 2 and 3,<br />
fracture locations were on translaminar planes different from<br />
those <strong>of</strong> the outboard side <strong>of</strong> the lugs. This change in fracture<br />
planes was similar to that <strong>of</strong> the accident right aft lug.<br />
A delamination within the first test lug was similar in extent<br />
to that <strong>of</strong> the accident right aft lug and was located through<br />
the thickness, slightly outboard <strong>of</strong> that <strong>of</strong> the accident right aft<br />
lug. Delaminations also were detected above the translaminar<br />
fractures in lugs 2 and 3. In test 2 and 3 lugs, the locations <strong>of</strong><br />
the delaminations through the thickness were similar to those<br />
<strong>of</strong> the accident right aft lug, but the extent <strong>of</strong> the delaminations<br />
in the test lugs was slightly less.<br />
Delaminations in each lug, as well as translaminar fractures<br />
that intersected the lughole, were features similar to the<br />
accident right aft lug. Each lug had a translaminar fracture<br />
at the forward lower side <strong>of</strong> the hole on the outboard side <strong>of</strong><br />
the lug, including the first test, which was interrupted and had<br />
no other translaminar fractures. The fracture at the forward<br />
lower side <strong>of</strong> the hole corresponded to one <strong>of</strong> the translaminar<br />
fracture locations on the accident lug. The second test lug<br />
showed changes in translaminar fracture planes that were<br />
qualitatively similar to those <strong>of</strong> the accident right aft lug. These<br />
results indicated that the fracture features <strong>of</strong> the accident right<br />
aft lug were consistent with its being the first lug to fracture<br />
from a substantially intact vertical stabilizer and rudder under<br />
accident load conditions.<br />
CONCLUDING REMARKS<br />
The materials testing and microstructural examination <strong>of</strong> the<br />
vertical stabilizer indicated that the vertical stabilizer’s composite<br />
material had sufficient cure, desired fiber volume fraction, and<br />
acceptable void content with no evidence <strong>of</strong> microcracking<br />
in the areas examined. Discrepancies representing a small<br />
fraction <strong>of</strong> the total number <strong>of</strong> layers were observed in the<br />
layup <strong>of</strong> one <strong>of</strong> the samples. However, throughout the testing<br />
and examination, no deviations from the original design and<br />
MATERIALS EXAMINATION OF THE VERTICAL STABILIZER FROM AMERICAN AIRLINES FLIGHT 87<br />
materials specifications were found that would have contributed<br />
to the vertical stabilizer separation.<br />
The fractographic examination revealed no evidence <strong>of</strong><br />
pre-existing damage or fatigue cracking in the vertical stabilizer,<br />
supporting the conclusion that the separation <strong>of</strong> the vertical<br />
stabilizer was a result <strong>of</strong> high aerodynamic loads. Fractographic<br />
results for the main attachment lugs <strong>of</strong> the vertical stabilizer<br />
showed that failures on the right side <strong>of</strong> the vertical stabilizer<br />
were overstress failures under tension loading, consistent<br />
with an overall bending <strong>of</strong> the vertical stabilizer to the left.<br />
Fractographic results for the main lugs on the left side <strong>of</strong> the<br />
vertical stabilizer showed overstress failure in tension and<br />
bending to the left, consistent with bending <strong>of</strong> the vertical<br />
stabilizer to the left after failure <strong>of</strong> the main lugs on the right<br />
side. Structural analysis <strong>of</strong> the vertical stabilizer conducted as<br />
part <strong>of</strong> the overall investigation indicated that under accident<br />
loads, fracture <strong>of</strong> the vertical stabilizer would initiate at the<br />
right aft main lug, which was consistent with the fractographic<br />
analysis.<br />
The failure mode in the accident was further confirmed by a<br />
series <strong>of</strong> three aft lug tests. The failure loads for these three tests<br />
were consistent with predicted failure loads and with earlier tests<br />
completed by Airbus during certification. Fracture patterns for<br />
the three test specimens were compared to the corresponding<br />
structure on the accident airplane, and good correlation was<br />
observed.<br />
Analysis <strong>of</strong> the fractographic evidence was incorporated into<br />
the overall analysis <strong>of</strong> the accident. As one <strong>of</strong> the findings <strong>of</strong><br />
the Safety Board’s report stated, “Flight 87’s vertical stabilizer<br />
performed in a manner that was consistent with its design and<br />
certification. The vertical stabilizer fractured from the fuselage<br />
in overstress, starting with the right rear lug while the vertical<br />
stabilizer was exposed to aerodynamic loads that were about<br />
twice the certified limit load design envelope and were more<br />
than the certified ultimate load design envelope.” 22<br />
22 NTSB/AAR-04/04 (NTSB Public Docket, 2004)<br />
NTSB JOURNAL OF ACCIDENT INVESTIGATION, SPRING 2006; VOLUME 2, ISSUE 1 21
MATTHEW R. FOX, CARL R. SCHULTHEISZ, JAMES R. REEDER, AND BRIAN J. JENSEN<br />
THE AUTHORS<br />
MATTHEW R. FOX, Ph.D., is a Materials Engineer in the Materials Laboratory at the NTSB. His expertise includes fracture<br />
mechanics, composites, high-temperature materials, and finite-element modeling. Dr. Fox led the materials examination <strong>of</strong><br />
the vertical stabilizer and rudder for the American Airlines flight 87 investigation. He also led materials examinations for the<br />
Explorer Pipeline Company pipeline failure in Greenville, Texas, and several major rail accidents, including Carbondale, Kansas,<br />
and Eunice, Louisiana.<br />
CARL R. SCHULTHEISZ, Ph.D., is a Materials Research Engineer in the Materials Laboratory at the NTSB. Using expertise in<br />
solid mechanics, fracture, polymers, and polymer-matrix composites, he participated in the fractographic investigation and analysis<br />
<strong>of</strong> the Airbus A-300 composite vertical fin for the American Airlines flight 87 investigation. Dr. Schultheisz has also served<br />
as a materials research engineer at the National Institute <strong>of</strong> Standards and Technology, Polymers Division, and has studied the<br />
environmental durability <strong>of</strong> polymer matrix composites for automotive applications.<br />
JAMES R. REEDER, Ph.D., has worked at NASA Langley Research Center since 1987, as part <strong>of</strong> what is now called the Mechanics<br />
<strong>of</strong> Structures and Materials Branch. His research areas have included delamination mechanics, failure <strong>of</strong> textile composites,<br />
viscoelastic failure response <strong>of</strong> high temperature composites, failure morphologies in composites, and impact failure <strong>of</strong> ceramic<br />
matrix composites. He has contributed to several failure investigations including the NASA X33 Hydrogen Tank Failure.<br />
BRIAN J. JENSEN, Ph.D., is a Senior Scientist at the NASA Langley Research Center. He has pursued the study <strong>of</strong> chemistry<br />
at Virginia Commonwealth University, The College <strong>of</strong> William and Mary, and Randolph Macon College. Dr. Jensen’s research<br />
interests include high performance polymers, adhesives, and composites and he has published over 1 0 articles and holds 20<br />
patents.<br />
22 NTSB JOURNAL OF ACCIDENT INVESTIGATION, SPRING 2006; VOLUME 2, ISSUE 1
Developing Animations to Support<br />
Complex Aviation <strong>Accident</strong> <strong>Investigation</strong>s<br />
Alice Park and Christy Spangler, National Transportation Safety Board<br />
ABSTRACT<br />
I n their quest to find the probable cause <strong>of</strong> airplane accidents and ensure public safety,<br />
National Transportation Safety Board engineers and investigators collect and analyze a variety<br />
<strong>of</strong> complex data that may be difficult to visualize or explain to a nontechnical audience. The<br />
NTSB uses three-dimensional (3-D) graphics and animations to show what happened during<br />
the accident and to illustrate the engineering work performed to reconstruct the accident<br />
sequence. This paper describes how animation can be used to support complex aviation<br />
accident investigations.<br />
INTRODUCTION<br />
NTSB aviation accident investigations can involve highly dynamic and complex scenarios.<br />
After exhaustive collection and analysis <strong>of</strong> data, the NTSB determines the probable cause and<br />
makes recommendations for improving transportation safety. Animation has a critical role in<br />
accident investigations: to clearly explain the sequence <strong>of</strong> events leading to an accident.<br />
This discussion focuses on two accidents: American Airlines flight 87 (November 12, 2001,<br />
in Belle Harbor, New York) and Air Midwest flight 481 (January 8, 2003, in Charlotte,<br />
North Carolina).<br />
DATA COLLECTION PROCESS<br />
During an aviation accident investigation, information and data are gathered from a variety<br />
<strong>of</strong> sources: cockpit voice recorder (CVR), flight data recorder (FDR), radar data, wreckage<br />
scene measurements, eyewitness interviews, photos, videos, and site survey evidence. These<br />
data are processed and analyzed using a wide variety <strong>of</strong> aircraft performance and simulation<br />
codes to precisely define the airplane’s motion throughout the accident sequence. The<br />
NTSB JOURNAL OF ACCIDENT INVESTIGATION, SPRING 2006; VOLUME 2, ISSUE 1 23
ALICE PARK AND CHRISTY SPANGLER<br />
combined and comprehensive data set that describes the motion<br />
is used to develop detailed 3-D animations.<br />
<strong>Accident</strong> 1<br />
On November 12, 2001, American Airlines flight 87, an<br />
Airbus Industrie A300-600, was destroyed when it crashed into<br />
a residential area <strong>of</strong> Belle Harbor, New York, shortly after take<strong>of</strong>f<br />
from runway 31L at John F. Kennedy International Airport.<br />
Before impact, the vertical stabilizer, rudder, and left and right<br />
engines departed the airplane. The 2 pilots, 7 flight attendants,<br />
2 1 passengers, and persons on the ground were killed.<br />
The NTSB dispatched approximately 40 personnel to<br />
the scene. Investigators included specialists in operations,<br />
structures, power plants, systems, air traffic control, weather,<br />
aircraft performance, and voice and flight data recorders. After<br />
a 3-year investigation, the NTSB determined that the probable<br />
cause <strong>of</strong> the accident was the in-flight separation <strong>of</strong> the vertical<br />
stabilizer as a result <strong>of</strong> loads beyond ultimate design that were<br />
created by the first <strong>of</strong>ficer’s unnecessary and excessive rudder<br />
pedal inputs, characteristics <strong>of</strong> the Airbus A300-600 rudder<br />
system design, and elements <strong>of</strong> the American Airlines Advanced<br />
Column, degrees<br />
Wheel, degrees<br />
Pedal, inches<br />
10<br />
5<br />
0<br />
-5<br />
-10<br />
FWD COLUMN<br />
09:15:34 09:15:36 09:15:38 09:15:40 09:15:42 09:15:44<br />
-100<br />
LEFT WHEEL<br />
-50<br />
0<br />
50<br />
100<br />
RIGHT WHEEL<br />
09:15:34 09:15:36 09:15:38 09:15:40 09:15:42 09:15:44<br />
-3<br />
-2<br />
LEFT PEDAL<br />
-1<br />
0<br />
1<br />
AFT COLUMN<br />
2<br />
3<br />
RIGHT PEDAL<br />
09:15:34 09:15:36 09:15:38 09:15:40 09:15:42 09:15:44<br />
ATC Time, HH:MM:SS EST<br />
Aircraft Maneuvering Program. During the investigation, it was<br />
determined that the first <strong>of</strong>ficer made his rudder pedal inputs<br />
at the time the airplane encountered wake turbulence from<br />
a Boeing 747. []<br />
<strong>Accident</strong> 1: Data Integration<br />
During the flight 87 investigation, performance engineers<br />
analyzed the first <strong>of</strong>ficer’s control inputs using FDR data. Figures<br />
1 and 2 show the first <strong>of</strong>ficer’s column, wheel, and pedal inputs,<br />
plotted as a function <strong>of</strong> time during the accident’s two wake<br />
turbulence encounters. The blue line on the plots indicates the<br />
mechanical limits <strong>of</strong> these controls.<br />
Figure 1, illustrating the first <strong>of</strong>ficer’s control inputs during<br />
the first wake turbulence encounter, shows that the column and<br />
wheel limits remained constant, but the pedal limit varied in<br />
accordance with the rudder control system’s design. The figure<br />
also shows that the first <strong>of</strong>ficer responded to the first wake<br />
turbulence encounter with column and a series <strong>of</strong> large wheel<br />
inputs, but did not use the rudder pedals.<br />
-10<br />
FWD COLUMN<br />
09:15:50 09:15:52 09:15:54 09:15:56 09:15:58<br />
-100<br />
LEFT WHEEL<br />
100<br />
RIGHT WHEEL<br />
09:15:50 09:15:52 09:15:54 09:15:56 09:15:58<br />
-3<br />
-2<br />
LEFT PEDAL<br />
24 NTSB JOURNAL OF ACCIDENT INVESTIGATION, SPRING 2006; VOLUME 2, ISSUE 1<br />
Column, degrees<br />
Wheel, degrees<br />
Pedal, inches<br />
10<br />
5<br />
0<br />
-5<br />
-50<br />
0<br />
50<br />
-1<br />
0<br />
1<br />
AFT COLUMN<br />
2<br />
3<br />
RIGHT PEDAL<br />
09:15:50 09:15:52 09:15:54 09:15:56 09:15:58<br />
ATC Time, HH:MM:SS EST<br />
Figure 1. Control input during first wake encounter. Figure 2. Control input during second wake encounter.
Figure 2, illustrating control inputs during the second wake<br />
turbulence encounter, shows that the first <strong>of</strong>ficer responded<br />
to the second wake turbulence encounter much differently<br />
than he did to the first. Wheel inputs during the second wake<br />
turbulence encounter were about twice as large as those made<br />
during the first, and the first <strong>of</strong>ficer also made rudder pedal<br />
inputs. The NTSB found that the full wheel and rudder inputs<br />
made in response to the second wake turbulence encounter<br />
were unnecessary and excessive.<br />
Figures 1 and 2 show individual parameters: column, wheel,<br />
pedals, and time. However, it is not easy to understand the<br />
magnitude <strong>of</strong> the data within the timeframe. In particular,<br />
the pilot’s reaction to the first and second wake turbulence<br />
encounters is hard to visualize using only the data in the figures.<br />
Given these difficulties, staff decided to animate the first <strong>of</strong>ficer’s<br />
input to make it easier to grasp the data. The following is the<br />
detailed process used in the animation reconstruction:<br />
• Storyboarded the first <strong>of</strong>ficer’s control inputs.<br />
•<br />
•<br />
•<br />
•<br />
•<br />
•<br />
Modeled the human legs, pedals, and control column<br />
according to the scale and measurements <strong>of</strong> the<br />
A300-600 cockpit.<br />
Wrote XSI script to read the CVR text file, and MS<br />
Excel spreadsheet containing the FDR data <strong>of</strong> the<br />
flight control inputs.<br />
Textured the legs to show only their outlines, and<br />
textured the cockpit components to represent the<br />
A300-600 cockpit.<br />
Synchronized digital time in accordance with flight<br />
control input.<br />
Reviewed data accuracy against the pedal and column<br />
motion to ensure accurate representation.<br />
Composited the data-driven control input and digital<br />
time with selected cockpit communication (figures 3<br />
and 4).<br />
As the list above shows, translating field data to an animation<br />
is not a single-step process. In addition to being factually<br />
correct, the animation must demonstrate a high degree <strong>of</strong> data<br />
analysis, conveyed so that the data are easy for an audience to<br />
understand. In addition, the animation scene must be simple so<br />
that the main focus is on the probable cause and the audience<br />
is not distracted by extraneous factors. For these reasons, only<br />
the control column and pedals were included for the cockpit<br />
environment. However, the scene seemed incomplete without<br />
a human figure, even though an entire human figure seemed to<br />
distract attention from the control inputs. The solution was to<br />
include only the lower torso <strong>of</strong> the figure, which worked well to<br />
demonstrate the human movements without detracting from the<br />
DEVELOPING ANIMATIONS TO SUPPORT COMPLEX AVIATION ACCIDENT INVESTIGATIONS<br />
control inputs. Photographs, engineering drawings, and survey<br />
data were used to accurately model the cockpit environment<br />
and placement <strong>of</strong> the lower torso according to the actual<br />
A300-600 cockpit. The green regions under the rudder pedals<br />
were used to depict the range <strong>of</strong> available pedal travel prior to<br />
reaching the pedal travel limits. (These limits correlate to the<br />
grey lines in the pedal plots <strong>of</strong> figures 1 and 2.) The animation<br />
also included digital time and selected cockpit communications<br />
to round out the sequence <strong>of</strong> events.<br />
Although extensive effort was required to animate the<br />
sequence <strong>of</strong> flight control inputs, the effort was clearly<br />
worthwhile since it demonstrates in real time the first <strong>of</strong>ficer’s<br />
unnecessary and excessive rudder inputs during the wake<br />
turbulence encounters and shows how his actions changed from<br />
the first wake encounter to the second. Further, by showing<br />
events in real time using the cockpit orientation, the animation<br />
thoroughly represents the sequence <strong>of</strong> events and enhanced<br />
investigators’ understanding <strong>of</strong> the control inputs. Finally, the<br />
animation allows a nontechnical audience to watch the actions<br />
associated with the control input data rather than viewing a<br />
static diagram that must be explained by the presenter. Figures<br />
1 and 2 show the data, but the animation (figures 3 and 4)<br />
shows the human actions that resulted in that data. This 3-D<br />
animation reconstruction effectively explains the first <strong>of</strong>ficer’s<br />
actions and enables both the investigators and the audience to<br />
visualize the complex control input data associated with the<br />
accident.<br />
<strong>Accident</strong> 2<br />
On January 8, 2003, about 0847:28 eastern standard time, Air<br />
Midwest flight 481, a Raytheon (Beechcraft) 1900D, crashed<br />
shortly after taking <strong>of</strong>f from Charlotte-Douglas International<br />
Airport, Charlotte, North Carolina. Two flight crewmembers<br />
and nineteen passengers aboard the airplane were killed, one<br />
person on the ground received minor injuries, and impact forces<br />
and a postcrash fire destroyed the airplane. NTSB determined<br />
that the probable cause <strong>of</strong> the accident was the airplane’s<br />
loss <strong>of</strong> pitch control during take<strong>of</strong>f. The loss <strong>of</strong> pitch control<br />
resulted from incorrect rigging <strong>of</strong> the elevator control system,<br />
compounded by the airplane’s aft center <strong>of</strong> gravity, which was<br />
substantially aft <strong>of</strong> the certified aft limit. []<br />
<strong>Accident</strong> 2: Data Integration<br />
The challenge in analyzing and presenting data from flight<br />
481 was to explain how the airplane’s mis-rigged elevator<br />
cable control system affected airplane motion, resulting in<br />
loss <strong>of</strong> pitch control. Investigators found that they could not<br />
effectively demonstrate the physical evidence associated with<br />
the mis-rigged elevator control system or the airplane’s flight<br />
NTSB JOURNAL OF ACCIDENT INVESTIGATION, SPRING 2006; VOLUME 2, ISSUE 1 2
ALICE PARK AND CHRISTY SPANGLER<br />
Figure 3. Control input during the first wake encounter (still images from the animation).<br />
Figure 4. Control input during the second wake encounter (still images from the animation).<br />
path using figures and still images only. Using animation,<br />
however, they could present the data clearly. The elevator<br />
control system animation was divided into two parts, the first<br />
being an overview, and the second depicting the components,<br />
functions, and motions <strong>of</strong> the cable system, demonstrating both<br />
a properly and an improperly adjusted cable system.<br />
The flight path animation was based upon the FDR, radar<br />
data, and simulations. Figure illustrates the process <strong>of</strong><br />
turning the raw FDR data into a workable format and then<br />
importing it into a 3-D s<strong>of</strong>tware package to drive the airplane<br />
motion. Engineering drawings like those in figure 6, as well as<br />
photographs, were used as references to represent the elevator<br />
control system and an accurate relationship and functions <strong>of</strong> its<br />
components. The following process was used in the animation<br />
reconstruction:<br />
26 NTSB JOURNAL OF ACCIDENT INVESTIGATION, SPRING 2006; VOLUME 2, ISSUE 1
Figure 5. FDR data converted and inserted into the animation.<br />
(still images from the animation).<br />
DEVELOPING ANIMATIONS TO SUPPORT COMPLEX AVIATION ACCIDENT INVESTIGATIONS<br />
Elevator Control System<br />
Studied the control system and used engineering<br />
perspective to illustrate the mechanical systems.<br />
Modeled the system with great detail using<br />
manufactured engineering drawings and actual images<br />
(figure 6).<br />
Textured the components to produce a close<br />
representation <strong>of</strong> the actual system.<br />
Assembled the complex system and applied expressions<br />
to animate and ensure all parts functioned accordingly.<br />
Used appropriate effects and lighting to focus on<br />
essential parts <strong>of</strong> the cable system.<br />
Used multiple camera settings to capture the<br />
relationship <strong>of</strong> the various components <strong>of</strong> the cable<br />
system.<br />
Composited the rendered sequence with recorded<br />
narration (figure 8).<br />
Flight Path<br />
Imported a commercially available Beechcraft 1900D<br />
model to XSI and modified it to meet our needs.<br />
Created the airport runway and hangar with<br />
documented and measured data using CAD; drew and<br />
mapped the surrounding images <strong>of</strong> the airport.<br />
Wrote XSI script to read the CVR text file and MS<br />
Excel spreadsheet containing the simulation-derived<br />
kinematics <strong>of</strong> the flight path as a function <strong>of</strong> time<br />
(figure ).<br />
Set up multiple cameras to best capture the attitude<br />
deviations during take<strong>of</strong>f.<br />
Synchronized digital time, airspeed, and altitude data<br />
with flight motion.<br />
Reviewed data accuracy against airplane attitude and<br />
motion to ensure accurate representation.<br />
Composited the data-driven flight path, digital<br />
time, altitude, and airspeed with selected cockpit<br />
communication (figure 7).<br />
During the Board Meeting, investigators had to convey their<br />
findings clearly. It would have been challenging to explain the<br />
airplane motion associated with the cable system using the still<br />
image in figure 6. The animation provided a simple demonstration<br />
<strong>of</strong> the cable system and showed how the nose-down control<br />
NTSB JOURNAL OF ACCIDENT INVESTIGATION, SPRING 2006; VOLUME 2, ISSUE 1 27<br />
•<br />
•<br />
•<br />
•<br />
•<br />
•<br />
•<br />
•<br />
•<br />
•<br />
•<br />
•<br />
•<br />
•
ALICE PARK AND CHRISTY SPANGLER<br />
Figure 6. Engineering drawing <strong>of</strong> the elevator cable system.<br />
28 NTSB JOURNAL OF ACCIDENT INVESTIGATION, SPRING 2006; VOLUME 2, ISSUE 1
DEVELOPING ANIMATIONS TO SUPPORT COMPLEX AVIATION ACCIDENT INVESTIGATIONS<br />
Figure 7. Still images from the flight path animation.<br />
Figure 8. Still images from the elevator control system animation.<br />
NTSB JOURNAL OF ACCIDENT INVESTIGATION, SPRING 2006; VOLUME 2, ISSUE 1 29
ALICE PARK AND CHRISTY SPANGLER<br />
restriction resulting from incorrect rigging <strong>of</strong> the elevator<br />
control system caused the aircraft’s loss <strong>of</strong> pitch control.<br />
In the flight path animation, it was important to focus on the<br />
airplane motion. Therefore, the environment was simplified,<br />
showing only the runway and the hangar that was hit by the<br />
airplane. Similarly, only that part <strong>of</strong> the flight path that was<br />
significant to the probable cause was included. The time,<br />
altitude, speed, and selected cockpit communications were<br />
also shown to place the animation in perspective (figure 7).<br />
Because the elevator control system is quite complex, only<br />
certain components were needed to effectively communicate<br />
the functions and adjustments pertinent to this accident<br />
(figure 8). These animations <strong>of</strong> the cable mechanical system and<br />
the properly and improperly adjusted elevator control system<br />
effectively presented its correlation with the airplane’s loss <strong>of</strong><br />
pitch control during take<strong>of</strong>f.<br />
CONCLUSION<br />
To determine and analyze the motion <strong>of</strong> an aircraft and the<br />
physical forces that produce that motion, accident investigators<br />
gather a variety <strong>of</strong> data that may not be easy to visualize. These<br />
data define aircraft position and orientation through the flight<br />
and are used to determine aircraft response to control inputs,<br />
system failures, external disturbances, or other factors that could<br />
affect its flight. Although figures and still images can be used to<br />
replicate this physical evidence, a concise and simple but detailed<br />
animation can greatly enhance investigators’ ability to visualize<br />
and analyze the accident sequence <strong>of</strong> events. Animations<br />
also enable investigators to simultaneously depict individual<br />
data points in real time so that they can draw conclusions<br />
and identify probable cause based on that data. Similarly,<br />
animation can greatly simplify the explanation <strong>of</strong> those findings<br />
THE AUTHORS<br />
for a nontechnical audience, enabling them to understand the<br />
probable cause and any associated safety recommendations. For<br />
these reasons, the animations used to convey complex accident<br />
investigation data must incorporate simplicity, elegance, and<br />
scale <strong>of</strong> design. Engineers and animators work closely to<br />
achieve this result by carefully crafting a storyboard that lays<br />
out the data to tell a clear and coherent story. It is important to<br />
emphasize that such animations are worthwhile only if they are<br />
based on data that has been scrupulously measured, recorded,<br />
and calculated to ensure accuracy <strong>of</strong> results.<br />
REFERENCES<br />
AmericAn Airlines flight 587. <strong>Accident</strong><br />
information: http://www.ntsb.gov/events/2001/AA 87/<br />
default.htm<br />
AmericAn Airlines flight 587. Presentation with<br />
Static Graphs: http://www.ntsb.gov/events/2001/<br />
AA 87/presentations/02_airplane_perf.pdf<br />
AmericAn Airlines flight 587. Animations and<br />
videos: http://www.ntsb.gov/events/2001/AA 87/<br />
board_mtg_anim.htm<br />
Air midwest flight 5481. <strong>Accident</strong> information:<br />
http://www.ntsb.gov/events/2003/AM 481/default.htm<br />
Air midwest flight 5481. Animations: http://www.<br />
ntsb.gov/events/2003/AM 481/board_meeting_<br />
presentations/presentations.htm<br />
ALICE PARK is an Electrical Engineer/Radar Specialist in the Vehicle Performance Division at the NTSB. Ms. Park provides<br />
technical analysis <strong>of</strong> FAA radar data in support <strong>of</strong> aircraft accident investigations and creates 3-D animations for use in public<br />
Board Meetings to illustrate complex vehicle and occupant motions that occur during an accident sequence. She also codes and<br />
debugs computer programs for processing radar data; performs 3-D computer simulations to reconstruct flight path <strong>of</strong> accident<br />
aircraft; performs radar data studies; and represents the Safety Board in updating and coordinating with the FAA Technical<br />
Center regarding the National Airspace System.<br />
CHRISTY L. SPANGLER is an Audio/Visual Information Specialist in the Information Products Division at the NTSB. Ms.<br />
Spangler’s projects have included the Charlotte take<strong>of</strong>f accident 3-D animation, the Academy Virtual Tour, and other 3-D<br />
animation, graphic design, intranet, and website projects. Her other experience includes her work as a media specialist for<br />
the Biomedical Communications Department, Quillen College <strong>of</strong> Medicine, East Tennessee State University, in Johnson City,<br />
Tennessee.<br />
30 NTSB JOURNAL OF ACCIDENT INVESTIGATION, SPRING 2006; VOLUME 2, ISSUE 1<br />
•<br />
•<br />
•<br />
•<br />
•
Aviation Recorder Overview<br />
Dennis R. Grossi, National Transportation Safety Board<br />
INTRODUCTION<br />
A wide variety <strong>of</strong> airborne and ground-based aviation recording devices are available<br />
that can provide vital information for accident prevention purposes. The primary information<br />
sources include the mandatory crash-protected flight recorders, airborne quick access data<br />
recorders, and ground-based recordings <strong>of</strong> air traffic control (ATC) radar returns and radio<br />
communications. Other sources <strong>of</strong> recorded information, such as aircraft system internal<br />
memory devices and recordings <strong>of</strong> airline operational communications, have also provided<br />
vital information to accident investigators. These devices can range from nonvolatile memory<br />
chips to state-<strong>of</strong>-the-art solid-state flight recorders. With the exception <strong>of</strong> the mandatory<br />
flight recorders, these devices were designed primarily to provide recorded information<br />
for maintenance troubleshooting or specific operational requirements. Regardless <strong>of</strong> their<br />
original purpose, they have all been used in one form or another to investigate aviation<br />
accidents. This paper will give an overview <strong>of</strong> the evolution <strong>of</strong> flight recorder technology and<br />
regulatory requirements, and will describe the capabilities and limitations <strong>of</strong> the various types<br />
<strong>of</strong> recorded information available to the aviation community for accident prevention and, in<br />
particular, accident/incident investigation.<br />
CRASH-PROTECTED FLIGHT RECORDERS<br />
Evolution <strong>of</strong> Regulatory Requirements<br />
First Flight Data Recorder<br />
The need for a crash-survivable recording device became apparent following a series<br />
<strong>of</strong> airline crashes in the early 1940s. This spurred the Civil Aeronautics Board (CAB) to<br />
draft the first Civil Aviation Regulations calling for a flight recording device for accident<br />
investigation purposes. However, recorder development was delayed by shortages brought<br />
NTSB JOURNAL OF ACCIDENT INVESTIGATION, SPRING 2006; VOLUME 2, ISSUE 1 31
DENNIS GROSSI<br />
about by World War II. As a result, such a device was not<br />
available, and after extending the compliance date three times,<br />
the CAB rescinded the requirement in 1944. The CAB issued<br />
a similar flight recorder regulation in 1947, after the war, but a<br />
suitable recorder was still not available and the regulation was<br />
rescinded the following year.<br />
During the 9 years that followed, the Civil Aviation Authority<br />
(CAA), the CAB, and aviation industry representatives studied<br />
the capabilities <strong>of</strong> recorder technology in an effort to develop<br />
new recorder requirements. Finally in 19 7, after determining<br />
that suitable recording devices were available, the CAA issued<br />
a third round <strong>of</strong> flight recorder regulations. These regulations<br />
called for all air carrier airplanes over 12, 00 pounds that<br />
operated above 2 ,000 feet to be fitted with a crash-protected<br />
flight recorder by July 1, 19 8, that recorded altitude, airspeed,<br />
heading, and vertical accelerations as a function <strong>of</strong> time. This<br />
marked the introduction <strong>of</strong> the first true crash-protected flight<br />
data recorder in the U.S.<br />
First Cockpit Voice Recorder (CVR)<br />
As a result <strong>of</strong> a CAB recommendation to record flight<br />
crew conversation for accident investigation purposes, the<br />
Federal Aviation Administration (FAA) conducted a study<br />
in 1960 that established the feasibility <strong>of</strong> CVRs. The FAA<br />
produced airworthiness installation approval criteria and<br />
operating rules that called for the installation <strong>of</strong> a CVR in<br />
transport-category aircraft operated in air carrier service. The<br />
compliance dates were July 1, 1966, for all turbine-powered<br />
aircraft, and January 1, 1967, for all pressurized aircraft with<br />
four reciprocating engines.<br />
Figure 1. System schematic for a typical oscillographic foil recorder.<br />
1972 Flight Data Recorder Rule Change<br />
FDR requirements remained virtually unchanged<br />
until December 10, 1972, when the rules for<br />
transport-category airplanes that received type certification<br />
after September 30, 1969, were amended to require an expanded<br />
parameter digital flight data recorder (DFDR) system. The<br />
expanded parameter requirements included existing parameters<br />
plus parameters for pitch and roll attitude, thrust for each engine,<br />
flap position, flight control input or control surface position,<br />
lateral acceleration, pitch trim, and thrust reverser position<br />
for each engine. Unfortunately, this rule change, which was<br />
retroactive to include the Boeing 747, did not affect airplanes<br />
like the Boeing 707, 727, and 737, and the McDonnell Douglas<br />
DC-8 and DC-9, all <strong>of</strong> which had type certificates issued before<br />
1969. Therefore, existing and newly manufactured versions <strong>of</strong><br />
these older aircraft types could be operated under the same<br />
FDR rules established in 19 7. Flight recorder requirements<br />
remained essentially unaltered until the rule changes in 1987<br />
and 1988.<br />
1987 and 1988 Flight Recorder Rule Changes<br />
During the 30 years following issuance <strong>of</strong> the original<br />
19 7 FDR regulations, the National Transportation Safety<br />
Board and its predecessor, the CAB, issued numerous safety<br />
recommendations to the FAA requesting upgraded recorder<br />
standards to meet the needs <strong>of</strong> accident investigators. The<br />
recommendations called for the following:<br />
Replace original foil-type oscillographic recorder<br />
with digital recorders.<br />
32 NTSB JOURNAL OF ACCIDENT INVESTIGATION, SPRING 2006; VOLUME 2, ISSUE 1<br />
1.
2.<br />
3.<br />
4.<br />
.<br />
6.<br />
On existing transport-category airplanes,<br />
retr<strong>of</strong>it five-parameter FDRs with six additional<br />
parameters.<br />
Expand parameter requirements for newly<br />
manufactured transport-category airplanes.<br />
Require the flight crew to use hot-microphones<br />
below 18,000 feet.<br />
Record hot-microphone channels on CVRs.<br />
Require CVRs and FDRs for some air taxi and<br />
corporate executive aircraft.<br />
The FAA repeatedly cited cost as the primary reason for not<br />
adopting the recommendations.<br />
Following a series <strong>of</strong> high visibility accidents in the early<br />
1980s, the FAA issued flight recorder rule changes in 1987 and<br />
again in 1988. These rule changes called for the following:<br />
1.<br />
2.<br />
3.<br />
4.<br />
.<br />
6.<br />
7.<br />
Replace oscillographic foil-type FDR digital<br />
recorders by May 26, 1989.<br />
Increase the number <strong>of</strong> mandatory parameters for<br />
airplanes type-certificated before October 1969<br />
to include pitch and roll attitude, longitudinal<br />
acceleration, thrust <strong>of</strong> each engine, and control<br />
column or pitch control surface position. (The<br />
original compliance date, May 26, 1994, was<br />
extended by 1 year to May 26, 199 .)<br />
Require transport-category airplanes (20 or more<br />
passengers) manufactured after October 11, 1991,<br />
to record 28 parameters in a digital format.<br />
Require existing transport-category airplanes (20<br />
or more passengers) fitted with a digital data bus<br />
to record 28 parameters in a digital format.<br />
Require all multiengine turbine-powered air taxi<br />
aircraft capable <strong>of</strong> carrying 10-19 passengers and<br />
manufactured after October 11, 1991, to have a<br />
17-parameter FDR.<br />
Extend the CVR requirements to multiengine<br />
turbine-powered aircraft capable <strong>of</strong> carrying six or<br />
more passengers and requiring two pilots.<br />
Require flight crews to use existing CVR<br />
hot-microphone systems below 18,000 feet.<br />
1997 Flight Data Recorder Rule Changes<br />
Following two fatal Boeing 737 accidents (United flight 8 ,<br />
Colorado Springs, Colorado, July 1989, and USAir flight 427,<br />
Pittsburgh, Pennsylvania, September 1994), the Safety Board<br />
AVIATION RECORDER OVERVIEW<br />
reexamined FDR parameter requirements, and as a result,<br />
made safety recommendations to the FAA that called for the<br />
following:<br />
Require additional parameters for most existing<br />
air transports that focused on recording crew<br />
flight control inputs and the resulting control<br />
surface movements, with parameter retr<strong>of</strong>its to be<br />
completed by January 1, 1998.<br />
Increase parameter requirements for transport<br />
airplanes manufactured by January 1, 1996.<br />
Urgent retr<strong>of</strong>it <strong>of</strong> all Boeing 737 airplanes with<br />
FDR parameters to record lateral acceleration,<br />
crew flight control inputs, and the resulting<br />
control surface movements by the end <strong>of</strong> 199 .<br />
The FAA responded by issuing a notice <strong>of</strong> proposed<br />
rulemaking (NPRM) in August 1996 and a final rule on<br />
August 18, 1997. Although the final rule generally met the<br />
requirements <strong>of</strong> the safety recommendations, the compliance<br />
dates were significantly relaxed from those recommended by<br />
the Safety Board. In addition, the FAA did not agree with the<br />
urgent recommendation to retr<strong>of</strong>it Boeing 737s by the end <strong>of</strong><br />
199 . However, the final rule did require that air transports<br />
record flight control crew inputs and control surface position.<br />
The final rule called for the following:<br />
Transport airplanes type certificated before<br />
October 1, 1969, and manufactured before<br />
October 11, 1991, must record as a minimum<br />
the first 18 to 22 parameters listed in the rule by<br />
August 18, 2001.<br />
Transport airplanes manufactured after<br />
October 11, 1991, and before August 18, 2001,<br />
must record as a minimum the first 34 parameters<br />
listed in the rule by August 18, 2001.<br />
Transport airplanes manufactured after<br />
August 18, 2000, must record as a minimum the<br />
first 7 FDR parameters listed in the rule.<br />
Transport airplanes manufactured after<br />
August 18, 2002, must record as a minimum all 88<br />
FDR parameters listed in the rule.<br />
The specific parameter requirements are contained in<br />
table 1.<br />
NTSB JOURNAL OF ACCIDENT INVESTIGATION, SPRING 2006; VOLUME 2, ISSUE 1 33<br />
1.<br />
2.<br />
3.<br />
1.<br />
2.<br />
3.<br />
4.
DENNIS GROSSI<br />
March 9, 1999<br />
NTSB and TSB Flight Recorder Recommendations<br />
The Transportation Safety Board <strong>of</strong> Canada (TSB) and the<br />
Safety Board worked together to develop the March 9, 1999,<br />
recommendations following the September 2, 1998, accident<br />
<strong>of</strong> Swissair flight 111, an MD-11. The regularly scheduled<br />
passenger flight from New York to Geneva, Switzerland, diverted<br />
to Halifax after the crew reported smoke in the cockpit. The<br />
airplane crashed into the waters near Peggy’s Cove, Nova Scotia,<br />
killing all 229 passengers and crew on board. The investigation<br />
was severely hampered by the lack <strong>of</strong> data from the CVR and<br />
FDR, which stopped nearly 6 minutes before the airplane hit<br />
the water.<br />
MANUFACTURED On or Before October 11, 1991<br />
(see Note)<br />
Compliance Dates: Next heavy maintenance after August 18, 1999,<br />
but no later than August 20, 2001.<br />
Non FDAU FDAU*<br />
1. Time<br />
2. Pressure Altitude<br />
3. Indicated Airspeed<br />
4. Heading<br />
5. Vertical Acceleration<br />
6. Pitch<br />
7. Roll<br />
8. Mic . Keying<br />
9. Thrust (each eng.)<br />
10. Autopilot Status<br />
11. Longitudinal Accel .<br />
12. Pitch control input<br />
13. Lateral control input<br />
14. Rudder pedal pos.<br />
15. Pitch control surface<br />
16. Lateral control surface<br />
17. Yaw control surface<br />
18. Lateral Accel . **<br />
As <strong>of</strong> July 1997, 1,929 Airplanes over 30 seats:<br />
727,737, DC -8, DC-9, F -28<br />
19. Pitch Trim or (except 82)<br />
20. Trailing edge flaps (except 85)<br />
21. Leading edge flaps(except 86)<br />
22. Thrust Rev. (each eng.)<br />
As <strong>of</strong> July 1997,<br />
1,360 airplane 30 seats or more<br />
704 turboprops<br />
A320, 737, 747, 757, 767, DC-10,<br />
F-28, MD-80, ATR-42, EMB-120,<br />
SAAB 340, DHC -8<br />
23. Ground spoilers (except 87)<br />
24. OAT<br />
25. AFCS modes/status<br />
26. Radio altitude<br />
27. Localizer deviation<br />
28. G/S deviation<br />
29. Marker beacon<br />
30. Master Warning<br />
31. Air/Ground switch<br />
32. Angle <strong>of</strong> Attack #<br />
33. Hydraulic pres. low<br />
34. Ground Speed #<br />
As <strong>of</strong> July 1997,<br />
1036 Airplanes over 30 seats<br />
277 airplanes 20 -30 seats<br />
737, 747, 757, 767, 777, f -100<br />
MD-11, MD -80, MD-88, MD-90<br />
ATR -72.<br />
Note: The following recommended parameters were not listed for Non FDAU aircraft:<br />
Pitch trim, OAT, AOA, Thrust Rev. , Flaps, Ground. Spoilers, AFCS modes Roll & Yaw Trim<br />
The following recommended parameters were not listed for FDAU aircraft mfg. before 10 -11-91:<br />
OAT, AOA, AFCS modes, Roll & Yaw Trim<br />
The following recommended parameters were not recorded for aircraft mfg. after 10 -11-91:<br />
Roll & Yaw Trim.<br />
* FDAU – Flight Data Acquisition Unit<br />
** For Airplanes with more than 2 engines Lateral Acceleration<br />
is not required unless capacity is available<br />
# Not intended to require a change in installed equipment<br />
Transport Airplane - 20 or more passengers<br />
The Swissair accident was another in a long history <strong>of</strong> accident<br />
and incident investigations that were hindered by the loss <strong>of</strong><br />
flight recorder information due to the interruption <strong>of</strong> aircraft<br />
electrical power to the flight recorders. However, innovations<br />
in recorder and power supply technologies have resulted in<br />
the development <strong>of</strong> an independent power source that would<br />
provide sufficient power to operate a solid-state flight recorder<br />
for 10 minutes. In addition, the availability <strong>of</strong> combined voice<br />
and data recorders has introduced the possibility <strong>of</strong> fitting two<br />
combined recorders on newly manufactured airplanes, with<br />
one recorder near the cockpit to reduce the probability <strong>of</strong> a<br />
mechanical or electrical interruption <strong>of</strong> the signals and power<br />
supply, and the second recorder as far aft as practical to enhance<br />
survivability. The Embraer-170, a recently introduced regional<br />
jet (RJ), is the first aircraft to be fitted with fore and aft “combi”<br />
recorders.<br />
Table 1. Parameter requirements for air carrier flight data recorders.<br />
FINAL RULE --PART<br />
121.344<br />
Flight Data Recorders for Transport Airplanes<br />
MANUFACTURED Between<br />
October 11, 1991 and<br />
August 18, 2000<br />
Compliance Dates:<br />
August 20, 2001<br />
Airplanes that need not comply:<br />
Convair 580, 600, 640, de Havilland DHC-7, Fairchild FH227,<br />
Fokker F -27 (except Mark 50), F28 Mark 1000 & 4000,<br />
Gulfstream G-159, Lockheed E10 -A, E10-B, E10 -E,<br />
Maryland Ind. F-27, Mitsubishi YS-11, Shorts SD330, SD360<br />
NEWLY MANUFACTURED<br />
Manufactured After<br />
August 18, 2000<br />
35. Ground Prox.<br />
36. Landing gear pos.<br />
37. Drift angle #<br />
38. Wind speed #<br />
39. Latitude/Longitude #<br />
40. Stall Warning #<br />
41. Windshear #<br />
42. Throttle lever pos.<br />
43. Additional engine prms .<br />
44. TCAS Warn.<br />
45. DME 1&2 distance<br />
46. NAV 1&2 frequency<br />
47. Selected Baro. #<br />
48. Selected Altitude #<br />
49. Selected Speed #<br />
50. Selected Mach #<br />
51. Selected Vertical Spd. #<br />
52. Selected Heading #<br />
53. Selected Flight Path #<br />
54. Selected Decision Height #<br />
55. EFIS display format #<br />
56. Multi-function eng/alerts #<br />
57. Thrust commanded #<br />
Manufactured After<br />
August 19, 2002<br />
58. Thrust Target #<br />
59. CG Trim fuel #<br />
60. Primary Nav. Sys.<br />
61. Icing #<br />
62. Eng. Wrn . Vibration #<br />
63. Eng. Wrn . Temp. #<br />
64. Eng. Wrn . Oil Press. #<br />
65. Eng. Wrn . Ovr. Spd. #<br />
66. Yaw Trim pos.<br />
67. Roll Trim pos.<br />
68. Brake Press. ( sel . sys)<br />
69. Brake Ped. Pos. (lt.&rt.)<br />
70. Yaw angle #<br />
71. Engine Bleed Vlv . #<br />
72. De-icing #<br />
73. Computed CG #<br />
74. AC bus status<br />
75. DC bus status<br />
76. APU bleed valve. #<br />
77. Hyd. press (each sys)<br />
78. Loss <strong>of</strong> cabin press.<br />
80. Heads-up #<br />
81. Para-visual #<br />
82. Trim input-pitch<br />
83. Trim input-roll<br />
84. Trim input-yaw<br />
85. Flap cntl. pos. TE.<br />
86. Flap cntl. pos. LE<br />
87. Grnd. Spoiler/Spd.<br />
Brk. pos. & sel.<br />
88. All flight control input<br />
forces.<br />
34 NTSB JOURNAL OF ACCIDENT INVESTIGATION, SPRING 2006; VOLUME 2, ISSUE 1
As a result <strong>of</strong> the Swissair accident, the Safety Board and<br />
the TSB issued safety recommendations on March 9, 1999, to<br />
require the following:<br />
1.<br />
2.<br />
3.<br />
By January 1, 200 , retr<strong>of</strong>it aircraft with a 2-hour<br />
solid-state CVR that is fitted with an independent<br />
power supply capable <strong>of</strong> operating the CVR and<br />
area microphone for 10 minutes when aircraft<br />
power to the CVR is lost.<br />
By January 1, 2003, fit all newly manufactured<br />
airplanes that are required to carry both a CVR<br />
and FDR with two combined voice and data<br />
recorders, one recorder located as close to the<br />
cockpit as practical and the other as far aft as<br />
practical.<br />
Amend Title 14 U.S. Code <strong>of</strong> Federal Regulations to<br />
require that CVRs, FDRs, and combination flight<br />
recorders be powered from separate generator<br />
buses with the highest reliability.<br />
In a March 19, 1999, letter, the FAA agreed to the<br />
recommendations without revision and promised to issue an<br />
NPRM by the end <strong>of</strong> the summer. However, the promised<br />
NPRM was not released until February 200 , and the Safety<br />
Board made additional flight recorder recommendations in the<br />
interim. These recommendations were prompted by the lack<br />
<strong>of</strong> recorder data for some air taxi accidents involving aircraft<br />
not required to have a recorder, the need for cockpit image<br />
recordings for a series <strong>of</strong> air carrier accidents, and the need<br />
for increased sampling rates for some FDR parameters. These<br />
recommendations if adopted would require the following:<br />
1.<br />
2.<br />
3.<br />
4.<br />
Issue an image recorder technical standard order<br />
(TSO), followed by installation <strong>of</strong> an image<br />
recorder on existing and newly manufactured<br />
turbine-powered aircraft engaged in Part 121,<br />
Part 13 , and commercial or corporate Part 91<br />
operations not currently required to have a flight<br />
recorder.<br />
Retr<strong>of</strong>it all turbine-powered aircraft that have<br />
the capability <strong>of</strong> carrying six or more passengers<br />
engaged in Part 121, 13 , or 91, with a 2-hour<br />
CVR.<br />
Equip existing and newly manufactured Part 121,<br />
12 , and 13 aircraft required to have a CVR and<br />
FDR with a 2-hour crash-protected image recorder<br />
capable <strong>of</strong> recording a color image <strong>of</strong> the entire<br />
cockpit.<br />
Require that all transport-category aircraft FDRs<br />
be capable <strong>of</strong> recording values that meet the<br />
AVIATION RECORDER OVERVIEW<br />
accuracy requirements through the full dynamic<br />
range <strong>of</strong> each parameter at a frequency sufficient<br />
to determine a complete and unambiguous time<br />
history <strong>of</strong> the parameter.<br />
The February 200 NPRM addressed most <strong>of</strong> the Safety<br />
Board’s recommendations for flight recorder enhancements,<br />
proposing that CVR duration be increased to 2 hours, that<br />
the sampling rate for some FDR parameters be increased, and<br />
that physical separation <strong>of</strong> the CVR and FDR be required.<br />
The NPRM also allowed a single combined CVR/FDR on<br />
some rotorcraft, improved power supply reliability including a<br />
10-minute independent power supply, and the recording <strong>of</strong><br />
data-link communications when so equipped. The NPRM<br />
did not address cockpit image recorders or the installation <strong>of</strong><br />
forward- and aft-mounted combined FDR/CVR recorders on<br />
newly manufactured transports.<br />
Figure 2. Spirit <strong>of</strong> St. Louis flight recorder.<br />
EVOLUTION OF FLIGHT RECORDERS<br />
Flight data recorders can be traced back to the origins <strong>of</strong><br />
power flight. Wilbur and Orville Wright’s historic first flight was<br />
documented by the first flight data recorder. This rudimentary<br />
device recorded propeller rotation, distance traveled through<br />
the air, and fight duration. Charles Lindbergh’s airplane the<br />
Spirit <strong>of</strong> St. Louis was also fitted with a flight-recording device.<br />
Lindbergh’s recorder was a bit more sophisticated, employing<br />
a barograph that marked changes in barometric pressure or<br />
altitude on a rotating paper cylinder (see figure 2).<br />
These early recordings survived because they were designed<br />
to record historical events, not mishaps. The first practical<br />
crash-protected flight data recorder was not introduced<br />
until 19 3. This recorder used styli to produce individual<br />
NTSB JOURNAL OF ACCIDENT INVESTIGATION, SPRING 2006; VOLUME 2, ISSUE 1 3
DENNIS GROSSI<br />
oscillographic tracings for each parameter on metallic foil. Time<br />
was determined by foil movement, which typically advanced<br />
at a rate <strong>of</strong> 6 inches per hour. This <strong>of</strong>ten resulted in an entire<br />
accident sequence being recorded within a 0.1 inch <strong>of</strong> foil<br />
movement. Investigators recovered the recorded information<br />
by optically reading the scribed markings through a microscope,<br />
and then converting the displacement <strong>of</strong> the scribed marks from<br />
the reference line to engineering units. This process was very<br />
time consuming and required a significant amount <strong>of</strong> reader<br />
interpretation.<br />
The 19 7 regulations that mandated the installation <strong>of</strong><br />
FDRs by July 19 8 created a market for FDRs that attracted<br />
other manufacturers who also used the metal foil oscillographic<br />
technique (see figures 3 and 4). The regulations also required<br />
compliance with TSO C- 1. This TSO defined range accuracy,<br />
sampling interval, and type parameters to be recorded (altitude,<br />
airspeed, heading, vertical acceleration, and time) and<br />
specified the requirement to survive a crash shock <strong>of</strong> 100 g and<br />
envelopment in an 1100° C flame for 30 minutes. The TSO also<br />
defined three basic types <strong>of</strong> flight recorders:<br />
Type I: a non-ejectable recorder, unrestricted location<br />
Type II: a non-ejectable recorder, subjected to a minimum<br />
1 -minute fire test, restricted to any location more than ½ <strong>of</strong><br />
the wing root chord from the main wing structure through the<br />
fuselage and from any fuel tanks<br />
Type III: an ejectable recorder, minimum 1. minutes fire<br />
test, unrestricted location.<br />
Figure 3. Early Lockheed model 109.<br />
Figure 4. Sundstrand Model 542 FDR, 1/2 ATR long format.<br />
The early recorders were all <strong>of</strong> the Type I design and most<br />
were mounted in the cockpit area or in the main gear wheel<br />
well. Unfortunately, these locations subjected the recorders to<br />
fire and impact forces that destroyed or severely damaged the<br />
recording medium. Type II and III recorders were never fitted<br />
to commercial air carriers; however, type III ejectable recorders<br />
are currently in use on some military aircraft.<br />
In the early 1960s, the CAB made a series <strong>of</strong> recommendations<br />
to the FAA that called for additional protection for FDRs against<br />
impact force and fire damage, and also recommended relocating<br />
the recorders to the aft area <strong>of</strong> the fuselage to provide maximum<br />
protection <strong>of</strong> the recording media. As a result, the FAA issued<br />
rule changes that specified the location <strong>of</strong> the recorder as far aft<br />
as practical and upgraded the performance standards in TSO<br />
C- 1, reissuing it as C- 1a. The upgraded TSO specifications<br />
increased the impact shock test from 100 g to 1,000 g and<br />
introduced static crush, impact penetration, and aircraft fluid<br />
immersion tests. The fire test was not changed. Unfortunately,<br />
neither TSO contained an adequate test protocol to ensure<br />
uniform and repeatable test conditions.<br />
At about the same time as the foil recorders were being<br />
developed in the United States, recorders that used magnetic<br />
steel wire as a recording medium were being developed in the<br />
United Kingdom. The wire recorders were the first to use digital<br />
pulse coding as a recording method. The robust design <strong>of</strong> the wire<br />
recorder made it a fairly reliable recorder for its time. Although<br />
the wire-recording medium was fairly impervious to postimpact<br />
fires, it did not fare as well with impact shock. The wire would<br />
<strong>of</strong>ten brake into several sections and become tangled, making it<br />
difficult and tedious to reassemble in the proper sequence.<br />
In the late 1940s, the French developed an FDR that used a<br />
photographic system that recorded data on light-sensitive paper.<br />
36 NTSB JOURNAL OF ACCIDENT INVESTIGATION, SPRING 2006; VOLUME 2, ISSUE 1
Fire<br />
Its obvious disadvantages were flammability and the tendency <strong>of</strong><br />
the recording to disappear when subjected to light. The French<br />
later adopted the metal foil oscillographic recorder.<br />
Cockpit Voice Recorder<br />
In response to CAB recommendations, the FAA conducted<br />
a study in 1960 to determine the feasibility <strong>of</strong> recording the<br />
spoken words <strong>of</strong> the flight crew for accident investigation<br />
purposes. Although cockpit ambient noise levels posed a<br />
significant obstacle to 1960 recording technology, the study<br />
showed that recording crew conversation was feasible. The<br />
following equipment capabilities were initially proposed:<br />
1.<br />
2.<br />
3.<br />
TSO C84<br />
CVR Requirements<br />
Record each crewmember’s conversation, both<br />
transmitted and received, with ground facilities<br />
and on the airplane’s intercommunication system.<br />
Also, record other conversation in the cockpit not<br />
conducted over those media. Provide sufficient<br />
channels to preclude the possibility <strong>of</strong> more than<br />
one crewmember recording on a channel at one<br />
time.<br />
Retain the last 30 minutes <strong>of</strong> the crew’s<br />
conversation.<br />
Provide for stopping the recorder in the case <strong>of</strong> a<br />
crash so that the last 30 minutes <strong>of</strong> conversation is<br />
not erased or overwritten.<br />
Table 2. Early flight recorder crash/fire survivability standards.<br />
1100°C flame covering 50% <strong>of</strong><br />
recorder for 30 minutes<br />
TSO C-51<br />
FDR Requirements<br />
1100°C flame covering 50%<br />
<strong>of</strong> recorder for 30 minutes<br />
AVIATION RECORDER OVERVIEW<br />
Ensure that recorder can withstand the crash<br />
conditions required in TSO-C 1.<br />
Ensure that recording is intelligible over the<br />
ambient noise <strong>of</strong> the cockpit or that unwanted<br />
noise can be filtered from the record with<br />
appropriate ground equipment.<br />
Ensure that recorder is capable <strong>of</strong> recording crew<br />
voices, other than on the communication and<br />
intercommunication systems, without the use <strong>of</strong><br />
lip or throat microphones.<br />
Inform the crew when the recorder is operating<br />
properly.<br />
As a result, the FAA issued rules mandating the use <strong>of</strong> CVRs<br />
on all transport-category aircraft and issued TSO C-84, which<br />
established crash fire survivability and equipment approval<br />
standards.<br />
Magnetic Tape Flight Recorders<br />
The introduction <strong>of</strong> the CVR in the late 1960s and DFDRs<br />
in the early 1970s made magnetic tape the recording medium<br />
<strong>of</strong> choice until the introduction <strong>of</strong> solid-state flight recorders in<br />
the late 1980s. Recorder manufacturers used a variety <strong>of</strong> tapes<br />
and tape transports. The most widely used tapes were Mylar®,<br />
kapton, and metallic. The tape transports were even more<br />
varied, using designs such as coplaner reel-to-reel, coaxial reelto-reel,<br />
endless loop reel packs, and endless loop random storage.<br />
NTSB JOURNAL OF ACCIDENT INVESTIGATION, SPRING 2006; VOLUME 2, ISSUE 1 37<br />
4.<br />
.<br />
6.<br />
7.<br />
TSO C-51a<br />
FDR Requirements<br />
1100°C flame covering 50% <strong>of</strong><br />
recorder for 30 minutes<br />
Impact Shock 100 g 100 g 1000 g for 5 ms<br />
Static Crush None None<br />
Fluid Immersion None None<br />
Water Immersion Immersion in sea water for 48 hours<br />
Penetration Resistance None None<br />
Immersion in sea water<br />
for 36 hours<br />
5,000 pounds for 5 minutes on each<br />
axis<br />
Immersion in aircraft fluids<br />
(fuel, oil, etc.) for 24 hours<br />
Immersion in sea water for 30 days<br />
500 pounds dropped from 10 feet<br />
with a ¼-inch-diameter contact<br />
point
DENNIS GROSSI<br />
Tape CVRs recorded four channels <strong>of</strong> audio for 30 minutes,<br />
and the DFDR recorded 2 hours <strong>of</strong> data. CVRs and FDRs<br />
recorded over the oldest data with the newest data in an endless<br />
loop-recording recording pattern. The DFDR tape transport<br />
and protective enclosure shown in figure is an endless loop<br />
real pack design adapted from a 1960s CVR.<br />
All <strong>of</strong> the magnetic tape flight recorders, including the units<br />
that used metallic tape, were found to be susceptible to thermal<br />
damage during postcrash fires. Although the TSOs called for<br />
a high-intensity fire test, the lack <strong>of</strong> a detailed test protocol<br />
allowed for a less than adequate design to be approved. In<br />
addition, the real world experience would show magnetic tape<br />
flight recorders to be most vulnerable when exposed to long<br />
duration fires, a test condition not required at the time tape<br />
flight recorders received TSO approval. In addition, metallic<br />
tapes were found to be vulnerable to impact shock, which tended<br />
to snap the tape, releasing the spring tension and unwinding the<br />
tape, causing further tape damage and loss <strong>of</strong> data.<br />
Digital Recording Method<br />
The DFDR and its companion recorder, the quick access<br />
recorder (QAR), were introduced about the same time. DFDRs<br />
and QARs use the same recording techniques, but as the name<br />
implies, the QAR can be quickly accessed and downloaded.<br />
Most early model QAR systems recorded far more parameters<br />
than the mandatory DFDR systems. As nonmandatory<br />
recorders, QARs were not designed to survive a crash impact<br />
and postimpact fire, although a number have survived fairly<br />
significant crashes.<br />
Most DFDRs and QARs require a flight data acquisition unit<br />
(FDAU) to provide an interface between the various sensors<br />
and the DFDR. The FDAU converts analog signals from the<br />
sensors to digital signals that are then multiplexed into a serial<br />
Figure 5. Fairchild model F800 DFDR, 1/2 ATR long format.<br />
data stream suitable for recording by the DFDR. Industry<br />
standards dictate the format <strong>of</strong> the data stream, which for the<br />
vast majority <strong>of</strong> tape-based DFDRs is 64 12-bit data words per<br />
second. The recording capacity <strong>of</strong> the tape DFDR is limited<br />
by the length <strong>of</strong> tape that can be crash-protected and the data<br />
frame format. The capacity <strong>of</strong> the tape DFDRs was adequate<br />
for the first generation <strong>of</strong> wide-body transports, but was quickly<br />
exceeded when aircraft like the Boeing 767 and Airbus A320<br />
with digital avionics were introduced.<br />
Digital Avionics Systems<br />
The introduction <strong>of</strong> digital avionics systems into commercial<br />
aviation in the early 1980s significantly increased the amount<br />
<strong>of</strong> information available to DFDRs and QARs. Digital avionics<br />
also brought about digital data buses, which carry digital data<br />
between systems. This made vast amounts <strong>of</strong> critical flight and<br />
aircraft system information available to the DFDR and QAR<br />
simply by tapping into the buses. The introduction <strong>of</strong> digital<br />
data buses also brought about digital FDAUs (DFDAU). The<br />
FDAU and DFDAU perform the same function except that<br />
DFDAUs can interface with the data buses and analog sensors.<br />
Solid-State Flight Recorders<br />
The introduction <strong>of</strong> solid-state flight recorders in the late<br />
1980s marked the most significant advance in evolution <strong>of</strong> flight<br />
recorder technology. The use <strong>of</strong> solid-state memory devices in<br />
flight recorders has expanded recording capacity, enhanced<br />
crash/fire survivability, and improved recorder reliability. It is<br />
now possible to have 2-hour CVRs and DFDRs that can record<br />
up to 2 6 12-bit data words per second, or 4 times the capacity<br />
<strong>of</strong> magnetic tape DFDRs. Survivability issues identified over<br />
the years have been addressed with new crash/fire survivability<br />
standards developed in close cooperation between accident<br />
38 NTSB JOURNAL OF ACCIDENT INVESTIGATION, SPRING 2006; VOLUME 2, ISSUE 1
investigators and the recorder industry (see table 3). The lack<br />
<strong>of</strong> moving parts in solid-state recorders has greatly improved<br />
recorder reliability.<br />
Future Flight Recorder Capabilities Requirements<br />
As proposed in the Safety Board’s March 9, 1999,<br />
recommendation letter to the FAA, two combination<br />
voice-data recorders built to TSO C123a and C124a standards<br />
will provide the redundant recording capabilities that separate<br />
CVRs and DFDRs cannot. Locating one recorder in the nose<br />
<strong>of</strong> the aircraft and the other in the tail will further enhance the<br />
probability <strong>of</strong> capturing catastrophic events that would otherwise<br />
compromise the CVR and DFDR when they are colocated. The<br />
forward-mounted flight recorder will be close to the cockpit and<br />
the avionics compartment, which reduces the possibility <strong>of</strong> signal<br />
loss. The addition <strong>of</strong> a 10-minute, independent alternate power<br />
supply adjacent to the flight recorder will further enhance the<br />
possibility that the recorder will be powered and critical data<br />
will be recorded until the end <strong>of</strong> the flight.<br />
Table 3. Current flight recorder crash/fire survivability standards.<br />
TSO C123a (CVR) and C124a (DFDR)<br />
AVIATION RECORDER OVERVIEW<br />
The next-generation combination flight recorders will<br />
be required to record more than the traditional voice and<br />
data parameters. The FAA’s February 200 flight recorder<br />
NPRM calls for the recording <strong>of</strong> Controller Pilot Data Link<br />
(CPDL) messages if an aircraft is equipped to use data-link<br />
communications. Recent advancements in video technology<br />
have made video recording a distinct possibility in the<br />
not-too-distant future. The International Civil Aviation<br />
Organization (ICAO) Flight Recorder Panel has concluded that<br />
video technology has matured to the point that specific technical<br />
aspects must be determined. The European Organization for<br />
Civil Aviation Equipment (EUROCAE) has since issued its<br />
image recorder standard, which was recently incorporated into<br />
a notice <strong>of</strong> proposed technical standard order C176, Aircraft<br />
Image Recorder Systems.<br />
Fire (High Intensity) 1100°C flame covering 100% <strong>of</strong> recorder for 30 minutes. (60 minutes if ED56 test protocol is used)<br />
Fire (Low Intensity) 260°C Oven test for 10 hours<br />
Impact Shock 3,400 g for 6.5 ms<br />
Static Crush 5,000 pounds for 5 minutes on each axis<br />
Fluid Immersion Immersion in aircraft fluids (fuel, oil etc.) for 24 hours<br />
Water Immersion Immersion in sea water for 30 days<br />
Figure 6. Typical solid-state CVR and DFDR.<br />
Penetration Resistance 500 pounds dropped from 10 feet with a ¼-inch-diameter contact point<br />
Hydrostatic Pressure Pressure equivalent to depth <strong>of</strong> 20,000 feet<br />
NTSB JOURNAL OF ACCIDENT INVESTIGATION, SPRING 2006; VOLUME 2, ISSUE 1 39
DENNIS GROSSI<br />
AIR TRAFFIC CONTROL RADAR<br />
AND AUDIO RECORDINGS<br />
Ground-based recordings <strong>of</strong> the air traffic control (ATC)<br />
radar and radio transmissions provide aircraft communication<br />
and position time history information. The FAA records all<br />
radio communications between controllers and pilots, and also<br />
landline communications between controllers. Air Route Traffic<br />
Control Centers (ARTCC) provide complete radar coverage <strong>of</strong><br />
the United States and parts <strong>of</strong> Canada and Mexico. In addition,<br />
most ATC airport approach radar facilities also record.<br />
ATC Communication Recordings<br />
Recordings <strong>of</strong> the two-way radio communications between<br />
controllers and pilots and inter-controller communications via<br />
landlines are maintained for 30 days. In the event <strong>of</strong> an accident<br />
or incident, the original recording <strong>of</strong> the event can be set aside<br />
and retained for investigators; otherwise, the recording medium<br />
will be reused and the information lost.<br />
The ATC communications recordings have provided vital<br />
information to investigators. In instances where the aircraft are<br />
not fitted with a CVR, these recordings provide the only record<br />
<strong>of</strong> flight crew communications and have at times provided<br />
background sounds (for example, wind noise, rotor speed,<br />
sounds <strong>of</strong> cockpit warnings) that have proven to be vital to<br />
the investigations. A time code is also recorded with the audio<br />
communications to provide a time reference independent <strong>of</strong><br />
any subtle recording anomalies.<br />
ATC and Other Radar Recordings<br />
Recorded radar data can provide aircraft position time<br />
history information by recording the position coordinates <strong>of</strong><br />
individual radar returns, time, and when available, altitude<br />
and identification information transmitted from the aircraft.<br />
Altitude and identification data are produced by a transponder 1<br />
fitted to the aircraft that also reinforces the radar return.<br />
The rate at which the radar antenna rotates will determine<br />
the sampling interval between returns. ARTCC rotates at<br />
between to 6 revolutions per minute (that is, generating radar<br />
returns every 10 to 12 seconds), whereas airport approach radar<br />
antennas do a complete rotation every 4.8 seconds. The most<br />
accurate position coordinates recorded by the ARTCC are in<br />
latitude and longitude, whereas approach radar records position<br />
coordinates as range and azimuth values, and both record the<br />
transponder-generated altitude values.<br />
1 A transponder is a receiver/transmitter that generates a reply signal upon<br />
proper interrogation from a radar facility.<br />
Military and private radar facilities can provide similar<br />
position time history information. Military aircraft Airborne<br />
Warning and Control Systems (AWAC) and naval vessel radar<br />
data are also recorded and are available to investigators upon<br />
request.<br />
Use <strong>of</strong> ATC Recordings by <strong>Accident</strong> Investigators<br />
The importance <strong>of</strong> ATC recorded data is determined by the<br />
circumstances surrounding an accident or incident. <strong>Accident</strong>s<br />
or incidents involving very dynamic conditions, such as<br />
aerodynamic stall and loss <strong>of</strong> control, are difficult to evaluate<br />
with ATC data alone. ATC data are more significant for less<br />
dynamic accidents, such as controlled flight into terrain, or<br />
when used in conjunction with FDR and CVR data.<br />
Correlation <strong>of</strong> events common to the ATC recordings and<br />
the FDR and CVR recordings can provide a very accurate local<br />
time reference. This can become critical because the FDR and<br />
CVR are only required to record relative time, and the local<br />
time reference may vary from one ATC facility to the next.<br />
ATC radar and FDR data can be correlated by comparing the<br />
altitude time histories, and ATC communication recordings can<br />
be correlated by the radio transmission time histories recorded<br />
by the various ATC facilities and the CVR and FDR.<br />
In addition to a time reference, ATC-recorded information<br />
also provides ground track reference, which is essential in<br />
performance-related accidents. A wind model can be developed<br />
when radar flight path data are combined with FDR parameters,<br />
such as altitude airspeed and heading and airplane acceleration<br />
parameters. This is particularly useful in accidents or incidents<br />
involving dynamic meteorological conditions, such as wind<br />
shears or crosswind and turbulence conditions.<br />
ATC radar data are particularly useful in evaluating the<br />
relative position <strong>of</strong> aircraft when multiple aircraft are involved.<br />
<strong>Investigation</strong>s <strong>of</strong> mid-air collisions and wake turbulence<br />
encounters rely heavily on this information.<br />
Significant accuracy and resolution limitations must be<br />
considered when using recorded radar data. The accuracy<br />
limitations are known and should be factored into the ground<br />
track calculations. The sampling intervals <strong>of</strong> 4.7 to 12 seconds<br />
present a significant limitation on usefulness <strong>of</strong> recorded radar<br />
data.<br />
NONVOLATILE MEMORY DEVICES<br />
Modern aircraft use an increasing number <strong>of</strong><br />
microprocessor-based electronic devices for operational and<br />
maintenance purposes. As a result, aircraft are fitted with<br />
nonvolatile memory (NVM) to store information, such as flight<br />
40 NTSB JOURNAL OF ACCIDENT INVESTIGATION, SPRING 2006; VOLUME 2, ISSUE 1
crew entries to the navigation database, system fault messages<br />
generated by electronic control devices, and system status<br />
messages. These devices, generally known as electronically<br />
erasable read-only memory (EEROM), provide temporary<br />
storage <strong>of</strong> transitional information during power interruptions.<br />
The term “nonvolatile” implies that the stored information will<br />
be available if the system is electrically powered or not.<br />
<strong>Accident</strong> investigators have found NVM to be a valuable<br />
source <strong>of</strong> information. However, because NVM is not<br />
crash- or fire-protected, there is no assurance that it will be<br />
available following a catastrophic accident. That said, NVM<br />
has survived severe impacts and postimpact fires in a significant<br />
number <strong>of</strong> cases.<br />
The recovery <strong>of</strong> information from undamaged NVM<br />
systems can be as simple as powering the system and reading<br />
or downloading the information. Damaged units may require<br />
system experts at the manufacturer’s facility to disassemble the<br />
unit to recover the information using specialized equipment<br />
and s<strong>of</strong>tware.<br />
The amount <strong>of</strong> effort and technical expertise needed to<br />
recover information from NVM is generally determined by the<br />
amount <strong>of</strong> damage and system complexity. The first step in<br />
the recovery process is a visual inspection <strong>of</strong> the disassembled<br />
unit to determine the amount <strong>of</strong> damage. It may be possible<br />
to simply replace a damaged connector or place the circuit<br />
board containing the memory device in a serviceable unit to<br />
recover the data. However, extreme caution must be taken<br />
when applying power to units that are suspected <strong>of</strong> receiving<br />
impact shocks that exceed the normal design requirements: an<br />
undetected short or open circuit might result in the loss <strong>of</strong> the<br />
stored data.<br />
Example: Lauda Air, Flight NG004, May 26, 1991<br />
The May 26, 1991, fatal accident <strong>of</strong> Lauda Air flight NG004,<br />
a Boeing 767 that crashed in Suphan-Buri Province, Thailand,<br />
demonstrated the importance <strong>of</strong> NVM. The aircraft departed<br />
controlled flight while climbing through 24,000 feet and<br />
experienced an in-flight breakup during the recovery maneuver<br />
and subsequently crashed in the jungle. The FDR magnetic<br />
tape recording medium was destroyed by the postcrash fire and<br />
provided no data. However, crew comments recorded by the<br />
CVR indicated a problem with an engine thrust reverser just<br />
before the loss <strong>of</strong> control.<br />
The electronic engine control (EEC) units for both engines<br />
were removed from the aircraft wreckage and brought to<br />
the manufacturer’s facility in Windsor Locks, Connecticut,<br />
to recover the fault messages stored in the NVM. The EECs<br />
showed signs <strong>of</strong> severe impact shock. As a result, the EEROMs<br />
containing the NVM were removed from the circuit board<br />
and mounted on an identical laboratory test unit. A normal<br />
AVIATION RECORDER OVERVIEW<br />
fault message download was performed and the data were<br />
subsequently processed using the manufacturer’s proprietary<br />
s<strong>of</strong>tware.<br />
Each time an EEC fault message was generated, the following<br />
information was captured and stored in NVM:<br />
• diagnostic fault messages codes<br />
values for N1 (high pressure compressor rotation<br />
speed), P2 (fan inlet total pressure), mach number,<br />
temperature (cold junction compensation)<br />
• fault time in elapsed hours<br />
•<br />
logging <strong>of</strong> flight and leg cycles<br />
The recovered data contained diagnostic messages from the<br />
last 390 hours <strong>of</strong> operation, which spanned 9 flights. The EECs<br />
from the left engine, which experienced the uncommanded<br />
thrust reverser deployment, provided a significant amount <strong>of</strong><br />
information specifically relating to the faulty thrust reverser and<br />
ancillary altitude, airspeed, and engine thrust values provided<br />
key reference values, which gained significance in light <strong>of</strong> the<br />
loss <strong>of</strong> the FDR data. The EEC from the right engine, which did<br />
not record any faults during the accident flight, yielded little<br />
additional information.<br />
CONCLUSIONS<br />
As far back as the early 1940s, the aviation community<br />
realized that, if commercial aviation were to prosper, public<br />
confidence must be gained and maintained through a quick<br />
and accurate determination <strong>of</strong> probable cause <strong>of</strong> any aviation<br />
mishap. It was also obvious that the nature <strong>of</strong> aviation accidents<br />
would require the use <strong>of</strong> recording devices to provide accident<br />
investigators with the information needed to determine the<br />
cause <strong>of</strong> a mishap and take the proper corrective action to<br />
prevent a similar mishap from recurring.<br />
The first flight recorders introduced over 40 years ago gave<br />
accident investigators their first appreciation <strong>of</strong> the recorder’s<br />
safety potential. However, the data provided by these early<br />
recorders were limited and <strong>of</strong>ten <strong>of</strong> such poor quality that<br />
investigators could at best determine what happened, but not<br />
with a high degree <strong>of</strong> certainty as to why it happened.<br />
Flight recording technology has had to adapt to a rapidly<br />
evolving commercial aviation industry and the corresponding<br />
needs <strong>of</strong> accident investigators. One <strong>of</strong> the most significant<br />
changes in recorder technology occurred in the early 1970s<br />
with the introduction <strong>of</strong> digital data recorders. The amount and<br />
quality <strong>of</strong> data provided by DFDRs, CVRs, and other recorded<br />
data, like ATC radar, gave accident investigators their first<br />
real opportunity to pursue an in-depth evaluation <strong>of</strong> the facts,<br />
NTSB JOURNAL OF ACCIDENT INVESTIGATION, SPRING 2006; VOLUME 2, ISSUE 1 41<br />
•
DENNIS GROSSI<br />
conditions, and circumstances surrounding an occurrence. The<br />
introduction <strong>of</strong> digital recordings also made it practical to use<br />
flight recorder data proactively.<br />
The introduction <strong>of</strong> digital avionics and fly-by-wire<br />
technologies in the 1980s provided investigators with challenges<br />
and opportunities. This new technology eliminated some<br />
well-established investigative techniques while <strong>of</strong>fering an<br />
opportunity to record and recover vast amounts <strong>of</strong> previously<br />
unattainable information. Indeed, the amount <strong>of</strong> available<br />
information overwhelmed early-model DFDRs. However, the<br />
advent <strong>of</strong> solid-state recorders has solved the recorder capacity<br />
problem while improving survivability and reliability.<br />
The future <strong>of</strong> flight recording is promising. Advances in<br />
recorder and aircraft systems will allow for the introduction <strong>of</strong><br />
recording techniques to record video images <strong>of</strong> the cockpit and<br />
data link messages, as well as providing more opportunities for<br />
the proactive use <strong>of</strong> flight data to prevent accidents.<br />
THE AUTHOR<br />
DENNIS R. GROSSI is a National Resource Specialist for Flight Data Recorders in the Vehicle Recorder Division at the NTSB.<br />
Mr. Grossi has served as the U.S. representative to the International Civil Aviation Organization on Flight Recorder Panels. He<br />
has also participated in the European Organization for Civil Aviation Equipment, Working Group , “Minimum Operational<br />
Performance Specification for Flight Data Recorder System,” and Working Group 0, “On Board Recording <strong>of</strong> Communications<br />
Navigation Surveillance (CNS)/Air Traffic Management (ATM) Messages.”<br />
42 NTSB JOURNAL OF ACCIDENT INVESTIGATION, SPRING 2006; VOLUME 2, ISSUE 1
A Mathematical Cross-Correlation for Time-Alignment <strong>of</strong><br />
Cockpit Voice Recorder and Flight Data Recorder Data<br />
Joseph A. Gregor, National Transportation Safety Board<br />
ABSTRACT<br />
A new method is described for performing timing correlations between flight data<br />
recorder and cockpit voice recorder information. This method involves the use <strong>of</strong> the crosscorrelation<br />
function to “search” the typically larger FDR data file for a best match to the<br />
event pattern present in the CVR data file. The results <strong>of</strong> this search give a first-order<br />
estimate <strong>of</strong> the time differential between identical events as recorded on both units. A simple<br />
curve fit may then be employed to obtain a general conversion from time as represented in<br />
the CVR, tcvr, and time as represented in the FDR, tfdr.<br />
INTRODUCTION<br />
Investigators are <strong>of</strong>ten called upon to utilize electronic data acquired from multiple<br />
sources in the course <strong>of</strong> the data collection and analysis phase <strong>of</strong> an accident investigation.<br />
The two most common sources <strong>of</strong> electronic information available in the event <strong>of</strong> a major<br />
aviation accident are the flight data recorder (FDR) and the cockpit voice recorder (CVR)<br />
although many other sources <strong>of</strong> data are present on modern-day aircraft, and these other<br />
sources are being utilized with increasing frequency. Currently, most on-board data sources<br />
have one negative characteristic in common: they typically operate on an independent<br />
time-base. In addition, virtually all recorded data are currently acquired and stored without a<br />
time-stamp. As a result, there is usually little or no independent information on the relative<br />
or absolute time at which an electronically “recorded” event occurred. All that is known<br />
is the relative time between the beginning <strong>of</strong> each recording, and the time at which the<br />
event occurred. A key first step in the accident investigation process is the synchronization<br />
<strong>of</strong> all collected electronic data to a common time-base, followed by a determination <strong>of</strong> the<br />
relationship between this elapsed “ship-time” and an appropriate local or global clock (local<br />
time or UTC 1 ). This task is typically accomplished by matching the electronic signature <strong>of</strong><br />
1 Coordinated Universal Time - equivalent to mean solar time at the prime meridian (0° longitude).<br />
NTSB JOURNAL OF ACCIDENT INVESTIGATION, SPRING 2006; VOLUME 2, ISSUE 1 43
JOSEPH GREGOR<br />
a common event or series <strong>of</strong> events recorded on each electronic<br />
data source to obtain a common elapsed time-base. One <strong>of</strong><br />
these events, occurring at a known local or UTC time, is then<br />
used to translate from elapsed time to local time or UTC.<br />
THE DATA REDUCTION PROCESS<br />
FDR information is typically recorded in digital form as a<br />
continuous series <strong>of</strong> interleaved samples representing data<br />
obtained from various sensors located aboard the aircraft.<br />
These sensors are used to measure various flight and aircraft<br />
systems parameters such as airspeed, altitude, pitch, roll, and<br />
yaw. Sampled integer data are interleaved and organized into<br />
groups – or “subframes” – and identified by a subframe reference<br />
number (SRN). A subframe is similar to the type structure in<br />
an object-oriented programming language. The parameter data<br />
within each subframe are akin to the individual fields within the<br />
structure. A typical FDR can record 64, 128, or 2 6 samples<br />
per subframe, and store anywhere from 2 to 100 hours <strong>of</strong> flight<br />
data. Newer installations will be capable <strong>of</strong> storing even larger<br />
subframes. In a typical installation, each subframe represents<br />
data acquired over a one-second timeframe. Some parameters<br />
are sampled only once per second, so that one sample <strong>of</strong> data<br />
from this source will appear within each subframe. Some<br />
parameters are sampled several times per second, yielding<br />
several samples within each subframe. A few parameters are<br />
sampled at a rate less than once per second, and these data will<br />
only be present in a certain subset <strong>of</strong> the available subframes.<br />
Individual parameters will always appear in the same relative<br />
order within each subframe. This order, together with the SRN<br />
number, 2 may be used to determine the acquisition time <strong>of</strong> the<br />
data represented by any parameter.<br />
CVR information may be recorded in either analog or digital<br />
form, depending on the model <strong>of</strong> recorder employed. If in analog<br />
form, the information is digitally sampled in the laboratory as<br />
step one <strong>of</strong> the data reduction process. CVR information is<br />
eventually expressed in the form <strong>of</strong> digital WAV 3 files containing<br />
audio information sampled at a rate <strong>of</strong> ≥ 22,050 Sa/s. 4 A<br />
typical CVR recording contains three to four tracks <strong>of</strong> audio<br />
from independent sound transducers (microphones). Older<br />
units employ magnetic tape as the storage medium, recording<br />
30 minutes <strong>of</strong> audio simultaneously from each transducer in a<br />
closed-loop system wherein older information is overwritten<br />
by new information. Newer units employ semiconductor flash<br />
memory. These units typically include two tracks <strong>of</strong> audio<br />
2 A number representing the number <strong>of</strong> subframes since the beginning<br />
<strong>of</strong> the FDR recording. The current standard creates and stores one<br />
subframe <strong>of</strong> data every second.<br />
3 A file format developed by Micros<strong>of</strong>t and used extensively in Micros<strong>of</strong>t<br />
Windows for the recording, storage, and playback <strong>of</strong> audio sound.<br />
4 Sa/s = samples per second.<br />
information recorded for 2 hours on a simulated closed-loop<br />
system, in addition to four tracks <strong>of</strong> higher fidelity 30-minute<br />
recordings representing the last half-hour <strong>of</strong> operation.<br />
Once the CVR and FDR information is expressed in digital<br />
form, it is important to know which sample within the FDR<br />
data corresponds to a given sample in the CVR data. Both<br />
units operate in independent, uncorrelated time-bases and<br />
the data is generally not time stamped. As a result, there is no<br />
straightforward way to correlate the data between these two<br />
units. The method generally employed is to compare a sample<br />
from each source known to coincide with an identical recorded<br />
event. The event most easily exploited in this way is an<br />
activation <strong>of</strong> the microphone switch for initiation <strong>of</strong> an external<br />
radio transmission. This so-called ‘mic-key’ event is recorded as<br />
a Boolean variable in the FDR, sampled at a rate <strong>of</strong> 1 Sa/s. This<br />
means that within each subframe there will be one datapoint<br />
indicating the state <strong>of</strong> the microphone switch at the time the<br />
sample was taken. The corresponding radio transmission will<br />
appear as an audio signal on one or more tracks <strong>of</strong> the CVR<br />
recording. Often, an electronic artifact (transient) coinciding<br />
with the activation <strong>of</strong> the microphone key will also be present in<br />
the recorded audio. The sample number for this “event” within<br />
the digitized CVR data may be compared with the corresponding<br />
FDR SRN to determine the <strong>of</strong>fset time between these two units.<br />
Assuming that both time-bases operate at the same rate, all<br />
that remains is to identify an external event recorded on either<br />
unit for which the time <strong>of</strong> occurrence is known. One example<br />
would be an external radio transmission recorded on both the<br />
CVR and by an external FAA facility. The local or UTC time<br />
assigned to the ATC recording <strong>of</strong> this transmission may then<br />
be used to convert from CVR / FDR time to the appropriate<br />
global time.<br />
Several additional issues present themselves when making<br />
any real-world attempt at obtaining a mapping between the<br />
recorded CVR and FDR data. First, in the case <strong>of</strong> a tape-based<br />
analog CVR, variations in tape speed may cause the time-base<br />
within the unit to operate at an effective data rate different than<br />
that within the FDR. In fact, the effective CVR data rate may<br />
vary over the course <strong>of</strong> the recording if power fluctuations or<br />
mechanical difficulties within the tape drive mechanism occur.<br />
Second, pilots typically make many external radio transmissions<br />
during the course <strong>of</strong> a flight. This can lead to a large number<br />
<strong>of</strong> recorded microphone keying events. Depending on the<br />
integrity <strong>of</strong> the FDR data, there may be some uncertainty in<br />
the position <strong>of</strong> the accident flight (the SRN range) within what<br />
can be an extremely large data file. Both factors may lead to<br />
Air Traffic Control.<br />
44 NTSB JOURNAL OF ACCIDENT INVESTIGATION, SPRING 2006; VOLUME 2, ISSUE 1
ambiguity, creating difficulty in determining which FDR SRN<br />
corresponds to a given keying event within the CVR recording.<br />
These difficulties can be practically eliminated by employing a<br />
strictly mathematical approach to the problem.<br />
TIME ALIGNMENT USING A<br />
MATHEMATICAL TRANSFORM<br />
A MATHEMATICAL CROSS-CORRELATION FOR TIME-ALIGNMENT OF COCKPIT VOICE RECORDER AND FLIGHT DATA RECORDER DATA<br />
As a strictly mathematical problem, the task at hand is to<br />
obtain a transform from the elapsed time in the CVR timeframe,<br />
tcvr, to the elapsed time in the FDR timeframe, tfdr. The<br />
resulting transform and its inverse may then be used to convert<br />
from any given time in one frame to the corresponding time in<br />
the other frame. The simplest such transform is given by the<br />
equation,<br />
tcvr= tfdr+ C Eq. (1)<br />
where C is a constant giving the <strong>of</strong>fset between elapsed time in<br />
the CVR data and elapsed time in the FDR data. Equation (1)<br />
would be valid in the case where the timebase in each unit is<br />
operating at the same rate. If the timebase in one unit is running<br />
at a constant, but different, rate compared with that <strong>of</strong> the other<br />
unit, the resulting transform would take the form <strong>of</strong>,<br />
tcvr= b * tfdr+ C Eq. (2)<br />
where b represents the difference in rates between the two<br />
units.<br />
For a solid-state CVR and digital FDR, the transform is<br />
expected to take the form <strong>of</strong> Eq. (1). For a tape-based CVR<br />
where the tape transport operating speed is slightly different<br />
from the design speed – but is still a constant – the transform<br />
is expected to take the form <strong>of</strong> Eq. (2). If the tape transport<br />
speed were to fluctuate during the recording – due to electrical<br />
or mechanical problems – the required transform would take a<br />
more general form. Note that this model is completely general,<br />
and does not require any a priori assumption concerning the<br />
behavior <strong>of</strong> the time-base in either unit.<br />
USING CROSS-CORRELATION TO DETERMINE<br />
AN OFFSET TIME<br />
The first step in the determination <strong>of</strong> an appropriate<br />
transform is the identification <strong>of</strong> those samples in each data set<br />
corresponding to a common event. The event typically used<br />
for this purpose is a keying <strong>of</strong> the microphone switch for the<br />
purpose <strong>of</strong> making an external radio transmission. This event<br />
shows up as a Boolean “1” in the appropriate field <strong>of</strong> the FDR<br />
subframe for all SRNs during which the microphone was sensed<br />
as keyed-on. The initiation and termination <strong>of</strong> a microphone<br />
on-key event generally shows up as a transient in the CVR<br />
recording. Where this transient is not detectable, the start time<br />
and stop time <strong>of</strong> the corresponding audio signal may be used<br />
as a surrogate. The latter method is less accurate, however,<br />
since the pilot may not begin and end speaking the instant the<br />
microphone is keyed on or <strong>of</strong>f.<br />
Given the potentially large number <strong>of</strong> such on-key/<strong>of</strong>f-key<br />
events, it would be preferable to employ an automated method<br />
for determining which region within the FDR data best matches<br />
the available CVR data. This may be done most easily using the<br />
mathematical cross-correlation function, given by,<br />
For sampled data, the integral in Eq. (3) becomes a summation<br />
and the cross-correlation function takes the form <strong>of</strong>,<br />
Z(n) = ∑FDR(k)·CVR(k+n) Eq. (4)<br />
where FDR(n) and CVR(n) represent the state <strong>of</strong> the microphone<br />
key (on = ‘1’, <strong>of</strong>f = ‘0’) at sample time t = n/R, R is the sample<br />
rate in Sa/s, and n is the sample number. The resultant, Z(n),<br />
represents the degree <strong>of</strong> similarity between FDR and CVR for<br />
every possible time shift – or lag – between these two vectors.<br />
If the pattern <strong>of</strong> information appearing within the CVR data is<br />
reflected somewhere within the larger FDR data set, plotting<br />
Z(n) as a function <strong>of</strong> the number <strong>of</strong> lags, n, will result in a figure<br />
exhibiting a clear maximum at the <strong>of</strong>fset required to obtain the<br />
best match between these two data sets.<br />
Figures 1 – 3 illustrate the concept using a LabView 6<br />
simulation <strong>of</strong> the discrete cross-correlation function. The top<br />
graph in each figure represents elements 300 through 2000<br />
<strong>of</strong> a notional FDR on-key/<strong>of</strong>f key data vector. The middle<br />
graph represents a CVR on-key/<strong>of</strong>f-key data vector. The<br />
cross-correlation <strong>of</strong> these two vectors is shown in the bottom<br />
graph. In figure 1, we see that at zero lags there is no overlap<br />
between FDR and CVR, so that Z(n = ‘0’) = 0. In figure 2,<br />
the cross-correlation has progressed and we see that Z(n) is now<br />
non-zero for certain values <strong>of</strong> n ≤ 530. In figure 3, we see the<br />
final result for 0 ≤ n ≤ 1024, indicating that the FDR and CVR<br />
on-key/<strong>of</strong>f-key vectors match most closely for n = 698 lags.<br />
6 A graphically-based instrument automation and data analysis tool<br />
produced by National Instruments.<br />
NTSB JOURNAL OF ACCIDENT INVESTIGATION, SPRING 2006; VOLUME 2, ISSUE 1 4<br />
k<br />
h
JOSEPH GREGOR<br />
Figure 1. Example <strong>of</strong> running cross-correlation (bottom) <strong>of</strong> FDR on-key/<strong>of</strong>f-key<br />
data vector (top) with CVR on-key/<strong>of</strong>f-key data vector (middle) for n = 0.<br />
Figure 2. Example <strong>of</strong> running cross-correlation (bottom) <strong>of</strong> FDR on-key/<strong>of</strong>f-key<br />
data vector (top) with CVR on-key/<strong>of</strong>f-key data vector (middle) for 0 ≤ n ≤ 530.<br />
46 NTSB JOURNAL OF ACCIDENT INVESTIGATION, SPRING 2006; VOLUME 2, ISSUE 1
A MATHEMATICAL CROSS-CORRELATION FOR TIME-ALIGNMENT OF COCKPIT VOICE RECORDER AND FLIGHT DATA RECORDER DATA<br />
Figure 3. Example <strong>of</strong> running cross-correlation (bottom) <strong>of</strong> FDR on-key/<strong>of</strong>f-key.<br />
Cross-correlation results for a real-world case are illustrated<br />
graphically in figures 4 – 8. The individual FDR and CVR<br />
on-key/<strong>of</strong>f-key data vectors are shown in figures 4 and<br />
respectively. The x-axis in both figures represents elapsed<br />
time into the respective recording. For the FDR data in<br />
figure 4, this corresponds to the SRN. For the CVR data in<br />
figure , this corresponds to elapsed time in seconds, since<br />
the on-key/<strong>of</strong>f-key data was re-sampled at 1 Sa/s to make it<br />
compatible with the FDR on-key/<strong>of</strong>f-key data. The y-axis in<br />
both figures represents the Boolean variable for the microphone<br />
on-key/<strong>of</strong>f-key event, where a “1” indicates that the microphone<br />
was keyed-on at the indicated sample time, and a “0” indicates<br />
that the microphone was keyed-<strong>of</strong>f. Figure 6 shows the result <strong>of</strong> a<br />
discrete cross-correlation between these two vectors, indicating<br />
that the best match occurred for n = 1763 lags. Figures 7 and<br />
8 show the CVR data shifted by this amount and plotted atop<br />
the FDR data to illustrate the goodness <strong>of</strong> the match. Note that<br />
some on-key events are not simultaneously reflected in both data<br />
vectors. This will <strong>of</strong>ten occur for extremely short transmissions,<br />
where the microphone was keyed-on for less than 1 second.<br />
In this case, the data are effectively undersampled at 1 Sa/s,<br />
and so instances will occur where the FDR fails to register an<br />
on-key/<strong>of</strong>f-key event. Similarly, the algorithm gathering and<br />
re-sampling the CVR data may misidentify the presence or<br />
absence <strong>of</strong> an external transmission. These errors, unless<br />
extreme in number, will not invalidate the cross-correlation.<br />
Such mismatches will reduce the magnitude, and cause an<br />
apparent broadening <strong>of</strong>, the correlation peak. To first order,<br />
they will not change the number found for n. Once the number<br />
<strong>of</strong> lags is known, the time shift in seconds required to transform<br />
from FDR-time to CVR-time may be easily determined. This<br />
will yield the constant, C, required for any transform between<br />
elapsed time in each unit.<br />
At this point, all we have done is to obtain the <strong>of</strong>fset between<br />
elapsed time in the CVR and elapsed time in the FDR. This<br />
may or may not be sufficient to specify the required transform,<br />
depending on the behavior <strong>of</strong> the time-base in each unit. The<br />
exact form taken by this transform will fall into three broad<br />
classes:<br />
the time-base in each unit operates at the same<br />
constant rate,<br />
the time-base in each unit operates at a different<br />
constant rate, or<br />
the time-base operates at a different and variable<br />
rate in one or both units.<br />
For the first situation described above, the transform given<br />
by Eq. (1) applies and a determination <strong>of</strong> C suffices to solve<br />
the problem. For the second situation described above, the<br />
transform given in Eq. (2) may be employed. This requires<br />
the calculation <strong>of</strong> a slope, b, reflecting the difference in rate<br />
between the two time-bases. For the third situation, which<br />
may occur in the event <strong>of</strong> a malfunctioning tape based CVR<br />
unit, the transform will take on a more complex, possibly<br />
non-analytical, form.<br />
NTSB JOURNAL OF ACCIDENT INVESTIGATION, SPRING 2006; VOLUME 2, ISSUE 1 47<br />
1.<br />
2.<br />
3.
JOSEPH GREGOR<br />
Figure 4. FDR on-key/<strong>of</strong>f-key data, FDR(n), where “n” represents the subframe reference number (SRN) corresponding to the number <strong>of</strong> seconds since<br />
the FDR first began recording. A “1” indicates that the microphone was found keyed-on at the sample time.<br />
Figure 5. CVR on-key/<strong>of</strong>f-key data, CVR(n), where “n” represents the sample number. The data in this figure were sampled at a<br />
1 Hz rate to facilitate comparison with FDR(n). A “1” indicates that the microphone was found keyed-on at the sample time.<br />
48 NTSB JOURNAL OF ACCIDENT INVESTIGATION, SPRING 2006; VOLUME 2, ISSUE 1
A MATHEMATICAL CROSS-CORRELATION FOR TIME-ALIGNMENT OF COCKPIT VOICE RECORDER AND FLIGHT DATA RECORDER DATA<br />
Figure 6. Results <strong>of</strong> the cross-correlation between FDR(n) and CVR(n) showing a well-defined peak at n = 1763 lags.<br />
Figure 7. Overlay <strong>of</strong> FDR(n) [designated by x’s] with CVR(n) [designated by o’s] showing the<br />
alignment <strong>of</strong> identical events once the <strong>of</strong>fset found via the cross-correlation was applied.<br />
NTSB JOURNAL OF ACCIDENT INVESTIGATION, SPRING 2006; VOLUME 2, ISSUE 1 49
JOSEPH GREGOR<br />
USING CURVE-FITTING TECHNIQUES TO<br />
OBTAIN A FINAL TRANSFORM<br />
Figure 8. Overlay <strong>of</strong> FDR(n) [designated by x’s] with CVR(n) [designated by o’s] with<br />
the x-axis expanded to show the goodness <strong>of</strong> fit between the two data sets.<br />
The exact form <strong>of</strong> the transform required to convert from<br />
elapsed FDR time to elapsed CVR time may be found most<br />
generally by performing a simple curve fit on the time-aligned<br />
FDR and CVR data. If we subtract the value for C in Eq. (1) –<br />
obtained using the cross-correlation function – the times found<br />
for each corresponding on-key/<strong>of</strong>f-key event should be identical<br />
to within experimental measurement error. The magnitude<br />
<strong>of</strong> this error is primarily driven by the 1 Sa/s sample rate 7 <strong>of</strong><br />
the FDR on-key/<strong>of</strong>f-key data. The goodness <strong>of</strong> the resulting<br />
transform may be seen most easily by producing a scatter plot <strong>of</strong><br />
the data. Figure 9 shows such a plot for data corresponding to<br />
the simplest case, where the time-base operates at an identical,<br />
constant rate in both units.<br />
Each data point in this figure corresponds to a unique<br />
on-key/<strong>of</strong>f-key event, with elapsed FDR time plotted on the<br />
x-axis and elapsed CVR time plotted on the y-axis. The solid<br />
line corresponds to a minimum least squares fit to the data using<br />
a linear transform corresponding to Eq. (2). The results <strong>of</strong> this<br />
curve fit yield b = 1.0001 and C = 0.6 7, indicating that the<br />
timebases in both the CVR and the FDR were operating at the<br />
same rate to within a small fraction <strong>of</strong> a percent. Since the<br />
7 Several other sources <strong>of</strong> error may apply in setting the error bars for this<br />
calculation, but the sampling error is considered by far the largest source.<br />
data are normalized prior to performing the curve fit, we find<br />
C ≈ 0 ±1 s – well within the known error bar <strong>of</strong> ±1 Sa. Also<br />
plotted in this figure is a variable, called Delta, representing the<br />
difference between the elapsed CVR time as calculated using<br />
the resulting linear curve fit, and the corresponding elapsed time<br />
actually measured and plotted on the graph. This comparison<br />
is performed for each on-key/<strong>of</strong>f-key event to quantify the error<br />
in calculating elapsed CVR time from the elapsed FDR time<br />
using the calculated transform. The resulting error should fall<br />
within the ±1 s error bar established by the 1 Sa/s sample rate;<br />
the exact distribution is dependent on the relative phase <strong>of</strong> the<br />
actual on-key/<strong>of</strong>f-key event, the FDR sample acquisition time,<br />
and the CVR sample acquisition time [since the CVR data<br />
were also sampled at a 1 Hz rate to obtain a vector CVR(n)<br />
appropriate for correlating with FDR(n)].<br />
The situation highlighted in figure 10 is typical for a properly<br />
functioning solid-state CVR and FDR. Each unit in this case<br />
is operating from a precisely controlled digital time-base. In<br />
this case, the transform required to move from elapsed FDR<br />
time to elapsed CVR time should take the form <strong>of</strong> Eq. (1), with<br />
C given by the cross-correlation function. The curve fit in<br />
figure 9 serves as a validation that the data in FDR(n) and<br />
CVR(n) were acquired accurately. Any problem data would<br />
show up in the figure as an outlier, signalling the need for closer<br />
scrutiny and possibly a re-run <strong>of</strong> the algorithm once the problem<br />
with the data has been resolved.<br />
0 NTSB JOURNAL OF ACCIDENT INVESTIGATION, SPRING 2006; VOLUME 2, ISSUE 1
A MATHEMATICAL CROSS-CORRELATION FOR TIME-ALIGNMENT OF COCKPIT VOICE RECORDER AND FLIGHT DATA RECORDER DATA<br />
Figure 9. Scatter plot showing the results <strong>of</strong> a cross-correlation between FDR on-key/<strong>of</strong>f-key data and corresponding<br />
CVR on-key/<strong>of</strong>f-key data. Times are normalized to remove the calculated shift between CVR and FDR times, and<br />
normalized so that the data begin at time t=0.<br />
CASE STUDY INVOLVING A SLOPE ≠ 1<br />
On May 2, 2002, an Atlantic Coast Airlines Dornier 328,<br />
tail number 429FJ, experienced a smoke-in-the-cockpit<br />
emergency while en route from Greensboro, South Carolina,<br />
to LaGuardia International Airport, New York. Data were<br />
recovered from two flight recorders on-board the aircraft<br />
at the time <strong>of</strong> the mishap: a Fairchild Model FA-2100-403<br />
solid-state CVR, and an L-3 Communications Fairchild<br />
F-2100 FDR. Attempts at correlating the CVR and FDR data<br />
proved resistant to the standard technique normally employed<br />
in such cases. This technique involved engineers manually<br />
applying a piecewise linear fit to the data. Since both units<br />
were solid-state, the assumption was made that a one “piece” fit<br />
should suffice to characterize the entire data set. If this failed<br />
to work, an additional assumption could be made that one <strong>of</strong><br />
the units experienced a momentary power failure, thus causing<br />
a discontinuity in the time-base for that unit. In this case, a<br />
two-piece linear fit could be applied – one covering the period<br />
before the power upset, and one covering the period after the<br />
upset. If this did not satisfy, one could assume two power upset<br />
events, requiring a 3-piece linear fit, and so on. In the case <strong>of</strong><br />
the Dornier 328, the number <strong>of</strong> “pieces” required to effect a<br />
fit across the entire data set threw into question the validity<br />
<strong>of</strong> the entire procedure. The cross-correlation technique was<br />
developed as an independent method <strong>of</strong> identifying the most<br />
likely match between these two data sets – independent <strong>of</strong> any<br />
assumptions on their behavior, save that they should correlate<br />
with one another to some degree, since they represented two<br />
records <strong>of</strong> the same event.<br />
Data from the Dornier 328 CVR were cross-correlated with<br />
data from the FDR, resulting in the correlation peak illustrated<br />
in figure 10. Note that, while it is far less prominent than the<br />
peak found in figure 6 for a typical CVR/FDR combination<br />
(one yielding to standard correlation techniques), there is still<br />
a clearly identifiable peak. This illustrates the robust nature <strong>of</strong><br />
the cross-correlation technique. The broadening and flattening<br />
<strong>of</strong> the correlation peak are indications that, while a unique<br />
best-match has been found at the specified location, this match<br />
is not perfect.<br />
NTSB JOURNAL OF ACCIDENT INVESTIGATION, SPRING 2006; VOLUME 2, ISSUE 1 1
JOSEPH GREGOR<br />
When the correlated data for this case were plotted as in<br />
figure 9, the resulting curve fit turned out to be linear, but with<br />
b = 0.9831. This indicated that the time-base in one unit<br />
was operating at a constant but different rate when compared<br />
with the other. If the CVR had been a tape-based unit, the<br />
assumption would have been that the tape speed was <strong>of</strong>f, and<br />
the resulting transform applied to adjust the CVR data to match<br />
the FDR data. However, since both units were solid-state in<br />
this case, a different assumption was required.<br />
Researching these correlation problems with the manufacturer<br />
turned up an anomaly in the FDR recording system. In a typical<br />
installation, data are fed to the FDR in groups identified by SRN.<br />
Each group represents a repeating set <strong>of</strong> data points for the<br />
various parameters being measured. These groups are sent to<br />
the FDR at a rate <strong>of</strong> 1 per second – and each SRN is assumed to<br />
represent 1 second <strong>of</strong> flight data. In this particular installation,<br />
however, the data stream was being fed to the FDR at a rate<br />
<strong>of</strong> 61 groups per minute. As a result, each SRN represented<br />
roughly 60/61 = 0.9836 seconds <strong>of</strong> data, consistent with<br />
transform results found for b. Once this transform was applied,<br />
the corrected FDR on-key/<strong>of</strong>f-key data were found to overlay<br />
clearly with the CVR data at the <strong>of</strong>fset originally determined by<br />
the cross-correlation function.<br />
CONSIDERATIONS FOR MORE COMPLEX<br />
TRANSFORMS<br />
Valid correlations may always be obtained by assuming<br />
a linear transform as given in Eq. (2), provided that the<br />
time-bases in both units are operating at a fixed, constant rate.<br />
This will not be the case, however, if the time-base in one or<br />
both units changes rate during the recording. This may occur in<br />
the case <strong>of</strong> a solid-state recorder if power is momentarily lost to<br />
one <strong>of</strong> the boxes. In this instance, a linear fit as in Eq. (2) would<br />
still be valid on each side <strong>of</strong> the discontinuity. This may also<br />
occur for a tape-based CVR due to power supply fluctuations<br />
or mechanical changes in the tape drive mechanism. Either<br />
<strong>of</strong> these factors could change the tape speed, and hence the<br />
amount <strong>of</strong> information corresponding to 1 second <strong>of</strong> digitized<br />
data. When played back at a constant speed, the effect will be<br />
an apparent change in the time-base for that audio recording.<br />
Note that, since a tape-based CVR is an analog device, there<br />
is no reason to assume that the tape speed must change from<br />
one discrete constant value to another discrete constant value.<br />
Instead, the tape speed – and hence the time-base for the<br />
playback – may in principle take on any analog value. A linear<br />
transform as in Eq. (2) will not suffice in this case.<br />
In the past, such correlations have been performed by<br />
employing a piecewise linear fit to subsets <strong>of</strong> the recorded<br />
data. These sections are then reassembled to obtain a single<br />
contiguous data set. This is essentially equivalent to employing<br />
Eq. (2) over segments <strong>of</strong> the data, and performing a curve fit to<br />
obtain the values for b and C corresponding to a unique solution<br />
within each segment. Matching solutions at each end, one<br />
could obtain a transform for the entire data set <strong>of</strong> the form,<br />
tcvr= b1 * tfdr + C1 t0 < tfdr ≤ t1<br />
tcvr= b2 * tfdr + C2 t1 < tfdr ≤ t2<br />
tcvr= b3 * tfdr + C3 t2 < tfdr ≤ t3<br />
tcvr= b4 * tfdr + C4 t3 < tfdr ≤ t4<br />
Eq. (5)<br />
This method is not without its disadvantages. Picking the<br />
limits required to obtain a correlation using a minimum number<br />
<strong>of</strong> segments for the desired accuracy involves a significant<br />
amount <strong>of</strong> labor. If the flow <strong>of</strong> time in one <strong>of</strong> the units varies<br />
continuously, as may be expected for an analog device, the<br />
number <strong>of</strong> segments required to obtain a good fit could become<br />
extremely large. In addition, while the magnitude <strong>of</strong> the data<br />
may match at the boundaries, the derivative <strong>of</strong> the resulting<br />
curve will necessarily be discontinuous at the ends <strong>of</strong> each<br />
segment – an unphysical result.<br />
We may, however, extend this method to obtain a more<br />
accurate result with far less labor by recalling from basic<br />
calculus that any continuous function can be represented by<br />
a number <strong>of</strong> straight line segments. The larger the number <strong>of</strong><br />
segments, the closer the resulting representation will come to<br />
the true curve. The original curve can be reproduced exactly<br />
in the limit that an infinite number <strong>of</strong> segments are employed.<br />
This is nothing more than the description <strong>of</strong> a generalized curve<br />
fit. An accurate correlation to any data set not yielding to a<br />
linear fit may then be obtained by cross-correlating the data<br />
to obtain a first-order time alignment, and then calculating a<br />
cubic spline fit or similar generalized curve fit. This procedure<br />
may be easily implemented on any desktop computer using a<br />
wide variety <strong>of</strong> s<strong>of</strong>tware tools. The results may be plotted as in<br />
figure 9 to check the validity <strong>of</strong> the final solution.<br />
CONCLUSIONS<br />
A new method has been described for performing the<br />
correlation <strong>of</strong> time as represented in the CVR with time<br />
as represented in the FDR. This method employs the use<br />
2 NTSB JOURNAL OF ACCIDENT INVESTIGATION, SPRING 2006; VOLUME 2, ISSUE 1
<strong>of</strong> the cross-correlation function to obtain an <strong>of</strong>fset value<br />
representing the difference in elapsed time between a single<br />
event as recorded in each unit. This <strong>of</strong>fset time may be used to<br />
normalize the data to a common elapsed time-base. A curve fit<br />
performed on the normalized data will then give the transform<br />
required to convert between elapsed FDR time and elapsed<br />
CVR time. This transform may be employed to correct the time<br />
in one unit so that all identical events occur at identical times<br />
in both the CVR transcript and the FDR report. Since this<br />
method uses common mathematical functions and algorithms,<br />
it can be easily automated on a desktop computer under a wide<br />
variety <strong>of</strong> s<strong>of</strong>tware applications and programming languages. A<br />
priori assumptions regarding the behavior <strong>of</strong> the data can be<br />
avoided, since this method supports the use <strong>of</strong> any appropriate<br />
fitting function. The validity <strong>of</strong> the transform is easily checked<br />
graphically by comparison <strong>of</strong> the transformed data with<br />
independent measurements. The results <strong>of</strong> this effort are to be<br />
incorporated into a new state-<strong>of</strong>-the-art CVR transcription tool<br />
being developed for the NTSB by the Information Directorate<br />
<strong>of</strong> Air Force Research Laboratory (AFRL/IF). 8<br />
8 Cockpit Voice Recorder Transcription and Timing Tool. Funded through<br />
the Technical Support Working Group <strong>of</strong> the Combating Terrorism<br />
Technology Support Office; TSWG Task T-192 .<br />
THE AUTHOR<br />
A MATHEMATICAL CROSS-CORRELATION FOR TIME-ALIGNMENT OF COCKPIT VOICE RECORDER AND FLIGHT DATA RECORDER DATA<br />
JOSEPH A. GREGOR, Ph.D., is an Electronics Engineer in the Vehicle Recorder Division at the NTSB and is responsible for<br />
cockpit voice recorder readout and audio spectrum analysis in support <strong>of</strong> major and regional accident/incident investigations.<br />
Dr. Gregor assisted in the on-scene recovery <strong>of</strong> aviation data recorders at the Pentagon on September 11, 2001. He is currently<br />
serving as Safety Board representative to the interagency Technical Support Working Group <strong>of</strong> the Combating Terrorism<br />
Technology Support Office.<br />
NTSB JOURNAL OF ACCIDENT INVESTIGATION, SPRING 2006; VOLUME 2, ISSUE 1 3
Occupant Safety in Large School Buses:<br />
Crash <strong>Investigation</strong>s, Testing, and Modeling<br />
Kristin M. Poland, National Transportation Safety Board,<br />
Linda McCray, National Highway Transportation Safety Administration<br />
and Aida Barsan-Anelli, Information Systems and Services, Inc.<br />
ABSTRACT<br />
NTSB JOURNAL OF ACCIDENT INVESTIGATION, SPRING 2006; VOLUME 2, ISSUE 1<br />
School bus travel is one <strong>of</strong> the safest forms <strong>of</strong> transportation on the road today. A<br />
number <strong>of</strong> factors play into this excellent record, including the size and color <strong>of</strong> school buses,<br />
special traffic requirements, and specific safety specifications covering joint strength, ro<strong>of</strong><br />
strength, and occupant protection. This excellent record may be improved further as new<br />
research identifies ways to better protect school bus passengers. This paper summarizes work<br />
accomplished by both the National Transportation Safety Board and the National Highway<br />
Traffic Safety Administration to address the safety <strong>of</strong> large school buses.<br />
INTRODUCTION<br />
School buses are one <strong>of</strong> the safest forms <strong>of</strong> transportation on the road today. The passenger<br />
fatality rate in school buses is 0.2 fatalities per million vehicle miles traveled (VMT), compared<br />
to 1. per million VMT for passenger cars and 1.3 per million VMT for light trucks. 1 Each<br />
year on average, 10 school bus occupants are fatally injured in school bus crashes, and 16<br />
school-age pedestrians are fatally injured by school buses. Students in the United States are<br />
almost eight times safer traveling in a school bus than in another form <strong>of</strong> transportation,<br />
like the parent’s car. These safety statistics are true for a number <strong>of</strong> reasons, including the<br />
school bus’s operating environment, color, joint and ro<strong>of</strong> strength requirements, fuel system<br />
integrity, and compartmentalization. 2<br />
Despite the excellent safety record, research continues to explore ways to ensure the<br />
continued safety <strong>of</strong> school buses and to identify improvements. Since the late 1960s,<br />
1 Federal Register, October 26, 1998 (Volume 63, Number 206), on the National Highway Traffic Safety<br />
Administration’s School Bus Research Plan.<br />
2 Compartmentalization provides a protective envelope consisting <strong>of</strong> strong, closely spaced seats that have<br />
energy-absorbing seat backs. Compartmentalization is regulated under Federal Motor Vehicle Safety<br />
Standard No. 222, and is applicable to all school buses.
KRISTIN M. POLAND, LINDA McCRAY, AND AIDA BARSAN-ANELLI<br />
researchers have studied the crashworthiness <strong>of</strong> large school<br />
buses and the associated occupant safety systems inside the<br />
bus.<br />
The main focus <strong>of</strong> this paper is to review large school bus<br />
crashworthiness and the role <strong>of</strong> compartmentalization in<br />
protecting occupants. Included are reviews <strong>of</strong> recent crash<br />
investigations, full scale crash tests, sled tests, and simulation<br />
modeling conducted by the NTSB and the National Highway<br />
Traffic Safety Administration (NHTSA).<br />
Crash investigations, testing, and modeling are reviewed in<br />
an effort to assess the level <strong>of</strong> current protection provided to<br />
school bus occupants and also to assess potential future design<br />
considerations.<br />
INVESTIGATIONS AND TESTING<br />
<strong>Accident</strong> <strong>Investigation</strong>s<br />
The Safety Board investigates many <strong>of</strong> the severe, though<br />
rare, school bus accidents that occur in the United States. In<br />
each <strong>of</strong> these cases, investigators thoroughly reconstruct the<br />
accident by collecting detailed physical evidence, documenting<br />
vehicle damage, impact points, and witness marks, and studying<br />
the crash sequence through the use <strong>of</strong> simulation. The Board<br />
investigated more than six large school bus crashes as part <strong>of</strong> its<br />
1999 Bus Crashworthiness Issues report. 3 Since that time, four<br />
additional large school bus crashes have been investigated. 4<br />
Two <strong>of</strong> the crashes investigated by the Board are discussed here<br />
to illustrate the process and to reinforce the recommendations<br />
from the 1999 Board report.<br />
Monticello, Minnesota<br />
On April 10, 1997, a 77-passenger-capacity school bus was<br />
traveling west on Wright County Road 39, near Monticello,<br />
Minnesota, toward the intersection with Wright County Road<br />
11. On board were 13 children, ages to 11, and the driver.<br />
Meanwhile, a Mack truck tractor, pulling an empty semitrailer,<br />
was traveling north on Wright County Road 11, at a witnessestimated<br />
speed <strong>of</strong> 0 to mph.<br />
As both vehicles approached the intersection, the truck<br />
combination failed to stop for a posted stop sign and, leaving<br />
skid marks extending into the intersection, collided with the<br />
3 National Transportation Safety Board, Bus Crashworthiness Issues,<br />
Highway Special <strong>Investigation</strong> Report, NTSB/SIR-99/04 (Washington,<br />
DC: NTSB, 1999).<br />
4 Conasauga, Tennessee (HWY00MH036); Central Bridge, New<br />
York (HWY00FH001); Omaha, Nebraska (HWY02MH004); and<br />
Mountainburg, Arkansas (HWY01MH02 )<br />
See .<br />
school bus. At impact, the front <strong>of</strong> the school bus hit the right<br />
front side <strong>of</strong> the truck tractor at the tractor’s right front wheel<br />
with about 43 inches <strong>of</strong> overlap. A second impact occurred<br />
when the right truck tandems and the right front corner <strong>of</strong><br />
the semitrailer struck the left side <strong>of</strong> the bus body, about 9<br />
feet behind the forward edge <strong>of</strong> the bus body. A third impact<br />
occurred when the rear <strong>of</strong> the school bus rotated clockwise into<br />
the right side <strong>of</strong> the semitrailer. See figure 1.<br />
Figure 1. Damage to the bus in the Monticello, Minnesota, crash.<br />
The lap/shoulder belt-restrained truck driver and three bus<br />
passengers were killed. The lap belt-restrained school bus<br />
driver received moderate injuries, five students received minor<br />
to moderate injuries, and five students received serious to severe<br />
injuries. The bus was not equipped with any form <strong>of</strong> passenger<br />
restraints.<br />
Using a human vehicle environment system, 6 m-smac<br />
s<strong>of</strong>tware, 7 and Mathematical Dynamical Models (MADYMO), 8<br />
the Safety Board conducted vehicle dynamics and occupant<br />
kinematics simulations for this investigation. Six simulated<br />
occupants, located in the rear <strong>of</strong> the bus, were modeled. These<br />
occupants were chosen because the passengers who sustained<br />
fatal injuries in the Monticello accident were reportedly riding<br />
in three rear seats on the driver’s side and because <strong>of</strong> the<br />
potential interaction with the surrounding occupants.<br />
The vehicle simulation results indicated that, at impact, the<br />
tractor semitrailer was traveling approximately 49.4 mph and<br />
the bus, approximately 0 mph. Figure 2 details the linear and<br />
angular acceleration time history <strong>of</strong> the bus as predicted by the<br />
simulation. The three impacts, described earlier, can be seen in<br />
the plot. The severity <strong>of</strong> this crash is indicated by the peak linear<br />
6 HVE Human Vehicle Environment, Version 3, Engineering Dynamics<br />
Corporation, Beaverton, Oregon 97008.<br />
7 R.R. McHenry, B.G. McHenry, McHenry <strong>Accident</strong> Reconstruction, 1998<br />
McHenry Seminar, McHenry Engineering.<br />
8 MADYMO, User’s Manual 3D Version 5.4, May 1999, Copyright 1999,<br />
TNO Automotive. MADYMO is a general-purpose s<strong>of</strong>tware package<br />
that allows users to design and optimize occupant safety systems using<br />
both a rigid and flexible body.<br />
6 NTSB JOURNAL OF ACCIDENT INVESTIGATION, SPRING 2006; VOLUME 2, ISSUE 1
Linear Acceleration (g)<br />
accelerations on the bus, which occurred immediately after<br />
impact with a resultant 18. g. The side slap <strong>of</strong> the semitrailer<br />
into the side <strong>of</strong> the rotating bus during the third impact (time =<br />
0.8 seconds) was extremely severe, resulting in a 2821 deg/sec2<br />
maximum yaw angular acceleration <strong>of</strong> the bus.<br />
Simulation results revealed significant differences in the crash<br />
pulse and the change in velocity between the center <strong>of</strong> gravity<br />
<strong>of</strong> the bus and points at the rear <strong>of</strong> the bus, possibly contributing<br />
to the severity <strong>of</strong> the injuries for passengers seated there. Table<br />
1 illustrates these differences.<br />
The greatest variance occurred during the last collision when<br />
the bus side-slapped the semitrailer. The simulation showed<br />
that, as a result <strong>of</strong> this collision, the change in velocity at the<br />
rear <strong>of</strong> the bus was 44 mph versus 12 mph at the center <strong>of</strong> gravity<br />
<strong>of</strong> the bus. The simulation also showed that during this same<br />
collision, portions <strong>of</strong> the bus located forward <strong>of</strong> the center <strong>of</strong><br />
gravity underwent a smaller change in velocity than the center<br />
<strong>of</strong> gravity.<br />
In the compartmentalized condition, the simulated occupants<br />
in the rear <strong>of</strong> the bus first went forward in their seats and then<br />
contacted the seat in front <strong>of</strong> them with their legs, chests, and<br />
heads. As the bus rotated clockwise, the simulated occupants<br />
slid toward the right side <strong>of</strong> the bus. Those seated on the right<br />
side <strong>of</strong> the bus quickly contacted the side <strong>of</strong> the bus and the<br />
windows and stayed in that position until the third impact (side<br />
slap) <strong>of</strong> bus and semitrailer. Those originally seated on the left<br />
15<br />
10<br />
5<br />
0<br />
-5<br />
-10<br />
-15<br />
-20<br />
0 0.2 0.4 0.6 0.8 1<br />
0<br />
1.2<br />
-1000<br />
Time (sec)<br />
x<br />
y<br />
Yaw<br />
Figure 2. The two-dimensional linear and angular accelerations <strong>of</strong> the school bus during<br />
the collision with the tractor semitrailer in the Monticello, Minnesota, crash.<br />
OCCUPANT SAFETY IN LARGE SCHOOL BUSES<br />
-2000<br />
-3000<br />
-4000<br />
side <strong>of</strong> the bus contacted the edges <strong>of</strong> the adjacent seats and<br />
also hit other simulated occupants during the motion. The bus<br />
continued to rotate clockwise until the third impact <strong>of</strong> the bus<br />
with the semitrailer. This impact started a counterclockwise<br />
rotation <strong>of</strong> the bus, which caused the simulated occupants to<br />
slide back toward the left side <strong>of</strong> the bus. Those closest to the<br />
left side <strong>of</strong> the bus originally impacted the left-side windows<br />
and the left side <strong>of</strong> the bus, typically with their heads or upper<br />
torsos. Injuries were predicted for these occupants. Those<br />
seated farther from the left side <strong>of</strong> the bus impacted other<br />
simulated occupants while sliding toward the left and toward<br />
the impacting semitrailer.<br />
Figure 3 illustrates the occupant kinematics simulated for<br />
lap-belted and lap/shoulder-belted occupants. (The figure does<br />
not show the actual or compartmentalized condition.)<br />
In the lap belt restraint simulation, the simulated occupant’s<br />
pelvis was essentially fixed to the seat, causing a whip-like action<br />
for the upper torso. This whip-like action caused the simulated<br />
occupants seated opposite the impact to pivot about the pelvis<br />
and impact their heads and torsos on the seat cushions. Head<br />
injuries were predicted from these impacts. In addition, because<br />
<strong>of</strong> the configuration <strong>of</strong> the seats and the dynamics <strong>of</strong> the bus,<br />
hyperextension <strong>of</strong> the neck was documented as simulated<br />
occupants on both sides <strong>of</strong> the bus rotated about the seat back.<br />
For the lap/shoulder restraint, the simulated occupants<br />
displayed similar kinematics as with the lap restraints. During<br />
NTSB JOURNAL OF ACCIDENT INVESTIGATION, SPRING 2006; VOLUME 2, ISSUE 1 7<br />
3000<br />
2000<br />
1000<br />
Angular Acceleration (deg/sec^2)
KRISTIN M. POLAND, LINDA McCRAY, AND AIDA BARSAN-ANELLI<br />
Table 1. The change in velocity at the center <strong>of</strong> gravity and left rear corner <strong>of</strong><br />
the school bus involved in the Monticello, Minnesota, crash.<br />
Impact Delta V (mph)<br />
Center <strong>of</strong> Gravity Left Rear Corner<br />
1st 31 34<br />
2nd 18 18<br />
3rd 12 44<br />
Time = 0.2 seconds Time = 0.3 seconds<br />
Time = 0.4 seconds Time = 0.8 seconds<br />
Figure 3. Time lines for occupant motion in the lap (left side) and lap/shoulder-belted (right side) conditions (simulated).<br />
8 NTSB JOURNAL OF ACCIDENT INVESTIGATION, SPRING 2006; VOLUME 2, ISSUE 1
the final impact (the side slap), the upper torsos <strong>of</strong> simulated<br />
occupants seated on the side opposite <strong>of</strong> the impact slid out<br />
from their shoulder belts. Although previous research 9,10<br />
indicated that the belt typically absorbs sufficient energy before<br />
the torso is released, these simulations indicated a potential for<br />
head injury after the torso slid from the upper restraint and the<br />
head contacted the seat cushion.<br />
Conasauga, Tennessee<br />
On March 28, 2000, a southbound CSX Transportation, Inc.,<br />
33-car freight train, en route to Atlanta, Georgia, collided with<br />
the passenger side <strong>of</strong> a westbound Murray County, Georgia,<br />
school bus at a railroad/highway grade crossing near Conasauga,<br />
Tennessee. The school bus was on its morning route to pick<br />
up children and had entered Liberty Church Road from U.S.<br />
Route 411. On board were seven children and the driver. As<br />
the school bus traversed the passive grade crossing, it was struck<br />
by the train. Figure 4 shows the final resting position <strong>of</strong> the bus<br />
body.<br />
Figure 4. The bus body came to rest against<br />
the side <strong>of</strong> the train (Consauga, Tennessee).<br />
The school bus was equipped with video recording equipment<br />
to monitor passenger behavior on the bus. These videotapes<br />
showed that, on the day <strong>of</strong> the accident, the school bus did not<br />
stop as required before attempting to cross the railroad tracks,<br />
nor had it stopped at this crossing on eight previous occasions.<br />
During the accident sequence, the driver and three children<br />
were ejected. Two ejected passengers received serious injuries<br />
and one was fatally injured. The driver, who had been wearing<br />
a lap/shoulder belt that broke, received minor injuries. Of the<br />
four passengers who were not ejected, two were fatally injured,<br />
9 D. Cesari, R. Quincy, and Y. Derrien, “Effectiveness <strong>of</strong> Safety Belts under<br />
Various Directions <strong>of</strong> Crashes,” Society <strong>of</strong> Automotive Engineers, Paper<br />
No. 720973.<br />
10 J. Horsch, “Occupant Dynamics as a Function <strong>of</strong> Impact Angle and Belt<br />
Restraint,” Society <strong>of</strong> Automotive Engineers, Paper No. 801310.<br />
OCCUPANT SAFETY IN LARGE SCHOOL BUSES<br />
one sustained serious injuries, and one, who was restrained by<br />
a lap belt, received minor injuries. The two train crewmembers<br />
were not injured.<br />
Using the human vehicle environment system and<br />
MADYMO, the Safety Board conducted vehicle dynamics and<br />
occupant kinematics simulations for this investigation.<br />
The vehicle dynamics simulation (figure ) verified that<br />
the train was traveling about 1 mph and the bus, about 1<br />
mph at impact. The resultant peak accelerations experienced<br />
by the bus during its initial lateral impact with the train were<br />
30 g at the center <strong>of</strong> gravity, 39 g at the last row <strong>of</strong> seats, and<br />
31 g at the first row <strong>of</strong> seats. The peak angular acceleration at<br />
the center <strong>of</strong> gravity was approximately 2, 00 deg/sec2. The<br />
angular accelerations were higher at the last row due to the<br />
school bus’s clockwise rotation away from the impact point,<br />
the pivoting <strong>of</strong> the bus about the front axle, and the distance<br />
<strong>of</strong> the last row <strong>of</strong> seats from the impact location. During the<br />
initial lateral impact, the velocity <strong>of</strong> the train changed by 1 to<br />
2 mph due to emergency braking, while the lateral velocity<br />
<strong>of</strong> the bus increased due to the velocity <strong>of</strong> the striking train.<br />
Because the train was much larger and heavier than the school<br />
bus, the severity <strong>of</strong> the collision was more extreme for the bus.<br />
Occupant simulations showed that the occupant seated<br />
at the rear <strong>of</strong> the bus was exposed to the highest forces and<br />
thus was predicted to sustain the highest level <strong>of</strong> injury. This<br />
occupant sustained high levels <strong>of</strong> injury in all simulated<br />
restraint conditions (compartmentalized, lap-belted, and<br />
lap/shoulder-belted). The combination <strong>of</strong> high-lateral<br />
accelerations and high-rotational accelerations, which occurred<br />
at the same time, contributed to the rapid lateral progress <strong>of</strong> this<br />
occupant across the aisle (figure 6) and the high contact forces<br />
experienced when impacting the side <strong>of</strong> adjacent seat back,<br />
side wall, and window frame screw housing. In the front <strong>of</strong> the<br />
bus, the opposite was true. Simulated occupants restrained by<br />
either the lap belt or the lap/shoulder belt, as shown in figure 7,<br />
were subjected to less-severe accelerations and were therefore<br />
predicted to sustain less-severe injuries.<br />
NTSB JOURNAL OF ACCIDENT INVESTIGATION, SPRING 2006; VOLUME 2, ISSUE 1 9
KRISTIN M. POLAND, LINDA McCRAY, AND AIDA BARSAN-ANELLI<br />
Figure 5. Two still images from the vehicle dynamics simulation show the impact between the bus and<br />
train and the separation <strong>of</strong> the bus body and chassis as the impact continued (Consauga, Tennessee).<br />
Figure 6. Kinematics <strong>of</strong> the rear-seated occupant in all three restraint conditions.<br />
(The front <strong>of</strong> the bus is toward the bottom <strong>of</strong> the image.)<br />
Figure 7. Kinematics <strong>of</strong> the three occupants in the front <strong>of</strong> the bus in all three restraint conditions (Consauga, Tennessee). (The actual restraint<br />
condition is shown on the left. The lap-belted condition is in the upper right and the lap/shoulder-belted condition is in the lower right.)<br />
60 NTSB JOURNAL OF ACCIDENT INVESTIGATION, SPRING 2006; VOLUME 2, ISSUE 1
Testing and Simulation<br />
Full-Scale Crash Testing<br />
NHTSA reviewed data from its Fatality Analysis Reporting<br />
System (FARS), National Automotive Sampling System<br />
(NASS), General Estimates System (GES), and Special Crash<br />
<strong>Investigation</strong>s (SCI), as well as State and local crash data and<br />
data from the Safety Board. NHTSA found that the most<br />
significant factors in two-vehicle, fatal school bus crashes<br />
were that they occurred on roadways with posted speed limits<br />
between -60 mph and that they involved heavy trucks.<br />
Based on these findings, NHTSA designed two full-scale crash<br />
tests to represent the real-world environment <strong>of</strong> large school<br />
bus crashes.<br />
Frontal Crash Test - The first crash test was conducted<br />
by frontally impacting a conventional school bus into a rigid<br />
barrier at 30 mph. The impact speed was chosen to ensure<br />
that sufficient energy would be imparted to the occupants to<br />
evaluate the protective capability <strong>of</strong> compartmentalization, and<br />
to provide a level at which other methods for occupant injury<br />
mitigation could be evaluated during sled testing. A 30-mph<br />
impact into the rigid barrier is also equivalent to two vehicles<br />
<strong>of</strong> similar size impacting at a closing speed <strong>of</strong> approximately 60<br />
mph, which NHTSA found to be prevalent in their review <strong>of</strong><br />
crash data sources.<br />
Figures 8 and 9 show the frontally impacted bus before and<br />
after the impact. As is typical <strong>of</strong> large school buses, the body <strong>of</strong><br />
the bus was mounted to the frame rails <strong>of</strong> the chassis by a series<br />
<strong>of</strong> clips or clamps. This non-rigid mounting feature allowed<br />
the bus body to slide forward approximately 36 inches during<br />
impact (see figure 10). This dissipation <strong>of</strong> impact energy over a<br />
longer time reduced the acceleration levels experienced by the<br />
vehicle’s occupants.<br />
Accelerometers were positioned along the center aisle <strong>of</strong> the<br />
bus body to record accelerations during the crash. Ten dummies<br />
were used in the test: five Hybrid II and III 0th percentile adult<br />
male (representing adult and large, teenaged occupants), two<br />
Hybrid III th percentile adult females (representing average<br />
12-year-old occupants), and three Hybrid II and III<br />
6-year-olds. Four <strong>of</strong> the ten were ballast dummies, which were<br />
placed throughout the bus. See figure 11.<br />
Table 2 contains the dummy injury values for the frontal<br />
crash tests. The neck injury (Nij) value was calculated based<br />
on the criteria being used for the revised FMVSS No. 208,11<br />
“Occupant Protection.” The pass/fail criterion for Nij was 1.0,<br />
11 Code <strong>of</strong> Federal Regulations, Title 49, Chapter V–National Highway<br />
Traffic Safety Administration, Department <strong>of</strong> Transportation, Federal<br />
Motor Vehicle Safety Standard (FMVSS) No. 71.208; Occupant Crash<br />
Protection.<br />
OCCUPANT SAFETY IN LARGE SCHOOL BUSES<br />
Figure 8. The school bus in the frontal impact scenario before the impact.<br />
Figure 9. The school bus in the frontal impact scenario after the impact.<br />
Figure 10. Displacement <strong>of</strong> the bus body on the<br />
chassis during frontal impact.<br />
NTSB JOURNAL OF ACCIDENT INVESTIGATION, SPRING 2006; VOLUME 2, ISSUE 1 61
KRISTIN M. POLAND, LINDA McCRAY, AND AIDA BARSAN-ANELLI<br />
Table 2. Frontal crash test results.<br />
Dummy Nij HIC Chest G<br />
#1 (50th M) 0.91 244 26.0<br />
#2 (6 yo) 1.57 93 30.8<br />
#3 (6 yo) 1.06 251 30.9<br />
#4 (5th F) 1.15 105 No Data<br />
#5 (5th F) 1.38 330 22.6<br />
#6 (50th M) 0.84 150 22.3<br />
which represented the onset <strong>of</strong> serious injuries. The FMVSS<br />
No. 208 head injury criterion (HIC) based on a 1 -millisecond<br />
(msec) duration, was 700 for the 0th percentile adult male, th<br />
percentile adult female, and 6-year-old dummies. The FMVSS<br />
No. 208 pass/fail criterion for chest acceleration based on a<br />
3-msec duration was 60 g for the 0th percentile adult male,<br />
th percentile adult female, and 6-year-old dummies.<br />
HIC and chest injury values were low during the frontal crash<br />
test, but the neck injury criterion was exceeded in four <strong>of</strong> the<br />
six dummies.<br />
Side Impact Crash Test - The second crash test was conducted<br />
by towing a 2 ,26 -pound cab-over truck, at 4 mph and 90<br />
degrees, into the side <strong>of</strong> a stationary, transit style school bus.<br />
The impact point was chosen so that the left front edge <strong>of</strong> the<br />
truck was directly behind the front axle <strong>of</strong> the school bus to<br />
eliminate contact with rigid structures on the frame during the<br />
initial penetration <strong>of</strong> the truck into the bus body. (See figures<br />
Figure 11. Position <strong>of</strong> dummies during the frontal crash test.<br />
Figure 12. The heavy truck relative to the side <strong>of</strong> the<br />
school bus before impact.<br />
12 and 13.) During impact, the truck penetrated the bus side<br />
approximately halfway into the compartment and remained<br />
engaged while rotating 180 degrees before coming to a stop.<br />
The front axles were severed from both vehicles (figure 13).<br />
Accelerometers placed along the length <strong>of</strong> the school bus<br />
recorded a peak lateral acceleration <strong>of</strong> 72 g at the center <strong>of</strong><br />
impact. Acceleration levels dropped significantly with distance<br />
from the point <strong>of</strong> impact, largely because the deformation that<br />
occurred at the point <strong>of</strong> impact absorbed and dissipated much<br />
<strong>of</strong> the energy that would otherwise have been transmitted to<br />
the occupants <strong>of</strong> the bus. Unlike the frontal crash, no single<br />
pulse fully represented the range <strong>of</strong> vehicle responses observed<br />
in the side-impact crash. However, the overall pulse shape and<br />
pulse duration were similar for most <strong>of</strong> the measured locations<br />
along the length <strong>of</strong> the bus.<br />
62 NTSB JOURNAL OF ACCIDENT INVESTIGATION, SPRING 2006; VOLUME 2, ISSUE 1
Figure 13. The heavy truck relative to the side <strong>of</strong><br />
the school bus after impact.<br />
The seating positions <strong>of</strong> the dummies are shown in figure<br />
14. As in the frontal crash tests, the Hybrid III th female<br />
and 6-year-old dummies were used. Replacing the Hybrid III<br />
0th male dummies were two 0th male side impact dummies<br />
(SID), which are capable <strong>of</strong> measuring lateral head, chest, and<br />
pelvic accelerations. One <strong>of</strong> the SID/Hybrid III dummies was<br />
positioned a row behind the direct impact zone <strong>of</strong> the truck<br />
(position 2 in figure 14). One Hybrid II 0th male dummy with<br />
a single triaxial accelerometer array in the head was centered at<br />
the point <strong>of</strong> impact to determine survivability within the impact<br />
zone (position 1 in figure 14).<br />
Figure 14. Positions <strong>of</strong> the dummies in the side impact crash scenario.<br />
Table 3 shows the results for the side-impact crash test. HIC<br />
values were based on a 1 -msec duration, and chest acceleration<br />
values were based on a 3-msec duration, with the same pass/<br />
fail criterion as in the frontal tests. For the SID dummies, the<br />
Thoracic Trauma Index (TTI) was also recorded. A value <strong>of</strong><br />
OCCUPANT SAFETY IN LARGE SCHOOL BUSES<br />
Table 3. Side impact test results.<br />
Dummy HIC Chest G TTI<br />
#1 (HII) 2164 N/A N/A<br />
#2 (SID) 277 N/A 54.7<br />
#3 (5th F) 85 27.7 N/A<br />
#4 (6 yo) 124 11.1 N/A<br />
#5 (SID) 133 N/A 7.1<br />
#6 (6 yo) 54 22.7 N/A<br />
#7 (5th F) 1 7.4 N/A<br />
8 g indicated the onset <strong>of</strong> serious injuries and served as a pass/<br />
fail criterion under FMVSS No. 214. 12<br />
The head injury criterion was exceeded for the dummy<br />
centered in the impact region. All other injury criteria were<br />
below the thresholds.<br />
The two crash tests conducted for this program represented<br />
severe crash conditions. In general, school bus mass<br />
effectively minimizes the acceleration forces experienced in a<br />
vehicle-to-vehicle crash with most passenger vehicles. The<br />
potential acceleration loads from frontal and rear crashes with<br />
vehicles <strong>of</strong> similar mass are also effectively minimized by the<br />
manner in which the body <strong>of</strong> the bus is coupled to the chassis <strong>of</strong><br />
the bus. The frontal crash test demonstrated that, by allowing<br />
the body to slide along the frame <strong>of</strong> the bus, much <strong>of</strong> the<br />
kinetic energy <strong>of</strong> the bus could be dissipated before loading the<br />
passenger compartment.<br />
In a side impact, the construction <strong>of</strong> the body <strong>of</strong> the bus<br />
does very little to prevent passenger compartment intrusion.<br />
However, due to the high ground clearance <strong>of</strong> the school<br />
bus, passenger vehicles are not a serious threat in generating<br />
passenger compartment intrusion. Vehicles large enough to<br />
pose a significant probability <strong>of</strong> intrusion are <strong>of</strong> a sufficient mass<br />
that no feasible body structural design will effectively prevent<br />
them from intruding into the passenger compartment.<br />
In the test, passenger compartment intrusion at the point <strong>of</strong><br />
impact was severe. The high degree <strong>of</strong> deformation at the point<br />
<strong>of</strong> impact was very effective at absorbing and dissipating the<br />
energy <strong>of</strong> that impact. The side impact test conducted for this<br />
program showed that an occupant seated only a few feet outside<br />
12 Code <strong>of</strong> Federal Regulations, Title 49, Chapter V–National Highway Traffic<br />
Safety Administration, Department <strong>of</strong> Transportation, Federal Motor<br />
Vehicle Safety Standard No. 71.214; Side Impact Protection.<br />
NTSB JOURNAL OF ACCIDENT INVESTIGATION, SPRING 2006; VOLUME 2, ISSUE 1 63
KRISTIN M. POLAND, LINDA McCRAY, AND AIDA BARSAN-ANELLI<br />
the direct impact zone had a high probability <strong>of</strong> surviving the<br />
crash with only minor to moderate injuries.<br />
Sled Testing<br />
Sled tests were conducted to replicate the acceleration<br />
time history <strong>of</strong> the school bus full-scale frontal impact test.<br />
The derived sled pulse 13 agreed very well with the time<br />
duration (approximately 210 msec) and the peak acceleration<br />
(approximately 12-13 g). The leveling <strong>of</strong>f <strong>of</strong> the acceleration<br />
pulse <strong>of</strong> the crash test from about 40 to 90 msec was a result<br />
<strong>of</strong> the bus body sliding along the chassis. The sled test did not<br />
exactly replicate this plateau and allowed a somewhat higher<br />
acceleration level at this point in the curve. The result was<br />
a slightly more severe test pulse because the peak velocity<br />
<strong>of</strong> the sled was approximately 4 to mph higher than the<br />
barrier-equivalent velocity measured during the frontal crash<br />
test.<br />
Two different test bucks were used to evaluate bus safety<br />
restraint systems. For the first test buck, a section from the<br />
body <strong>of</strong> the school bus was mounted on the sled. This test buck<br />
was used to assess the degree <strong>of</strong> deformation/energy absorption<br />
by the bus floor and the floor’s interaction with the seats, and<br />
to assess any potential for occupant interaction with portions<br />
<strong>of</strong> the interior other than the seats themselves. The finished<br />
test buck is shown in figure 1 . The bus body contained three<br />
rows <strong>of</strong> seats on both the right and left side <strong>of</strong> the center aisle.<br />
This allowed for testing a maximum <strong>of</strong> two rows <strong>of</strong> dummies<br />
per test.<br />
Figure 15. This photograph shows the sled buck for<br />
the frontal crash testing.<br />
Testing with the first sled buck showed no significant<br />
interaction between the dummies and the walls or ceiling <strong>of</strong><br />
13 “Report to Congress on School Bus Safety: Crashworthiness Research,<br />
April 2002” page 19, Figure 6, at http://www-nrd.nhtsa.dot.gov/<br />
departments/nrd-11/SchoolBus/SBReportFINAL.pdf .<br />
the bus shell, although the floor <strong>of</strong> the bus shell sustained some<br />
incremental damage from loading by the mounted bus seats. 14<br />
For that reason, an open-frame, rigid-floor, test buck was used<br />
to provide a more consistent test platform. (See figure 16.)<br />
This test buck allowed for better high-speed imaging <strong>of</strong> the test<br />
event, which improved the analyses <strong>of</strong> the dummies and their<br />
interaction with the bus seats and restraint systems.<br />
Figure 16. A photograph <strong>of</strong> the modified sled buck used<br />
in the second test series.<br />
The sled tests were designed to evaluate occupant size,<br />
restraint strategies, loading conditions, seat spacing, and seat<br />
back height. The occupants were represented by Hybrid III<br />
0th-percentile male dummies, Hybrid III th percentile female<br />
dummies, and Hybrid III 6-year-old dummies. The restraint<br />
strategies that were evaluated included compartmentalization,<br />
use <strong>of</strong> lap belts (with compartmentalization), and use <strong>of</strong> lap/<br />
shoulder belts on bus seats with a modified, non-FMVSS<br />
222-compliant seat back. 1 Other conditions evaluated were<br />
seat spacing, seat-back height, and rear occupant loading.<br />
Results indicated that compartmentalization is an effective<br />
restraint strategy for frontal school bus crashes, in part due to<br />
the relatively low acceleration load in even a relatively severe<br />
crash condition. The padded seat backs appear to be effective<br />
in minimizing the potential for leg and head injury. During the<br />
frontal crash, occupant kinematics were such that chest loading<br />
was not a significant problem. However, these conditions<br />
created some degree <strong>of</strong> risk for neck injury as measured by the<br />
14 The deformation was very small for any single test and accounted for an<br />
insignificant amount <strong>of</strong> energy absorbed by the seats during the crash<br />
simulation.<br />
1 Code <strong>of</strong> Federal Regulations, Title 49, Chapter V–National Highway Traffic<br />
Safety Administration, Department <strong>of</strong> Transportation, Federal Motor<br />
Vehicle Safety Standard No. 71.222; School Bus Passenger Seating and<br />
Crash Protection.<br />
64 NTSB JOURNAL OF ACCIDENT INVESTIGATION, SPRING 2006; VOLUME 2, ISSUE 1
injury criterion, Nij. About half <strong>of</strong> the compartmentalized tests<br />
had Nij values over the reference value <strong>of</strong> 1.0.<br />
Although sled testing indicated that lap belts represent<br />
an increased risk for neck injury in a frontal crash, the belts<br />
did keep passengers within the padded confines <strong>of</strong> the<br />
compartmentalized seat design. They also prevented larger<br />
occupants from overriding standard-height seat backs to strike<br />
other passengers seated in front. High-back seats were also<br />
shown to prevent overriding.<br />
The lap/shoulder belt restraint system performed best overall,<br />
restraining the upper body and pelvis <strong>of</strong> the dummy and either<br />
preventing or significantly reducing head impact into the seat<br />
back. The primary loading on the head and neck became<br />
inertial loading as the body stopped moving forward. The seats<br />
deflected and absorbed enough <strong>of</strong> the deceleration energy that<br />
chest loading by the shoulder belt was not significant and the<br />
forward snap <strong>of</strong> the head did not produce significant loads on<br />
the head or neck. The adjustable features on both belt systems<br />
tested allowed the belt to safely and comfortably fit a wide<br />
range <strong>of</strong> age/size passengers. When used improperly, however,<br />
the effectiveness <strong>of</strong> the lap/shoulder belts degraded, resulting in<br />
high neck loads, as seen with the lap belts alone.<br />
Simulations<br />
NHTSA also conducted occupant simulation modeling to<br />
represent the full-scale frontal crash test and several <strong>of</strong> the<br />
Figure 17. Comparison <strong>of</strong> full-scale crash tests with simulations.<br />
OCCUPANT SAFETY IN LARGE SCHOOL BUSES<br />
sled tests. 16 MADYMO was used to simulate the occupant<br />
kinematics. Figure 17 shows how the full-scale crash test was<br />
modeled in MADYMO.<br />
Simulation and test results were compared for both the<br />
head-resultant and chest-resultant accelerations. The signals<br />
were compared based on six evaluation criteria designed by<br />
Ray. 17 These validated models are planned for future use in<br />
evaluating new occupant protection strategies in school buses.<br />
SUMMARY<br />
As stated earlier, school buses are one <strong>of</strong> the safest forms<br />
<strong>of</strong> transportation on the road today. Despite this excellent<br />
record, research continues to focus on the evaluation <strong>of</strong> school<br />
bus occupant protect systems. The Safety Board’s accident<br />
investigations indicate that in severe accidents, injuries and<br />
fatalities do result and that simple changes in the occupant<br />
protection systems may not be enough to protect occupants<br />
in very severe crashes. NHTSA’s work indicates that most<br />
occupants receive good protection from compartmentalization<br />
alone in both front and side impact collisions. However, the<br />
results <strong>of</strong> NHTSA’s research program have shown that lap/<br />
16 L. McCray and A. Barsan-Anelli, “Simulations <strong>of</strong> Large School Bus<br />
Safety Restraints,” NHTSA, 17th International Technical Conference on<br />
the Enhanced Safety <strong>of</strong> Vehicles, Paper # 313, 2001.<br />
17 M.H. Ray, Repeatability <strong>of</strong> Full-Scale Crash Tests and Criteria for Validating<br />
Finite Element Simulations, Transportation Research Board No. 1 28,<br />
Transportation Research Board (Washington DC, 1996).<br />
NTSB JOURNAL OF ACCIDENT INVESTIGATION, SPRING 2006; VOLUME 2, ISSUE 1 6
KRISTIN M. POLAND, LINDA McCRAY, AND AIDA BARSAN-ANELLI<br />
shoulder belt systems produce lower dummy head and neck<br />
injury measures than compartmentalization and lap belt systems.<br />
However, potential negative consequences <strong>of</strong> lap/shoulder belt<br />
systems have not been adequately researched at this time to<br />
allow a full determination <strong>of</strong> overall cost/benefits.<br />
Future work will focus on using real-world accident<br />
investigations, testing, and computer simulations to evaluate<br />
various crash scenarios, to improve the crashworthiness <strong>of</strong> the<br />
school bus and to assess potential new occupant protection<br />
systems.<br />
THE AUTHORS<br />
KRISTIN M. POLAND, Ph. D., is a Biomechanical Engineer in the Office <strong>of</strong> Research and Engineering at the National Transportation<br />
Safety Board. She received her B.S in mechanical engineering from Cornell University in 1994 and a Ph.D. in biomechanical<br />
engineering from the University <strong>of</strong> Iowa in 1998. Dr. Poland joined the NTSB in 1998 and has participated in various forms <strong>of</strong><br />
modeling, simulation, and analytical studies in highway, aviation, and railroad investigations.<br />
LINDA B. McCRAY is a Mechanical Engineer in the Office <strong>of</strong> Vehicle Safety Research at the National Highway Traffic Safety<br />
Administration. She joined NHTSA in 1992 and has been involved in research on various crashworthiness issues related to children,<br />
such as the child restraint systems standard upgrade, research on side-impact protection for children, and research under NHTSA’s<br />
August 1998 plan to evaluate the “Next Generation” <strong>of</strong> research concerning occupant protection for all school bus passengers.<br />
AIDA BARSAN-ANELLI is a Mechanical Engineer with Information Systems and Services, Inc. (ISSI), doing work as a contractor<br />
for the Office <strong>of</strong> Vehicle Safety Research at the National Highway Traffic Safety Administration. She joined ISSI in 1998 and has been<br />
providing engineering modeling and analysis support to NHTSA related to research programs and the development <strong>of</strong> supporting<br />
materials for NHTSA rulings on vehicle safety. These efforts included use <strong>of</strong> the MADYMO and LS-Dyna3D applications for<br />
simulations and modeling, and use <strong>of</strong> their associated pre- and post-processing applications to generate the models and analyze the<br />
results.<br />
66 NTSB JOURNAL OF ACCIDENT INVESTIGATION, SPRING 2006; VOLUME 2, ISSUE 1
NATIONAL<br />
NATIONALTRANSPORTATION TRANSPORTATION<br />
E PLURIBUS UNUM<br />
SAFETY<br />
SAFETY BOARD<br />
BOARD<br />
PUBLIC FORUM<br />
Personal Flotation Devices<br />
in Recreational Boating<br />
August 25, 2004<br />
NTSB Academy, Ashburn, VA<br />
Public Forums, Symposiums, and Hearings<br />
Personal Flotation Devices in Recreational Boating<br />
Bruce G. Coury, National Transportation Safety Board<br />
Will It Float? was the title <strong>of</strong> Canadian Safe Boating Council’s presentation at the NTSB’s<br />
public forum Personal Flotation Devices (PFD) in Recreational Boating. Those three words<br />
describe the discussions about PFD policy that occurred among more than 80 participants<br />
from government and the recreational boating industry who gathered at the NTSB Academy<br />
in August 2004. The forum covered a range <strong>of</strong> topics including adult and child PFD use,<br />
accident and injury risk factors, boating education, and operator licensing, with much <strong>of</strong><br />
the discussion focusing on the merits <strong>of</strong> a mandatory PFD wear requirement for adults in<br />
recreational boats.<br />
Participation in recreational boating increased from 78.3 million in 1999 to 91.1 million in<br />
2004, according to the National Survey <strong>of</strong> Recreation and the Environment (NSRE) cited by the<br />
U.S. Coast Guard and the boating industry. At the same time, the total number <strong>of</strong> accidents<br />
decreased by 30 percent, and the number <strong>of</strong> accidents per million participants declined more<br />
than 40 percent.<br />
Despite the decreasing accident rate, forum participants agreed that the number <strong>of</strong> people<br />
who drown every year in recreational boating was unacceptable, and that PFD use by adult<br />
boaters remains too low. Conclusions were based on Coast Guard recreational boating<br />
accident statistics that showed a persistent and constant number <strong>of</strong> drownings from year<br />
to year. From 1999 to 2003, for example, almost 7 <strong>of</strong> 10 fatalities were due to drowning,<br />
averaging approximately 00 deaths per year. The most common factor among drowning<br />
victims was the lack <strong>of</strong> a PFD. The Coast Guard estimates that 84 percent <strong>of</strong> the people who<br />
drowned would have been saved had they been wearing PFDs.<br />
The forum enabled the Safety Board and the recreational boating community to explore<br />
actions that might be taken to reduce the number <strong>of</strong> drownings. The 1 presentations were<br />
organized into the 4 panels shown in table 1. The first panel set the stage by presenting<br />
accident data, current state <strong>of</strong> approved PFD technology, studies <strong>of</strong> PFD use among adults<br />
and children, and an analysis <strong>of</strong> acceptability and feasibility <strong>of</strong> mandatory PFD legislation<br />
done in Canada. Subsequent presentations provided public safety, recreational boater, and<br />
industry perspectives on PFD use and requirements. Many presenters felt that a mandatory<br />
NTSB JOURNAL OF ACCIDENT INVESTIGATION, SPRING 2006; VOLUME 2, ISSUE 1 67
BRUCE G. COURY<br />
adult PFD requirement would not float in the recreational<br />
boating community, and suggested alternatives for increasing<br />
PFD use including boater education, operator licensing, and<br />
better design and marketing <strong>of</strong> PFD technologies.<br />
SAFETY BOARD STUDIES OF<br />
RECREATIONAL BOATING<br />
The Safety Board has a long history <strong>of</strong> working to improve<br />
recreational boating safety including five safety studies<br />
dating back to 1969. The early studies focused on the safety<br />
risk factors in recreational boating, with studies in 1983 and<br />
1988 specifically addressing the role <strong>of</strong> alcohol in boating<br />
accidents. The most comprehensive examination <strong>of</strong> PFD wear<br />
by the Board was completed in 1993. Using 407 fatal accident<br />
investigation reports provided by 18 States, the study was able<br />
to compile statistics on a number <strong>of</strong> factors, including PFD use,<br />
boat operating skills and knowledge, and alcohol involvement.<br />
The study found that 73 percent <strong>of</strong> the fatalities were due<br />
to drowning, a figure consistent with the Coast Guard’s<br />
1999-2003 average <strong>of</strong> 70 percent. In addition, the study<br />
found as few as 7 percent, and no more than 22 percent, <strong>of</strong><br />
first-time boat operators had taken some type <strong>of</strong> voluntary<br />
boating course.<br />
One aspect <strong>of</strong> the 1993 study that continues to be a concern<br />
today is the proportion <strong>of</strong> children who drown, especially those<br />
without PFDs. The 1993 study resulted in five recommendations.<br />
Safety Recommendation M-93-1, issued to the Governors<br />
and legislative leaders <strong>of</strong> the States, U.S. Virgin Islands, and<br />
Puerto Rico, and the Major <strong>of</strong> Washington, DC, called for a<br />
requirement that all children wear PFDs. Most <strong>of</strong> the States<br />
(4 ) have since enacted mandatory PFD wear requirements for<br />
children, but variability in requirements remains. As <strong>of</strong> February<br />
200 , States (Iowa, New Mexico, Virginia, Wisconsin, and<br />
Wyoming) did not require children to wear PFDs, and 13 States<br />
had inconsistent age requirements.<br />
In 2002, the Coast Guard enacted 33 Code <strong>of</strong> Federal<br />
Regulations (CFR) Part 17 Subpart B, Personal Flotation Devices,<br />
regulations governing Federal waters (with the final rule going<br />
into effect in July 2004). These regulations require any child<br />
under 13 to wear a PFD while the boat is underway unless<br />
the child is below decks or in an enclosed cabin. During its<br />
rulemaking activities for the 2002 Federal regulation change,<br />
the Coast Guard showed evidence to justify a requirement that<br />
children under the age <strong>of</strong> 13 wear PFDs.<br />
The need for better education <strong>of</strong> recreational boaters was<br />
also addressed in Safety Recommendation M-93-1, as well<br />
as in M-93-9 to the National Association <strong>of</strong> State Boating<br />
Law Administrators (NASBLA) and M-93-14 to the Coast<br />
Guard. Those recommendations asked the Coast Guard and<br />
NASBLA to develop guidelines that would be used by States<br />
to implement recreational boating standards to reduce the<br />
number and severity <strong>of</strong> accidents, and to consider requirements<br />
that operators demonstrate knowledge <strong>of</strong> safe boating rules and<br />
skills. The recommendations were based in part on accident<br />
data that indicated that boaters involved in fatal boating<br />
accidents exhibited a lack <strong>of</strong> safe boating knowledge, practices,<br />
and skills. Safety Recommendation M-93-13 asked the Coast<br />
Guard to use its funding authority, through the memorandum <strong>of</strong><br />
understanding signed biennially by the States, to require a plan<br />
for increasing PFD use.<br />
THE ADULT PFD USE PROBLEM<br />
Little has changed since the Safety Board issued<br />
recommendations in 1993: about the same number <strong>of</strong> people<br />
drown each year in recreational boating; adult PFD use remains<br />
stubbornly low; and a large majority <strong>of</strong> boaters involved in<br />
fatal boating accidents have not received any boating safety<br />
instruction. Although the data seem to indicate that a PFD<br />
requirement for all occupants in small recreational boats could<br />
save lives, no States have passed such laws. These accident data<br />
and inaction at both the Federal and the State levels led the<br />
Safety Board to conclude that a public forum exploring issues<br />
related to PFD wear in recreational boating was warranted.<br />
The extent <strong>of</strong> the problem was clearly and succinctly<br />
presented by the Coast Guard at the forum. In 2003, there were<br />
703 fatalities in recreational boating accidents; 481 (68 percent)<br />
were drowning victims, and 416 <strong>of</strong> them (86 percent) were not<br />
wearing PFDs. In addition, nearly 70 percent <strong>of</strong> all drownings<br />
(and more than 60 percent <strong>of</strong> all fatalities) occurred as the result<br />
<strong>of</strong> capsizing, falls overboard, and swamping (table 2). The size <strong>of</strong><br />
the boat also matters; 7 <strong>of</strong> 10 people who drown were in a boat<br />
21 feet or less in length. These statistics are remarkably similar<br />
to the statistics reported in the 1993 study; 73 percent <strong>of</strong> the<br />
fatalities were due to drowning, and 80 percent <strong>of</strong> those who<br />
drowned were not wearing PFDs. Using the 2003 data presented<br />
at the forum, the Coast Guard estimated that approximately 84<br />
percent <strong>of</strong> the people who drowned would have been saved if<br />
they had been wearing PFDs.<br />
The 2003 statistics were consistent with data from previous<br />
years. Beginning in 1999, the number <strong>of</strong> fatalities remained<br />
relatively constant, varying less than percent from an average<br />
<strong>of</strong> 714 per year (table 3). Coast Guard accident and fatality data<br />
for that period indicated that 71 percent <strong>of</strong> these deaths were<br />
due to drowning (table 4). In addition, Coast Guard statistics<br />
showed that the drownings per 100,000 registered boats remained<br />
constant. As previously mentioned, the most common factor<br />
among drowning victims was the lack <strong>of</strong> a PFD.<br />
68 NTSB JOURNAL OF ACCIDENT INVESTIGATION, SPRING 2006; VOLUME 2, ISSUE 1
Table 1. Panels, presenters, and presentations.<br />
Presenters Topics<br />
Panel I: Facts, Figures, and Studies <strong>of</strong> PFD Use<br />
Capt. Scott E. Evans<br />
U.S. Coast Guard, Office <strong>of</strong> Boating Safety<br />
Samuel Wehr<br />
U.S. Coast Guard, Lifesaving & Fire Safety Standards<br />
Thomas W. Mangione and Maria Rangel<br />
JSI Research and Training Institute, Inc.<br />
Barbara Byers<br />
Canadian Safe Boating Council<br />
Susan Balistreri<br />
Balistreri Consulting, Inc.<br />
Panel II: Public Safety Perspective<br />
Fred Messman, John M. Johnson, and Ed Carter<br />
National Association <strong>of</strong> State Boating Law Administrators<br />
(NASBLA)<br />
James P. Muldoon<br />
National Boating Safety Advisory Council<br />
William S. Griswold<br />
National Safe Boating Council<br />
Panel III: Recreational Boater Perspective<br />
Jim Ellis<br />
Boat Owners Association <strong>of</strong> the United States (BOAT/US)<br />
Pamela Dillon<br />
American Canoe Association (ACA)<br />
Panel IV: Recreational Boating Manufacturer Perspective<br />
Bernice McArdle, Ralph Steger, and Scott Swanby<br />
Personal Flotation Device Manufacturers Association<br />
Larry R. Innis<br />
Marine Retailers Association <strong>of</strong> America (MRAA)<br />
Monita W. Fontaine<br />
National Marine Manufacturers Association (NMMA)<br />
Charles B. Husick<br />
OWA, Inc.<br />
Report on PFDs<br />
in Recreational Boating<br />
PERSONAL FLOTATION DEVICES IN RECREATIONAL BOATING<br />
PFD Wear, New Technology<br />
and PFD Approval Process<br />
Highlights from the 1998 – 2003 National PFD Wear Rate<br />
Observational Studies<br />
Will it Float?<br />
Mandatory Wear <strong>of</strong> PFDs on Recreational Boats<br />
A Position Paper from the National Association <strong>of</strong> State<br />
Boating Law Administrators<br />
PFDs in Recreational Boating<br />
Rethinking Mandatory PFD Wear<br />
Report to the National Transportation Safety Board on<br />
Mandatory Wear <strong>of</strong> PFDs on Recreational Boats<br />
The American Canoe Association Response to<br />
Mandatory Wear <strong>of</strong> PFDs on Recreational Boats<br />
PFD Technology and Wearability<br />
Mandatory Wear <strong>of</strong> PFDs on Recreational Boats<br />
An Assessment <strong>of</strong> Mandatory PFD Wear Requirements<br />
NTSB Boating <strong>Accident</strong> Forum<br />
NTSB JOURNAL OF ACCIDENT INVESTIGATION, SPRING 2006; VOLUME 2, ISSUE 1 69
BRUCE G. COURY<br />
A 6-year observational study funded by the Coast Guard<br />
(T. Mangione, M. Rangel, and K. Watson, National PFD Wear<br />
Rate Observational Study) confirmed the consistently low adult<br />
PFD use. The study, completed in 2003, found that less than<br />
10 percent <strong>of</strong> adults 18 years <strong>of</strong> age and older wore PFDs,<br />
even in States with child wear requirements and mandatory<br />
boating safety courses. The highest PFD wear observed was<br />
among boaters on personal watercraft (9 percent), sailboards<br />
(94 percent), and in kayaks (84 percent). Although the<br />
perceived risk <strong>of</strong> kayaking, sailboarding, and personal watercraft<br />
use may influence those boaters to wear PFDs, the risks <strong>of</strong> small<br />
boats on calm waters may not be so obvious.<br />
Arguments for and against a mandatory PFD wear<br />
requirement for adults were presented by NASBLA. Although<br />
the presenters were quick to point out that presently there is no<br />
consensus among boating law administrators regarding universal<br />
mandatory PFD wear for recreational boaters, they did articulate<br />
the key arguments. The advocate for a mandatory requirement<br />
cited the persistent number <strong>of</strong> drownings every year and the<br />
potential for saving lives if boaters were required to wear a PFD.<br />
The advocate against such a requirement disagreed, citing<br />
the significant decrease in recreational boating accidents and<br />
fatalities since 1970, the effectiveness <strong>of</strong> boating safety programs,<br />
Table 2. Most frequent accident types in recreational boating in 2003.<br />
Type <strong>of</strong> <strong>Accident</strong> Number <strong>of</strong> <strong>Accident</strong>s Number <strong>of</strong> Injuries Number <strong>of</strong> Fatalities Number <strong>of</strong> Drownings<br />
Collision with Vessel 1,469 1,063 70 9<br />
Collision with Fixed Object 558 491 50 19<br />
Capsizing 514 330 206 136<br />
Falls Overboard 508 353 201 155<br />
Skier Mishap 451 466 6 1<br />
Swamping 274 61 41 36<br />
Year<br />
Number <strong>of</strong><br />
<strong>Accident</strong>s<br />
Table 3. <strong>Accident</strong>s, accident rates, and participation in recreational boating, 1999-2003.<br />
Total Fatalities<br />
Number<br />
Drowning<br />
Number <strong>of</strong><br />
Participants<br />
(millions)<br />
<strong>Accident</strong>s<br />
per 1.0 mil<br />
Participant<br />
and the fallacy in assuming that 100 percent compliance can be<br />
attained. Enforcement would be easier, argued the advocate for,<br />
because PFD wear would be easily observed, while the advocate<br />
against countered that enforcement would be complicated by<br />
the myriad conditions under which a boater may or may not<br />
be required to wear a PFD. Significant differences occurred<br />
with respect to the potential costs to boaters. On the one hand,<br />
boaters are already required to have sufficient PFDs onboard,<br />
but the potential costs for enforcing such a requirement could<br />
result in increased indirect costs to all recreational boaters. Both<br />
advocates agreed that there were alternatives to a mandatory<br />
wear requirement.<br />
WHY BOATERS DO NOT WEAR PFDS<br />
Fatalities<br />
per 1.0 mil<br />
Participant<br />
1999 7931 734 517 78.3 101.3 9.4<br />
2000 7,740 701 519 77.6 99.7 9.0<br />
2001 6,419 681 498 75.3 85.2 9.0<br />
2002* 5,705 750 524 81.7 69.8 9.2<br />
2003 5,438 703 481 91.1 59.7 7.7<br />
* In 2002, the Coast Guard changed its criteria for reporting accidents by raising the damage limit for<br />
reporting from $500 to $2000. This could result in fewer accidents reported than in previous years.<br />
Swirling among the pro/con arguments was the fundamental<br />
question, why don’t boaters wear PFDs? Forum participants gave<br />
a long list <strong>of</strong> answers. High on that list were lack <strong>of</strong> comfort,<br />
lack <strong>of</strong> safe boating education, and personal choice.<br />
BOAT/US presented results from a recent survey conducted<br />
by the Michigan State University Recreational Marine Research<br />
Center that showed considerable resistance among boaters to<br />
70 NTSB JOURNAL OF ACCIDENT INVESTIGATION, SPRING 2006; VOLUME 2, ISSUE 1
an adult PFD wear requirement. The survey indicated that<br />
86 percent <strong>of</strong> the respondents opposed a requirement for adult<br />
boaters to wear PFDs while underway in all boats. When asked for<br />
all the reasons why they would not support such a requirement,<br />
76 percent <strong>of</strong> the respondents indicated that the skipper can<br />
make the decision, 64 percent indicated that wearing PFDs was<br />
not necessary in all types <strong>of</strong> boats, and 61 percent indicated that<br />
additional regulations were not necessary. More than a third<br />
indicated that they would boat less if they were required to wear<br />
PFDs while underway. However, in the same survey, 62 percent<br />
<strong>of</strong> the respondents supported a PFD wear requirement based on<br />
certain types <strong>of</strong> boats, and 78 percent supported a requirement<br />
that all children 12 and under wear a PFD while underway.<br />
When the organizers <strong>of</strong> the International Boating and Water<br />
Safety Summit in March 200 surveyed attendees, they found<br />
that 6 percent <strong>of</strong> the 23 respondents agreed or strongly agreed<br />
that PFDs should be mandatory for those in boats under 22 feet.<br />
Personal choice appeared to be the basis for resistance to any<br />
Federal or State legislation, but was tempered by the realization<br />
that some boating activities are more risky than others and may<br />
require more aggressive action.<br />
Personal choice—whether stated in terms <strong>of</strong> boat captain<br />
discretion or as freedom <strong>of</strong> choice—was <strong>of</strong> primary concern to<br />
many forum participants. Balancing government oversight with<br />
intervention and individual freedom and responsibility was a<br />
common theme, especially in light <strong>of</strong> the perceived economic<br />
impact <strong>of</strong> a mandatory PFD requirement on boaters and the<br />
boating industry. Participants were concerned, too, that a<br />
mandatory wear requirement would be difficult to enforce and<br />
would divert limited enforcement resources from potentially<br />
more dangerous boating activities. Forum participants wished to<br />
proceed cautiously on untested policy solutions and not divert<br />
attention from targeted law enforcement, boater education,<br />
and an emphasis on personal responsibility.<br />
Presentations <strong>of</strong> PFD technology by the Coast Guard and the<br />
Personal Flotation Device Manufacturers Association (PFDMA)<br />
illustrated the wide range <strong>of</strong> PFDs and the work being done to<br />
improve the comfort and style <strong>of</strong> PFDs. Options range widely—<br />
from the traditional “lifejacket” style to float coats and suits, and<br />
a variety <strong>of</strong> water sports-related designs for specific applications.<br />
Of particular interest was the new line <strong>of</strong> inflatable PFDs that,<br />
according to the presenters, are more comfortable and wearable<br />
(but are not approved for all recreational boating activities,<br />
such as riding a personal watercraft). Forum participants agreed<br />
that most boaters are not aware <strong>of</strong> the extensive range <strong>of</strong> PFD<br />
technology that is available.<br />
Although the BOAT/US survey provided some insight into<br />
why boaters do not wear PFDs, there apparently has been no<br />
comprehensive research to date that specifically considers<br />
boater attitudes towards PFD wear or attempts to uncover<br />
factors that would lead to increased PFD wear, especially among<br />
PERSONAL FLOTATION DEVICES IN RECREATIONAL BOATING<br />
boaters in small boats on calm waters where the risks are not<br />
apparent. The personal watercraft experience does provide<br />
some anecdotal evidence showing that, when a mandatory<br />
PFD wear requirement is combined with a concerted effort<br />
by industry to integrate PFDs into all aspects <strong>of</strong> recreational<br />
boating, resistance to PFD use by adults can be reduced and<br />
compliance increased. The Personal Watercraft Industry<br />
Association (PWIA) presentation illustrated the use <strong>of</strong> a<br />
marketing model to integrate PFD use into personal watercraft<br />
recreational boating. In that approach, PFD use was promoted<br />
by manufacturers, retailers, and personal watercraft media,<br />
and PFD design and fashion were integrated into the sale <strong>of</strong><br />
boats and accessories. Before personal watercraft legislation<br />
was introduced requiring everyone aboard personal watercraft<br />
to wear PFDs, they accounted for a disproportionate number<br />
<strong>of</strong> recreational boating deaths and injuries. By 2003, all States<br />
had enacted legislation requiring everyone aboard personal<br />
watercraft to wear PFDs. As a result, despite a more than<br />
0 percent increase in the number <strong>of</strong> registered personal<br />
watercraft from 1997–2003, the number <strong>of</strong> injuries and the<br />
number <strong>of</strong> deaths due to drowning and other causes declined<br />
(table ). Further, the rates for drowning, other types <strong>of</strong> fatalities,<br />
and injuries in accidents per 100,000 registered personal<br />
watercraft in 2003 were less than half those <strong>of</strong> 1997. The Coast<br />
Guard’s observational study during 1998–2002 found PFD wear<br />
among adults on personal watercraft to be the highest among all<br />
boaters, ranging between 93 to 97 percent.<br />
Forum discussions revealed that much more can be done<br />
by the recreational boating industry. Boat shows <strong>of</strong>ten do not<br />
prominently display PFDs, and manufacturers, retailers, and<br />
recreational boating organizations rarely make available boating<br />
safety literature that addresses or advocates PFD use. Only the<br />
personal watercraft industry, and to some extent the paddle<br />
sports industry, have successfully integrated PFD use into the<br />
recreational boating experience.<br />
TAKING ACTION TO IMPROVE ADULT PFD USE<br />
A mandatory PFD wear requirement was not opposed by<br />
all <strong>of</strong> the forum participants. In its presentation, the Coast<br />
Guard’s National Boating Safety Advisory Council (NBSAC)<br />
stated its concern that the proportion <strong>of</strong> fatalities resulting<br />
from drowning had not changed. Initially, NBSAC believed<br />
that boater education efforts would positively affect PFD use,<br />
and requested that the Coast Guard coordinate with NASBLA<br />
to develop a program to encourage mandatory safe boating<br />
education. NBSAC also recommended that the Coast Guard<br />
engage in PFD public awareness campaigns targeting specific<br />
risk groups such as hunters, anglers, paddlers, and personal<br />
watercraft operators. Unfortunately, data continue to show<br />
that PFD use has not increased despite these public safety<br />
campaigns. At the forum, NBSAC reiterated its 2003 resolution<br />
NTSB JOURNAL OF ACCIDENT INVESTIGATION, SPRING 2006; VOLUME 2, ISSUE 1 71
BRUCE G. COURY<br />
that NASBLA develop a model act requiring boaters to wear<br />
PFDs while underway on all recreational boats 21 feet or less<br />
in length. The National Safe Boating Council concurred, and<br />
stated in its presentation at the forum that putting a jacket on<br />
everyone in the small boat category would be the single most<br />
effective way to reduce deaths due to drowning.<br />
How such legislation might be enacted in the United States<br />
was described in the Canadian Safe Boating Council’s (CSBC)<br />
presentation Will It Float? CSBC had commissioned a study<br />
to examine the feasibility <strong>of</strong> legislating mandatory PFD wear<br />
for all people in small recreational boats in Canada. After<br />
considering the potential costs and benefits <strong>of</strong> such legislation,<br />
the study concluded that a mandatory PFD requirement was<br />
appropriate, and CSBC is now working on a strategy to legislate<br />
mandatory PFD wear requirements in Canada. It is interesting<br />
to note that the study found support for such legislation<br />
among boaters and non-boaters alike—the vast majority<br />
(70-87 percent) supported the idea <strong>of</strong> mandatory wear<br />
legislation, and almost all (84-93 percent ) would comply with<br />
the law under all circumstances.<br />
As pointed out in a number <strong>of</strong> forum presentations, PFDs<br />
are already required in certain recreational boating situations.<br />
All States require people onboard a personal watercraft to wear<br />
a PFD, and 41 States and territories require PFDs during towbehind<br />
(for example, wake boarding and water skiing) boating<br />
activities. All but five States require children to wear a PFD<br />
while the boat is underway although there is considerable<br />
variability in age requirements. The Coast Guard enacted<br />
rules in 2004 requiring any child under 13 to wear a PFD while<br />
the boat is underway (unless the child is below decks or in an<br />
enclosed cabin) in Federal waters. Additionally, some States<br />
mandate PFDs be worn for “hazardous conditions/ locations”<br />
or specific vessels or events, and some organizations, like the<br />
American Canoe Association (ACA), require PFDs during all<br />
sponsored activities.<br />
ALTERNATIVES TO MANDATORY PFD WEAR<br />
Boater education combined with safe boating awareness<br />
programs was the single most <strong>of</strong>ten cited alternative to a<br />
mandatory PFD wear requirement. In its presentation at<br />
the forum, the National Marine Manufacturers Association<br />
(NMMA) stated that available resources should be focused on<br />
increasing voluntary PFD use through public awareness. Any<br />
efforts to enforce a new mandatory PFD wear law, NMMA<br />
went on to say, would only divert resources from other, more<br />
productive efforts, such as awareness campaigns and mandatory<br />
boater safety education. The Marine Retailers Association <strong>of</strong><br />
America (MRAA) voiced the same concerns, and stated in<br />
its presentation that boaters need strong reasons to support a<br />
significant change to a long established lifestyle.<br />
All opponents <strong>of</strong> a mandatory PFD wear requirement<br />
were in favor <strong>of</strong> mandatory safe boating education and<br />
industry-wide efforts to promote wear <strong>of</strong> PFDs while boating.<br />
The ACA presentation showed how the paddlesport community<br />
has established education and safety advocacy programs as part<br />
<strong>of</strong> the canoeing and kayaking experience. Forum presenters<br />
argued that much can be gained through increased boater<br />
education and better efforts by industry to promote PFD use<br />
through marketing materials, point <strong>of</strong> sale transactions, and<br />
outreach programs.<br />
NASBLA’s National Boating Education Standards provide<br />
States with the basis for all acceptable recreational boating safety<br />
courses; PFD use is specifically addressed in Standard 2.3. This<br />
standard recognizes the need to inform all boat operators that<br />
they should wear PFDs at all times, and that they need to be alert<br />
to high-risk conditions such as high boat traffic, severe weather,<br />
dangerous water conditions, night operations, and boating<br />
alone. The standard does not, however, specifically discuss<br />
high-risk boating populations, boats, or boating activities, nor<br />
does it provide detailed descriptions <strong>of</strong> PFD types, applications,<br />
and effectiveness. In its presentation at the forum, PFDMA<br />
described the variety <strong>of</strong> currently available PFD types, which<br />
address a wide range <strong>of</strong> comfort, performance, and effectiveness<br />
factors. Forum participants agreed that such information is a<br />
necessary part <strong>of</strong> any safe boating education course, and that<br />
the National Boating Education Standards need to discuss<br />
high-risk boating populations, boats, or boating activities and<br />
provide sufficient detail about the range <strong>of</strong> PFD technologies.<br />
ASSESSING THE EFFECTIVENESS OF<br />
RISK REDUCTION STRATEGIES<br />
The Coast Guard also presented evidence at the forum to<br />
show that safety programs that promote increased PFD wear,<br />
especially among adults, could substantially reduce the number<br />
<strong>of</strong> boaters who drown every year. However, data presented<br />
at the forum also indicated that the effectiveness <strong>of</strong> various<br />
intervention strategies can be difficult to determine. A case<br />
in point is the Coast Guard frequency data for 2003, which<br />
indicated that most drownings were associated with motorboats<br />
21 feet or less in length. The difficulty with this finding is that<br />
most motorboats in the recreational fleet fall into this category.<br />
This point can be illustrated further by considering two<br />
very similar boating activities: canoeing and kayaking. ACA<br />
presented fatality statistics for 2002 showing more canoeists<br />
(39) fatally injured in accidents than kayakers (28) (Snow-Jones<br />
and others, Critical Judgment II: Understanding and Preventing<br />
Canoe and Kayak Fatalities, 1996–2003). However, when<br />
those data are combined with estimates <strong>of</strong> participation from<br />
the U.S. Department <strong>of</strong> Agriculture Forest Service’s National<br />
Survey <strong>of</strong> Recreation and the Environment, a different picture<br />
72 NTSB JOURNAL OF ACCIDENT INVESTIGATION, SPRING 2006; VOLUME 2, ISSUE 1
emerges. When NSRE estimates <strong>of</strong> the number <strong>of</strong> participants<br />
in each type <strong>of</strong> activity are used to calculate exposure measures,<br />
kayakers appear to be much more at risk than canoeists. NSRE<br />
2002 estimates showed that kayakers suffered 3. fatalities per<br />
million participants while the fatality rate among canoeists was<br />
almost half that, at 1.9 per million participants.<br />
<strong>Accident</strong> and injury data for canoeists and kayakers also<br />
illustrate the need for different risk mitigation actions. Data<br />
from the Coast Guard observational study found that, in general,<br />
more than 84 percent <strong>of</strong> kayakers wore PFDs, in contrast to only<br />
27 percent <strong>of</strong> canoeists. These data imply that a requirement to<br />
wear PFDs would affect kayakers less than canoeists. In addition,<br />
the high rate <strong>of</strong> PFD wear among kayakers indicates that factors<br />
other than PFD use affect the outcome in such accidents.<br />
However, Coast Guard data also show that 48 percent <strong>of</strong> the<br />
kayakers who were fatally injured from 1996–2002 were not<br />
wearing PFDs, 1 indicating that the kayakers observed during<br />
the Coast Guard study may not have been representative <strong>of</strong><br />
the kayakers involved in fatal accidents. Such discrepancies<br />
suggest that surveys and observational studies must be carefully<br />
designed to ensure that the data collected are representative <strong>of</strong><br />
the participants most at risk. Such discrepancies also illustrate<br />
the potential to underestimate actual risk, which complicates<br />
any attempt to evaluate intervention strategies.<br />
The ability to assess risks to recreational boaters and<br />
determine the effectiveness <strong>of</strong> actions taken to reduce<br />
recreational boating accidents and fatalities requires accurate<br />
data. Without an effective data collection method, the Coast<br />
Guard’s boating safety program cannot adequately determine<br />
the risks in boating nor effectively reduce the number <strong>of</strong><br />
accidents, fatalities, injuries, property damage, and healthcare<br />
costs associated with boating accidents. Although some<br />
measures <strong>of</strong> participation, activity, and exposure are available<br />
for recreational boating, using those measures to make<br />
risk-based decisions can be difficult. For example, the Coast<br />
Guard calculates accident and fatality rates based on the<br />
number <strong>of</strong> registered boats. Unfortunately, boat registration<br />
requirements differ considerably among States. Some, like Ohio<br />
and South Carolina, require registration <strong>of</strong> all watercraft; others,<br />
like Vermont and Maryland, limit registration to motorboats<br />
only. Further, the Coast Guard’s system for documenting and<br />
numbering boats is not comprehensive and does not necessarily<br />
correspond to State registration requirements. Consequently,<br />
accident or injury rates based on boat registration data may<br />
not adequately represent the size, composition, and use <strong>of</strong> the<br />
recreational boating fleet for risk assessment purposes.<br />
1 Critical Judgment II, page 19.<br />
PERSONAL FLOTATION DEVICES IN RECREATIONAL BOATING<br />
THE SAFETY BOARD TAKES ACTION<br />
The insights provided by the forum prompted the Safety Board<br />
to take action by issuing four safety recommendations in the<br />
following areas: implementing a more effective risk assessment<br />
program for recreational boating; collecting data on boaters,<br />
boats, and boating activities; improving boater education; and<br />
increasing industry efforts to promote PFD use.<br />
The first recommendation focused on the Coast Guard’s<br />
recreational boating risk assessment program. The Safety Board<br />
was concerned that the Coast Guard’s risk-based approach to<br />
recreational boating was not consistent with standard practice in<br />
system safety, 2 and concluded that an effective risk assessment<br />
program with new survey and research methods, at both the<br />
national and State levels, was required to collect, analyze,<br />
and disseminate data and information on recreational boating<br />
participation and activity. Such survey and research methods,<br />
stated the Board, can also provide the basis for longitudinal<br />
studies <strong>of</strong> educational and licensing programs, identification<br />
<strong>of</strong> best practices at the State level, and ongoing observational<br />
studies <strong>of</strong> recreational boating activity and boater behavior. As<br />
a result, the Board recommended that the Coast Guard develop<br />
measures <strong>of</strong> recreational boating activities, boaters, and boats<br />
that can be used to identify and evaluate the risks in recreational<br />
boating. Once those measures have been developed, the Coast<br />
Guard should collect the appropriate data at the Federal and<br />
State levels and use it to evaluate the effectiveness <strong>of</strong> recreational<br />
boating safety programs. Furthermore, the data and the results<br />
<strong>of</strong> the evaluations should be provided to States for use in their<br />
own boating safety programs.<br />
The second recommendation to the Coast Guard specifically<br />
emphasized the need to collect boater education data. In that<br />
recommendation, the Safety Board urged the Coast Guard to<br />
ensure that the measures <strong>of</strong> recreational boater characteristics<br />
include documentation <strong>of</strong> boater educational experience<br />
that can be used at both the Federal and State levels to plan,<br />
coordinate, and evaluate recreational boating education and<br />
licensing programs.<br />
The Safety Board addressed the concerns about boater<br />
education in a recommendation to NASBLA. Citing<br />
deficiencies in the National Boating Education Standards, the<br />
Board recommended that NASBLA modify its standards to<br />
ensure that boating safety education courses adequately discuss<br />
high-risk boating populations, boats, and boating activities, and<br />
present sufficient detail about the range <strong>of</strong> PFD technologies<br />
available.<br />
2 For example, U.S. Department <strong>of</strong> Defense MIL-STD-882D, Standard<br />
Practice for System Safety (2000).<br />
NTSB JOURNAL OF ACCIDENT INVESTIGATION, SPRING 2006; VOLUME 2, ISSUE 1 73
BRUCE G. COURY<br />
Finally, the Safety Board concluded that the recreational<br />
boating industry could do more to promote PFD use in all<br />
aspects <strong>of</strong> recreational boating. Pointing to the success <strong>of</strong> the<br />
PWC and the paddlesports industries, the Board concluded<br />
that such marketing strategies can be effective in promoting<br />
the desirability and increased use <strong>of</strong> PFDs and can be a model<br />
for the rest <strong>of</strong> the recreational boating industry. The Board<br />
recommended that MRAA and NMMA develop a marketing<br />
strategy that promotes increased use <strong>of</strong> PFDs; increased<br />
activity in boating safety education by recreational boating<br />
manufacturers, retailers, and media; and integration <strong>of</strong> PFD<br />
use into the sale <strong>of</strong> boats and accessories. The Board suggested<br />
that the marketing strategy specifically target high-risk boating<br />
populations, boats, and boating activities, and include sufficient<br />
detail about the range <strong>of</strong> PFD technology, comfort, performance,<br />
and effectiveness.<br />
THE AUTHOR<br />
BRUCE G. COURY, Ph. D., is a Transportation Research Analyst in the Safety Studies and Statistical Analysis Division<br />
<strong>of</strong> the NTSB Office <strong>of</strong> Research and Engineering. Dr. Coury was the coordinator for the NTSB’s public forum Personal<br />
Flotation Devices in Recreational Boating, and has been with the Safety Board for 3 years. Prior to joining the Safety Board,<br />
Dr. Coury was a Senior Scientist at the Johns Hopkins University Applied Physics Laboratory and an Associate Pr<strong>of</strong>essor at<br />
the University <strong>of</strong> Massachusetts at Amherst. His doctoral degree is in industrial engineering and operations research from the<br />
State University <strong>of</strong> New York at Buffalo.<br />
74 NTSB JOURNAL OF ACCIDENT INVESTIGATION, SPRING 2006; VOLUME 2, ISSUE 1
Positive Train Control Systems<br />
Jana Price and Jim Southworth, National Transportation Safety Board<br />
On March 2-3, 200 , the National Transportation Safety Board hosted the Positive Train<br />
Control (PTC) Systems Symposium at the NTSB Academy in Ashburn, Virginia. The goal <strong>of</strong><br />
the symposium was to reinvigorate dialogue regarding issues relevant to the implementation <strong>of</strong><br />
PTC systems. More than 1 0 people participated in the symposium, including representatives<br />
from the railroad industry, equipment manufacturers, and government regulators.<br />
In her opening remarks, Safety Board Chairman Ellen Engleman Conners emphasized<br />
the need for PTC by noting that 14 head-on, rear-end, and side collision accidents had<br />
occurred in 2003, and that 91 percent <strong>of</strong> those accidents were attributed to human error.<br />
PTC systems are designed to employ automatic control systems to override mistakes made by<br />
human operators, thereby preventing train collisions and over-speed accidents.<br />
BACKGROUND<br />
Over the last three decades, the Safety Board has investigated numerous accidents in<br />
which crewmembers failed to operate their trains effectively and in accordance with operating<br />
rules for a variety <strong>of</strong> reasons, including fatigue, medications use, or distractions within the<br />
operating cab. Because <strong>of</strong> the potential for such accidents, the Safety Board has advocated<br />
implementation <strong>of</strong> a system that compensates for human error and incorporates collision<br />
avoidance. The Safety Board believes that this system, known in the industry as positive<br />
train control, is particularly important where passenger trains and freight trains operate on<br />
the same tracks. Because <strong>of</strong> the Safety Board’s longstanding interest in this issue, the issue<br />
has been on the Board’s Most Wanted List since the list’s inception in 1990. This safety<br />
issue was again highlighted when a freight train and a commuter train collided head-on in<br />
Placentia, California, in 2002. As a result <strong>of</strong> this accident, the Board reiterated the need for<br />
PTC systems, particularly on high-risk corridors where commuter and intercity passenger<br />
railroads operate.<br />
In 1997, the Federal Railroad Administration’s (FRA) Railroad Safety Advisory<br />
Committee established a working group to address PTC. In 2001, the FRA published a<br />
NTSB JOURNAL OF ACCIDENT INVESTIGATION, SPRING 2006; VOLUME 2, ISSUE 1 7
JANA PRICE AND JIM SOUTHWORTH<br />
Notice <strong>of</strong> Proposed Rulemaking titled, “Standards for<br />
Development and Use <strong>of</strong> Processor-Based Signal and Train<br />
Control Systems.” The final rule, which became effective on<br />
June 6, 200 , established performance-based standards for<br />
processor-based signal and train control. Several organizations,<br />
including Amtrak, New Jersey Transit, Alaska Railroad, CSX,<br />
Burlington Northern Santa Fe Railway (BNSF), and the<br />
State <strong>of</strong> Illinois in partnership with FRA and the Association<br />
<strong>of</strong> American Railroads (AAR), have taken steps towards<br />
implementing PTC by sponsoring demonstration projects.<br />
SYMPOSIUM OVERVIEW<br />
The symposium was organized as a series <strong>of</strong> presentations<br />
followed by panel discussions and open question-and-answer<br />
sessions. Most <strong>of</strong> the presenters described their organizations’<br />
ongoing efforts to develop, test, and implement PTC systems, as<br />
summarized below. Other presenters included representatives<br />
from PTC manufacturers, industry consultants, and the FRA.<br />
For example, the FRA described its role in the development <strong>of</strong><br />
PTC systems, provided an overview <strong>of</strong> the use <strong>of</strong> the Nationwide<br />
Differential Global Positioning System (NDGPS) in PTC<br />
systems, and summarized its ongoing research to understand<br />
PTC human performance issues.<br />
FRA INITIATIVES AND ACTIVITIES<br />
Tom McFarlin and Terry Tse <strong>of</strong> the FRA stated that FRA is a<br />
strong proponent <strong>of</strong> PTC systems and the benefits that they can<br />
provide, and provided an overview <strong>of</strong> the new rule, which was<br />
scheduled for release the week after the symposium (49 CFR 236,<br />
Subpart H). The rule was described as “performance-based”<br />
to accommodate advances in PTC technology. Effectively, the<br />
rule requires that any new system must be at least as safe as<br />
what was there before, and that the operator must demonstrate<br />
to FRA through system tests that risk has been reduced.<br />
The speakers stated that rail lines with trains that run faster<br />
than 79 miles per hour require in-cab systems or PTC. The<br />
FRA has funded a project in Illinois and one in Michigan to<br />
equip high-speed corridor railways with PTC. The FRA stated<br />
that they would continue to support PTC demonstration<br />
projects, encourage interoperability among PTC systems, and<br />
promote the Illinois project as a way to provide a template for<br />
compliance with the PTC rule.<br />
INDUSTRY PRESENTATIONS<br />
Robert VanderClute <strong>of</strong> AAR led <strong>of</strong>f the industry presentations<br />
by noting that the number <strong>of</strong> main-line train collisions and<br />
fatalities on Class 1 freight railroads has dropped significantly<br />
since 1980 while the number <strong>of</strong> ton-miles traveled has increased.<br />
He expressed concern that the currently implemented PTC<br />
systems may not be cost effective and that the current costs<br />
have exceeded the benefits gained—railroads have spent $22<br />
million on PTC-related projects over the last 20 years. He further<br />
suggested that a key challenge for railroads would be developing<br />
systems that consider standardization, interoperability, and<br />
“migratability.” According to VanderClute, the AAR’s Rail<br />
Electronics Taskforce meets regularly to discuss these issues,<br />
and has made progress towards reaching agreement on industry<br />
standards.<br />
New Jersey Transit<br />
John Volger from New Jersey Transit described their<br />
Advanced Speed Enforcement System (ASES), which builds<br />
on existing wayside and on-board technologies. ASES provides<br />
speed authority enforcement, displays speed authorities,<br />
and functions as a speedometer. According to Volger, ASES<br />
operates over a range <strong>of</strong> territories with various signal systems<br />
and has s<strong>of</strong>tware-based rollaway protection. Transponders at<br />
wayside signal locations are programmed with fixed and variable<br />
information. Installation <strong>of</strong> the ASES system is slated to include<br />
over 00 miles <strong>of</strong> track. To date, 23 miles have been installed<br />
on a single-track test area. The design for wayside equipment is<br />
approximately 60 percent complete and the on-board cab signal<br />
equipment is about 92 percent complete. According to Volger,<br />
implementation has been slower than anticipated.<br />
North American Joint Positive Train Control<br />
Terry Tse <strong>of</strong> FRA and Alan Polivka <strong>of</strong> the Transportation<br />
Technology Center, Inc., presented information about the North<br />
American Joint Positive Train Control (NAJPTC) project. The<br />
NAJPTC project involves the FRA, AAR, and the Illinois<br />
Department <strong>of</strong> Transportation, along with several operators and<br />
manufacturers. Its objectives are to demonstrate PTC safety<br />
and functionality, develop interoperability standards, produce<br />
cost-effective design, and develop a revenue-ready system for<br />
high-speed passenger trains intermixed with freight trains.<br />
NAJPTC uses modular vital train control, non-proprietary<br />
hardware and s<strong>of</strong>tware, and a high performance location<br />
determination system. An additional goal <strong>of</strong> the project will be<br />
to serve as a test case or template for how industry can comply<br />
with the FRA’s new PTC rule.<br />
NAJPTC territory includes about 120 miles <strong>of</strong> track between<br />
Springfield and Mazonia, Illinois. Six Union Pacific locomotives<br />
and ten Amtrak locomotives have been equipped with PTC<br />
equipment and have been successfully tested over part <strong>of</strong> the<br />
territory. All wayside signal equipment has been installed<br />
and is currently being tested at 79 mph. At the time <strong>of</strong> the<br />
symposium, the project was conducting field tests on the system<br />
76 NTSB JOURNAL OF ACCIDENT INVESTIGATION, SPRING 2006; VOLUME 2, ISSUE 1
and the FRA stated that they expect that high-speed railway<br />
service would commence in 2006.<br />
Amtrak<br />
Bob Kollmar presented information about Amtrak’s<br />
Incremental Train Control System (ITCS), which supports<br />
revenue service operating up to 90 mph on 4 track miles between<br />
Chicago and Detroit. The ITCS has a GPS location system and<br />
an on-board computer system that provide information about<br />
track restrictions, additions, curves, and temporary slow orders,<br />
as well as supervising movement and enforcement <strong>of</strong> the train.<br />
The on-board display shows track speed limit, actual train speed,<br />
target future speed, time until override, distance to home signal,<br />
milepost number, and train type.<br />
The ITCS is designed to prevent trains from exceeding speed<br />
limits (permanent and temporary), encroaching into the work<br />
limits <strong>of</strong> roadway workers, and colliding with one another. The<br />
ITCS has developed braking algorithms based on “worst case<br />
scenarios.” For example, Kollmar described a test in which a<br />
heavy Norfolk Southern freight train was run downhill with<br />
disabled dynamic brakes. The train engineer was instructed not<br />
to use the controls, and the ITCS overrode the controls and<br />
stopped the train as designed. Their testing has passed FRA<br />
standards for both passenger and freight and, based on their<br />
success, Amtrak has requested to increase train speeds to 9<br />
and 100 mph.<br />
Steve Alleman <strong>of</strong> Amtrak described another system they<br />
have implemented on the Northeast Corridor known as<br />
the Advanced Civil Speed Enforcement System (ACSES).<br />
Originally developed in Europe, ACSES is a “vital overlay”<br />
system that has been implemented incrementally using existing<br />
signals. ACSES has been used on the high-speed Amtrak<br />
Acela trains between New York City and Boston since 2000. Its<br />
current capabilities include positive train stop at interlocking<br />
signals and radio release <strong>of</strong> signals. Currently, Amtrak is<br />
working on enforcement <strong>of</strong> temporary speed restrictions using<br />
PTC. However, during testing <strong>of</strong> the phase-two system, they<br />
encountered difficulties, which led them to shut the system<br />
down. Alleman noted that they have learned to keep the system<br />
specifications as simple as possible, to standardize on-board<br />
equipment as much as possible, and to have precise location<br />
data at the outset <strong>of</strong> the project.<br />
Alaska Railroad<br />
Eileen Reilly and Andy Schiestl presented information about<br />
the Alaska Railroad’s Collision Avoidance System (CAS).<br />
Development <strong>of</strong> CAS began in 1997 with the primary goal <strong>of</strong><br />
train separation. Other goals included increasing train speed,<br />
capacity, and efficiency, and having a paperless system. Because<br />
Alaska Railroad has no power on much <strong>of</strong> its track, they felt it<br />
couldn’t support a “big infrastructure” system.<br />
The CAS system consists <strong>of</strong> a main computer,<br />
on-board displays, dispatcher displays, locomotive polls<br />
at waysides to provide on-board data, and speed/distance<br />
evaluation brakes. The system allows for remote control <strong>of</strong><br />
siding switches to keep trains at a safe distance from each other<br />
using GPS technology. On-board computers in locomotives<br />
monitor the status <strong>of</strong> the switches and show train movement<br />
instructions to the crew. Alaska Railroad has also installed<br />
a computer-aided dispatch system and converted its analog<br />
microwave communication system to digital. Prototype CAS<br />
equipment is scheduled to be installed in the spring <strong>of</strong> 2006 on<br />
a test locomotive, and a braking test <strong>of</strong> the collision avoidance<br />
system is scheduled to begin in the fall <strong>of</strong> 2006.<br />
NTSB JOURNAL OF ACCIDENT INVESTIGATION, SPRING 2006; VOLUME 2, ISSUE 1 77<br />
CSX<br />
Denise Lyle from CSX provided a freight rail perspective and<br />
discussed the CSX Communication Based Train Management<br />
(CBTM) system. According to Lyle, CSX has not set a goal <strong>of</strong><br />
zero collisions, but has addressed areas <strong>of</strong> highest risk. CBTM<br />
is an overlay safety enhancement system, currently designed<br />
for nonsignalized territory. The system relies on existing signal<br />
technology to make sure that crews comply with authorities or<br />
speed restrictions that they have been given. The system will<br />
notify a crew as they approach work zones, speed restrictions,<br />
or the end <strong>of</strong> the train’s authority. If the crew does not respond,<br />
the system will provide a penalty brake override. According to<br />
Lyle, if the CBTM system fails, it will return to its original level<br />
<strong>of</strong> operation, which places primary responsibility <strong>of</strong> train control<br />
on the crew.<br />
Burlington Northern Santa Fe Railway<br />
POSITIVE TRAIN CONTROL SYSTEMS<br />
Rick Lederer from the BNSF presented information about<br />
the BNSF Electronic Train Management System (ETMS).<br />
This overlay system provides a “safety net” while other systems<br />
maintain primary control. Like other systems, the train receives<br />
communications from signals as it approaches them, and in-cab<br />
computers provide information about the upcoming signal. If<br />
the crew approaches a signal without slowing, the signal will<br />
send a message to the in-vehicle system to begin automatic<br />
braking. Currently, the system covers 22,000 track miles, with<br />
8,000 to 10,000 thousand that remain to be covered, mostly in<br />
single train branch lines.
JANA PRICE AND JIM SOUTHWORTH<br />
NATIONWIDE DIFFERENTIAL<br />
GLOBAL POSITIONING SYSTEM<br />
Leonard Allen from the FRA provided an update on the<br />
status <strong>of</strong> the Nationwide Differential Global Positioning<br />
System (NDGPS), which will facilitate development and<br />
implementation <strong>of</strong> PTC. Originally developed for the U.S. Coast<br />
Guard near ocean and inland waterways, NDGPS comprises a<br />
series <strong>of</strong> reference stations throughout the United States that<br />
interact with satellites to provide location information. In<br />
1997, Congress decided to expand the network nationwide,<br />
and it is now operational on single-station coverage over about<br />
92 percent <strong>of</strong> the land area <strong>of</strong> the continental U.S. NDGPS<br />
provides 1- to 3-meter position accuracy to receivers capable <strong>of</strong><br />
receiving the differential correction signal.<br />
The NDGPS project is now in the process <strong>of</strong> converting<br />
a group <strong>of</strong> decommissioned U.S. Air Force ground network<br />
systems to provide additional coverage. Nine Federal agencies<br />
are involved, and the FRA has a lead role as the sponsoring<br />
agency within DOT to increase dual (redundant) coverage from<br />
60 to 100 percent coverage <strong>of</strong> the continental U.S. According<br />
to the FRA, the NDGPS project has suffered from inadequate<br />
funding. For example, the funding received for the program in<br />
fiscal year 2004 was less than one-quarter <strong>of</strong> what was requested.<br />
This funding shortfall has led the DOT to reconsider its plan to<br />
pursue development <strong>of</strong> a high-accuracy NDGPS system, which<br />
would provide accuracy <strong>of</strong> approximately 10 to 1 centimeters<br />
and could be used to collect data concerning track problems<br />
using instrumented trains.<br />
THE RELATIONSHIP BETWEEN PTC AND<br />
HUMAN PERFORMANCE<br />
Jordan Multer from the Volpe National Transportation<br />
Systems Center opened his presentation by noting that the<br />
number <strong>of</strong> railroad accidents has gone down, but that the<br />
nature <strong>of</strong> accidents is changing. Although the proportion <strong>of</strong><br />
accidents attributable to mechanical issues has declined, those<br />
attributable to human issues, such as fatigue, distraction, and<br />
medical disability, have increased. PTC creates an additional<br />
layer <strong>of</strong> defense to systems that are already in place to prevent<br />
human error, such as training and redundant staffing. However,<br />
introduction <strong>of</strong> PTC technology and features will undoubtedly<br />
add complexity to the system, which may introduce new sources<br />
<strong>of</strong> errors.<br />
Multer identified a list <strong>of</strong> human performance factors to<br />
consider when implementing PTC systems. For example, he<br />
noted that some companies claim that when their systems fail,<br />
they revert to their basic non-PTC operational mode, which<br />
would not affect the operation <strong>of</strong> the system. However, if<br />
human operators are not aware <strong>of</strong> the system failure, they may<br />
commit errors by behaving as if the system were functional.<br />
Another area <strong>of</strong> concern Multer identified is interoperability.<br />
For example, when a train leaves one PTC territory and enters<br />
another, how will the in-cab display change? Should there be<br />
one common interface or different interfaces for each railroad?<br />
Multer suggested that involving human operators in the design<br />
process is the best way to address these concerns by fostering<br />
a system design that will accommodate human performance<br />
limitations and allow designers to identify new sources <strong>of</strong> risk.<br />
These issues have been addressed in multiple FRA research<br />
studies and are highlighted in the new rulemaking.<br />
PANEL DISCUSSIONS<br />
At the end <strong>of</strong> both days <strong>of</strong> the symposium, speakers assembled<br />
for a panel discussion with the attendees and throughout the<br />
symposium, audience members were encouraged to submit<br />
questions for the speakers. Multiple issues were raised during<br />
these discussions, including the following:<br />
• Interoperability <strong>of</strong> various PTC systems<br />
Setting interoperability standards and designing for<br />
interoperability<br />
• Effects <strong>of</strong> PTC on rail system capacity and efficiency<br />
Locomotive crew feedback on the usability and<br />
effectiveness <strong>of</strong> PTC systems<br />
• Testing and preparing for s<strong>of</strong>tware failures<br />
• Protecting systems from tampering or sabotage<br />
Future <strong>of</strong> investments in railroad train control and<br />
enforcement<br />
• Aging train authority systems<br />
Wayside-centric versus vehicle-centric PTC<br />
architectures<br />
• Track integrity detection systems<br />
•<br />
Energy conservation<br />
CONCLUDING REMARKS<br />
At the end <strong>of</strong> the symposium, Bob Chipkevich, Director <strong>of</strong><br />
the Safety Board’s Office <strong>of</strong> Railroad, Pipeline, and Hazardous<br />
Materials <strong>Investigation</strong>s, reaffirmed the importance <strong>of</strong> PTC by<br />
noting that in the last 6 years, the Safety Board has launched<br />
on 38 accidents that could have been prevented by PTC type<br />
systems. Chipkevich concluded,<br />
PTC is a national issue, it’s not a single railroad issue,<br />
it’s not a regional issue. I think it’s important for<br />
78 NTSB JOURNAL OF ACCIDENT INVESTIGATION, SPRING 2006; VOLUME 2, ISSUE 1<br />
•<br />
•<br />
•<br />
•
us to get together and talk about the issue, to share<br />
information about what’s being studied and developed<br />
on different systems. It is very enlightening to see a<br />
lot <strong>of</strong> the work that is being done. I look forward to<br />
seeing the industry work together to solve the issue,<br />
and to come up with an interoperability standard<br />
that everyone can agree on.<br />
Safety Board Member Debbie Hersman also thanked the<br />
group for its commitment and interest in the topic <strong>of</strong> PTC and<br />
stated, “I think PTC has come a long way since we first put it on<br />
our list in 1990. I think we’ve seen today that there’s been great<br />
progress and I look forward to continuing the dialog.”<br />
For additional information on the National Transportation<br />
Safety Board Positive Train Control Systems Symposium, please<br />
visit the NTSB PTC Symposium website at http://www.ntsb.<br />
gov/events/symp_ptc/symp_ptc.htm.<br />
THE AUTHORS<br />
POSITIVE TRAIN CONTROL SYSTEMS<br />
JANA M. PRICE, Ph.D., is a Transportation Research Analyst in the Safety Studies and Data Analysis Division at the NTSB. In<br />
this role, she conducts safety studies addressing all modes <strong>of</strong> transportation as well as providing statistical and human factors support<br />
for accident investigations. Dr. Price recently co-authored the safety study, “Risk Factors Associated with Weather-Related General<br />
Aviation <strong>Accident</strong>s.”<br />
JAMES A. SOUTHWORTH currently serves as the Associate Director (Acting) for the Railroad Division, Office <strong>of</strong> Railroad,<br />
Pipeline and Hazardous Materials Safety at the NTSB. Before joining the Safety Board as an investigator-in-charge, Mr. Southworth<br />
spent nearly 1 years with the Association <strong>of</strong> American Railroads as an <strong>of</strong>ficer in the Operations and Maintenance Department. At<br />
the AAR, he managed technical committees, primarily dealing with train line coupling/cushioning and braking systems and railroad<br />
castings, as well as writing and publishing technical standards.<br />
NTSB JOURNAL OF ACCIDENT INVESTIGATION, SPRING 2006; VOLUME 2, ISSUE 1 79