Chapter 2. COST PER WAFER - Smithsonian - The Chip Collection
Chapter 2. COST PER WAFER - Smithsonian - The Chip Collection
Chapter 2. COST PER WAFER - Smithsonian - The Chip Collection

You also want an ePaper? Increase the reach of your titles
YUMPU automatically turns print PDFs into web optimized ePapers that Google loves.
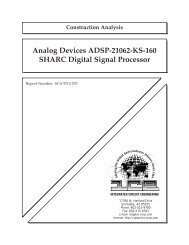
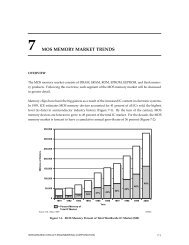
Thin Films<br />
16%<br />
Etch<br />
18%<br />
Implant<br />
12%<br />
Long-term increases in depreciation and<br />
R&D expenditures continually challenge the<br />
cost-effectiveness of IC manufacturing. One<br />
metric used to examine overall cost effectiveness<br />
is asset turnover rate. Figure 2-12<br />
shows that in the years preceding 1980,<br />
every dollar of net fixed assets generated<br />
greater than $3.00 in sales revenue. By 1987,<br />
asset turnover rate had fallen by 50 percent.<br />
However, recent trends indicate that asset<br />
Photolithography<br />
32%<br />
Diffusion<br />
22%<br />
Source: Microlithography World 21070<br />
Figure 2-10. Relative Costs of Semiconductor Manufacturing Areas<br />
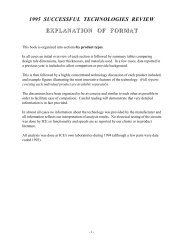
Billions of Dollars<br />
1,000<br />
100<br />
10<br />
1<br />
Semiconductor Market<br />
Mask Market<br />
0.1<br />
1977 1980 1985 1990 1995 2000<br />
Year<br />
Source: Wafer News/Rose Assoc. 22693<br />
Figure 2-11. Growing Investment in Reticles and Masks<br />
Cost Per Wafer<br />
turnover rates are stabilizing. However, further<br />
deterioration in the rate may affect the<br />
financial future of the industry. Once again,<br />
by making facilities and operations more<br />
cost effective, margins can be preserved and<br />
the rate of technological advancement can<br />
continue at its rapid pace. Astoundingly, the<br />
average employee of a merchant IC manufacturer<br />
in the U.S. is supported by $120,000<br />
in net fixed assets (Figure 2-13).<br />
INTEGRATED CIRCUIT ENGINEERING CORPORATION 2-9