

Docteur de l'université Automatic Segmentation and Shape Analysis ...
Docteur de l'université Automatic Segmentation and Shape Analysis ...
Docteur de l'université Automatic Segmentation and Shape Analysis ...

You also want an ePaper? Increase the reach of your titles
YUMPU automatically turns print PDFs into web optimized ePapers that Google loves.
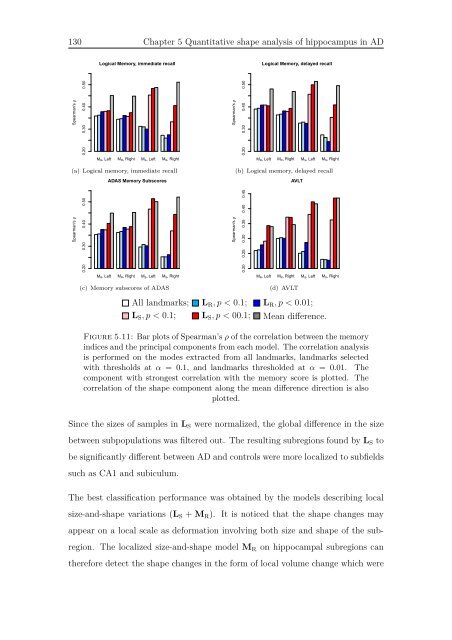
130 Chapter 5 Quantitative shape analysis of hippocampus in AD<br />
Spearman's ρ<br />
0.20 0.30 0.40 0.50<br />
Logical Memory, immediate recall<br />
M R, Left MR, Right MS, Left MS, Right<br />
(a) Logical memory, immediate recall<br />
Spearman's ρ<br />
0.20 0.30 0.40 0.50<br />
ADAS Memory Subscores<br />
M R, Left MR, Right MS, Left MS, Right<br />
(c) Memory subscores of ADAS<br />
Spearman's ρ<br />
Spearman's ρ<br />
0.20 0.30 0.40 0.50<br />
Logical Memory, <strong>de</strong>layed recall<br />
M R, Left MR, Right MS, Left MS, Right<br />
(b) Logical memory, <strong>de</strong>layed recall<br />
0.20 0.25 0.30 0.35 0.40 0.45<br />
AVLT<br />
M R, Left MR, Right MS, Left MS, Right<br />
(d) AVLT<br />
. .All l<strong>and</strong>marks; . .LR, p < 0.1; . .LR, p < 0.01;<br />
. .LS, p < 0.1; . .LS, p < 00.1; . .Mean difference.<br />
Figure 5.11: Bar plots of Spearman’s ρ of the correlation between the memory<br />
indices <strong>and</strong> the principal components from each mo<strong>de</strong>l. The correlation analysis<br />
is performed on the mo<strong>de</strong>s extracted from all l<strong>and</strong>marks, l<strong>and</strong>marks selected<br />
with thresholds at α = 0.1, <strong>and</strong> l<strong>and</strong>marks threshol<strong>de</strong>d at α = 0.01. The<br />
component with strongest correlation with the memory score is plotted. The<br />
correlation of the shape component along the mean difference direction is also<br />
plotted.<br />
Since the sizes of samples in LS were normalized, the global difference in the size<br />
between subpopulations was filtered out. The resulting subregions found by LS to<br />
be significantly different between AD <strong>and</strong> controls were more localized to subfields<br />
such as CA1 <strong>and</strong> subiculum.<br />
The best classification performance was obtained by the mo<strong>de</strong>ls <strong>de</strong>scribing local<br />
size-<strong>and</strong>-shape variations (LS + MR). It is noticed that the shape changes may<br />
appear on a local scale as <strong>de</strong>formation involving both size <strong>and</strong> shape of the sub-<br />
region. The localized size-<strong>and</strong>-shape mo<strong>de</strong>l MR on hippocampal subregions can<br />
therefore <strong>de</strong>tect the shape changes in the form of local volume change which were


