PI Visualization Suite - OSIsoft
PI Visualization Suite - OSIsoft
PI Visualization Suite - OSIsoft

Create successful ePaper yourself
Turn your PDF publications into a flip-book with our unique Google optimized e-Paper software.
<strong>PI</strong> <strong>Visualization</strong> <strong>Suite</strong><br />
Data for Every User<br />
WHEREVER YOU ARE...<br />
WHATEVER YOU DO<br />
ON YOUR DEVICE
1<br />
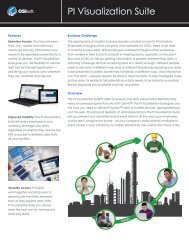
Operations data is valuable to people throughout your organization, not just to engineers and operators.<br />
With the right data people throughout your company can make more informed decisions, exchange<br />
insights and react faster to process, regulatory and business changes. Making data accessible to all<br />
facets of your company is challenging. From presenting data in the many differing formats users need,<br />
quickly delivering data to a gamut of devices and ensuring that the right information reaches the right<br />
people, there are many issues to consider.<br />
The <strong>PI</strong> <strong>Visualization</strong> <strong>Suite</strong> helps you conduct business in a new way. It ensures that everyone in your<br />
company can access the data they need, anytime, anywhere. As new corporate initiatives and<br />
projects are undertaken, the <strong>PI</strong> <strong>Visualization</strong> <strong>Suite</strong> allows you to leverage your existing toolset while still<br />
meeting each project’s unique data access and visualization needs. The <strong>PI</strong> <strong>Visualization</strong> <strong>Suite</strong> includes:<br />
<strong>PI</strong> ProcessBook, <strong>PI</strong> DataLink, <strong>PI</strong> Coresight, <strong>PI</strong> WebParts, <strong>PI</strong> Manual Logger, <strong>PI</strong> ActiveView and<br />
<strong>PI</strong> BatchView.<br />
<strong>PI</strong> Coresight<br />
Easily perform ad hoc data analysis on the go from your iPad® or<br />
the web. With <strong>PI</strong> Coresight, anyone can instantly investigate issues<br />
and solve problems while simultaneously creating new displays/<br />
reports that share your insights company wide and provide valuable<br />
resources for your co-workers. Sharing insights is as easy as sending<br />
a link to your coworkers.<br />
<strong>PI</strong> ProcessBook<br />
<strong>PI</strong> ProcessBook empowers your users to graphically create displays<br />
and enrich them with layers of robust, dynamic, data. With<br />
<strong>PI</strong> ProcessBook, your operators can compare areas side-by-side<br />
to quickly understand which processes should be optimized.<br />
Personnel can visually walk through a plant by navigating through<br />
related sets of displays. Supervisors can get snapshot views of key<br />
processes outside of the control room.<br />
<strong>PI</strong> DataLink<br />
With <strong>PI</strong> DataLink you can create dynamic reports for any area of<br />
your operations, instantly summarize years of data and monetize<br />
your <strong>PI</strong> System data to discover the true cost and value of operation<br />
decisions. Your environmental personnel can create the custom<br />
reports for regulatory authorities. Your accounting personnel can<br />
review the costs of raw materials compared to production outputs.<br />
Shift supervisors can review production performance metrics.<br />
Engineers can use familiar Microsoft® Excel® formulas to perform<br />
deep analysis of historical data.
<strong>PI</strong> WebParts<br />
<strong>PI</strong> WebParts helps you create dynamic dashboards in Microsoft<br />
SharePoint® that combine your real-time operations data with<br />
financial information, graphics and other company information.<br />
SharePoint has become a common tool for sharing information<br />
and reports throughout the enterprise. <strong>PI</strong> WebParts allows you to<br />
enhance your SharePoint displays with real-time information from<br />
the <strong>PI</strong> System, so more users can leverage valuable operations<br />
data to do their jobs.<br />
<strong>PI</strong> Manual Logger<br />
Not all data can be automatically collected. <strong>PI</strong> Manual Logger<br />
gives you a simple and easy way to integrate manually collected<br />
data alongside your automated operations data. From field<br />
inspections to lab values, your data and expert insights are easily<br />
collected and seamlessly delivered to the <strong>PI</strong> Server as frequently or<br />
infrequently as you need.<br />
<strong>PI</strong> ActiveView<br />
<strong>PI</strong> ActiveView helps you minimize additional work and maximize<br />
reusability. With <strong>PI</strong> ActiveView you can easily deliver existing<br />
<strong>PI</strong> ProcessBook displays to users who want to leverage them but<br />
don’t need the tools to build them. For example, managers can<br />
use the same content as your Operators and Engineers but they<br />
can access it through a web site, a Microsoft Office document or<br />
through your custom-built applications – seeing the information<br />
they want without having to be trained on new software.<br />
<strong>PI</strong> BatchView<br />
Viewing your real-time process data within the context of your<br />
batch processes is critical for manufacturing products. <strong>PI</strong> BatchView<br />
frames your data within the context of your batch processes to<br />
improve your operational analysis and understanding so you<br />
can have more on-spec batches, meet regulatory compliance<br />
obligations and make faster and better decisions.<br />
The <strong>PI</strong> <strong>Visualization</strong> <strong>Suite</strong> frees you from purchasing models that require you to predict the future. Before,<br />
to ensure optimal value for your money, you had to accurately predict the precise number of users<br />
who would need a product, predict every scenario you’d want to use it for and every way you’d need<br />
to deploy it. With <strong>PI</strong> <strong>Visualization</strong> <strong>Suite</strong> every user in your company, now and in the future, is covered.<br />
<strong>PI</strong> <strong>Visualization</strong> <strong>Suite</strong> gives you unlimited access to an arsenal of tools so you can deploy the right tool,<br />
every time and it supports a variety of devices and delivery channels for sharing your data.<br />
2
About <strong>OSIsoft</strong>, LLC<br />
<strong>OSIsoft</strong> (www.osisoft.com) delivers the <strong>PI</strong> System, the industry standard in enterprise infrastructure, for<br />
management of real-time data and events. With installations in more than 110 countries spanning the globe,<br />
the <strong>PI</strong> System is used in manufacturing, energy, utilities, life sciences, data centers, facilities and the process<br />
industries. This global installed base relies upon the <strong>PI</strong> System to safeguard data and deliver enterprise-wide<br />
visibility into operational, manufacturing and business data. The <strong>PI</strong> System enables users to manage assets,<br />
mitigate risks, comply with regulations, improve processes, drive innovation, make business decisions in<br />
real-time and to identify competitive business and market opportunities. Founded in 1980, <strong>OSIsoft</strong> is<br />
headquartered in San Leandro, California, with operations worldwide and is privately held.<br />
All companies, products and brands mentioned are trademarks of their respective trademark owners.<br />
© Copyright 2013 <strong>OSIsoft</strong>, LLC | 777 Davis Street, San Leandro, CA 94577 | www.osisoft.com<br />
BRVSEN-032713