Los Angeles County Self-Assessment Report
Los Angeles County Self-Assessment Report
Los Angeles County Self-Assessment Report

You also want an ePaper? Increase the reach of your titles
YUMPU automatically turns print PDFs into web optimized ePapers that Google loves.
Narrative <strong>Assessment</strong> of Child and Family Outcomes<br />
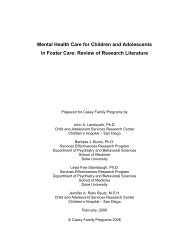
Participation Rates: Referrals, Substantiations, Entries, and Caseload:<br />
During the past three fiscal periods, DCFS has seen a gradual increase in referral and<br />
entry rates, but a gradual reduction in substantiation rates. Since FY 04-05, referral<br />
rates increased by 3.7% and entry rates increase by 21.8%. Substantiation rates,<br />
however, decreased by 3.96%. Referral rates are beyond the control of DCFS, as any<br />
member of the community may call the Child Protection Hotline to report suspected<br />
child abuse and neglect. Referral rates may be caused by socio-economic factors, such<br />
as a declining economy and housing costs that have become unaffordable for many in<br />
<strong>Los</strong> <strong>Angeles</strong>, but causes to the hike in referral rates are purely speculative. The<br />
increased entry rates since 2004 may be influenced by the implementation of Team<br />
Decision Making (TDM) and Structured Decision Making (SDM), as both interventions<br />
require the social worker to conduct a thorough assessment on all the risk and safety<br />
issues that are affecting child safety. Purposes of TDM and SDM include supporting the<br />
social worker in making the best possible decisions on a case, not reducing entry rates.<br />
While increases in the use of TDM and SDM were occurring, so were increases in entry<br />
rates.<br />
45<br />
40<br />
35<br />
30<br />
25<br />
20<br />
15<br />
10<br />
5<br />
0<br />
Referrals, Substatiations & Entry<br />
Rates<br />
Jan 2004-<br />
Dec. 04<br />
Jan 2005 -<br />
Dec 05<br />
Jan 2006 -<br />
Dec 06<br />
Referral Rates ( Incidence per 1,000 children)<br />
Participation Rates: Substantiation Rates (Incidence per 1,000 children)<br />
Participation Rates: Entry Rates (Incidence per 1,000 children)<br />
46