

The Economic Importance Of Marine Angler Expenditures In
The Economic Importance Of Marine Angler Expenditures In
The Economic Importance Of Marine Angler Expenditures In

You also want an ePaper? Increase the reach of your titles
YUMPU automatically turns print PDFs into web optimized ePapers that Google loves.
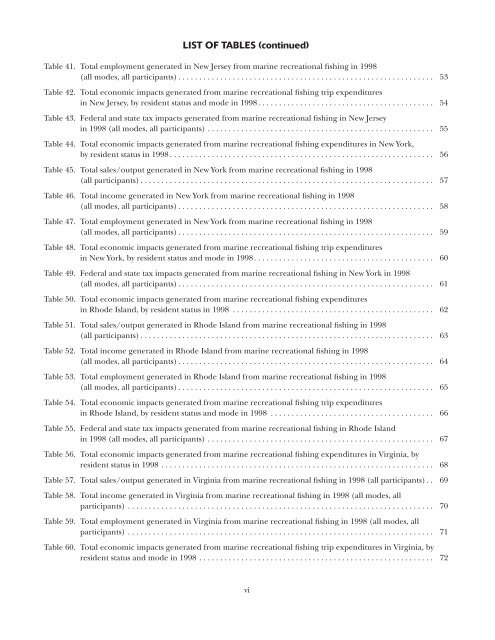
LIST OF TABLES (continued)<br />
Table 41. Total employment generated in New Jersey from marine recreational fishing in 1998<br />
(all modes, all participants) . . . . . . . . . . . . . . . . . . . . . . . . . . . . . . . . . . . . . . . . . . . . . . . . . . . . . . . . . . . . . 53<br />
Table 42. Total economic impacts generated from marine recreational fishing trip expenditures<br />
in New Jersey, by resident status and mode in 1998 . . . . . . . . . . . . . . . . . . . . . . . . . . . . . . . . . . . . . . . . . . 54<br />
Table 43. Federal and state tax impacts generated from marine recreational fishing in New Jersey<br />
in 1998 (all modes, all participants) . . . . . . . . . . . . . . . . . . . . . . . . . . . . . . . . . . . . . . . . . . . . . . . . . . . . . . 55<br />
Table 44. Total economic impacts generated from marine recreational fishing expenditures in New York,<br />
by resident status in 1998 . . . . . . . . . . . . . . . . . . . . . . . . . . . . . . . . . . . . . . . . . . . . . . . . . . . . . . . . . . . . . . . 56<br />
Table 45. Total sales/output generated in New York from marine recreational fishing in 1998<br />
(all participants) . . . . . . . . . . . . . . . . . . . . . . . . . . . . . . . . . . . . . . . . . . . . . . . . . . . . . . . . . . . . . . . . . . . . . . 57<br />
Table 46. Total income generated in New York from marine recreational fishing in 1998<br />
(all modes, all participants) . . . . . . . . . . . . . . . . . . . . . . . . . . . . . . . . . . . . . . . . . . . . . . . . . . . . . . . . . . . . . 58<br />
Table 47. Total employment generated in New York from marine recreational fishing in 1998<br />
(all modes, all participants) . . . . . . . . . . . . . . . . . . . . . . . . . . . . . . . . . . . . . . . . . . . . . . . . . . . . . . . . . . . . . 59<br />
Table 48. Total economic impacts generated from marine recreational fishing trip expenditures<br />
in New York, by resident status and mode in 1998 . . . . . . . . . . . . . . . . . . . . . . . . . . . . . . . . . . . . . . . . . . . 60<br />
Table 49. Federal and state tax impacts generated from marine recreational fishing in New York in 1998<br />
(all modes, all participants) . . . . . . . . . . . . . . . . . . . . . . . . . . . . . . . . . . . . . . . . . . . . . . . . . . . . . . . . . . . . . 61<br />
Table 50. Total economic impacts generated from marine recreational fishing expenditures<br />
in Rhode Island, by resident status in 1998 . . . . . . . . . . . . . . . . . . . . . . . . . . . . . . . . . . . . . . . . . . . . . . . . 62<br />
Table 51. Total sales/output generated in Rhode Island from marine recreational fishing in 1998<br />
(all participants) . . . . . . . . . . . . . . . . . . . . . . . . . . . . . . . . . . . . . . . . . . . . . . . . . . . . . . . . . . . . . . . . . . . . . . 63<br />
Table 52. Total income generated in Rhode Island from marine recreational fishing in 1998<br />
(all modes, all participants) . . . . . . . . . . . . . . . . . . . . . . . . . . . . . . . . . . . . . . . . . . . . . . . . . . . . . . . . . . . . . 64<br />
Table 53. Total employment generated in Rhode Island from marine recreational fishing in 1998<br />
(all modes, all participants) . . . . . . . . . . . . . . . . . . . . . . . . . . . . . . . . . . . . . . . . . . . . . . . . . . . . . . . . . . . . . 65<br />
Table 54. Total economic impacts generated from marine recreational fishing trip expenditures<br />
in Rhode Island, by resident status and mode in 1998 . . . . . . . . . . . . . . . . . . . . . . . . . . . . . . . . . . . . . . . 66<br />
Table 55. Federal and state tax impacts generated from marine recreational fishing in Rhode Island<br />
in 1998 (all modes, all participants) . . . . . . . . . . . . . . . . . . . . . . . . . . . . . . . . . . . . . . . . . . . . . . . . . . . . . . 67<br />
Table 56. Total economic impacts generated from marine recreational fishing expenditures in Virginia, by<br />
resident status in 1998 . . . . . . . . . . . . . . . . . . . . . . . . . . . . . . . . . . . . . . . . . . . . . . . . . . . . . . . . . . . . . . . . . 68<br />
Table 57. Total sales/output generated in Virginia from marine recreational fishing in 1998 (all participants) . . 69<br />
Table 58. Total income generated in Virginia from marine recreational fishing in 1998 (all modes, all<br />
participants) . . . . . . . . . . . . . . . . . . . . . . . . . . . . . . . . . . . . . . . . . . . . . . . . . . . . . . . . . . . . . . . . . . . . . . . . . 70<br />
Table 59. Total employment generated in Virginia from marine recreational fishing in 1998 (all modes, all<br />
participants) . . . . . . . . . . . . . . . . . . . . . . . . . . . . . . . . . . . . . . . . . . . . . . . . . . . . . . . . . . . . . . . . . . . . . . . . . 71<br />
Table 60. Total economic impacts generated from marine recreational fishing trip expenditures in Virginia, by<br />
resident status and mode in 1998 . . . . . . . . . . . . . . . . . . . . . . . . . . . . . . . . . . . . . . . . . . . . . . . . . . . . . . . . 72<br />
vi


