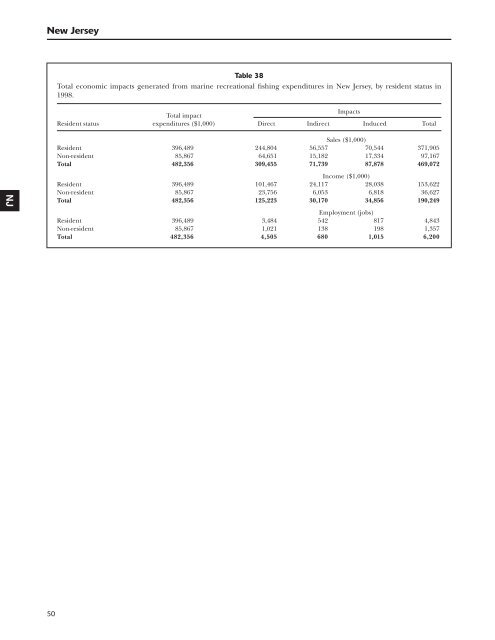
NJ New Jersey 50 Table 38 Total economic impacts generated from marine recreational fishing expenditures in New Jersey, by resident status in 1998. Total impact Impacts Resident status expenditures ($1,000) Direct <strong>In</strong>direct <strong>In</strong>duced Total Sales ($1,000) Resident 396,489 244,804 56,557 70,544 371,905 Non-resident 85,867 64,651 15,182 17,334 97,167 Total 482,356 309,455 71,739 87,878 469,072 <strong>In</strong>come ($1,000) Resident 396,489 101,467 24,117 28,038 153,622 Non-resident 85,867 23,756 6,053 6,818 36,627 Total 482,356 125,223 30,170 34,856 190,249 Employment (jobs) Resident 396,489 3,484 542 817 4,843 Non-resident 85,867 1,021 138 198 1,357 Total 482,356 4,505 680 1,015 6,200
Table 39 Total sales/output generated in New Jersey from marine recreational fishing in 1998 (all participants). Total impact Impacts ($1,000) Expenditure category expenditures ($1,000) Direct <strong>In</strong>direct <strong>In</strong>duced Total Food Groceries 40,374 22,494 5,772 6,108 34,374 Restaurants 19,000 19,000 6,113 5,700 30,813 Private transportation 19,467 16,922 3,234 2,807 22,963 Lodging 10,089 10,089 2,821 3,204 16,114 Public transportation 2,019 2,019 617 732 3,368 Boat fuel 38,975 33,888 6,476 5,623 45,987 Party/charter fee 12,929 12,929 3,909 4,042 20,880 Access/boat launching 19,644 19,644 5,939 6,139 31,722 Equipment rental 2,089 2,089 632 653 3,374 Bait 30,695 14,712 2,730 3,778 21,220 Ice 10,063 6,842 1,792 2,309 10,943 Total trip expenditures 205,344 160,628 40,035 41,095 241,758 Rods and reels 91,600 47,866 7,710 15,723 71,299 Tackle and gear 47,131 24,626 3,966 8,089 36,681 Camping equipment 4,769 3,946 930 1,118 5,994 Binoculars 2,438 1,479 281 484 2,244 Fishing clothing 9,138 5,700 1,614 1,699 9,013 Processing/taxidermy 435 435 134 129 698 Magazines 4,778 2,359 498 754 3,611 Club dues 4,563 4,563 1,676 1,740 7,979 Boat expenses 26,682 26,682 8,631 8,427 43,740 New motor boat 45,041 8,320 1,331 2,748 12,399 New canoe or other nonmotor boat 94 17 3 6 26 Used boats purchased from dealers 2,337 2,337 277 798 3,412 Electronics 7,158 6,294 1,800 1,831 9,925 New fishing vehicle 27,383 10,738 2,417 2,086 15,241 Used fishing vehicles purchased from dealers 3,042 3,042 361 1,039 4,442 Vacation home 40 40 17 9 66 Fees for vehicle loans 149 149 24 38 211 Fees for boat loans 190 190 30 49 269 Fees for home loans 0 0 0 0 0 Property taxes for all vacation homes 30 30 0 14 44 Real estate commission 14 14 4 2 20 Total equipment and durable expenditures 277,012 148,827 31,704 46,783 227,314 Total all activity 482,356 309,455 71,739 87,878 469,072 51 NJ