

The Economic Importance Of Marine Angler Expenditures In
The Economic Importance Of Marine Angler Expenditures In
The Economic Importance Of Marine Angler Expenditures In

Create successful ePaper yourself
Turn your PDF publications into a flip-book with our unique Google optimized e-Paper software.
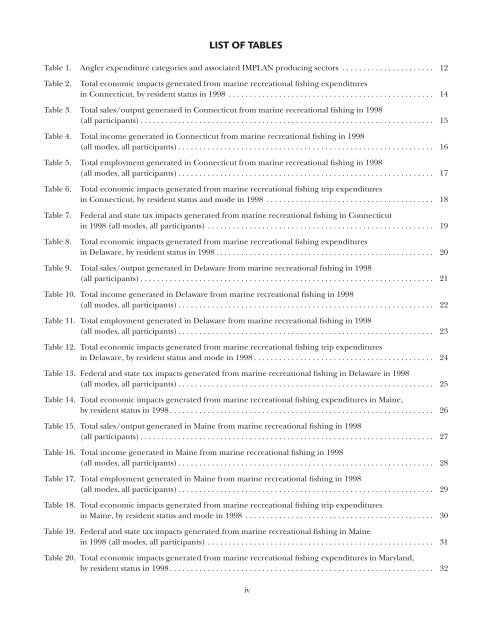
LIST OF TABLES<br />
Table 1. <strong>Angler</strong> expenditure categories and associated IMPLAN producing sectors . . . . . . . . . . . . . . . . . . . . . . 12<br />
Table 2. Total economic impacts generated from marine recreational fishing expenditures<br />
in Connecticut, by resident status in 1998 . . . . . . . . . . . . . . . . . . . . . . . . . . . . . . . . . . . . . . . . . . . . . . . . . 14<br />
Table 3. Total sales/output generated in Connecticut from marine recreational fishing in 1998<br />
(all participants) . . . . . . . . . . . . . . . . . . . . . . . . . . . . . . . . . . . . . . . . . . . . . . . . . . . . . . . . . . . . . . . . . . . . . . 15<br />
Table 4. Total income generated in Connecticut from marine recreational fishing in 1998<br />
(all modes, all participants) . . . . . . . . . . . . . . . . . . . . . . . . . . . . . . . . . . . . . . . . . . . . . . . . . . . . . . . . . . . . . 16<br />
Table 5. Total employment generated in Connecticut from marine recreational fishing in 1998<br />
(all modes, all participants) . . . . . . . . . . . . . . . . . . . . . . . . . . . . . . . . . . . . . . . . . . . . . . . . . . . . . . . . . . . . . 17<br />
Table 6. Total economic impacts generated from marine recreational fishing trip expenditures<br />
in Connecticut, by resident status and mode in 1998 . . . . . . . . . . . . . . . . . . . . . . . . . . . . . . . . . . . . . . . . 18<br />
Table 7. Federal and state tax impacts generated from marine recreational fishing in Connecticut<br />
in 1998 (all modes, all participants) . . . . . . . . . . . . . . . . . . . . . . . . . . . . . . . . . . . . . . . . . . . . . . . . . . . . . . 19<br />
Table 8. Total economic impacts generated from marine recreational fishing expenditures<br />
in Delaware, by resident status in 1998 . . . . . . . . . . . . . . . . . . . . . . . . . . . . . . . . . . . . . . . . . . . . . . . . . . . . 20<br />
Table 9. Total sales/output generated in Delaware from marine recreational fishing in 1998<br />
(all participants) . . . . . . . . . . . . . . . . . . . . . . . . . . . . . . . . . . . . . . . . . . . . . . . . . . . . . . . . . . . . . . . . . . . . . . 21<br />
Table 10. Total income generated in Delaware from marine recreational fishing in 1998<br />
(all modes, all participants) . . . . . . . . . . . . . . . . . . . . . . . . . . . . . . . . . . . . . . . . . . . . . . . . . . . . . . . . . . . . . 22<br />
Table 11. Total employment generated in Delaware from marine recreational fishing in 1998<br />
(all modes, all participants) . . . . . . . . . . . . . . . . . . . . . . . . . . . . . . . . . . . . . . . . . . . . . . . . . . . . . . . . . . . . . 23<br />
Table 12. Total economic impacts generated from marine recreational fishing trip expenditures<br />
in Delaware, by resident status and mode in 1998 . . . . . . . . . . . . . . . . . . . . . . . . . . . . . . . . . . . . . . . . . . . 24<br />
Table 13. Federal and state tax impacts generated from marine recreational fishing in Delaware in 1998<br />
(all modes, all participants) . . . . . . . . . . . . . . . . . . . . . . . . . . . . . . . . . . . . . . . . . . . . . . . . . . . . . . . . . . . . . 25<br />
Table 14. Total economic impacts generated from marine recreational fishing expenditures in Maine,<br />
by resident status in 1998 . . . . . . . . . . . . . . . . . . . . . . . . . . . . . . . . . . . . . . . . . . . . . . . . . . . . . . . . . . . . . . . 26<br />
Table 15. Total sales/output generated in Maine from marine recreational fishing in 1998<br />
(all participants) . . . . . . . . . . . . . . . . . . . . . . . . . . . . . . . . . . . . . . . . . . . . . . . . . . . . . . . . . . . . . . . . . . . . . . 27<br />
Table 16. Total income generated in Maine from marine recreational fishing in 1998<br />
(all modes, all participants) . . . . . . . . . . . . . . . . . . . . . . . . . . . . . . . . . . . . . . . . . . . . . . . . . . . . . . . . . . . . . 28<br />
Table 17. Total employment generated in Maine from marine recreational fishing in 1998<br />
(all modes, all participants) . . . . . . . . . . . . . . . . . . . . . . . . . . . . . . . . . . . . . . . . . . . . . . . . . . . . . . . . . . . . . 29<br />
Table 18. Total economic impacts generated from marine recreational fishing trip expenditures<br />
in Maine, by resident status and mode in 1998 . . . . . . . . . . . . . . . . . . . . . . . . . . . . . . . . . . . . . . . . . . . . . 30<br />
Table 19. Federal and state tax impacts generated from marine recreational fishing in Maine<br />
in 1998 (all modes, all participants) . . . . . . . . . . . . . . . . . . . . . . . . . . . . . . . . . . . . . . . . . . . . . . . . . . . . . . 31<br />
Table 20. Total economic impacts generated from marine recreational fishing expenditures in Maryland,<br />
by resident status in 1998 . . . . . . . . . . . . . . . . . . . . . . . . . . . . . . . . . . . . . . . . . . . . . . . . . . . . . . . . . . . . . . . 32<br />
iv


