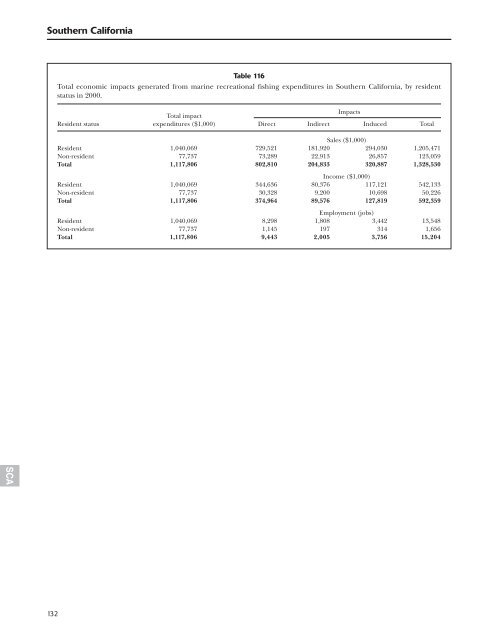
SCA Southern California 132 Table 116 Total economic impacts generated from marine recreational fishing expenditures in Southern California, by resident status in 2000. Total impact Impacts Resident status expenditures ($1,000) Direct <strong>In</strong>direct <strong>In</strong>duced Total Sales ($1,000) Resident 1,040,069 729,521 181,920 294,030 1,205,471 Non-resident 77,737 73,289 22,913 26,857 123,059 Total 1,117,806 802,810 204,833 320,887 1,328,530 <strong>In</strong>come ($1,000) Resident 1,040,069 344,636 80,376 117,121 542,133 Non-resident 77,737 30,328 9,200 10,698 50,226 Total 1,117,806 374,964 89,576 127,819 592,359 Employment (jobs) Resident 1,040,069 8,298 1,808 3,442 13,548 Non-resident 77,737 1,145 197 314 1,656 Total 1,117,806 9,443 2,005 3,756 15,204
Table 117 Total sales/output generated in Southern California from marine recreational fishing in 2000 (all participants). Total impact Impacts ($1,000) Expenditure category expenditures ($1,000) Direct <strong>In</strong>direct <strong>In</strong>duced Total Food Groceries 24,077 14,493 4,621 4,820 23,934 Restaurants 11,330 11,330 3,954 4,080 19,364 Private transportation 41,986 37,242 13,699 9,069 60,010 Lodging 14,555 14,555 4,382 5,238 24,175 Public transportation 34,797 34,797 10,124 14,698 59,619 Boat fuel 23,220 20,595 7,577 5,014 33,186 Party/charter fee 50,919 50,919 15,938 18,862 85,719 Access/boat launching 5,042 5,042 1,578 1,868 8,488 Equipment rental 7,502 7,502 2,348 2,781 12,631 Bait and ice 15,770 4,651 783 1,903 7,337 Total trip expenditures 229,198 201,126 65,004 68,333 334,463 Rods and reels 60,356 36,307 7,309 14,666 58,282 Other tackle 42,602 25,627 5,159 10,352 41,138 Gear 8,531 5,132 1,033 2,073 8,238 Camping equipment 4,030 3,426 883 1,201 5,510 Binoculars 1,281 897 208 355 1,460 Fishing clothing 4,105 2,587 767 917 4,271 Magazines 2,257 1,148 254 433 1,835 Club dues 1,597 1,597 633 712 2,942 License fees 22,124 22,124 2,721 10,398 35,243 Boat accessories 180,526 180,526 75,953 64,248 320,727 Boat purchases 168,204 32,342 5,527 14,285 52,154 Boat maintenance 125,489 125,489 15,435 58,976 199,900 Used boats purchased from dealers 7,780 7,780 957 3,657 12,394 New fishing vehicle 138,892 39,977 7,515 16,181 63,673 Fishing vehicle maintenance 96,070 96,070 11,817 45,150 153,037 Used fishing vehicles purchased from dealers 14,212 14,212 1,748 6,679 22,639 Vacation home 4,891 783 351 212 1,346 Vacation home maintenance 2,978 2,978 1,086 1,184 5,248 Fees for vehicle loans 1,088 1,088 192 331 1,611 Fees for boat loans 688 688 122 209 1,019 Fees for home loans 2 2 0 1 3 Property taxes for all vacation homes 611 611 75 287 973 Real estate commission 293 293 84 47 424 Total equipment and durable expenditures 888,608 601,684 139,829 252,554 994,067 Total all activity 1,117,806 802,810 204,833 320,887 1,328,530 133 SCA