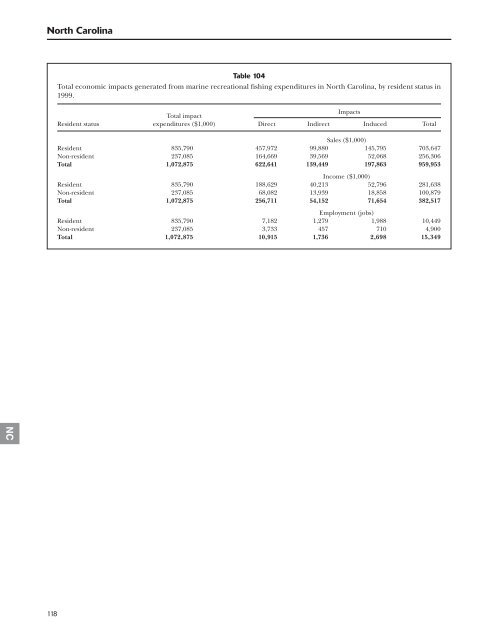
NC North Carolina 118 Table 104 Total economic impacts generated from marine recreational fishing expenditures in North Carolina, by resident status in 1999. Total impact Impacts Resident status expenditures ($1,000) Direct <strong>In</strong>direct <strong>In</strong>duced Total Sales ($1,000) Resident 835,790 457,972 99,880 145,795 703,647 Non-resident 237,085 164,669 39,569 52,068 256,306 Total 1,072,875 622,641 139,449 197,863 959,953 <strong>In</strong>come ($1,000) Resident 835,790 188,629 40,213 52,796 281,638 Non-resident 237,085 68,082 13,939 18,858 100,879 Total 1,072,875 256,711 54,152 71,654 382,517 Employment (jobs) Resident 835,790 7,182 1,279 1,988 10,449 Non-resident 237,085 3,733 457 710 4,900 Total 1,072,875 10,915 1,736 2,698 15,349
Table 105 Total sales/output generated in North Carolina from marine recreational fishing in 1999 (all participants). Total impact Impacts ($1,000) Expenditure category expenditures ($1,000) Direct <strong>In</strong>direct <strong>In</strong>duced Total Food Groceries 67,834 41,938 13,763 11,626 67,327 Restaurants 31,922 31,922 10,185 9,761 51,868 Private transportation 53,295 17,597 2,884 5,859 26,340 Lodging 114,829 114,829 29,442 35,897 180,168 Public transportation 1,253 1,253 285 450 1,988 Boat fuel 29,823 9,849 1,614 3,279 14,742 Party/charter fee 17,715 17,715 4,327 5,620 27,662 Access/boat launching 4,992 4,992 1,220 1,583 7,795 Equipment rental 561 561 137 177 875 Bait 20,950 9,076 1,139 2,930 13,145 Ice 6,949 4,726 946 1,684 7,356 Total trip expenditures 350,123 254,458 65,942 78,866 399,266 Rods and reels 132,425 69,611 8,985 24,545 103,141 Tackle and gear 59,767 31,417 4,055 11,078 46,550 Camping equipment 6,173 5,111 1,342 1,536 7,989 Binoculars 3,882 2,770 628 905 4,303 Fishing clothing 5,984 4,291 1,393 1,346 7,030 Processing/taxidermy 4,534 3,477 1,080 877 5,434 Magazines 3,533 1,654 300 548 2,502 Club dues 2,923 2,732 987 1,012 4,731 License fees 4,782 4,782 0 2,438 7,220 Boat expenses 99,937 99,937 25,539 30,037 155,513 New motor boat 139,682 28,873 4,755 10,222 43,850 New canoe or other nonmotor boat 356 73 12 26 111 Used boats purchased from dealers 3,729 3,729 363 1,380 5,472 Electronics 11,031 9,580 2,345 2,716 14,641 New fishing vehicle 137,631 53,618 11,188 15,647 80,453 Used fishing vehicles purchased from dealers 13,582 13,582 1,323 5,027 19,932 Vacation home 76,974 17,120 7,813 3,747 28,680 Fees for vehicle loans 779 779 106 184 1,069 Fees for boat loans 783 783 107 185 1,075 Fees for home loans 24 24 3 6 33 Property taxes for all vacation homes 9,622 9,622 0 4,906 14,528 Real estate commission 4,618 4,618 1,183 629 6,430 Total equipment and durable expenditures 722,752 368,183 73,507 118,997 560,687 Total all activity 1,072,875 622,641 139,449 197,863 959,953 119 NC