Fast&&Serious: a UML based metric for effort estimation
Fast&&Serious: a UML based metric for effort estimation
Fast&&Serious: a UML based metric for effort estimation

You also want an ePaper? Increase the reach of your titles
YUMPU automatically turns print PDFs into web optimized ePapers that Google loves.
Fast&&<strong>Serious</strong>: a <strong>UML</strong> <strong>based</strong> <strong>metric</strong> <strong>for</strong> ef<strong>for</strong>t <strong>estimation</strong><br />
Massimo Carbone and Giuseppe Santucci<br />
Dipartimento di In<strong>for</strong>matica e Sistemistica "Antonio Ruberti"<br />
Universita' degli studi di Roma "La Sapienza"<br />
Via Salaria 113, 00198-Rome, Italy<br />
santucci@dis.uniroma1.it<br />
Abstract<br />
In this paper we present a new method to estimate the size of a software project developed<br />
following the object-oriented paradigm.<br />
The method is designed to work with a set of <strong>UML</strong> diagrams describing the most important system<br />
features. We calculate the complexity of a system in terms of source lines of code. Outstanding<br />
features of our method are its flexibility (allowing <strong>estimation</strong> of projects described with few<br />
diagrams) and the capability to completely automate the entire counting process extracting<br />
in<strong>for</strong>mation about <strong>UML</strong> diagrams from Rational Rose 98 or 2000 petal files.<br />
Keyword: Object Oriented, size <strong>estimation</strong>, <strong>UML</strong>, Rational Rose<br />
1. Introduction<br />
Recently, many companies have started to introduce object-oriented (OO) technologies into their<br />
software development process.<br />
Consequently, many researchers have proposed several <strong>metric</strong>s suitable <strong>for</strong> measuring the size and<br />
the complexity of OO software, assessing old or introducing new <strong>metric</strong>s that capture exclusive<br />
concepts of the OO paradigm, such as inheritance, cohesion, and coupling. Traditional <strong>metric</strong>s such<br />
as Function Point (FP) are unsatisfactory <strong>for</strong> predicting software size, because of they are <strong>based</strong> on<br />
the procedural paradigm that separates data and functions while the OO paradigm combines them.<br />
OO <strong>metric</strong>s should catch the three canonical dimensions of OO software: functionality (behaviour<br />
of objects), amount of communication among objects, and percentage of reuse through inheritance.<br />
Our proposal, Fast&&<strong>Serious</strong>, combines several measures extracted by <strong>UML</strong> diagrams associating<br />
each class with a size <strong>estimation</strong>, in terms of source lines of code (SLOC).<br />
Fast&&<strong>Serious</strong> automatically extracts data about the project under analysis from a case tool by<br />
Rational Software: Rational Rose 2000. This tool is one of the most prevalent and widely spread<br />
case tool used in software development organizations <strong>for</strong> design specification using <strong>UML</strong> (Unified<br />
Modeling Language). After data about a project has been extracted by <strong>UML</strong> diagrams, we apply a<br />
measurement process that computes <strong>for</strong> each class a size <strong>estimation</strong>.<br />
1
According to the design level of detail, the process applies the Fast method or the <strong>Serious</strong> method.<br />
Fast method is useful during the early phases of the project, in which we want just a rough size<br />
<strong>estimation</strong>, because the entire project is not well defined.<br />
Otherwise, we use the <strong>Serious</strong> method that applies a more complex computation method to the<br />
extracted data and accomplishes the goal of estimating in a better way the size when we have more<br />
significant in<strong>for</strong>mation about the system.<br />
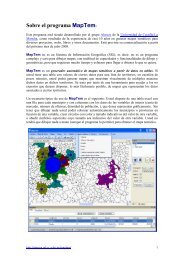
Our method produces an <strong>estimation</strong> of the software complexity terms of SLOC; <strong>for</strong> comparison<br />
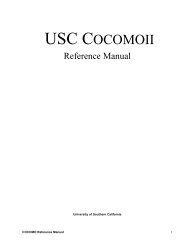
purpose we convert it in terms of traditional FP using a backfire index. Figure 1 shows two different<br />
ways to obtain the number of FP associated with a project; a standard way is to follow the IFPUG<br />
guide lines [11]; an alternative way is to use our completely automated method.<br />
Client <br />
Login<br />
Catalog<br />
User<br />
Sequence<br />
Diagram<br />
Administ rator<br />
Rational Rose<br />
2000 (*.m dl)<br />
Modify Request<br />
DBMS<br />
Use Case<br />
Dagram<br />
: Profess or<br />
: Client<br />
: D BM S<br />
login<br />
insert<br />
retrieve data<br />
Result<br />
Automated<br />
Analysis<br />
state 1<br />
state 1<br />
Start<br />
Start<br />
state 4<br />
state 4<br />
Person<br />
Student<br />
University<br />
Administrator works in<br />
(from Use Case View)<br />
Class<br />
Department<br />
Diagram<br />
Start<br />
Analisys<br />
Requirements<br />
state 2<br />
state 2<br />
[ guard condition ] / action ^event<br />
[ state guard 3condition<br />
] / action ^event Finish<br />
state 3<br />
Finish<br />
state 5 Stat e<br />
state 5 State<br />
Diagram<br />
Diagram<br />
Extract<br />
Data<br />
Standard<br />
Analysis<br />
Fast<br />
&&<br />
SLOC Backfire<br />
&&<br />
Index<br />
<strong>Serious</strong><br />
C<br />
Estimate FP O Ef<strong>for</strong>t<br />
O<br />
C<br />
O<br />
Function Effective FP M<br />
Duration<br />
Point<br />
O<br />
Analysis<br />
II II<br />
(IFPUG)<br />
Figure 1: two alternative ways to measure ef<strong>for</strong>t and duration<br />
The paper is structured in the following way: Section 2 describes related proposals and evidences<br />
our main contributions, Section 3 describes the Fast&&<strong>Serious</strong> method, Section 4 presents a case<br />
study. Some conclusions are drawn in Section 5.<br />
2. Related work<br />
Several proposals are available in the literature to estimate ef<strong>for</strong>t and duration of OO projects.<br />
A first group of them are extension of the FP method: Fetcke [1], Caldeira [2], Uemura [3] define a<br />
set of rules <strong>for</strong> mapping OO concepts into classical FP concepts. They map classes into logical files<br />
and methods or messages exchanged among objects into transactions. Whitmire [6] proposes a 3D<br />
Function Point, an extension of FP that measures data, control, and functionalities of a software<br />
project. 3D FP is a good <strong>metric</strong> to estimate productivity but less valuable <strong>for</strong> ef<strong>for</strong>t prediction.<br />
Specific OO concepts, such as inheritance and polymorphism are treated in a particular way.<br />
2
A second class of proposals do not follow the Function Point Analysis and define new complexity<br />
<strong>metric</strong>s: Minkiewicz [4] proposes a Predictive Object Point (POP) that computes a class complexity<br />
weighing its methods and using adjustment factors depending on the topology of the class diagram<br />
under analysis. Methods are weighted considering their type (i.e., constructor, destructor, modifier,<br />
selector, iterator) and complexity (low, average, high), giving a number of POPs in a similar way to<br />
traditional FP. Sneed [7] proposes Object Point as a measure of cost <strong>for</strong> OO system, different from<br />
FP. He treats Class Points (CP), Message Points (MP), and Process Point (PP) as a measure of the<br />
cost involved in class development, class integration and developer tests, and system test,<br />
respectively. Object Points are the sum of CP, MP, and PP. Finally, he adjusts this value including<br />
influencing and quality factors. Hastings [10] proposes the Vector Size Measure (VSM) and Vector<br />
Prediction Model (VPM) approach to software size measurement and ef<strong>for</strong>t <strong>estimation</strong> <strong>based</strong> on<br />
algebraic specification. VSM incorporates both functionality and problem complexity in a balanced<br />
and orthogonal manner. VPM receives VSM as input and produces an early <strong>estimation</strong> of the<br />
development ef<strong>for</strong>t.<br />
Other proposals, more close to our approach, exploit in<strong>for</strong>mation coming from <strong>UML</strong> diagrams<br />
assessing the estimated figures using subjective factors. Karner [5] proposes Use Case Point (UCP)<br />
as a method that exploits use case diagrams as a basis to estimate software development ef<strong>for</strong>t. In<br />
particular, the method classifies actors and use cases calculating their complexity and including<br />
subjective factors about overall system complexity and efficiency. Fishman [8] proposes Class<br />
Method Point to estimate the size <strong>for</strong> <strong>UML</strong>-derived software that is equivalent to FP but easier to<br />
learn, with an extension <strong>for</strong> complex internal functions. Sarferaz [9] presents the CEOS method to<br />
estimate the ef<strong>for</strong>t <strong>based</strong> on decomposing system (described by a class diagram) into manageable<br />
building blocks (component, subsystem, classes) and assessing the complexity <strong>for</strong> all their<br />
associated development cycles.<br />
Un<strong>for</strong>tunately the result of these <strong>metric</strong>s and methods are not directly comparable to other <strong>metric</strong>s,<br />
such as traditional FP or LOC. Moreover, the proposals more close to <strong>UML</strong> present three main<br />
drawbacks:<br />
1) few kinds (typically 1) of <strong>UML</strong> diagrams are used in each method;<br />
2) subjective parameters are extensively used;<br />
3) the human interaction is always required.<br />
Our proposal is, to the best of our knowledge, the first one attempting to estimate software<br />
complexity relating several <strong>UML</strong> diagrams in an integrated and completely automatic way.<br />
3. The Fast&&<strong>Serious</strong> method<br />
The philosophy underlying our method is <strong>based</strong> on the following considerations:<br />
3
1. The class diagram is the most important diagram;<br />
2. The class diagram level of detail is not always the same;<br />
3. The more is the in<strong>for</strong>mation associated with a class the more we can refine the <strong>estimation</strong>.<br />
According to such considerations, we developed a method that starts analyzing the class diagram<br />
and, on the basis of the diagram level of detail, applies a rough (Fast) or a detailed (<strong>Serious</strong>)<br />
<strong>estimation</strong> method. Figures got <strong>for</strong> the classes belonging to the class diagram are assessed through<br />
additional pieces of in<strong>for</strong>mation coming from other <strong>UML</strong> diagrams (i.e., use cases, sequence<br />
diagrams, and state diagrams). Moreover, in order to make our method totally automatic we<br />
considered only the data and the relationships stored within a Rational Rose file.<br />
In the following we detail our method.<br />
The Fast&&<strong>Serious</strong> measurement process consists of six major steps, some of them optional. Table<br />
1 lists them, where a * denotes an optional step. It is worth noting that in this section we introduce<br />
several <strong>for</strong>mulas whose constants have to be fixed per<strong>for</strong>ming exhaustive tests; in the following we<br />
use preliminary figures derived by some training experiments.<br />
Step Description<br />
1<br />
2<br />
3*<br />
4*<br />
Determine the type of method to apply: Fast or <strong>Serious</strong><br />
Calculate the complexity of each class (CP) in the class diagram under analysis.<br />
Assess the CPs by use case diagram.<br />
Assess the CPs by interaction diagrams.<br />
5* Assess the CPs by state diagrams.<br />
6<br />
Sum the CPs computed in phases 2, 3, 4, and 5 obtaining the number of SLOC of the whole system.<br />
Step 1: Fast or <strong>Serious</strong>?<br />
Table 1: the six steps of the Fast&&<strong>Serious</strong> method<br />
In this step we analyze the class diagram and we extract <strong>for</strong> each class the following <strong>metric</strong>s:<br />
DIT (Depth in Inheritance Tree)<br />
MPC (Number of Methods per Class)<br />
NAC (Number of Association per Class)<br />
PMS (Percentage of methods with signature).<br />
We use the average of PMS to choose the method to adopt in the next steps: if PMS>threshold then<br />
we use the Fast method, otherwise we use the <strong>Serious</strong> method. (In our first experiments we set<br />
threshold=70%)<br />
DIT, MPC, and NAC will be used during next steps.<br />
4
Step 2: Computing class complexity<br />
In this step we calculate a complexity value <strong>for</strong> each class. First we classify class attributes in three<br />
categories: Light, Heavy, and Imported. For a class c we consider even the public or protected<br />
attributes of each superclass of c.<br />
Table 2 helps to identify each kind of attribute and shows the associated weight as well.<br />
Complexity Definition Weight<br />
Light Simple attributes, such as integer, string, etc. 1<br />
Heavy<br />
Imported<br />
Complex attributes developed and tested yet, such<br />
as attributes in predefined packages.<br />
Complex attributes of a class not developed and<br />
not tested yet.<br />
Table 2: weighted attributes<br />
Let ListAttr be the set of classified couples .<br />
We calculate the number of State Point (SP) as:<br />
SP(<br />
c)<br />
=<br />
numAttr(<br />
c)<br />
∑<br />
i=<br />
1<br />
Weight(<br />
ListAttr )<br />
i<br />
(1.1)<br />
where numAttr(c) is the number of attributes belonging to class c.<br />
After that, we classify methods in two categories: Trivial and Substantial.<br />
With the Fast method we classify all methods as Substantial with one Imported attribute.<br />
With the <strong>Serious</strong> method we analyze the signatures of methods following the guidelines specified in<br />
Table 3.<br />
Complexity Definition<br />
Trivial (T)<br />
Substantial (S)<br />
Methods that have at least 80% Light attributes and that have not<br />
Imported attributes in the signature.<br />
Non Trivial methods<br />
Table 3: Methods Classification Rules<br />
Note: as ”default property” we assign one Imported attribute:<br />
• <strong>for</strong> all methods if we adopt Fast;<br />
• if a method has not signature;<br />
• if a class has not attributes.<br />
For each method m we calculate the Complexity of Method (CM) as:<br />
3<br />
5<br />
5
CM ( m)<br />
=<br />
( T S )<br />
⎛1<br />
⎜<br />
⎝1<br />
2<br />
3<br />
⎛ numLA⎞<br />
3⎞⎜<br />
⎟<br />
⎟⎜numHA⎟<br />
5⎠⎜<br />
⎟<br />
⎝ numIA ⎠<br />
where numLA, numHA, and numIA are the number of Light, Heavy, and Imported attributes in the<br />
signature of m, respectively. T and S stand <strong>for</strong> Trivial (T=1, S=0) and Substantial(T=0, S=1).<br />
We use CM to estimate the Behavioural Point (BP) of a class c as:<br />
BP(<br />
c)<br />
= [ 1 + numAss ( c)]<br />
numMet ( c )<br />
∑<br />
i=<br />
1<br />
CM ( m<br />
where numAss(c) is the number of associations of class c (NAC) and numMet(c) is the number of<br />
methods of class c.<br />
Finally we calculate, <strong>for</strong> each class, the number of Class Point (CP) as:<br />
CP ( c)<br />
= 2*<br />
SP(<br />
c)<br />
+ 3*<br />
BP(<br />
c)<br />
i<br />
(1.2)<br />
)<br />
(1.4)<br />
(1.3)<br />
CP(c) estimates the complexity of class c.<br />
Note that if a class c has no attributes and methods it is not included in the <strong>estimation</strong> process.<br />
Step 3: Assessing class complexity using Use Case Diagrams<br />
In this step we want to assess the CP associated with each class in the previous step using<br />
in<strong>for</strong>mation extracted from use case diagrams.<br />
We start associating a complexity value with each use case and each actor; after that we assess the<br />
CP(c) depending on the complexity of use cases and actors associated with the class c. We suppose<br />
that each use case uc is associated with a number of scenarios (numScen) (such as interaction<br />
diagrams). For each use case uc we calculate its complexity (COUC) as:<br />
COUC(<br />
uc)<br />
= 1+<br />
numScen(<br />
uc)<br />
∑ =<br />
i 1<br />
numMess<br />
where numMessi is the number of messages exchanged between all objects in scenarioi. ”1”is a<br />
constant useful <strong>for</strong> an uc that has not associated scenarios.<br />
For an actor a we calculate the Complexity Of Actor (COA) as:<br />
COA ( a)<br />
= numAss(<br />
a)<br />
* dit(<br />
a)<br />
where numAss(a) is the number of associations among a and the use cases (if the actor is a subactor<br />
in a hierarchy we add all the numAss of the parent actors); dit(a) is the Depth in Inheritance Tree<br />
(DIT) <strong>for</strong> a.<br />
6<br />
i<br />
(1.5)<br />
(1.6)
Now, <strong>for</strong> each class c in the Class Diagram we scan all the scenarios to find instances of objects<br />
belonging to c and <strong>for</strong> each instance, we store an association between c and the use case the<br />
scenario belongs to. In other words, we assume that an actor a is associated with a class c if there is<br />
a use case associated with c that communicates with a.<br />
For a class c we calculate the Complexity of Use Cases Associated with c (CUCA) and the<br />
Complexity of Actor Associated (CAA) with c as:<br />
CUCA(<br />
c)<br />
=<br />
numUC ( c)<br />
∑<br />
i=<br />
1<br />
COUC(<br />
uc )<br />
i<br />
(1.7)<br />
CAA(<br />
c)<br />
=<br />
numAct(<br />
c)<br />
∑<br />
i=<br />
1<br />
COA(<br />
a )<br />
where numUC(c) is the number of use case associated with c and numAct(c) is the number of actors<br />
associated with c.<br />
We use CUCA(c) and CAA(c) to assess the complexity of c finding in Table 4 the<br />
increment/decrement percentage <strong>for</strong> c.<br />
For example if CP(c)=1000 and CUCA(c)=8, CAA(c)=15 we obtain a new value <strong>for</strong><br />
CP(c)=1000+1000*9/100.<br />
CUCA(C)<br />
CAA(C)<br />
Step 4: Exploiting Interaction Diagrams<br />
0- 3 4-6 7-9 10-13 >13<br />
0-4 -10% +3% +5% +7% +20%<br />
5-10 -5% +2% +5% +10% +25%<br />
10-20 +6% +7% +9% +25% +30%<br />
Table 4: Use Case assessing percentage<br />
In step 3 we have illustrated the strategy to assess the CP of a class when new in<strong>for</strong>mation is<br />
available. In this step we focus our attention on interaction diagrams; in particular we refer to<br />
sequence diagrams.<br />
Then, <strong>for</strong> each sequence diagram sedj where j=1..nsed and nsed is the number of available sequence<br />
diagrams we look at the instances of c in each sedj calculating numMess(c, sedj) as the number of<br />
messages sent or received from instances of class c in sedj.<br />
Finally, let totMess(c) the sum of numMess(c, sedj) and let rsed(c) the ratio between the number of<br />
sequence diagrams in which c appears and nsed. Roughly speaking, totMess(c) gives an idea of the<br />
amount of communication involving class c, while rsed(c) corresponds to the percentage of code<br />
that communicates with such a class.<br />
These values are useful to find in Table 5 the percentage of increment/decrement <strong>for</strong> CP(c).<br />
i<br />
(1.8)<br />
7
totMess(c)<br />
rsed(c)<br />
Step 5: Exploiting State Diagrams<br />
0- 3 4-6 7-9 10-13 >13<br />
0-19% -10% -5% 5% 7% 12%<br />
20-49% -5% 2% 5% 10% 13%<br />
50-100% 4% 5% 7% 10% 15%<br />
Table 5: Interaction diagram assessing percentage<br />
A State Diagram std may be directly associated with a class c or to a method of c. We extract the<br />
following values from each std: the number of states as numSta(std) and the number of actions (i.e.,<br />
entry and exit actions associate with a state) as numAction(std).<br />
We assess CP(c) finding in Table 6 the percentage of increment/decrement computing the total<br />
amount of states totSta(c) and of actions totAction(c) <strong>for</strong> the class c.<br />
totSta(Std)<br />
totAction(Std)<br />
Step 6: Computing the whole system size<br />
0- 3 4-6 7-9 10-13 >13<br />
0-5 -8% -3% 3% 7% 12%<br />
6-10 -3% 2% 4% 10% 13%<br />
11-20 3% 4% 7% 12% 15%<br />
Table 6: State diagram assessing percentage<br />
So far, we have a CP(c) associated with each class in the class diagram CD; CP(c) is correlated with<br />
the size of c and of the whole system (in terms of java SLOCs) through the following <strong>for</strong>mulas:<br />
Size ( c)<br />
= 4 + 10*<br />
CP(<br />
c)<br />
0.<br />
7<br />
(1.9)<br />
Size ( System)<br />
Size(<br />
c )<br />
∑ ∈<br />
=<br />
ci<br />
CD<br />
i<br />
(1.10)<br />
We can obtain the number of FP associated with the Size(System) using the backfire index <strong>for</strong> the<br />
java language.<br />
4. A Simple Fast&&<strong>Serious</strong> Calculation<br />
We want now to explain how our proposal works through a simple example of a software project<br />
named “Web Bookstores”. This project was implemented using Java servlets.<br />
We have a Rational Rose 98 petal file which describes the design specification. In this file we have<br />
the following diagrams:<br />
• 1 Use Case Diagram;<br />
• 1 Class Diagram that describes the Data Base of the web-site.<br />
8
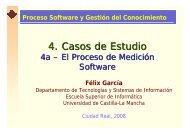
Step 1: looking at the Class Diagram (Main) shown in Figure 2 we can see that PMS=0%
Bookstore search_Author() Sub 1 3<br />
Bookstore search_Topic() Sub 1 3<br />
Bookstore search_Title() Sub 1 3<br />
Table 8: note the use of the “default property”<br />
Finally we calculate a value of complexity <strong>for</strong> all the 5 classes, using (1.3) and (1.4).<br />
Table 9 shows the final result of Step 2.<br />
Step 3:<br />
Class Name SP BP CP<br />
Author 5 1 13<br />
Topic 2 1 7<br />
Bookstore 2 28 88<br />
Nearby 11 1 25<br />
Book 14 3 37<br />
Table 9: Final report of Step 2.<br />
In this step we analyze the use case diagram shown in Figure 3.<br />
0..n<br />
execute<br />
search<br />
1..1<br />
Client<br />
Availability<br />
<br />
1..1<br />
visualize<br />
0..n<br />
search_Author<br />
search_Title<br />
<br />
BookReport<br />
<br />
Figure 3: The use case diagram<br />
search_Topic<br />
BookInfo<br />
AuthorInfo<br />
The present use cases are very simple and so then there are not scenarios associated with one of<br />
them. For the use cases we apply (1.5) and we obtain the same value (COUC=1) <strong>for</strong> each of the 8<br />
use cases. There is one actor “Client” with COA(Client)=2 because of this actor communicates with<br />
10
2 use cases. Looking at the class diagram we can infer the association between use cases and classes<br />
shown in Table 10.<br />
Class Name Associated use cases. CUCA COA inc/dec<br />
Author AuthorInfo,<br />
BookInfo<br />
2 0 -10%<br />
Topic BookInfo 1 0 -10%<br />
Bookstore Search,<br />
Search_Topic,<br />
Search_Author,<br />
Search_Title<br />
4 4 +3%<br />
Nearby Availability 1 0 -10%<br />
Book BookInfo,<br />
BookReport<br />
2 2 -10%<br />
Table 10:Association among use cases and actors<br />
Note: In this table "inc/dec" are derived from Table 4.<br />
The news CP(c) are listed in Table 11:<br />
Class Name CP(C ) old CP(C) new<br />
Author 13 11.7<br />
Topic 7 6.3<br />
Bookstore 88 90.64<br />
Nearby 25 22.5<br />
Book 37 33.3<br />
Table 11:Final report of Step 3<br />
Step 4 and 5: There are not other diagrams so we skip these two steps.<br />
Step 6: Finally we apply (1.9) to obtain the size of each class. The SLOC estimated <strong>for</strong> the classes<br />
and <strong>for</strong> the System are shown in Table 12:<br />
Class Name Size<br />
Author 60<br />
Topic 40<br />
Bookstore 238<br />
Nearby 92<br />
Book 120<br />
Size(System) 550<br />
Table 12:Size in java SLOC <strong>for</strong> each class<br />
The project was developed using 608 SLOC vs the 550 estimated; then the error is about 9.5%.<br />
11
5.Conclusion and future work<br />
In this paper we present a novel method <strong>for</strong> estimating OO software projects size exploiting <strong>UML</strong><br />
diagrams. The main features of our approach are:<br />
1. the method can be totally automated;<br />
2. it exploits all the principal <strong>UML</strong> diagrams in its <strong>estimation</strong> process;<br />
3. its output is in terms of SLOC, so can be compared with well known standard like FP.<br />
In this very moment, we are setting an experiment to fix the <strong>for</strong>mulas' constants we introduced in<br />
the method. The experiment will be carried out together with the Ericsson Lab Italy that will<br />
provide us with a large set of homogeneous Rational Rose diagrams plus the actual class size in<br />
terms of java SLOC.<br />
6. References<br />
[1] T. Fetcke, A. Abran, T. H. Nguyen. “Mapping the OO-Jacobson Approach into Function Point<br />
Analysis”. Proceedings of TOOLS-23’97, Santa Barbara, CA. IEEE.<br />
[2] G. Caldiera, G. Antoniol, C. Lokan, R. Fiutem. ”Definition and Experimental Evaluation of<br />
Function Points <strong>for</strong> Object-Oriented System”. Proceedings of 5 th International Software Metrics<br />
Symposium, pp. 167-178. Bethesda Maryland, November 1998. IEEE.<br />
[3] T. Uemura, S. Kusumoto, K. Inoue. “Function Point Measurement Tool <strong>for</strong> <strong>UML</strong> Design<br />
Specification”. Graduate School of Engineering Science, Osaka University.<br />
[4] A. Minkiewicz. ”Measuring Object-Oriented Software with Predictive Object Points”. ASM’97,<br />
Atlanta, October 1997.<br />
[5] G. Karner. ”Resource Estimation <strong>for</strong> Objectory Projects”. Objectory Systems, 1993.<br />
[6] Whitmire, Scott. “3-D Function Points: Applications <strong>for</strong> Object-Orented Software in<br />
Applications of Software Management Conference (1996)<br />
[7] H. Sneed. Estimating the Costs of Object-Oriented Software. Proceedings of Software Cost<br />
Estimation Seminar, System Engineering Ltd. , Durham, UK, March 1995.<br />
[8] L. Fischman, K. McRitchie. “A Size Metric For <strong>UML</strong>-Derived Software”<br />
[9] S. Sarferaz, W. Hesse. ”CEOS-A Cost Estimation Method <strong>for</strong> Evolutionary, Object-Oriented<br />
Software Development”. Proceedings of New Approaches in Software Measurement, 10 th<br />
International Workshop, IWSM 2000, Berlin, Germany, October 2000.<br />
[10] T. E. Hastings, A. S. M. Sajeev. “A Vector-Based Approach to Software Size Measurement<br />
and Ef<strong>for</strong>t Estimation”. IEEE Transactions on Software Engineering, vol. 27, NO. 4, April 2001.<br />
[11] Interantional Function Point Users Group "Function Point Counting Practices Manual -<br />
Release 4.1", 1999.<br />
12