WMO/WCRP update on Sea-Level Rise
WMO/WCRP update on Sea-Level Rise
WMO/WCRP update on Sea-Level Rise
Create successful ePaper yourself
Turn your PDF publications into a flip-book with our unique Google optimized e-Paper software.
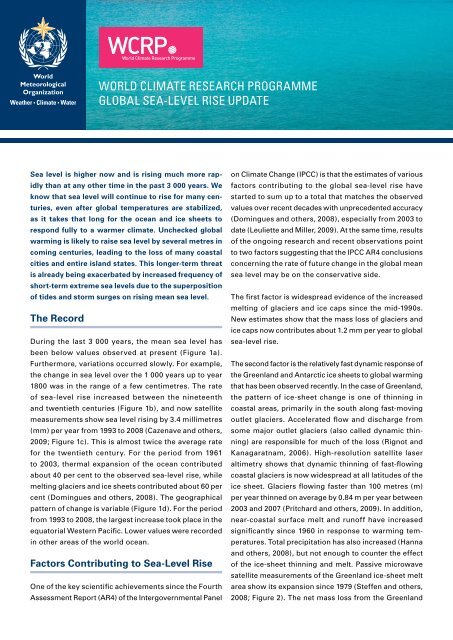
<strong>Sea</strong> level is higher now and is rising much more rap-<br />
idly than at any other time in the past 3 000 years. We<br />
know that sea level will c<strong>on</strong>tinue to rise for many cen-<br />
turies, even after global temperatures are stabilized,<br />
as it takes that l<strong>on</strong>g for the ocean and ice sheets to<br />
resp<strong>on</strong>d fully to a warmer climate. Unchecked global<br />
warming is likely to raise sea level by several metres in<br />
coming centuries, leading to the loss of many coastal<br />
cities and entire island states. This l<strong>on</strong>ger-term threat<br />
is already being exacerbated by increased frequency of<br />
short-term extreme sea levels due to the superpositi<strong>on</strong><br />
of tides and storm surges <strong>on</strong> rising mean sea level.<br />
The Record<br />
WORLD CLIMATE<br />
WOrld ClimaTE rESEarCH PrOGrammE<br />
RESEARCH<br />
GlOBal PROGRAMME SEa-lEvEl riSE UPdaTE<br />
During the last 3 000 years, the mean sea level has<br />
been below values observed at present (Figure 1a).<br />
Furthermore, variati<strong>on</strong>s occurred slowly. For example,<br />
the change in sea level over the 1 000 years up to year<br />
1800 was in the range of a few centimetres. The rate<br />
of sea-level rise increased between the nineteenth<br />
and twentieth centuries (Figure 1b), and now satellite<br />
measurements show sea level rising by 3.4 millimetres<br />
(mm) per year from 1993 to 2008 (Cazenave and others,<br />
2009; Figure 1c). This is almost twice the average rate<br />
for the twentieth century. For the period from 1961<br />
to 2003, thermal expansi<strong>on</strong> of the ocean c<strong>on</strong>tributed<br />
about 40 per cent to the observed sea-level rise, while<br />
melting glaciers and ice sheets c<strong>on</strong>tributed about 60 per<br />
cent (Domingues and others, 2008). The geographical<br />
pattern of change is variable (Figure 1d). For the period<br />
from 1993 to 2008, the largest increase took place in the<br />
equatorial Western Pacific. Lower values were recorded<br />
in other areas of the world ocean.<br />
Factors C<strong>on</strong>tributing to <strong>Sea</strong>-<strong>Level</strong> <strong>Rise</strong><br />
One of the key scientific achievements since the Fourth<br />
Assessment Report (AR4) of the Intergovernmental Panel<br />
<strong>on</strong> Climate Change (IPCC) is that the estimates of various<br />
factors c<strong>on</strong>tributing to the global sea-level rise have<br />
started to sum up to a total that matches the observed<br />
values over recent decades with unprecedented accuracy<br />
(Domingues and others, 2008), especially from 2003 to<br />
date (Leuliette and Miller, 2009). At the same time, results<br />
of the <strong>on</strong>going research and recent observati<strong>on</strong>s point<br />
to two factors suggesting that the IPCC AR4 c<strong>on</strong>clusi<strong>on</strong>s<br />
c<strong>on</strong>cerning the rate of future change in the global mean<br />
sea level may be <strong>on</strong> the c<strong>on</strong>servative side.<br />
The first factor is widespread evidence of the increased<br />
melting of glaciers and ice caps since the mid-1990s.<br />
New estimates show that the mass loss of glaciers and<br />
ice caps now c<strong>on</strong>tributes about 1.2 mm per year to global<br />
sea-level rise.<br />
The sec<strong>on</strong>d factor is the relatively fast dynamic resp<strong>on</strong>se of<br />
the Greenland and Antarctic ice sheets to global warming<br />
that has been observed recently. In the case of Greenland,<br />
the pattern of ice-sheet change is <strong>on</strong>e of thinning in<br />
coastal areas, primarily in the south al<strong>on</strong>g fast-moving<br />
outlet glaciers. Accelerated flow and discharge from<br />
some major outlet glaciers (also called dynamic thinning)<br />
are resp<strong>on</strong>sible for much of the loss (Rignot and<br />
Kanagaratnam, 2006). High-resoluti<strong>on</strong> satellite laser<br />
altimetry shows that dynamic thinning of fast-flowing<br />
coastal glaciers is now widespread at all latitudes of the<br />
ice sheet. Glaciers flowing faster than 100 metres (m)<br />
per year thinned <strong>on</strong> average by 0.84 m per year between<br />
2003 and 2007 (Pritchard and others, 2009). In additi<strong>on</strong>,<br />
near-coastal surface melt and runoff have increased<br />
significantly since 1960 in resp<strong>on</strong>se to warming temperatures.<br />
Total precipitati<strong>on</strong> has also increased (Hanna<br />
and others, 2008), but not enough to counter the effect<br />
of the ice-sheet thinning and melt. Passive microwave<br />
satellite measurements of the Greenland ice-sheet melt<br />
area show its expansi<strong>on</strong> since 1979 (Steffen and others,<br />
2008; Figure 2). The net mass loss from the Greenland
a b<br />
c d<br />
ice sheet has accelerated since the mid-1990s and is<br />
now c<strong>on</strong>tributing up to 0.7 mm per year to sea-level rise<br />
(Velicogna, 2009).<br />
Antarctica is also losing ice mass at an accelerating rate,<br />
mostly from the West Antarctic ice sheet due to increased<br />
ice flow, and this c<strong>on</strong>tributes to sea-level rise at a rate<br />
nearly equal to that of Greenland (Velicogna, 2009).<br />
Narrow fast-moving ice streams in East Antarctica are<br />
now also c<strong>on</strong>tributing to the mass loss of the ice c<strong>on</strong>tinent<br />
(Pritchard and others, 2009).<br />
The Projecti<strong>on</strong>s<br />
For the complete range of scenarios outlined in the Special<br />
Report <strong>on</strong> Emissi<strong>on</strong>s Scenarios in IPCC AR4, the expected<br />
EQ<br />
30°<br />
30°<br />
60°N<br />
60°S<br />
sea-level rise for 2090-2099 relative to 1980-1999 values<br />
was estimated to be between 18 and 59 centimetres (cm)<br />
(Figure 3a). An additi<strong>on</strong>al allowance of 0 to 20 cm was<br />
given to account for a dynamic resp<strong>on</strong>se of the ice sheets.<br />
It is worth noting that IPCC warned that there could be<br />
a larger ice-sheet c<strong>on</strong>tributi<strong>on</strong>. The data from coastal<br />
tide gauges corroborate the recent satellite estimates<br />
of sea-level change and show that the current rate of<br />
sea-level rise corresp<strong>on</strong>ds to the upper limit of model<br />
projecti<strong>on</strong>s given in the IPCC Assessments in 2001 and<br />
2007 (Figure 3b).<br />
1993 to 2008<br />
90°E 180° 90°W 0°<br />
−15 −10 −5 0 5 10 15<br />
mm/year<br />
Figure 1: (a) <strong>Sea</strong>-level changes from 1000 B.C. to A.D. 2000 inferred from a range of sources (CSIRO, http://www.cmar.csiro.<br />
au/sealevel); (b) global mean sea level from 1870 to 2008, based <strong>on</strong> in situ measurements with <strong>on</strong>e standard deviati<strong>on</strong> error<br />
estimates, is in red (Church and White, 2006) and the Topex/Poseid<strong>on</strong>/Jas<strong>on</strong>-1 and Jas<strong>on</strong>-2 satellite altimeter global mean<br />
sea level, based <strong>on</strong> the same standard processing from 1993 to 2008, is in black. Both series have been set to a comm<strong>on</strong><br />
value at the start of the altimeter record in 1993; (c) altimetric estimates of sea-level rise from 1993 to the present with the<br />
seas<strong>on</strong>al signal removed from this time series (CSIRO); (d) geographical pattern of 1993–2008 sea-level trends.<br />
The new scientific evidence discussed above suggests<br />
that the future ice-sheet c<strong>on</strong>tributi<strong>on</strong> to sea-level rise<br />
may exceed the allowance of 20 cm given in IPCC AR4.<br />
For example, simple statistical models, such as those
described in Hort<strong>on</strong> and others (2008) and Rahmstorf<br />
(2007), based <strong>on</strong> relati<strong>on</strong>s between observed sea levels<br />
and temperatures, predict sea-level rise for 2100 of up<br />
to 1.4 m above the 1990 value.<br />
Main remaining scientific challenges<br />
Significant progress has been achieved by science in<br />
quantifying and explaining the observed sea-level change<br />
in recent decades. The main challenge for climate science<br />
Global Mean <strong>Sea</strong> level (m)<br />
1.0<br />
0.8<br />
0.6<br />
0.4<br />
0.2<br />
Larger values<br />
cannot be excluded<br />
Additi<strong>on</strong>al c<strong>on</strong>tributi<strong>on</strong>s<br />
from potential ice−sheet<br />
dynamic processes<br />
Model<br />
projecti<strong>on</strong>s<br />
0.0<br />
1990 2000 2010 2020 2030 2040 2050 2060 2070 2080 2090 2100<br />
Year<br />
Figure 2: The total melt area of the Greenland ice sheet<br />
increased by 30 per cent between 1979 and 2008, based<br />
<strong>on</strong> passive microwave satellite data, with the most extreme<br />
melt in 2007. In general, 33–55 per cent of the total mass<br />
loss from the Greenland ice sheet is caused by surface<br />
melt and runoff. For 2007, the area experiencing melt was<br />
around 50 per cent of the total ice-sheet area. The low melt<br />
year in 1992 was caused by volcanic aerosols from Mount<br />
Pinatubo, which resulted in a short-lived global cooling<br />
(Steffen and others, 2008).<br />
now is to address the uncertainties in the projecti<strong>on</strong> of<br />
future sea-level changes due to recently discovered proc-<br />
esses in the Greenland and Antarctic ice sheets. A joint<br />
Task Group <strong>on</strong> <strong>Sea</strong>-<strong>Level</strong> Variability and Change was<br />
established by the World Climate Research Programme<br />
and Intergovernmental Oceanographic Commissi<strong>on</strong> of<br />
UNESCO to further improve our ability to m<strong>on</strong>itor, explain<br />
and predict global and regi<strong>on</strong>al sea level and all envir<strong>on</strong>-<br />
mental factors related to it, and to use this informati<strong>on</strong><br />
for informed decisi<strong>on</strong>-making.<br />
Figure 3: (a) <strong>Sea</strong>-level projecti<strong>on</strong>s in the IPCC Third Assessment Report (TAR) shown in shading and lines and AR4<br />
shown at the bar plotted at 2095, with their range of uncertainties shown as a pink bar depicting the possible range of<br />
c<strong>on</strong>tributi<strong>on</strong>s from thermal expansi<strong>on</strong> of the ocean waters and melting of glaciers; the red bar corresp<strong>on</strong>ds to additi<strong>on</strong>al<br />
rise due to instabilities of ice sheets (Church and others, 2010); (b) observed and projected (starting for the year 1990)<br />
sea level: red line – coastal stati<strong>on</strong>s; blue line – altimetric data; dashed black lines and the grey area and various dashed<br />
lines within it – range of model-based sea-level rise projecti<strong>on</strong>s from Rahmstorf and others (2007).
References<br />
Cazenave, A., K. DoMinh, S. Guinehut, E. Berthier, W.<br />
Llovel, G. Ramillien, M. Ablain and G. Larnicol, 2009.<br />
<strong>Sea</strong> level budget over 2003–2008: A reevaluati<strong>on</strong> from<br />
GRACE space gravimetry, satellite altimetry and ARGO.<br />
Global and Planetary Change, 65:83–88.<br />
Church, J.A., and N.J. White, 2006. A 20th century accel-<br />
erati<strong>on</strong> in global sea-level rise. Geophysical Research<br />
Letters, 33:L01602, doi:10.1029/2005GL024826.<br />
Church, J.A., P.L. Woodworth, T. Aarup and W.S. Wils<strong>on</strong><br />
(eds), 2010. Understanding <strong>Sea</strong>-level <strong>Rise</strong> and Variability.<br />
L<strong>on</strong>d<strong>on</strong>, Blackwell Publishing.<br />
Comm<strong>on</strong>wealth Scientific and Industrial Research<br />
Organizati<strong>on</strong> (CSIRO) Marine and Atmospheric Research<br />
(CMAR). <strong>Sea</strong> <strong>Level</strong> <strong>Rise</strong>. Understanding the past –<br />
Improving projecti<strong>on</strong>s for the future. http://www.cmar.<br />
csiro.au/sealevel/index.html.<br />
Domingues, C.M., J.A. Church, N.J. White, P.J. Gleckler,<br />
S.E. Wijffels, P.M. Barker and J.R. Dunn, 2008. Improved<br />
estimates of upper-ocean warming and multi-decadal<br />
sea-level rise. Nature, 453:1090-1093 (19 June 2008),<br />
doi:10.1038/nature07080.<br />
Hanna, E., P. Huybrechts, K. Steffen, J. Cappelen, R.<br />
Huff, C. Shuman, T. Irvine-Fynn, S. Wise and M. Griffiths,<br />
2008. Increased runoff from melt from the Greenland Ice<br />
Sheet: a resp<strong>on</strong>se to global warming. Journal of Climate,<br />
21:331-341.<br />
World Meteorological Organizati<strong>on</strong><br />
Communicati<strong>on</strong>s and Public Affairs Office<br />
Tel.: +41 (0) 22 730 83 14 – Fax: +41 (0) 22 730 80 27<br />
E-mail: cpa@wmo.int<br />
7 bis, avenue de la Paix – P.O. Box 2300 – CH 1211 Geneva 2 – Switzerland<br />
www.wmo.int<br />
Hort<strong>on</strong>, R., C. Herweijer, C. Rosenzweig, J. Liu, V. Gornitz<br />
and A.C. Ruane, 2008. <strong>Sea</strong> level rise projecti<strong>on</strong>s for<br />
current generati<strong>on</strong> CGCMs based <strong>on</strong> the semi-empiri-<br />
cal method. Geophysical Research Letters, 35:L02725,<br />
doi:10.1029/2007GL032468.<br />
Leuliette, E. and L. Miller, 2009. Closing the sea level budget<br />
with altimetry, Argo and GRACE. Geophysical Research<br />
Letters, 36:L04608, doi:10.1029/2008GL036010.<br />
Pritchard, H.D., R.J. Arthern, D.G. Vaughan and L.A. Edwards,<br />
2009 (in press). Extensive dynamic thinning <strong>on</strong> the margins<br />
of the Greenland and Antarctic ice sheets. Nature.<br />
Rahmstorf, S., 2007. A semi-empirical approach to future<br />
sea-level rise. Science, 315:368-370.<br />
Rahmstorf, S., A. Cazenave, J.A. Church, J.E. Hansen, R.<br />
Keeling, D.E. Parker and R.C.J. Somerville, 2007. Recent<br />
climate observati<strong>on</strong>s compared to projecti<strong>on</strong>s. Science,<br />
316(5825):709, doi:10.1126/science.1136843.<br />
Rignot, E. and P. Kanagaratnam, 2006. Changes in the<br />
velocity structure of the Greenland Ice Sheet. Science,<br />
311:986-990.<br />
Steffen, K., P.U. Clark, J.G. Cogley, D. Holland, S. Marshall,<br />
E. Rignot and R. Thomas, 2008. Rapid changes in glaciers<br />
and ice sheets and their impacts <strong>on</strong> sea level. In Abrupt<br />
Climate Change: A Report by the U.S. Climate Change<br />
Science Program and the Subcommittee <strong>on</strong> Global Change<br />
Research, Rest<strong>on</strong>, Virginia, United States Geological<br />
Survey. pp. 60– 142.


