A systematic review of the effectiveness of adalimumab
A systematic review of the effectiveness of adalimumab A systematic review of the effectiveness of adalimumab
82 Health economics disability. Data for non-responders were based on an observational study by Young and colleagues. 46 This study does not report specifically on DMARD responders and non-responders and it is unclear how these data were obtained. In addition, the study is a hospital-based study of early RA patients where data were collected annually. As HAQ is especially labile in this population, single annual measurements have limited reliability. Patient HAQ scores are updated every 6 months and the mean level of HAQ improvement was obtained from clinical trial data and published literature. HAQ scores are converted to QALYs by using regression of HAQ against utility from trial data. The relationship between HAQ and utility scores was given as U = 0.76 – (0.28 × HAQ) + 0.05 × Female. This relationship was derived from analysis of Health Utility Index (HUI) 3 data obtained from the adalimumab trials. Data on the incidence of mild, moderate and serious adverse events were estimated from an observational study. The same study and a review provided data on long-term withdrawal; the limitations of using data from Geborek 171 are discussed above. Mortality risk for patients with RA was adjusted by HAQ score and Gompertz models were fitted, with the minimum age set at 50 years. The 6-monthly hazard rate was calculated in the model for patients’ age and midpoint HAQ score during each therapy line. This simplification may be acceptable; however, exploratory analyses would be worthwhile to test this assumption. Resource use and costs were derived from published data, costing BSR guidelines and expert clinical opinion. In addition, some healthcare resource use was estimated based on HAQ-DI scores. Costs and benefits were discounted at 6% and 1.5%, respectively. Costs were calculated from a healthcare perspective. Both simple one-way and probabilistic sensitivity analyses were undertaken. The base-case results using ACR50 suggest that adalimumab is cost-effective as fourth line therapy, TABLE 27 Treatment sequences: etanercept with an ICER of £17,860. In total, 32 one-way sensitivity analyses were conducted, all giving ICERs under £30,000 per QALY. Probabilistic sensitivity analysis showed adalimumab in combination with methotrexate to have a 99.8% probability of being cost-effective at a willingnessto-pay threshold of £30,000 per QALY. Comparison with etanercept gave a lower ICER of £14,388 and a 96% probability of being costeffective at £30,000 per QALY. Secondary analyses were also reported. Using an ACR20 response the cost per QALY for adalimumab plus methotrexate was £19,251. Costeffectiveness ratios at different lines of entry were also explored for ACR50 and ACR20. The ICERs for ACR50 are: ● first line: £19,095 per QALY ● second line: £18,166 per QALY ● third line: £18,479 per QALY. The ICERs for ACR20 are: ● first line: £21,228 per QALY ● second line: £19,794 per QALY ● third line: £19,596 per QALY. The study concluded that adalimumab “should be considered cost-effective when compared against conventional DMARDs” and on the basis of this “the cost-effectiveness of adalimumab is very similar to that of etanercept and infliximab”. Wyeth submission (etanercept) A sequential model was developed whereby a simulated patient receives a given treatment until DMARD switching occurs as a result of either failure of effectiveness or SAEs. The main treatment sequences considered are shown in Table 27, but others were explored and are not presented in the report. The submission indicates that “the aim of the economic model and treatment sequences was to demonstrate that etanercept + MTX is a costeffective intervention when used earlier in the Therapy line Treatment sequence (1st line) Comparator sequence First Etan + MTX MTX Second MTX SSZ Third SSZ LEF Fourth LEF GST Fifth GST DMARD (non-specified) Sixth Salvage therapy Salvage therapy
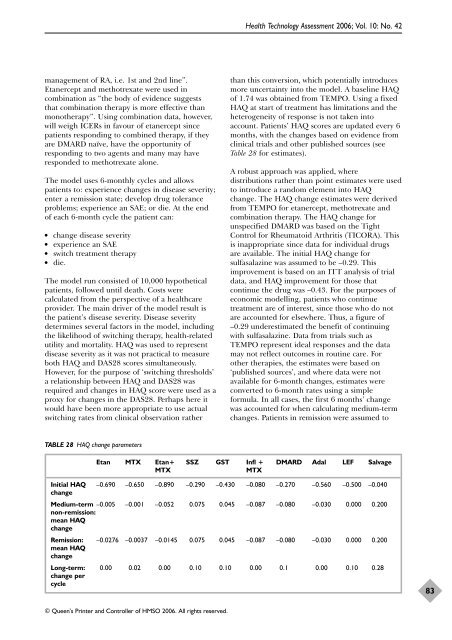
management of RA, i.e. 1st and 2nd line”. Etanercept and methotrexate were used in combination as “the body of evidence suggests that combination therapy is more effective than monotherapy”. Using combination data, however, will weigh ICERs in favour of etanercept since patients responding to combined therapy, if they are DMARD naïve, have the opportunity of responding to two agents and many may have responded to methotrexate alone. The model uses 6-monthly cycles and allows patients to: experience changes in disease severity; enter a remission state; develop drug tolerance problems; experience an SAE; or die. At the end of each 6-month cycle the patient can: ● change disease severity ● experience an SAE ● switch treatment therapy ● die. The model run consisted of 10,000 hypothetical patients, followed until death. Costs were calculated from the perspective of a healthcare provider. The main driver of the model result is the patient’s disease severity. Disease severity determines several factors in the model, including the likelihood of switching therapy, health-related utility and mortality. HAQ was used to represent disease severity as it was not practical to measure both HAQ and DAS28 scores simultaneously. However, for the purpose of ‘switching thresholds’ a relationship between HAQ and DAS28 was required and changes in HAQ score were used as a proxy for changes in the DAS28. Perhaps here it would have been more appropriate to use actual switching rates from clinical observation rather TABLE 28 HAQ change parameters © Queen’s Printer and Controller of HMSO 2006. All rights reserved. Health Technology Assessment 2006; Vol. 10: No. 42 than this conversion, which potentially introduces more uncertainty into the model. A baseline HAQ of 1.74 was obtained from TEMPO. Using a fixed HAQ at start of treatment has limitations and the heterogeneity of response is not taken into account. Patients’ HAQ scores are updated every 6 months, with the changes based on evidence from clinical trials and other published sources (see Table 28 for estimates). A robust approach was applied, where distributions rather than point estimates were used to introduce a random element into HAQ change. The HAQ change estimates were derived from TEMPO for etanercept, methotrexate and combination therapy. The HAQ change for unspecified DMARD was based on the Tight Control for Rheumatoid Arthritis (TICORA). This is inappropriate since data for individual drugs are available. The initial HAQ change for sulfasalazine was assumed to be –0.29. This improvement is based on an ITT analysis of trial data, and HAQ improvement for those that continue the drug was –0.43. For the purposes of economic modelling, patients who continue treatment are of interest, since those who do not are accounted for elsewhere. Thus, a figure of –0.29 underestimated the benefit of continuing with sulfasalazine. Data from trials such as TEMPO represent ideal responses and the data may not reflect outcomes in routine care. For other therapies, the estimates were based on ‘published sources’, and where data were not available for 6-month changes, estimates were converted to 6-month rates using a simple formula. In all cases, the first 6 months’ change was accounted for when calculating medium-term changes. Patients in remission were assumed to Etan MTX Etan+ SSZ GST Infl + DMARD Adal LEF Salvage MTX MTX Initial HAQ change –0.690 –0.650 –0.890 –0.290 –0.430 –0.080 –0.270 –0.560 –0.500 –0.040 Medium-term –0.005 non-remission: mean HAQ change –0.001 –0.052 0.075 0.045 –0.087 –0.080 –0.030 0.000 0.200 Remission: mean HAQ change –0.0276 –0.0037 –0.0145 0.075 0.045 –0.087 –0.080 –0.030 0.000 0.200 Long-term: 0.00 0.02 0.00 0.10 0.10 0.00 0.1 0.00 0.10 0.28 change per cycle 83
- Page 48 and 49: 32 TABLE 6 Effectiveness Descriptio
- Page 50 and 51: 34 TABLE 6 Effectiveness Descriptio
- Page 52 and 53: 36 TABLE 7 Effectiveness Quality of
- Page 54 and 55: 38 Effectiveness etanercept trials.
- Page 56 and 57: 40 Effectiveness TABLE 9 Summary of
- Page 58 and 59: 42 Effectiveness Review: Etanercept
- Page 60 and 61: 44 Effectiveness Review: Etanercept
- Page 62 and 63: 46 Effectiveness Review: Etanercept
- Page 64 and 65: 48 Effectiveness Review: Etanercept
- Page 66 and 67: 50 Effectiveness Review: Etanercept
- Page 68 and 69: 52 Effectiveness Review: Etanercept
- Page 70 and 71: 54 Effectiveness TABLE 11 Summary o
- Page 72 and 73: 56 TABLE 12 Description of included
- Page 74 and 75: 58 TABLE 13 Quality of included RCT
- Page 76 and 77: 60 Effectiveness per week and escal
- Page 78 and 79: 62 Effectiveness significant advant
- Page 80 and 81: 64 Effectiveness Review: Infliximab
- Page 82 and 83: 66 Effectiveness Review: Infliximab
- Page 84 and 85: 68 Effectiveness FIGURE 44 Malignan
- Page 86 and 87: 70 TABLE 17 Effectiveness Summary o
- Page 89 and 90: Summary of review of existing econo
- Page 91 and 92: TABLE 20 Summary of published ICERs
- Page 93 and 94: TABLE 21 Published etanercept econo
- Page 95 and 96: TABLE 23 Published economic analyse
- Page 97: TABLE 25 Treatment sequences: adali
- Page 101 and 102: To estimate the long-term consequen
- Page 103 and 104: TABLE 32 TNF inhibitors as last act
- Page 105 and 106: TABLE 34 Basic structure of the mod
- Page 107 and 108: een quit on grounds of toxicity, ad
- Page 109 and 110: TABLE 39 Strategy set: adalimumab a
- Page 111 and 112: TABLE 43 Beta distributions for HAQ
- Page 113 and 114: TABLE 44 Early cessation of DMARDs:
- Page 115 and 116: TABLE 46 Unit costs for tests and v
- Page 117 and 118: following properties, according to
- Page 119 and 120: TABLE 52 Base case: TNF inhibitors
- Page 121 and 122: TABLE 54 Base case: TNF inhibitors
- Page 123 and 124: TABLE 59 Third TNF inhibitor follow
- Page 125 and 126: TABLE 65 Sensitivity analyses: TNF
- Page 127 and 128: TABLE 67 Sensitivity analyses: TNF
- Page 129: The substantial economic impact of
- Page 133 and 134: Summary Effectiveness: principal fi
- Page 135 and 136: inhibitors, although the incrementa
- Page 137 and 138: introduce bias which generally exag
- Page 139: Adalimumab, etanercept and inflixim
- Page 143 and 144: 1. Jobanputra P, Barton P, Bryan S,
- Page 145 and 146: 46. Young A, Dixey J, Cox N, Davies
- Page 147 and 148: tumor necrosis factor therapy in th
management <strong>of</strong> RA, i.e. 1st and 2nd line”.<br />
Etanercept and methotrexate were used in<br />
combination as “<strong>the</strong> body <strong>of</strong> evidence suggests<br />
that combination <strong>the</strong>rapy is more effective than<br />
mono<strong>the</strong>rapy”. Using combination data, however,<br />
will weigh ICERs in favour <strong>of</strong> etanercept since<br />
patients responding to combined <strong>the</strong>rapy, if <strong>the</strong>y<br />
are DMARD naïve, have <strong>the</strong> opportunity <strong>of</strong><br />
responding to two agents and many may have<br />
responded to methotrexate alone.<br />
The model uses 6-monthly cycles and allows<br />
patients to: experience changes in disease severity;<br />
enter a remission state; develop drug tolerance<br />
problems; experience an SAE; or die. At <strong>the</strong> end<br />
<strong>of</strong> each 6-month cycle <strong>the</strong> patient can:<br />
● change disease severity<br />
● experience an SAE<br />
● switch treatment <strong>the</strong>rapy<br />
● die.<br />
The model run consisted <strong>of</strong> 10,000 hypo<strong>the</strong>tical<br />
patients, followed until death. Costs were<br />
calculated from <strong>the</strong> perspective <strong>of</strong> a healthcare<br />
provider. The main driver <strong>of</strong> <strong>the</strong> model result is<br />
<strong>the</strong> patient’s disease severity. Disease severity<br />
determines several factors in <strong>the</strong> model, including<br />
<strong>the</strong> likelihood <strong>of</strong> switching <strong>the</strong>rapy, health-related<br />
utility and mortality. HAQ was used to represent<br />
disease severity as it was not practical to measure<br />
both HAQ and DAS28 scores simultaneously.<br />
However, for <strong>the</strong> purpose <strong>of</strong> ‘switching thresholds’<br />
a relationship between HAQ and DAS28 was<br />
required and changes in HAQ score were used as a<br />
proxy for changes in <strong>the</strong> DAS28. Perhaps here it<br />
would have been more appropriate to use actual<br />
switching rates from clinical observation ra<strong>the</strong>r<br />
TABLE 28 HAQ change parameters<br />
© Queen’s Printer and Controller <strong>of</strong> HMSO 2006. All rights reserved.<br />
Health Technology Assessment 2006; Vol. 10: No. 42<br />
than this conversion, which potentially introduces<br />
more uncertainty into <strong>the</strong> model. A baseline HAQ<br />
<strong>of</strong> 1.74 was obtained from TEMPO. Using a fixed<br />
HAQ at start <strong>of</strong> treatment has limitations and <strong>the</strong><br />
heterogeneity <strong>of</strong> response is not taken into<br />
account. Patients’ HAQ scores are updated every 6<br />
months, with <strong>the</strong> changes based on evidence from<br />
clinical trials and o<strong>the</strong>r published sources (see<br />
Table 28 for estimates).<br />
A robust approach was applied, where<br />
distributions ra<strong>the</strong>r than point estimates were used<br />
to introduce a random element into HAQ<br />
change. The HAQ change estimates were derived<br />
from TEMPO for etanercept, methotrexate and<br />
combination <strong>the</strong>rapy. The HAQ change for<br />
unspecified DMARD was based on <strong>the</strong> Tight<br />
Control for Rheumatoid Arthritis (TICORA). This<br />
is inappropriate since data for individual drugs<br />
are available. The initial HAQ change for<br />
sulfasalazine was assumed to be –0.29. This<br />
improvement is based on an ITT analysis <strong>of</strong> trial<br />
data, and HAQ improvement for those that<br />
continue <strong>the</strong> drug was –0.43. For <strong>the</strong> purposes <strong>of</strong><br />
economic modelling, patients who continue<br />
treatment are <strong>of</strong> interest, since those who do not<br />
are accounted for elsewhere. Thus, a figure <strong>of</strong><br />
–0.29 underestimated <strong>the</strong> benefit <strong>of</strong> continuing<br />
with sulfasalazine. Data from trials such as<br />
TEMPO represent ideal responses and <strong>the</strong> data<br />
may not reflect outcomes in routine care. For<br />
o<strong>the</strong>r <strong>the</strong>rapies, <strong>the</strong> estimates were based on<br />
‘published sources’, and where data were not<br />
available for 6-month changes, estimates were<br />
converted to 6-month rates using a simple<br />
formula. In all cases, <strong>the</strong> first 6 months’ change<br />
was accounted for when calculating medium-term<br />
changes. Patients in remission were assumed to<br />
Etan MTX Etan+ SSZ GST Infl + DMARD Adal LEF Salvage<br />
MTX MTX<br />
Initial HAQ<br />
change<br />
–0.690 –0.650 –0.890 –0.290 –0.430 –0.080 –0.270 –0.560 –0.500 –0.040<br />
Medium-term –0.005<br />
non-remission:<br />
mean HAQ<br />
change<br />
–0.001 –0.052 0.075 0.045 –0.087 –0.080 –0.030 0.000 0.200<br />
Remission:<br />
mean HAQ<br />
change<br />
–0.0276 –0.0037 –0.0145 0.075 0.045 –0.087 –0.080 –0.030 0.000 0.200<br />
Long-term: 0.00 0.02 0.00 0.10 0.10 0.00 0.1 0.00 0.10 0.28<br />
change per<br />
cycle<br />
83


