A systematic review of the effectiveness of adalimumab
A systematic review of the effectiveness of adalimumab A systematic review of the effectiveness of adalimumab
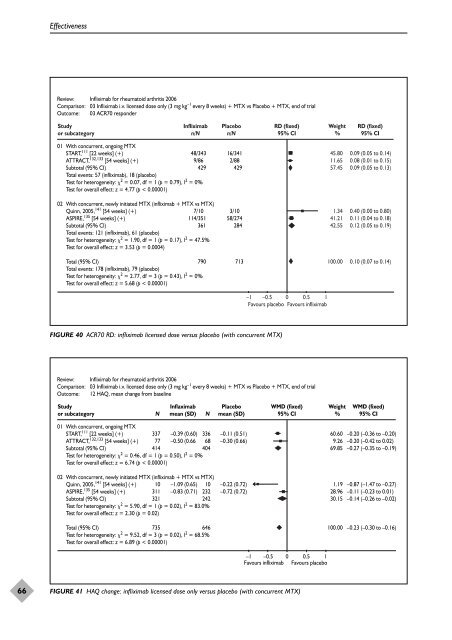
66 Effectiveness Review: Infliximab for rheumatoid arthritis 2006 Comparison: 03 Infliximab i.v. licensed dose only (3 mg kg –1 every 8 weeks) + MTX vs Placebo + MTX, end of trial Outcome: 03 ACR70 responder Study or subcategory Infliximab n/N Placebo n/N 01 With concurrent, ongoing MTX START, 111 [22 weeks] (+) ATTRACT, 132,133 [54 weeks] (+) Subtotal (95% CI) Total events: 57 (infliximab), 18 (placebo) Test for heterogeneity: 2 = 0.07, df = 1 (p = 0.79), I2 48/343 16/341 9/86 2/88 429 429 = 0% Test for overall effect: z = 4.77 (p < 0.00001) 02 With concurrent, newly initiated MTX (infliximab + MTX vs MTX) Quinn, 2005, 141 [54 weeks] (+) ASPIRE, 135 [54 weeks] (+) Subtotal (95% CI) Total events: 121 (infliximab), 61 (placebo) Test for heterogeneity: 2 = 1.90, df = 1 (p = 0.17), I2 7/10 3/10 114/351 58/274 361 284 = 47.5% Test for overall effect: z = 3.53 (p = 0.0004) Total (95% CI) Total events: 178 (infliximab), 79 (placebo) Test for heterogeneity: 2 = 2.77, df = 3 (p = 0.43), I2 790 713 = 0% Test for overall effect: z = 5.68 (p < 0.00001) FIGURE 40 ACR70 RD: infliximab licensed dose versus placebo (with concurrent MTX) RD (fixed) 95% CI –1 –0.5 0 0.5 1 Favours placebo Favours infliximab Review: Infliximab for rheumatoid arthritis 2006 Comparison: 03 Infliximab i.v. licensed dose only (3 mg kg –1 every 8 weeks) + MTX vs Placebo + MTX, end of trial Outcome: 12 HAQ, mean change from baseline Study or subcategory 01 With concurrent, ongoing MTX START, 111 [22 weeks] (+) ATTRACT, 132,133 [54 weeks] (+) Subtotal (95% CI) N Inflaximab mean (SD) N Test for heterogeneity: 2 = 0.46, df = 1 (p = 0.50), I 2 = 0% Test for overall effect: z = 6.74 (p < 0.00001) 02 With concurrent, newly initiated MTX (infliximab + MTX vs MTX) Quinn, 2005, 141 [54 weeks] (+) ASPIRE, 135 [54 weeks] (+) Subtotal (95% CI) Placebo mean (SD) 337 –0.39 (0.60) 336 –0.11 (0.51) 77 –0.50 (0.66 68 –0.30 (0.66) 414 404 10 –1.09 (0.65) 10 –0.22 (0.72) 311 –0.83 (0.71) 232 –0.72 (0.72) 321 242 Test for heterogeneity: 2 = 5.90, df = 1 (p = 0.02), I 2 = 83.0% Test for overall effect: z = 2.30 (p = 0.02) Total (95% CI) Test for heterogeneity: 2 = 9.52, df = 3 (p = 0.02), I2 735 646 = 68.5% Test for overall effect: z = 6.89 (p < 0.00001) WMD (fixed) 95% CI –1 –0.5 0 0.5 1 Favours infliximab Favours placebo FIGURE 41 HAQ change: infliximab licensed dose only versus placebo (with concurrent MTX) Weight % 45.80 11.65 57.45 1.34 41.21 42.55 100.00 Weight % 60.60 9.26 69.85 1.19 28.96 30.15 100.00 RD (fixed) 95% CI 0.09 (0.05 to 0.14) 0.08 (0.01 to 0.15) 0.09 (0.05 to 0.13) 0.40 (0.00 to 0.80) 0.11 (0.04 to 0.18) 0.12 (0.05 to 0.19) 0.10 (0.07 to 0.14) WMD (fixed) 95% CI –0.20 (–0.36 to –0.20) –0.20 (–0.42 to 0.02) –0.27 (–0.35 to –0.19) –0.87 (–1.47 to –0.27) –0.11 (–0.23 to 0.01) –0.14 (–0.26 to –0.02) –0.23 (–0.30 to –0.16)
Review: Infliximab for rheumatoid arthritis 2006 Comparison: 03 Infliximab i.v. licensed dose only (3 mg kg –1 every 8 weeks) + MTX vs Placebo + MTX, end of trial Outcome: 07 SAEs Study or subcategory Infliximab n/N Placebo n/N 01 With concurrent, ongoing MTX START, 111 [22 weeks] (+) ATTRACT, 132,133 [54 weeks] (+) Subtotal (95% CI) Total events: 38 (infliximab), 45 (placebo) Test for heterogeneity: 2 = 2.11, df = 1 (p = 0.15), I2 28/360 27/361 10/88 18/86 448 447 = 52.7% Test for overall effect: z = 0.84 (p = 0.40) 02 With concurrent, newly initiated MTX (infliximab + MTX vs MTX) ASPIRE, 135 [54 weeks] (+) Subtotal (95% CI) Total events: 52 (infliximab), 32 (placebo) Test for heterogeneity: NA Test for overall effect: z = 1.14 (p = 0.25) 52/372 32/291 372 291 Total (95% CI) Total events: 90 (infliximab), 77 (placebo) Test for heterogeneity: 2 = 4.09, df = 2 (p = 0.13), I2 820 738 = 51.1% Test for overall effect: z = 0.21 (p = 0.84) FIGURE 42 SAE RR: infliximab licensed dose versus placebo (with concurrent MTX) © Queen’s Printer and Controller of HMSO 2006. All rights reserved. Health Technology Assessment 2006; Vol. 10: No. 42 RR (fixed) 95% CI 0.1 0.2 0.5 1 2 5 10 Favours infliximab Favours placebo Review: Infliximab for rheumatoid arthritis 2006 Comparison: 03 Infliximab i.v. licensed dose only (3 mg kg –1 every 8 weeks) + MTX vs Placebo + MTX, end of trial Outcome: 07 SAEs Study or subcategory Infliximab n/N Placebo n/N 01 With concurrent, ongoing MTX START, 111 [22 weeks] (+) ATTRACT, 132,133 [54 weeks] (+) Subtotal (95% CI) Total events: 38 (infliximab), 45 (placebo) Test for heterogeneity: 2 = 3.00, df = 1 (p = 0.08), I2 28/360 27/361 10/88 18/86 448 447 = 66.7% Test for overall effect: z = 0.84 (p = 0.40) 02 With concurrent, newly initiated MTX (infliximab + MTX vs MTX) ASPIRE, 135 [54 weeks] (+) Subtotal (95% CI) Total events: 52 (infliximab), 32 (placebo) Test for heterogeneity: NA Test for overall effect: z = 1.16 (p = 0.25) 52/372 32/291 372 291 Total (95% CI) Total events: 90 (infliximab), 77 (placebo) Test for heterogeneity: 2 = 4.26, df = 2 (p = 0.12), I2 820 738 = 53.0% Test for overall effect: z = 0.21 (p = 0.84) FIGURE 43 SAE RD: infliximab licensed dose versus placebo (with concurrent MTX) RD (fixed) 95% CI –1 –0.5 0 0.5 1 Favours infliximab Favours placebo Weight % 33.25 22.46 55.71 44.29 44.29 100.00 Weight % 46.57 11.24 57.81 42.19 42.19 100.00 RR (fixed) 95% CI 1.04 (0.63 to 1.73) 0.54 (0.27 to 1.11) 0.84 (0.56 to 1.26) 1.27 (0.84 to 1.92) 1.27 (0.84 to 1.92) 1.03 (0.77 to 1.38) RD (fixed) 95% CI 0.00 (–0.04 to 0.04) –0.10 (–0.20 to 0.01) –0.02 (–0.05 to 0.02) 0.03 (–0.02 to 0.08) 0.03 (–0.02 to 0.08) 0.00 (–0.03 to 0.03) 67
- Page 32 and 33: 16 Effectiveness adalimumab plus me
- Page 34 and 35: 18 Effectiveness Monoclonal Antibod
- Page 36 and 37: 20 TABLE 1 Description of included
- Page 38 and 39: 22 TABLE 2 Quality of included RCTs
- Page 40 and 41: 24 Effectiveness change in modified
- Page 42 and 43: 26 Effectiveness TABLE 4 Meta-analy
- Page 44 and 45: 28 Effectiveness Review: Adalimumab
- Page 46 and 47: 30 Effectiveness Review: Adalimumab
- Page 48 and 49: 32 TABLE 6 Effectiveness Descriptio
- Page 50 and 51: 34 TABLE 6 Effectiveness Descriptio
- Page 52 and 53: 36 TABLE 7 Effectiveness Quality of
- Page 54 and 55: 38 Effectiveness etanercept trials.
- Page 56 and 57: 40 Effectiveness TABLE 9 Summary of
- Page 58 and 59: 42 Effectiveness Review: Etanercept
- Page 60 and 61: 44 Effectiveness Review: Etanercept
- Page 62 and 63: 46 Effectiveness Review: Etanercept
- Page 64 and 65: 48 Effectiveness Review: Etanercept
- Page 66 and 67: 50 Effectiveness Review: Etanercept
- Page 68 and 69: 52 Effectiveness Review: Etanercept
- Page 70 and 71: 54 Effectiveness TABLE 11 Summary o
- Page 72 and 73: 56 TABLE 12 Description of included
- Page 74 and 75: 58 TABLE 13 Quality of included RCT
- Page 76 and 77: 60 Effectiveness per week and escal
- Page 78 and 79: 62 Effectiveness significant advant
- Page 80 and 81: 64 Effectiveness Review: Infliximab
- Page 84 and 85: 68 Effectiveness FIGURE 44 Malignan
- Page 86 and 87: 70 TABLE 17 Effectiveness Summary o
- Page 89 and 90: Summary of review of existing econo
- Page 91 and 92: TABLE 20 Summary of published ICERs
- Page 93 and 94: TABLE 21 Published etanercept econo
- Page 95 and 96: TABLE 23 Published economic analyse
- Page 97 and 98: TABLE 25 Treatment sequences: adali
- Page 99 and 100: management of RA, i.e. 1st and 2nd
- Page 101 and 102: To estimate the long-term consequen
- Page 103 and 104: TABLE 32 TNF inhibitors as last act
- Page 105 and 106: TABLE 34 Basic structure of the mod
- Page 107 and 108: een quit on grounds of toxicity, ad
- Page 109 and 110: TABLE 39 Strategy set: adalimumab a
- Page 111 and 112: TABLE 43 Beta distributions for HAQ
- Page 113 and 114: TABLE 44 Early cessation of DMARDs:
- Page 115 and 116: TABLE 46 Unit costs for tests and v
- Page 117 and 118: following properties, according to
- Page 119 and 120: TABLE 52 Base case: TNF inhibitors
- Page 121 and 122: TABLE 54 Base case: TNF inhibitors
- Page 123 and 124: TABLE 59 Third TNF inhibitor follow
- Page 125 and 126: TABLE 65 Sensitivity analyses: TNF
- Page 127 and 128: TABLE 67 Sensitivity analyses: TNF
- Page 129: The substantial economic impact of
66<br />
Effectiveness<br />
Review: Infliximab for rheumatoid arthritis 2006<br />
Comparison: 03 Infliximab i.v. licensed dose only (3 mg kg –1 every 8 weeks) + MTX vs Placebo + MTX, end <strong>of</strong> trial<br />
Outcome: 03 ACR70 responder<br />
Study<br />
or subcategory<br />
Infliximab<br />
n/N<br />
Placebo<br />
n/N<br />
01 With concurrent, ongoing MTX<br />
START, 111 [22 weeks] (+)<br />
ATTRACT, 132,133 [54 weeks] (+)<br />
Subtotal (95% CI)<br />
Total events: 57 (infliximab), 18 (placebo)<br />
Test for heterogeneity: 2 = 0.07, df = 1 (p = 0.79), I2 48/343 16/341<br />
9/86 2/88<br />
429 429<br />
= 0%<br />
Test for overall effect: z = 4.77 (p < 0.00001)<br />
02 With concurrent, newly initiated MTX (infliximab + MTX vs MTX)<br />
Quinn, 2005, 141 [54 weeks] (+)<br />
ASPIRE, 135 [54 weeks] (+)<br />
Subtotal (95% CI)<br />
Total events: 121 (infliximab), 61 (placebo)<br />
Test for heterogeneity: 2 = 1.90, df = 1 (p = 0.17), I2 7/10 3/10<br />
114/351 58/274<br />
361 284<br />
= 47.5%<br />
Test for overall effect: z = 3.53 (p = 0.0004)<br />
Total (95% CI)<br />
Total events: 178 (infliximab), 79 (placebo)<br />
Test for heterogeneity: 2 = 2.77, df = 3 (p = 0.43), I2 790 713<br />
= 0%<br />
Test for overall effect: z = 5.68 (p < 0.00001)<br />
FIGURE 40 ACR70 RD: infliximab licensed dose versus placebo (with concurrent MTX)<br />
RD (fixed)<br />
95% CI<br />
–1 –0.5 0 0.5 1<br />
Favours placebo Favours infliximab<br />
Review: Infliximab for rheumatoid arthritis 2006<br />
Comparison: 03 Infliximab i.v. licensed dose only (3 mg kg –1 every 8 weeks) + MTX vs Placebo + MTX, end <strong>of</strong> trial<br />
Outcome: 12 HAQ, mean change from baseline<br />
Study<br />
or subcategory<br />
01 With concurrent, ongoing MTX<br />
START, 111 [22 weeks] (+)<br />
ATTRACT, 132,133 [54 weeks] (+)<br />
Subtotal (95% CI)<br />
N<br />
Inflaximab<br />
mean (SD) N<br />
Test for heterogeneity: 2 = 0.46, df = 1 (p = 0.50), I 2 = 0%<br />
Test for overall effect: z = 6.74 (p < 0.00001)<br />
02 With concurrent, newly initiated MTX (infliximab + MTX vs MTX)<br />
Quinn, 2005, 141 [54 weeks] (+)<br />
ASPIRE, 135 [54 weeks] (+)<br />
Subtotal (95% CI)<br />
Placebo<br />
mean (SD)<br />
337 –0.39 (0.60) 336 –0.11 (0.51)<br />
77 –0.50 (0.66 68 –0.30 (0.66)<br />
414 404<br />
10 –1.09 (0.65) 10 –0.22 (0.72)<br />
311 –0.83 (0.71) 232 –0.72 (0.72)<br />
321 242<br />
Test for heterogeneity: 2 = 5.90, df = 1 (p = 0.02), I 2 = 83.0%<br />
Test for overall effect: z = 2.30 (p = 0.02)<br />
Total (95% CI)<br />
Test for heterogeneity: 2 = 9.52, df = 3 (p = 0.02), I2 735 646<br />
= 68.5%<br />
Test for overall effect: z = 6.89 (p < 0.00001)<br />
WMD (fixed)<br />
95% CI<br />
–1 –0.5 0 0.5 1<br />
Favours infliximab Favours placebo<br />
FIGURE 41 HAQ change: infliximab licensed dose only versus placebo (with concurrent MTX)<br />
Weight<br />
%<br />
45.80<br />
11.65<br />
57.45<br />
1.34<br />
41.21<br />
42.55<br />
100.00<br />
Weight<br />
%<br />
60.60<br />
9.26<br />
69.85<br />
1.19<br />
28.96<br />
30.15<br />
100.00<br />
RD (fixed)<br />
95% CI<br />
0.09 (0.05 to 0.14)<br />
0.08 (0.01 to 0.15)<br />
0.09 (0.05 to 0.13)<br />
0.40 (0.00 to 0.80)<br />
0.11 (0.04 to 0.18)<br />
0.12 (0.05 to 0.19)<br />
0.10 (0.07 to 0.14)<br />
WMD (fixed)<br />
95% CI<br />
–0.20 (–0.36 to –0.20)<br />
–0.20 (–0.42 to 0.02)<br />
–0.27 (–0.35 to –0.19)<br />
–0.87 (–1.47 to –0.27)<br />
–0.11 (–0.23 to 0.01)<br />
–0.14 (–0.26 to –0.02)<br />
–0.23 (–0.30 to –0.16)


