

A systematic review of the effectiveness of adalimumab
A systematic review of the effectiveness of adalimumab
A systematic review of the effectiveness of adalimumab

You also want an ePaper? Increase the reach of your titles
YUMPU automatically turns print PDFs into web optimized ePapers that Google loves.
214<br />
Appendix 10<br />
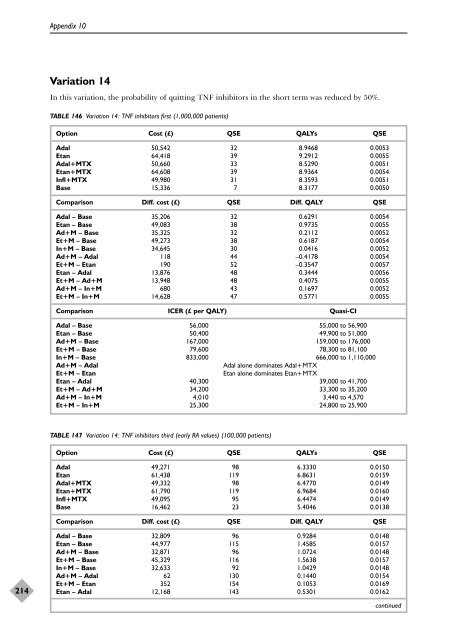
Variation 14<br />
In this variation, <strong>the</strong> probability <strong>of</strong> quitting TNF inhibitors in <strong>the</strong> short term was reduced by 50%.<br />
TABLE 146 Variation 14: TNF inhibitors first (1,000,000 patients)<br />
Option Cost (£) QSE QALYs QSE<br />
Adal 50,542 32 8.9468 0.0053<br />
Etan 64,418 39 9.2912 0.0055<br />
Adal+MTX 50,660 33 8.5290 0.0051<br />
Etan+MTX 64,608 39 8.9364 0.0054<br />
Infl+MTX 49,980 31 8.3593 0.0051<br />
Base 15,336 7 8.3177 0.0050<br />
Comparison Diff. cost (£) QSE Diff. QALY QSE<br />
Adal – Base 35,206 32 0.6291 0.0054<br />
Etan – Base 49,083 38 0.9735 0.0055<br />
Ad+M – Base 35,325 32 0.2112 0.0052<br />
Et+M – Base 49,273 38 0.6187 0.0054<br />
In+M – Base 34,645 30 0.0416 0.0052<br />
Ad+M – Adal 118 44 –0.4178 0.0054<br />
Et+M – Etan 190 52 –0.3547 0.0057<br />
Etan – Adal 13,876 48 0.3444 0.0056<br />
Et+M – Ad+M 13,948 48 0.4075 0.0055<br />
Ad+M – In+M 680 43 0.1697 0.0052<br />
Et+M – In+M 14,628 47 0.5771 0.0055<br />
Comparison ICER (£ per QALY) Quasi-CI<br />
Adal – Base 56,000 55,000 to 56,900<br />
Etan – Base 50,400 49,900 to 51,000<br />
Ad+M – Base 167,000 159,000 to 176,000<br />
Et+M – Base 79,600 78,300 to 81,100<br />
In+M – Base 833,000 666,000 to 1,110,000<br />
Ad+M – Adal Adal alone dominates Adal+MTX<br />
Et+M – Etan Etan alone dominates Etan+MTX<br />
Etan – Adal 40,300 39,000 to 41,700<br />
Et+M – Ad+M 34,200 33,300 to 35,200<br />
Ad+M – In+M 4,010 3,440 to 4,570<br />
Et+M – In+M 25,300 24,800 to 25,900<br />
TABLE 147 Variation 14: TNF inhibitors third (early RA values) (100,000 patients)<br />
Option Cost (£) QSE QALYs QSE<br />
Adal 49,271 98 6.3330 0.0150<br />
Etan 61,438 119 6.8631 0.0159<br />
Adal+MTX 49,332 98 6.4770 0.0149<br />
Etan+MTX 61,790 119 6.9684 0.0160<br />
Infl+MTX 49,095 95 6.4474 0.0149<br />
Base 16,462 23 5.4046 0.0138<br />
Comparison Diff. cost (£) QSE Diff. QALY QSE<br />
Adal – Base 32,809 96 0.9284 0.0148<br />
Etan – Base 44,977 115 1.4585 0.0157<br />
Ad+M – Base 32,871 96 1.0724 0.0148<br />
Et+M – Base 45,329 116 1.5638 0.0157<br />
In+M – Base 32,633 92 1.0429 0.0148<br />
Ad+M – Adal 62 130 0.1440 0.0154<br />
Et+M – Etan 352 154 0.1053 0.0169<br />
Etan – Adal 12,168 143 0.5301 0.0162<br />
continued


