

A systematic review of the effectiveness of adalimumab
A systematic review of the effectiveness of adalimumab
A systematic review of the effectiveness of adalimumab

You also want an ePaper? Increase the reach of your titles
YUMPU automatically turns print PDFs into web optimized ePapers that Google loves.
210<br />
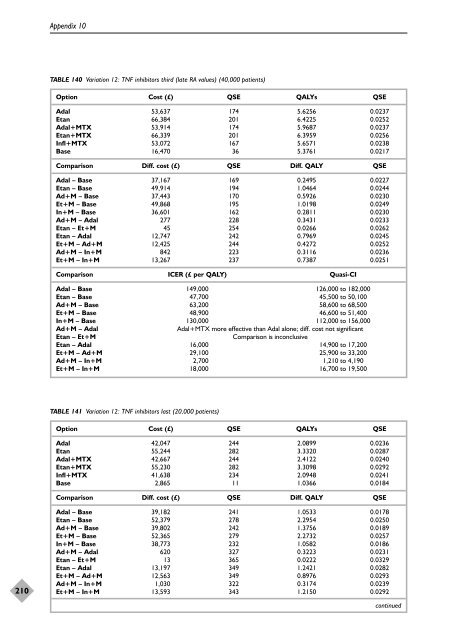
Appendix 10<br />
TABLE 140 Variation 12: TNF inhibitors third (late RA values) (40,000 patients)<br />
Option Cost (£) QSE QALYs QSE<br />
Adal 53,637 174 5.6256 0.0237<br />
Etan 66,384 201 6.4225 0.0252<br />
Adal+MTX 53,914 174 5.9687 0.0237<br />
Etan+MTX 66,339 201 6.3959 0.0256<br />
Infl+MTX 53,072 167 5.6571 0.0238<br />
Base 16,470 36 5.3761 0.0217<br />
Comparison Diff. cost (£) QSE Diff. QALY QSE<br />
Adal – Base 37,167 169 0.2495 0.0227<br />
Etan – Base 49,914 194 1.0464 0.0244<br />
Ad+M – Base 37,443 170 0.5926 0.0230<br />
Et+M – Base 49,868 195 1.0198 0.0249<br />
In+M – Base 36,601 162 0.2811 0.0230<br />
Ad+M – Adal 277 228 0.3431 0.0233<br />
Etan – Et+M 45 254 0.0266 0.0262<br />
Etan – Adal 12,747 242 0.7969 0.0245<br />
Et+M – Ad+M 12,425 244 0.4272 0.0252<br />
Ad+M – In+M 842 223 0.3116 0.0236<br />
Et+M – In+M 13,267 237 0.7387 0.0251<br />
Comparison ICER (£ per QALY) Quasi-CI<br />
Adal – Base 149,000 126,000 to 182,000<br />
Etan – Base 47,700 45,500 to 50,100<br />
Ad+M – Base 63,200 58,600 to 68,500<br />
Et+M – Base 48,900 46,600 to 51,400<br />
In+M – Base 130,000 112,000 to 156,000<br />
Ad+M – Adal Adal+MTX more effective than Adal alone; diff. cost not significant<br />
Etan – Et+M Comparison is inconclusive<br />
Etan – Adal 16,000 14,900 to 17,200<br />
Et+M – Ad+M 29,100 25,900 to 33,200<br />
Ad+M – In+M 2,700 1,210 to 4,190<br />
Et+M – In+M 18,000 16,700 to 19,500<br />
TABLE 141 Variation 12: TNF inhibitors last (20,000 patients)<br />
Option Cost (£) QSE QALYs QSE<br />
Adal 42,047 244 2.0899 0.0236<br />
Etan 55,244 282 3.3320 0.0287<br />
Adal+MTX 42,667 244 2.4122 0.0240<br />
Etan+MTX 55,230 282 3.3098 0.0292<br />
Infl+MTX 41,638 234 2.0948 0.0241<br />
Base 2,865 11 1.0366 0.0184<br />
Comparison Diff. cost (£) QSE Diff. QALY QSE<br />
Adal – Base 39,182 241 1.0533 0.0178<br />
Etan – Base 52,379 278 2.2954 0.0250<br />
Ad+M – Base 39,802 242 1.3756 0.0189<br />
Et+M – Base 52,365 279 2.2732 0.0257<br />
In+M – Base 38,773 232 1.0582 0.0186<br />
Ad+M – Adal 620 327 0.3223 0.0231<br />
Etan – Et+M 13 365 0.0222 0.0329<br />
Etan – Adal 13,197 349 1.2421 0.0282<br />
Et+M – Ad+M 12,563 349 0.8976 0.0293<br />
Ad+M – In+M 1,030 322 0.3174 0.0239<br />
Et+M – In+M 13,593 343 1.2150 0.0292<br />
continued


