

A systematic review of the effectiveness of adalimumab
A systematic review of the effectiveness of adalimumab
A systematic review of the effectiveness of adalimumab

You also want an ePaper? Increase the reach of your titles
YUMPU automatically turns print PDFs into web optimized ePapers that Google loves.
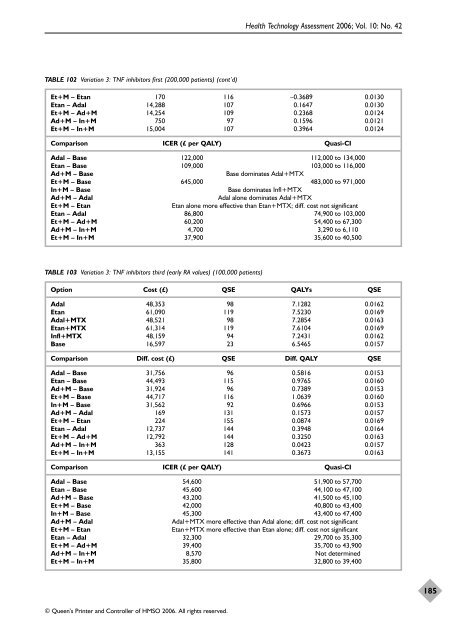
TABLE 102 Variation 3: TNF inhibitors first (200,000 patients) (cont’d)<br />
© Queen’s Printer and Controller <strong>of</strong> HMSO 2006. All rights reserved.<br />
Health Technology Assessment 2006; Vol. 10: No. 42<br />
Et+M – Etan 170 116 –0.3689 0.0130<br />
Etan – Adal 14,288 107 0.1647 0.0130<br />
Et+M – Ad+M 14,254 109 0.2368 0.0124<br />
Ad+M – In+M 750 97 0.1596 0.0121<br />
Et+M – In+M 15,004 107 0.3964 0.0124<br />
Comparison ICER (£ per QALY) Quasi-CI<br />
Adal – Base 122,000 112,000 to 134,000<br />
Etan – Base 109,000 103,000 to 116,000<br />
Ad+M – Base Base dominates Adal+MTX<br />
Et+M – Base 645,000 483,000 to 971,000<br />
In+M – Base Base dominates Infl+MTX<br />
Ad+M – Adal Adal alone dominates Adal+MTX<br />
Et+M – Etan Etan alone more effective than Etan+MTX; diff. cost not significant<br />
Etan – Adal 86,800 74,900 to 103,000<br />
Et+M – Ad+M 60,200 54,400 to 67,300<br />
Ad+M – In+M 4,700 3,290 to 6,110<br />
Et+M – In+M 37,900 35,600 to 40,500<br />
TABLE 103 Variation 3: TNF inhibitors third (early RA values) (100,000 patients)<br />
Option Cost (£) QSE QALYs QSE<br />
Adal 48,353 98 7.1282 0.0162<br />
Etan 61,090 119 7.5230 0.0169<br />
Adal+MTX 48,521 98 7.2854 0.0163<br />
Etan+MTX 61,314 119 7.6104 0.0169<br />
Infl+MTX 48,159 94 7.2431 0.0162<br />
Base 16,597 23 6.5465 0.0157<br />
Comparison Diff. cost (£) QSE Diff. QALY QSE<br />
Adal – Base 31,756 96 0.5816 0.0153<br />
Etan – Base 44,493 115 0.9765 0.0160<br />
Ad+M – Base 31,924 96 0.7389 0.0153<br />
Et+M – Base 44,717 116 1.0639 0.0160<br />
In+M – Base 31,562 92 0.6966 0.0153<br />
Ad+M – Adal 169 131 0.1573 0.0157<br />
Et+M – Etan 224 155 0.0874 0.0169<br />
Etan – Adal 12,737 144 0.3948 0.0164<br />
Et+M – Ad+M 12,792 144 0.3250 0.0163<br />
Ad+M – In+M 363 128 0.0423 0.0157<br />
Et+M – In+M 13,155 141 0.3673 0.0163<br />
Comparison ICER (£ per QALY) Quasi-CI<br />
Adal – Base 54,600 51,900 to 57,700<br />
Etan – Base 45,600 44,100 to 47,100<br />
Ad+M – Base 43,200 41,500 to 45,100<br />
Et+M – Base 42,000 40,800 to 43,400<br />
In+M – Base 45,300 43,400 to 47,400<br />
Ad+M – Adal Adal+MTX more effective than Adal alone; diff. cost not significant<br />
Et+M – Etan Etan+MTX more effective than Etan alone; diff. cost not significant<br />
Etan – Adal 32,300 29,700 to 35,300<br />
Et+M – Ad+M 39,400 35,700 to 43,900<br />
Ad+M – In+M 8,570 Not determined<br />
Et+M – In+M 35,800 32,800 to 39,400<br />
185


