A systematic review of the effectiveness of adalimumab
A systematic review of the effectiveness of adalimumab A systematic review of the effectiveness of adalimumab
182 Appendix 10 Variation 2 For this variation, it was assumed that HAQ progression on all active treatments was at 0.03 per year. TABLE 98 Variation 2: TNF inhibitors first (200,000 patients) Option Cost (£) QSE QALYs QSE Adal 49,443 72 9.5963 0.0130 Etan 63,882 87 9.8239 0.0132 Adal+MTX 49,787 73 9.0930 0.0122 Etan+MTX 64,093 88 9.3620 0.0122 Infl+MTX 49,186 70 8.9392 0.0122 Base 15,420 15 9.2826 0.0125 Comparison Diff. cost (£) QSE Diff. QALY QSE Adal – Base 34,023 71 0.3137 0.0128 Etan – Base 48,462 85 0.5413 0.0130 Ad+M – Base 34,367 72 –0.1896 0.0125 Et+M – Base 48,673 86 0.0794 0.0128 In+M – Base 33,766 68 –0.3433 0.0125 Ad+M – Adal 345 98 –0.5033 0.0127 Et+M – Etan 211 116 –0.4619 0.0131 Etan – Adal 14,440 107 0.2276 0.0131 Et+M – Ad+M 14,306 109 0.2690 0.0126 Ad+M – In+M 601 97 0.1537 0.0123 Et+M – In+M 14,907 107 0.4228 0.0126 Comparison ICER (£ per QALY) Quasi-CI Adal – Base 108,000 100,000 to 118,000 Etan – Base 89,500 85,400 to 94,100 Ad+M – Base Base dominates Adal+MTX Et+M – Base 613,000 463,000 to 906,000 In+M – Base Base dominates Infl+MTX Ad+M – Adal Adal alone dominates Adal+MTX Et+M – Etan Etan alone more effective than Etan+MTX; diff. cost not significant Etan – Adal 63,500 56,900 to 71,800 Et+M – Ad+M 53,200 48,600 to 58,700 Ad+M – In+M 3,910 2,510 to 5,310 Et+M – In+M 35,300 33,200 to 37,600 TABLE 99 Variation 2: TNF inhibitors third (early RA values) (100,000 patients) Option Cost (£) QSE QALYs QSE Adal 48,569 98 6.9994 0.0159 Etan 61,074 119 7.4020 0.0166 Adal+MTX 48,640 98 7.1398 0.0159 Etan+MTX 61,329 119 7.4999 0.0166 Infl+MTX 48,158 94 7.0644 0.0158 Base 16,590 23 6.2559 0.0151 Comparison Diff. cost (£) QSE Diff. QALY QSE Adal – Base 31,979 96 0.7435 0.0155 Etan – Base 44,484 116 1.1462 0.0161 Ad+M – Base 32,049 96 0.8840 0.0156 Et+M – Base 44,738 116 1.2441 0.0162 In+M – Base 31,567 92 0.8086 0.0155 Ad+M – Adal 70 131 0.1405 0.0160 Et+M – Etan 255 154 0.0979 0.0171 Etan – Adal 12,505 144 0.4027 0.0165 continued
TABLE 99 Variation 2: TNF inhibitors third (early RA values) (100,000 patients) (cont’d) © Queen’s Printer and Controller of HMSO 2006. All rights reserved. Health Technology Assessment 2006; Vol. 10: No. 42 Et+M – Ad+M 12,689 144 0.3601 0.0166 Ad+M – In+M 482 128 0.0754 0.0160 Et+M – In+M 13,171 141 0.4355 0.0165 Comparison ICER (£ per QALY) Quasi-CI Adal – Base 43,000 41,300 to 44,900 Etan – Base 38,800 37,700 to 40,000 Ad+M – Base 36,300 35,000 to 37,600 Et+M – Base 36,000 35,000 to 36,900 In+M – Base 39,000 37,600 to 40,600 Ad+M – Adal Adal+MTX more effective than Adal alone; diff. cost not significant Et+M – Etan Etan+MTX more effective than Etan alone; diff. cost not significant Etan – Adal 31,100 28,600 to 33,900 Et+M – Ad+M 35,200 32,200 to 38,900 Ad+M – In+M 6,390 2,050 to 10,700 Et+M – In+M 30,200 28,000 to 32,800 TABLE 100 Variation 2: TNF inhibitors third (late RA values) (400,000 patients) Option Cost (£) QSE QALYs QSE Adal 47,823 49 6.3067 0.0079 Etan 60,550 59 6.8904 0.0082 Adal+MTX 48,056 49 6.5602 0.0079 Etan+MTX 60,660 59 6.8825 0.0082 Infl+MTX 47,505 47 6.3152 0.0079 Base 16,546 11 6.2482 0.0075 Comparison Diff. cost (£) QSE Diff. QALY QSE Adal – Base 31,277 48 0.0584 0.0075 Etan – Base 44,004 58 0.6421 0.0079 Ad+M – Base 31,510 48 0.3119 0.0076 Et+M – Base 44,114 58 0.6343 0.0079 In+M – Base 30,959 46 0.0669 0.0076 Ad+M – Adal 233 65 0.2535 0.0075 Et+M – Etan 111 77 –0.0079 0.0082 Etan – Adal 12,727 71 0.5837 0.0078 Et+M – Ad+M 12,605 71 0.3223 0.0079 Ad+M – In+M 551 63 0.2450 0.0076 Et+M – In+M 13,155 70 0.5673 0.0079 Comparison ICER (£ per QALY) Quasi-CI Adal – Base 535,000 426,000 to 721,000 Etan – Base 68,500 66,900 to 70,300 Ad+M – Base 101,000 96,300 to 106,000 Et+M – Base 69,600 67,800 to 71,300 In+M – Base 462,000 377,000 to 597,000 Ad+M – Adal 920 407 to 1,430 Et+M – Etan Comparison is inconclusive Etan – Adal 21,800 21,200 to 22,500 Et+M – Ad+M 39,100 37,200 to 41,200 Ad+M – In+M 2,250 1,710 to 2,780 Et+M – In+M 23,200 22,500 to 23,900 183
- Page 147 and 148: tumor necrosis factor therapy in th
- Page 149 and 150: arthritis: a 12-week, double-blind,
- Page 151 and 152: 171. Geborek P, Crnkic M, Petersson
- Page 153 and 154: 216. Schotte H, Willeke P, Mickholz
- Page 155 and 156: The Health Assessment Questionnaire
- Page 157 and 158: Cochrane Library (CENTRAL) 2005 Iss
- Page 159 and 160: Appendix 3 © Queen’s Printer and
- Page 161: TABLE 69 Studies excluded from clin
- Page 164 and 165: 148 Appendix 4 TABLE 71 Meta-analys
- Page 166 and 167: 150 Appendix 4 TABLE 73 Meta-analys
- Page 168 and 169: 152 Appendix 4 Infliximab versus pl
- Page 170 and 171: 154 Appendix 4 Infliximab plus MTX
- Page 173: Ovid MEDLINE(R) 1966 to February we
- Page 177 and 178: Appendix 8 © Queen’s Printer and
- Page 179 and 180: TABLE 79 Wong et al., 2002 161 © Q
- Page 181 and 182: TABLE 80 Kobelt et al., 2003 162 (c
- Page 183 and 184: TABLE 82 Brennan et al., 2004 160
- Page 185 and 186: TABLE 83 Kobelt et al., 2004 163 (c
- Page 187 and 188: TABLE 85 Bansback et al., 2005 166
- Page 189: TABLE 86 Kobelt et al., 2005 167 (c
- Page 192 and 193: 176 Appendix 9 TABLE 89 Strategy se
- Page 195 and 196: Extensive sensitivity analysis was
- Page 197: TABLE 96 Variation 1: TNF inhibitor
- Page 201 and 202: TABLE 102 Variation 3: TNF inhibito
- Page 203 and 204: TABLE 105 Variation 3: TNF inhibito
- Page 205 and 206: TABLE 108 Variation 4: TNF inhibito
- Page 207 and 208: TABLE 111 Variation 5: TNF inhibito
- Page 209 and 210: TABLE 114 Variation 6: TNF inhibito
- Page 211 and 212: TABLE 117 Variation 6: TNF inhibito
- Page 213 and 214: TABLE 120 Variation 7: TNF inhibito
- Page 215 and 216: TABLE 123 Variation 8: TNF inhibito
- Page 217 and 218: TABLE 126 Variation 9: TNF inhibito
- Page 219 and 220: TABLE 129 Variation 9: TNF inhibito
- Page 221 and 222: TABLE 132 Variation 10: TNF inhibit
- Page 223 and 224: TABLE 135 Variation 11: TNF inhibit
- Page 225 and 226: TABLE 138 Variation 12: TNF inhibit
- Page 227 and 228: TABLE 141 Variation 12: TNF inhibit
- Page 229 and 230: TABLE 144 Variation 13: TNF inhibit
- Page 231 and 232: TABLE 147 Variation 14: TNF inhibit
- Page 233 and 234: TABLE 150 Variation 15: TNF inhibit
- Page 235 and 236: TABLE 153 Variation 15: TNF inhibit
- Page 237 and 238: TABLE 156 Variation 16: TNF inhibit
- Page 239 and 240: TABLE 159 Variation 17: TNF inhibit
- Page 241 and 242: TABLE 162 Variation 18: TNF inhibit
- Page 243: TABLE 165 Variation 18: TNF inhibit
- Page 247 and 248: Volume 1, 1997 No. 1 Home parentera
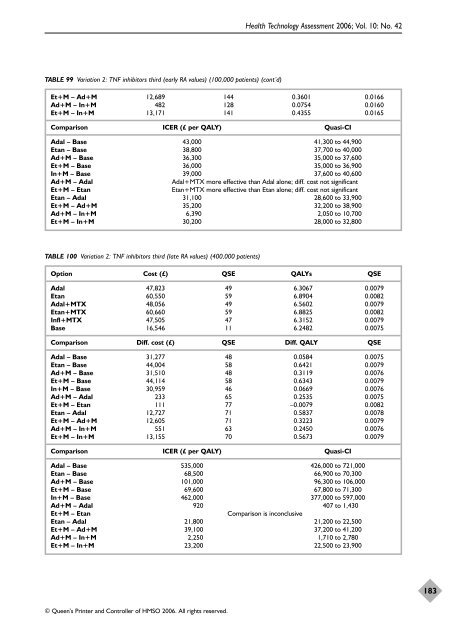
TABLE 99 Variation 2: TNF inhibitors third (early RA values) (100,000 patients) (cont’d)<br />
© Queen’s Printer and Controller <strong>of</strong> HMSO 2006. All rights reserved.<br />
Health Technology Assessment 2006; Vol. 10: No. 42<br />
Et+M – Ad+M 12,689 144 0.3601 0.0166<br />
Ad+M – In+M 482 128 0.0754 0.0160<br />
Et+M – In+M 13,171 141 0.4355 0.0165<br />
Comparison ICER (£ per QALY) Quasi-CI<br />
Adal – Base 43,000 41,300 to 44,900<br />
Etan – Base 38,800 37,700 to 40,000<br />
Ad+M – Base 36,300 35,000 to 37,600<br />
Et+M – Base 36,000 35,000 to 36,900<br />
In+M – Base 39,000 37,600 to 40,600<br />
Ad+M – Adal Adal+MTX more effective than Adal alone; diff. cost not significant<br />
Et+M – Etan Etan+MTX more effective than Etan alone; diff. cost not significant<br />
Etan – Adal 31,100 28,600 to 33,900<br />
Et+M – Ad+M 35,200 32,200 to 38,900<br />
Ad+M – In+M 6,390 2,050 to 10,700<br />
Et+M – In+M 30,200 28,000 to 32,800<br />
TABLE 100 Variation 2: TNF inhibitors third (late RA values) (400,000 patients)<br />
Option Cost (£) QSE QALYs QSE<br />
Adal 47,823 49 6.3067 0.0079<br />
Etan 60,550 59 6.8904 0.0082<br />
Adal+MTX 48,056 49 6.5602 0.0079<br />
Etan+MTX 60,660 59 6.8825 0.0082<br />
Infl+MTX 47,505 47 6.3152 0.0079<br />
Base 16,546 11 6.2482 0.0075<br />
Comparison Diff. cost (£) QSE Diff. QALY QSE<br />
Adal – Base 31,277 48 0.0584 0.0075<br />
Etan – Base 44,004 58 0.6421 0.0079<br />
Ad+M – Base 31,510 48 0.3119 0.0076<br />
Et+M – Base 44,114 58 0.6343 0.0079<br />
In+M – Base 30,959 46 0.0669 0.0076<br />
Ad+M – Adal 233 65 0.2535 0.0075<br />
Et+M – Etan 111 77 –0.0079 0.0082<br />
Etan – Adal 12,727 71 0.5837 0.0078<br />
Et+M – Ad+M 12,605 71 0.3223 0.0079<br />
Ad+M – In+M 551 63 0.2450 0.0076<br />
Et+M – In+M 13,155 70 0.5673 0.0079<br />
Comparison ICER (£ per QALY) Quasi-CI<br />
Adal – Base 535,000 426,000 to 721,000<br />
Etan – Base 68,500 66,900 to 70,300<br />
Ad+M – Base 101,000 96,300 to 106,000<br />
Et+M – Base 69,600 67,800 to 71,300<br />
In+M – Base 462,000 377,000 to 597,000<br />
Ad+M – Adal 920 407 to 1,430<br />
Et+M – Etan Comparison is inconclusive<br />
Etan – Adal 21,800 21,200 to 22,500<br />
Et+M – Ad+M 39,100 37,200 to 41,200<br />
Ad+M – In+M 2,250 1,710 to 2,780<br />
Et+M – In+M 23,200 22,500 to 23,900<br />
183


