

A systematic review of the effectiveness of adalimumab
A systematic review of the effectiveness of adalimumab
A systematic review of the effectiveness of adalimumab

Create successful ePaper yourself
Turn your PDF publications into a flip-book with our unique Google optimized e-Paper software.
182<br />
Appendix 10<br />
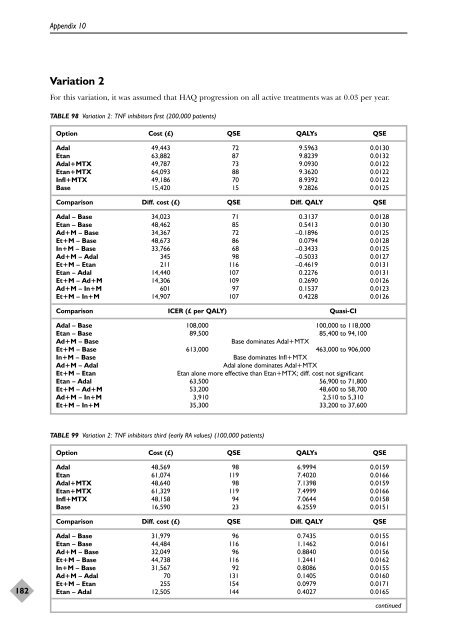
Variation 2<br />
For this variation, it was assumed that HAQ progression on all active treatments was at 0.03 per year.<br />
TABLE 98 Variation 2: TNF inhibitors first (200,000 patients)<br />
Option Cost (£) QSE QALYs QSE<br />
Adal 49,443 72 9.5963 0.0130<br />
Etan 63,882 87 9.8239 0.0132<br />
Adal+MTX 49,787 73 9.0930 0.0122<br />
Etan+MTX 64,093 88 9.3620 0.0122<br />
Infl+MTX 49,186 70 8.9392 0.0122<br />
Base 15,420 15 9.2826 0.0125<br />
Comparison Diff. cost (£) QSE Diff. QALY QSE<br />
Adal – Base 34,023 71 0.3137 0.0128<br />
Etan – Base 48,462 85 0.5413 0.0130<br />
Ad+M – Base 34,367 72 –0.1896 0.0125<br />
Et+M – Base 48,673 86 0.0794 0.0128<br />
In+M – Base 33,766 68 –0.3433 0.0125<br />
Ad+M – Adal 345 98 –0.5033 0.0127<br />
Et+M – Etan 211 116 –0.4619 0.0131<br />
Etan – Adal 14,440 107 0.2276 0.0131<br />
Et+M – Ad+M 14,306 109 0.2690 0.0126<br />
Ad+M – In+M 601 97 0.1537 0.0123<br />
Et+M – In+M 14,907 107 0.4228 0.0126<br />
Comparison ICER (£ per QALY) Quasi-CI<br />
Adal – Base 108,000 100,000 to 118,000<br />
Etan – Base 89,500 85,400 to 94,100<br />
Ad+M – Base Base dominates Adal+MTX<br />
Et+M – Base 613,000 463,000 to 906,000<br />
In+M – Base Base dominates Infl+MTX<br />
Ad+M – Adal Adal alone dominates Adal+MTX<br />
Et+M – Etan Etan alone more effective than Etan+MTX; diff. cost not significant<br />
Etan – Adal 63,500 56,900 to 71,800<br />
Et+M – Ad+M 53,200 48,600 to 58,700<br />
Ad+M – In+M 3,910 2,510 to 5,310<br />
Et+M – In+M 35,300 33,200 to 37,600<br />
TABLE 99 Variation 2: TNF inhibitors third (early RA values) (100,000 patients)<br />
Option Cost (£) QSE QALYs QSE<br />
Adal 48,569 98 6.9994 0.0159<br />
Etan 61,074 119 7.4020 0.0166<br />
Adal+MTX 48,640 98 7.1398 0.0159<br />
Etan+MTX 61,329 119 7.4999 0.0166<br />
Infl+MTX 48,158 94 7.0644 0.0158<br />
Base 16,590 23 6.2559 0.0151<br />
Comparison Diff. cost (£) QSE Diff. QALY QSE<br />
Adal – Base 31,979 96 0.7435 0.0155<br />
Etan – Base 44,484 116 1.1462 0.0161<br />
Ad+M – Base 32,049 96 0.8840 0.0156<br />
Et+M – Base 44,738 116 1.2441 0.0162<br />
In+M – Base 31,567 92 0.8086 0.0155<br />
Ad+M – Adal 70 131 0.1405 0.0160<br />
Et+M – Etan 255 154 0.0979 0.0171<br />
Etan – Adal 12,505 144 0.4027 0.0165<br />
continued


