

A systematic review of the effectiveness of adalimumab
A systematic review of the effectiveness of adalimumab
A systematic review of the effectiveness of adalimumab

Create successful ePaper yourself
Turn your PDF publications into a flip-book with our unique Google optimized e-Paper software.
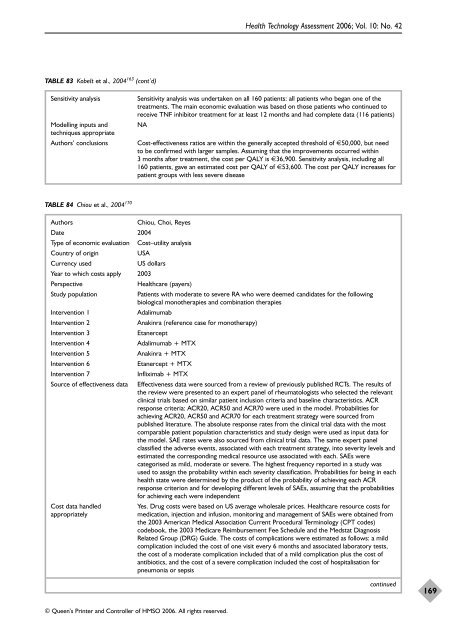
TABLE 83 Kobelt et al., 2004 163 (cont’d)<br />
© Queen’s Printer and Controller <strong>of</strong> HMSO 2006. All rights reserved.<br />
Health Technology Assessment 2006; Vol. 10: No. 42<br />
Sensitivity analysis Sensitivity analysis was undertaken on all 160 patients: all patients who began one <strong>of</strong> <strong>the</strong><br />
treatments. The main economic evaluation was based on those patients who continued to<br />
receive TNF inhibitor treatment for at least 12 months and had complete data (116 patients)<br />
Modelling inputs and NA<br />
techniques appropriate<br />
Authors’ conclusions Cost-<strong>effectiveness</strong> ratios are within <strong>the</strong> generally accepted threshold <strong>of</strong> €50,000, but need<br />
to be confirmed with larger samples. Assuming that <strong>the</strong> improvements occurred within<br />
3 months after treatment, <strong>the</strong> cost per QALY is €36,900. Sensitivity analysis, including all<br />
160 patients, gave an estimated cost per QALY <strong>of</strong> €53,600. The cost per QALY increases for<br />
patient groups with less severe disease<br />
TABLE 84 Chiou et al., 2004 170<br />
Authors Chiou, Choi, Reyes<br />
Date 2004<br />
Type <strong>of</strong> economic evaluation Cost–utility analysis<br />
Country <strong>of</strong> origin USA<br />
Currency used US dollars<br />
Year to which costs apply 2003<br />
Perspective Healthcare (payers)<br />
Study population Patients with moderate to severe RA who were deemed candidates for <strong>the</strong> following<br />
biological mono<strong>the</strong>rapies and combination <strong>the</strong>rapies<br />
Intervention 1 Adalimumab<br />
Intervention 2 Anakinra (reference case for mono<strong>the</strong>rapy)<br />
Intervention 3 Etanercept<br />
Intervention 4 Adalimumab + MTX<br />
Intervention 5 Anakinra + MTX<br />
Intervention 6 Etanercept + MTX<br />
Intervention 7 Infliximab + MTX<br />
Source <strong>of</strong> <strong>effectiveness</strong> data Effectiveness data were sourced from a <strong>review</strong> <strong>of</strong> previously published RCTs. The results <strong>of</strong><br />
<strong>the</strong> <strong>review</strong> were presented to an expert panel <strong>of</strong> rheumatologists who selected <strong>the</strong> relevant<br />
clinical trials based on similar patient inclusion criteria and baseline characteristics. ACR<br />
response criteria: ACR20, ACR50 and ACR70 were used in <strong>the</strong> model. Probabilities for<br />
achieving ACR20, ACR50 and ACR70 for each treatment strategy were sourced from<br />
published literature. The absolute response rates from <strong>the</strong> clinical trial data with <strong>the</strong> most<br />
comparable patient population characteristics and study design were used as input data for<br />
<strong>the</strong> model. SAE rates were also sourced from clinical trial data. The same expert panel<br />
classified <strong>the</strong> adverse events, associated with each treatment strategy, into severity levels and<br />
estimated <strong>the</strong> corresponding medical resource use associated with each. SAEs were<br />
categorised as mild, moderate or severe. The highest frequency reported in a study was<br />
used to assign <strong>the</strong> probability within each severity classification. Probabilities for being in each<br />
health state were determined by <strong>the</strong> product <strong>of</strong> <strong>the</strong> probability <strong>of</strong> achieving each ACR<br />
response criterion and for developing different levels <strong>of</strong> SAEs, assuming that <strong>the</strong> probabilities<br />
for achieving each were independent<br />
Cost data handled Yes. Drug costs were based on US average wholesale prices. Healthcare resource costs for<br />
appropriately medication, injection and infusion, monitoring and management <strong>of</strong> SAEs were obtained from<br />
<strong>the</strong> 2003 American Medical Association Current Procedural Terminology (CPT codes)<br />
codebook, <strong>the</strong> 2003 Medicare Reimbursement Fee Schedule and <strong>the</strong> Medstat Diagnosis<br />
Related Group (DRG) Guide. The costs <strong>of</strong> complications were estimated as follows: a mild<br />
complication included <strong>the</strong> cost <strong>of</strong> one visit every 6 months and associated laboratory tests,<br />
<strong>the</strong> cost <strong>of</strong> a moderate complication included that <strong>of</strong> a mild complication plus <strong>the</strong> cost <strong>of</strong><br />
antibiotics, and <strong>the</strong> cost <strong>of</strong> a severe complication included <strong>the</strong> cost <strong>of</strong> hospitalisation for<br />
pneumonia or sepsis<br />
continued<br />
169


