

A systematic review of the effectiveness of adalimumab
A systematic review of the effectiveness of adalimumab
A systematic review of the effectiveness of adalimumab

Create successful ePaper yourself
Turn your PDF publications into a flip-book with our unique Google optimized e-Paper software.
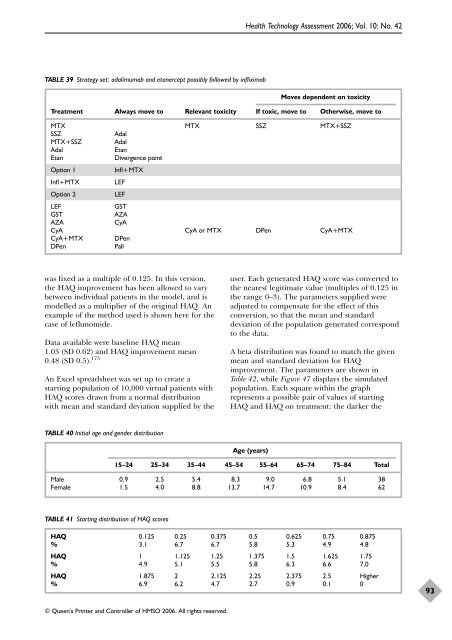
TABLE 39 Strategy set: <strong>adalimumab</strong> and etanercept possibly followed by infliximab<br />
was fixed as a multiple <strong>of</strong> 0.125. In this version,<br />
<strong>the</strong> HAQ improvement has been allowed to vary<br />
between individual patients in <strong>the</strong> model, and is<br />
modelled as a multiplier <strong>of</strong> <strong>the</strong> original HAQ. An<br />
example <strong>of</strong> <strong>the</strong> method used is shown here for <strong>the</strong><br />
case <strong>of</strong> leflunomide.<br />
Data available were baseline HAQ mean<br />
1.03 (SD 0.62) and HAQ improvement mean<br />
0.48 (SD 0.5). 173<br />
An Excel spreadsheet was set up to create a<br />
starting population <strong>of</strong> 10,000 virtual patients with<br />
HAQ scores drawn from a normal distribution<br />
with mean and standard deviation supplied by <strong>the</strong><br />
TABLE 40 Initial age and gender distribution<br />
© Queen’s Printer and Controller <strong>of</strong> HMSO 2006. All rights reserved.<br />
Health Technology Assessment 2006; Vol. 10: No. 42<br />
user. Each generated HAQ score was converted to<br />
<strong>the</strong> nearest legitimate value (multiples <strong>of</strong> 0.125 in<br />
<strong>the</strong> range 0–3). The parameters supplied were<br />
adjusted to compensate for <strong>the</strong> effect <strong>of</strong> this<br />
conversion, so that <strong>the</strong> mean and standard<br />
deviation <strong>of</strong> <strong>the</strong> population generated correspond<br />
to <strong>the</strong> data.<br />
A beta distribution was found to match <strong>the</strong> given<br />
mean and standard deviation for HAQ<br />
improvement. The parameters are shown in<br />
Table 42, while Figure 47 displays <strong>the</strong> simulated<br />
population. Each square within <strong>the</strong> graph<br />
represents a possible pair <strong>of</strong> values <strong>of</strong> starting<br />
HAQ and HAQ on treatment: <strong>the</strong> darker <strong>the</strong><br />
Age (years)<br />
15–24 25–34 35–44 45–54 55–64 65–74 75–84 Total<br />
Male 0.9 2.5 5.4 8.3 9.0 6.8 5.1 38<br />
Female 1.5 4.0 8.8 13.7 14.7 10.9 8.4 62<br />
TABLE 41 Starting distribution <strong>of</strong> HAQ scores<br />
Moves dependent on toxicity<br />
Treatment Always move to Relevant toxicity If toxic, move to O<strong>the</strong>rwise, move to<br />
MTX MTX SSZ MTX+SSZ<br />
SSZ Adal<br />
MTX+SSZ Adal<br />
Adal Etan<br />
Etan Divergence point<br />
Option 1 Infl+MTX<br />
Infl+MTX LEF<br />
Option 2 LEF<br />
LEF GST<br />
GST AZA<br />
AZA CyA<br />
CyA CyA or MTX DPen CyA+MTX<br />
CyA+MTX DPen<br />
DPen Pall<br />
HAQ 0.125 0.25 0.375 0.5 0.625 0.75 0.875<br />
% 3.1 6.7 6.7 5.8 5.3 4.9 4.8<br />
HAQ 1 1.125 1.25 1.375 1.5 1.625 1.75<br />
% 4.9 5.1 5.5 5.8 6.3 6.6 7.0<br />
HAQ 1.875 2 2.125 2.25 2.375 2.5 Higher<br />
% 6.9 6.2 4.7 2.7 0.9 0.1 0<br />
93


