reprint - Quantum Materials Group
reprint - Quantum Materials Group
reprint - Quantum Materials Group

Create successful ePaper yourself
Turn your PDF publications into a flip-book with our unique Google optimized e-Paper software.
eprint
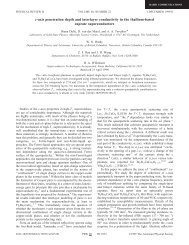
Phys. Status Solidi B 250, No. 3, 511–514 (2013) / DOI 10.1002/pssb.201200761<br />
Part of Special Issue on<br />
<strong>Quantum</strong> Criticality and Novel Phases<br />
High pressure electrical resistivity<br />
and specific heat of the heavy fermion<br />
compound CeCoGe2.2Si0.8<br />
J. Larrea J. *,1,<br />
J. Teyssier 2<br />
,H.M.Rfnnow 3<br />
, K.-A. Lorenzer 1<br />
, and S. Paschen 1<br />
1 Institute of Solid State Physics, Vienna University of Technology, Wiedner Haupst. 8–10, 1040 Vienna, Austria<br />
2 Département de Physique de la Matière Condensée, Université de Genève, Quai Ernest-Ansermet 24, 1211 Genève 4 Switzerland<br />
3 Laboratory for <strong>Quantum</strong> Magnetism, École Polytechnique Fédérale de Lausanne, 1015 Lausanne, Switzerland<br />
Received 27 September 2012, revised 7 December 2012, accepted 19 December 2012<br />
Published online 20 February 2013<br />
Keywords disorder, heavy fermions, high pressure, quantum phase transitions, specific heat<br />
* Corresponding author: e-mail larrea@ifp.tuwien.ac.at, Phone: þ43-1-58801-13126, Fax: þ43-1-58801-13899<br />
We study the evolution of the magnetic ground state close to the<br />
putative quantum critical point in CeCoGe 2.2Si 0.8 by using<br />
electrical resistivity and specific heat measurements under<br />
the same high hydrostatic pressure conditions. The electrical<br />
resistivity shows that the antiferromagnetic ordering temperature,<br />
T N, is suppressed above P C ¼ 5.9 kbar, with the<br />
emergence of non-Fermi liquid behavior. On the other hand,<br />
1 Introduction Investigations of the role that disorder<br />
plays in strongly correlated electron materials close to a<br />
quantum critical point (QCP) have awaken a lot of interest<br />
during the last decade [1–4]. An open issue [5] is to<br />
understand how for systems with translational invariant<br />
symmetry disorder changes the universal quantum criticality<br />
and the low-lying energy scales that emerge in the vicinity of<br />
the phase transition at T ¼ 0 K. The pseudo-ternary heavy<br />
fermion (HF) system CeCoGe3–xSix [6] with tetragonal<br />
BaNiSn3-type structure and antiferromagnetic (AF) order<br />
between 0.5 < x 1 has been claimed to be dominated by the<br />
disordered Griffiths phase at its doping-induced QCP [7]. A<br />
recent investigation using electrical resistivity, r(T), under<br />
hydrostatic high pressure, P, on the AF HF compound x ¼ 0.9<br />
[8] has revealed that the P-tuned QCP (PC ¼ 6.2 kbar) is<br />
dominated by different effects on both sides of the QCP: on<br />
the magnetic side spin fluctuations govern the criticality,<br />
while on the non-magnetic side the criticality is dominated<br />
by disorder that quenches the spin fluctuations. More<br />
recently, we have performed DC-magnetic susceptibility,<br />
x(T), measurements under high P on a sample with x ¼ 0.8<br />
[9], a composition close to that reported in previous r(T)<br />
measurements. Our results suggested that a spin glass-like<br />
physica<br />
p s s<br />
www.pss-b.com<br />
status<br />
solidi<br />
basic solid state physics<br />
the specific heat shows two different magnetic transitions at<br />
0 kbar, one at T N and another one at T l 0.3 K. Both transition<br />
temperatures are reduced by pressure but remain finite up to at<br />
least 7.2 kbar. The height of the specific heat anomaly at TN,<br />
DCN, is strongly reduced above PC. These features suggest that<br />
the quantum criticality in CeCoGe 2.2Si 0.8 is governed by<br />
disorder.<br />
b<br />
ß 2013 WILEY-VCH Verlag GmbH & Co. KGaA, Weinheim<br />
magnetic state emerges in a wide range of pressure around<br />
the putative QCP at P C. However, since our x(T) measurements<br />
were only performed down to 2 K, we could not<br />
conclude on the presence and nature of disorder-induced<br />
quantum criticality [10]. Here, we present a study of the<br />
pressure–temperature phase diagram of CeCoGe2.2Si0.8 by<br />
using r(T) and specific heat, C(T), measurements for the same<br />
bulk material and under the same hydrostatic high pressure<br />
conditions. Our aim is to investigate how the AF order<br />
evolves under P and elucidate which mechanism accounts<br />
for the pressure-tuned quantum criticality in CeCoGe3–xSix.<br />
2 Experimental Polycrystalline CeCoGe 2.2Si 0.8 samples<br />
were prepared as described in Ref. [6]. Powder X-ray<br />
diffraction and energy dispersive X-ray spectroscopy (EDX)<br />
in a scanning electron microscope did not reveal any<br />
secondary phases. The r(T) and C(T) experiments were<br />
performed in a CuBe piston-cylinder pressure cell for P<br />
up to 8 kbar, with kerosene as pressure transmitting medium<br />
and Pb as in-situ manometer. All electrical contacts were<br />
spot welded onto the same piece of sample with dimensions<br />
1.6 mm 1.8 mm 0.18 mm. The conventional four-probe<br />
AC method was used to measure r(T), while for C(T)anAC<br />
ß 2013 WILEY-VCH Verlag GmbH & Co. KGaA, Weinheim
physica<br />
p status<br />
s<br />
solidi<br />
s<br />
b<br />
512 J. Larrea J. et al.: High pressure specific heat of the heavy fermion compound CeCoGe 2.2Si 0.8<br />
calorimetry method was used. For the latter, an oscillating<br />
excitation current with a frequency v ¼ 28 Hz and intensity<br />
of I ¼ 0.5 mA (0.2 mA below 2 K) was applied to the sample<br />
heater. The sample temperature was corrected for a DC offset<br />
due to Joule heating by separately measuring the temperature<br />
signal with a DC nanovoltemeter. The P-cell was inserted<br />
into a 3 He– 4 He dilution refrigerator to measure both r(T) and<br />
C(T) down to 0.05 K. For comparison, we also measured the<br />
specific heat at ambient pressure in a physical property<br />
measurement system (PPMS) of <strong>Quantum</strong> Design.<br />
3 Results and discussion<br />
3.1 Electrical resistivity Figure 1 shows r(T) at<br />
different selected pressures. At ambient pressure<br />
(P ¼ 0 kbar) a clear kink is observed at T r<br />
which we ascribe<br />
to the onset of magnetic, likely AF, order. We estimated the<br />
position of T r<br />
N as the minimum in d2r=dT 2 , which is shown<br />
for 5.3 kbar in Fig. 2a. As pressure increases the kink (red<br />
arrows in Fig. 1) is broadened and shifted to lower<br />
temperatures up to P ¼ 5.3 kbar. No signal of magnetic<br />
order can be seen at P ¼ 7.2 kbar, neither as a kink in r(T) nor<br />
as a minimum of d 2 r=dT2 . We fit the data for all pressures<br />
to Dr ¼ r(T)–r0 ¼ AT n , where r0 is the residual resistivity<br />
(Fig. 4b). The fit at P ¼ 7.2 kbar reveals two different<br />
values of n in different T-ranges. For the lowest T up to<br />
the coherence temperature Tcoh 0.6 K, n ¼ 2 indicating<br />
Landau Fermi liquid (FL) behavior. n ¼ 1.1(1), a fingerprint<br />
of non-Fermi liquid (NFL) behavior is seen, from 0.7 K<br />
to more than 10 K. This suggests that a putative QCP<br />
exists between 5.3 and 7.2 kbar. We tentatively estimate its<br />
critical pressure PC by fitting T r<br />
NðPÞ with the mean-field<br />
expression T r<br />
N ¼ CP j PCj<br />
0:5 , giving PC ¼ 5.9( þ1:2<br />
0:5 ) kbar<br />
(see Fig. 5). The error bar represents the spacing of<br />
the pressure points. Similar NFL behavior was previously<br />
reported for the P-tuned QCP in CeCoGe2.1Si0.9 [8].<br />
N<br />
a) b)<br />
Figure 1 (online color at: www.pss-b.com) T-variation of the<br />
electrical resistivity of CeCoGe2.2Si0.8 at different selected<br />
pressures. (a) for P < 3 kbar and (b) for P > 3 kbar. For better<br />
visibility the curves at 1.8, 2.8, 4.3, 5.3, and 7.2 kbar are<br />
shifted by 40, 22, þ14, þ16, and þ9 mVcm, respectively.<br />
Red arrows indicate T r<br />
as the temperature where the second<br />
N<br />
derivative d 2 r=dT2 has a minimum. DrN is the resistivity change<br />
(see text).<br />
up to T r<br />
N<br />
b)<br />
We note that the resistivity changes up to the magnetic<br />
transition DrN ¼ rðT r<br />
NÞ r0, or its relative value DrN=r0 (Fig. 4b) decreases gradually with increasing pressure up to<br />
3.2 kbar but much more sharply beyond, reflecting the<br />
ðPÞ (Fig. 5).<br />
behavior of T r<br />
N<br />
3.2 Specific heat The specific heat measured in the<br />
pressure cell at P ¼ 0 kbar agrees with the one measured<br />
in a PPMS (Fig. 3a) if scaled by a factor 1.2. Since the<br />
relevant parameters in the heat dissipation equation of<br />
our AC-calorimeter have negligible P-dependence below<br />
10 kbar [11], we may rely on the absolute values of the AC<br />
specific heat (multiplied by 1.2) for all P.<br />
Figure 3b shows the T-dependence of the specific heat<br />
at different selected pressures. At 0 kbar, two different<br />
anomalies in C(T) can be distinguished at T C N<br />
a)<br />
Figure 2 (online color at: www.pss-b.com) (a) T-variation of<br />
the electrical resistivity, r(T) (left), and the second derivative,<br />
d 2 r=dT 2 (right), at 5.3 kbar. The dotted arrow indicates the<br />
temperature where d 2 r=dT 2 has a minimum. It is associated with<br />
the onset of magnetic order. (b) r plotted versus T 2 (lower axis) and<br />
versus T 1.1 (upper axis) for P ¼ 7.2 kbar. Red straight lines indicate<br />
FL behavior up to the coherence temperature, Tcoh and n ¼ 1.1(1)<br />
NFL behavior, respectively.<br />
¼ 3.5 K and<br />
Tl ¼ 0.3 K. For all pressures, T C N and Tl are determined as<br />
the temperature where C(T)/T has a maximum (Fig. 3c).<br />
These two different anomalies can be associated with<br />
two different magnetic transitions. The transition at T C N<br />
is consistent with the onset of AF order observed also<br />
in r(T). Recent ambient pressure work on CeCoGe 3 single<br />
crystals revealed multiple-step magnetic transitions at 20,<br />
11.5, and 7.5 K [12]. Neutron diffraction studies revealed<br />
a strong anisotropy, with the magnetic moments pointing<br />
ß 2013 WILEY-VCH Verlag GmbH & Co. KGaA, Weinheim www.pss-b.com
Phys. Status Solidi B 250, No. 3 (2013) 513<br />
a)<br />
b)<br />
c)<br />
Figure 3 (online color at: www.pss-b.com) (a) T-variation of<br />
the specific heat, C, of CeCoGe2.2Si0.8 at 0 kbar measured by our<br />
AC-calorimeter (AC-C p) and by PPMS. The AC-C p curves are<br />
multiplied by 1.2 for all P. The two different anomalies seen at<br />
T C N and T l are ascribed to two different magnetic transitions.<br />
The blue and black dotted lines are baselines that delimit the<br />
temperature range of the anomalies below 6 K. (b) T-variation<br />
of C at different pressures. (c) Specific heat divided by<br />
temperature, C/T, at different pressures. The inset shows the<br />
anomalies at T C N and Tl at 0 kbar after the subtraction of the<br />
baseline shown in (a), where DC N and DC l are the heights of<br />
the anomalies at TN and Tl, respectively. For all figures arrows<br />
are placed at the temperatures where the C/T anomalies have a<br />
maximum.<br />
along the tetragonal c-axis [13]. However, the ground state<br />
magnetic structure is still unknown. Thus, we cannot infer<br />
which type of magnetic order sets in below Tl in our<br />
compound. We will see that Tl is virtually unaffected by<br />
pressures, around PC so the discussion hereafter will focus<br />
only on the transition seen at T C N .<br />
Both T C N ðPÞ and T l (P) are plotted in Fig. 5. Above<br />
3.2 kbar their behavior differs sizably from T r<br />
N ðPÞ: TC N first<br />
decreases sizably but levels out above 4.3 kbar. Tl decreases<br />
weakly and continuously with pressure and clearly remains<br />
finite at PC. In addition, no indication of NFL behavior in<br />
weakly disordered systems (/ log T or / T a ) can be<br />
discerned in C/T at any pressure (Fig. 3c).<br />
The inset of Fig. 3c shows DCN and DCl for 0 kbar, the<br />
height of the anomalies in C(T) atT C N and Tl, respectively.<br />
For all P, these quantities were estimated subtracting a<br />
base line around the anomalies (as shown in Fig. 3a). The<br />
P-dependences of DC N and DC l are plotted in Fig. 4a.<br />
Original<br />
Paper<br />
Figure 4 (online color at: www.pss-b.com) (a) P-variation of<br />
the heights DC N and DC l of the anomalies at T N and T l, respectively.<br />
(b) P-variation of the residual resistivity, r0, estimated as an<br />
extrapolation of r ¼ r 0 þ AT n to 0 K and of Dr N/r 0 (see text). The<br />
dotted lines separate pressure ranges with likely different magnetic<br />
correlations. The dashed lines are guides to the eye.<br />
The magnetic contribution to the specific heat, DC m,<br />
and the corresponding entropy, DS m ¼ R ðDCm=TÞdT,<br />
contain information on the change of magnetic degrees of<br />
freedom when going from a magnetically ordered to a<br />
disordered phase. For CeCoGe3–xSix the phonon contribution<br />
to the specific heat is T and P-independent below<br />
8 K and 12 kbar, respectively [6, 9]. Thus, DCm for the two<br />
different magnetic transitions approximately equals DCN,l.<br />
The most interesting features seen in Fig. 4a appear for<br />
p > 3.2 kbar. DCN is drastically reduced with increasing<br />
P by almost 90% at 5.3 kbar and remains constant at<br />
higher P while DC l decreases much more gradually with<br />
increasing P. In principle, at a QCP both T m and DS m<br />
should vanish. This also implies DC m ! 0. However, we<br />
observe that DCN;l 6¼ 0 even above PC, implying that the<br />
magnetic correlations are not completely extinguished by<br />
the magnetic instability at PC. This is a typical feature of a<br />
quantum phase transition dominated by disorder [2].<br />
Another puzzling result is the P-dependence of r0<br />
(Fig. 4b). A pronounced increase of r0 around 2.2 kbar<br />
is observed. Beyond that, r0 is drastically reduced up to<br />
3.2 kbar and remains almost constant for higher P. In many<br />
weakly disordered systems, a pronounced increase of r 0 is<br />
produced around the QCP by the enhancement of the critical<br />
www.pss-b.com ß 2013 WILEY-VCH Verlag GmbH & Co. KGaA, Weinheim<br />
a)<br />
b)
physica<br />
p status<br />
s<br />
solidi<br />
s<br />
b<br />
514 J. Larrea J. et al.: High pressure specific heat of the heavy fermion compound CeCoGe 2.2Si 0.8<br />
Figure 5 (online color at: www.pss-b.com) (a) Temperature–<br />
pressure phase diagram of CeCoGe2.2Si0.8 obtained by electrical<br />
resistivity and specific heat experiments. Previous magnetic<br />
susceptibility measurements are also included [9]. Down and<br />
up triangle symbols represent the antiferromagnetic (AF) and<br />
the spin glass-like behavior (SG) regimes. The tilted triangles<br />
symbols separate the AF and SG regimes and represent an intermediate<br />
regime where the magnetic susceptibility shows a nonmonotonic<br />
change with pressure. Lines are guide to the eye,<br />
except for the red dashed line above 2.8 kbar, which is a fit<br />
using the mean field expression TN ¼ 1.18jP PCj 0.5 , with<br />
P C ¼ 5.9 kbar.<br />
spin (or valence) fluctuations. However, this mechanism<br />
cannot explain the pronounced increase of r0(P) here, since<br />
it occurs at P well below PC. Instead, we speculate that the<br />
maximum in r0(P) is due to the suppression of long range<br />
magnetic order (LRO) at 2.2 kbar. The phase transition<br />
signatures we observe in r(T) and C(T) between 2.2 and<br />
5.9 kbar would then be due to short range order (SRO), as<br />
indicated in Figs. 4 and 5. Above P C, clusters with magnetic<br />
correlations embedded in a paramagnetic, or a spin glass<br />
(SG) phase [2, 4], could explain the finite DC m values<br />
observed. These DCm remnants might cover underlying<br />
NFL signatures in the specific heat.<br />
4 Conclusions We have investigated the evolution of<br />
the magnetic state of the HF compound CeCoGe2.2Si0.8 with<br />
pressure by using electrical resistivity and specific heat<br />
measurements. The data suggest that three regimes of<br />
pressures with different magnetic correlations exist. AF<br />
LRO, AF SRO, and a phase with either magnetic cluster or<br />
spin glass behavior. The AF SRO disappears at a putative<br />
quantum phase transition at PC 5.9 kbar. In this vicinity,<br />
NFL behavior is seen in r(T).<br />
Acknowledgements Financial support by the European<br />
Research Council (ERC Advanced Grant No. 227378) is gratefully<br />
acknowledged.<br />
References<br />
[1] M. T. Tran and K. S. Kim, J. Phys.: Condens. Matter 23,<br />
425602 (2011).<br />
[2] T. Vojta, C. Kotabage, and J. Hoyos, Phy. Rev. B 79, 024401<br />
(2009).<br />
[3] S. Sasaki, A. Ohnishi, T. Kikuchi, M. Kitaura, K.-S. Kim, and<br />
H.-J. Kim, Phy. Rev. B 82, 224416 (2010).<br />
[4] S. G. Magalhaes, F. M. Zimmer, and B. Coqblin, Phys. Rev. B<br />
81, 094424 (2010).<br />
[5] S. Sachdev, <strong>Quantum</strong> Phase Transitions (Cambridge University<br />
Press, Cambridge, 2008).<br />
[6] D. Eom, M. Ishikawa, J. Kitagawa, and N. Takeda, J. Phys.<br />
Soc. Jpn. 67, 2495 (1998).<br />
[7] V. V. Krishnamurthy, K. Nagamine, I. Watanabe, K. Nishiyama,<br />
S. Ohira, M. Ishikawa, D. H. Eom, T. Ishikawa, and T. M.<br />
Briere, Phys. Rev. Lett. 88, 046402 (2002).<br />
[8] M. Alzamora, M. Fontes, J. J. Larrea, H. A. Borges, E. M.<br />
Baggio-Saitovitch, and S. N. Medeiros, Phys. Rev. B 76,<br />
125106 (2007).<br />
[9] J. Larrea, J. Teyssier, H. Ronnow, M. Müller, and S. Paschen,<br />
J. Phys. Conf. Ser. 391, 012034 (2012).<br />
[10] A. H. Castro Neto, G. Castilla, and B. A. Jones, Phys. Rev.<br />
Lett. 81, 3531 (1998).<br />
[11] E. S. Choi, H. Kang, Y. J. Jo, and W. Kang, Rev. Sci. Instrum.<br />
73, 2999 (2002).<br />
[12] A. Thamizhavel, T. Takeuchi, T. Matsuda, Y. Haga,<br />
K. Sugiyama, R. Settai, and Y. Onuki, J. Phys. Soc. Jpn.<br />
74, 1858 (2005).<br />
[13] K. Kaneko, N. Metoki, T. Takeuchi, T. Matsuda, Y. Haga,<br />
A. Thamizhavel, R. Settai, and Y. Onuki, J. Phys. Conf. Ser.<br />
150, 042082 (2009).<br />
ß 2013 WILEY-VCH Verlag GmbH & Co. KGaA, Weinheim www.pss-b.com